
An Efficient Optimization Approach for Designing Machine Models Based on Combined Algorithm

1
Department of Management Science and Information Systems, Spears College of Business, Oklahoma State University, Stillwater, OK 74075, USA
2
Division of Business Services, University of Wisconsin-Madison, Madison, WI 53703, USA
*
Author to whom correspondence should be addressed.
FinTech 2024, 3(1), 40-54; https://doi.org/10.3390/fintech3010003
Submission received: 22 October 2023
/
Revised: 1 December 2023
/
Accepted: 27 December 2023
/
Published: 29 December 2023
Abstract
:Many intrusion detection algorithms that use optimization have been developed and are commonly used to detect intrusions. The process of selecting features and the parameters of the classifier are essential parts of how well an intrusion detection system works. This paper provides a detailed explanation and discussion of an improved intrusion detection method for multiclass classification. The proposed solution uses a combination of the modified teaching–learning-based optimization (MTLBO) algorithm, the modified JAYA (MJAYA) algorithm, and a support vector machine (SVM). MTLBO is used with supervised machine learning (ML) to select subsets of features. Selection of the fewest features possible without impairing the accuracy of the results in feature subset selection (FSS) is a multiobjective optimization issue. This paper presents MTLBO as a mechanism and investigates its algorithm-specific, parameter-free idea. This study used the modified JAYA (MJAYA) algorithm to optimize the C and gamma parameters of the support vector machine (SVM) classifier. When the proposed MTLBO-MJAYA-SVM algorithm was compared with the original TLBO and JAYA algorithms on a well-known intrusion detection dataset, it was found to outperform them significantly.
JEL Classification:
G2; C8; M151. Introduction
Intrusion detection is a security measure that aims to prevent unauthorized access, misuse of data, and damage to network resources by both internal users and external attackers. Intrusion detection systems (IDSs) are one of the key components of a security infrastructure and are widely used by organizations of all sizes. IDSs use hardware and software models and patterns to automate the process of monitoring network events and detecting security threats.
The financial technology (fintech) industry is increasingly reliant on sophisticated intrusion detection systems (IDSs) to protect against cyberattacks and fraud. Traditional IDS algorithms often face challenges in accurately classifying intrusions due to the complex and ever-evolving nature of cyber threats. The proposed MTLBO-MJAYA-SVM algorithm addresses these challenges by combining the strengths of two optimization algorithms, the modified teaching–learning-based optimization (MTLBO) algorithm and the modified JAYA (MJAYA) algorithm, with a support vector machine (SVM) classifier.
This article discusses how the proposed MTLBO-MJAYA-SVM algorithm can be used to improve the accuracy and efficiency of intrusion detection systems (IDSs), which are essential for protecting financial systems from cyberattacks.
Data mining can be employed for intrusion detection, aiming to discover and establish relationships among primary observations and predict observations based on obtained patterns [1]. This intrusion detection method comprises four main steps: collecting data from the network using monitoring system sensors, transforming raw data into a format suitable for data mining models, creating a data mining model, and analyzing the results [2]. Two common methods of data mining are unsupervised and supervised. In the unsupervised method, the answer is discovered, while in the supervised method, the answer is known, and predictions for future observations must be made [3]. This paper utilizes data mining with supervised algorithms for intrusion detection.
After collecting network data, various data mining models are applied to analyze the data and identify patterns. These patterns are then used to create a training set. Then, the accuracy of this model is evaluated with a test set. Several classification methods have been proposed, among which K-nearest neighbor [4], decision tree [5], and support vector machine (SVM) [6,7] can be mentioned.
In this research, standard data sets are used in the field of intrusion detection, namely NSL-KDD. Also, the NSL-KDD collection includes 41 features and five different classes to specify the behavior of packets in the network, which include a normal class and four penetration classes, including DOS, U2R, R2L, and Prob attacks [8].
In this study, intrusion detection is performed using a support vector machine with the assistance of previously collected data. To identify effective features in intrusion detection, a type of metaheuristic algorithm named TLBO was used in combination with the JAYA algorithm, which is the creator of both algorithms, Rao et al., in 2011 and 2016, respectively [9]. The JAYA principle is to find a solution to a problem by gravitating toward the best outcome and avoiding the worst.
To optimize the feature selection process and adjust SVM parameters, this study introduces a modified TLBO algorithm for subset feature selection. The suggested algorithm is denoted by the acronym MTLBO-MJAYA-SVM. Figure 1 shows a typical feature selection problem.
Previous research has demonstrated that the modified teaching–learning-based optimization (MTLBO) [10] and modified JAYA (MJAYA) algorithms outperform other algorithms in feature selection. So, the originality of this study is that no one has yet investigated how these two algorithms perform when combined and modified for intrusion detection. This study is the first to do so, and this is one of the contributions of this paper. SVM parameter modification [11] will be conducted based on a combination of the two mentioned algorithms to take advantage of parallel processing and accelerate parameter modification. Therefore, the objective of this study is to minimize the number of features and simultaneously maximize detection accuracy.
2. Corresponding Work
To differentiate between normal network access and assaults, a combination of different machine learning approaches and optimization algorithms has been created and deployed in intrusion detection systems (IDSs) [4]. Most solutions that mix machine learning and optimization algorithms outperform traditional classification techniques. Numerous academics have also proposed IDSs based on machine learning and optimization [5].
Wang et al. [6] introduced a combination of maximal information entropy (MIE) and the maximal information coefficient (MIC) to increase classification accuracy. They used UCI datasets to validate their presented method.
Aljanabi et al. [7] tried to improve the TLBO algorithm in parallel with JAYA and SVM classifiers. They concluded that their improved algorithm, i.e., ITLBO in combination with IPJAYA, could reduce execution time.
Bamakan et al. [8] proposed using chaos particle swarm optimization to generate a new machine learning IDS based on two standard classifiers: multiple criteria linear programming and a support vector machine.
As security infrastructure becomes increasingly dependent on big data, intrusion detection has become a hot topic. An IDS uses a variety of machine learning techniques and optimization methods to distinguish between normal network connections and attacks. Examples of existing combinations include fuzzy logic, cuttlefish optimization, K-next neighbor, artificial neural network (ANN), particle swarm method, support vector machine (SVM), and artificial immune system. Hybrid machine learning algorithms, which combine machine learning and optimization techniques, often outperform modern classification techniques. An IDS based on machine learning and optimization has been proposed by other academics as well [5]. According to Louvieris et al. [6], to effectively identify attacks as anomalies even in crowded and contested cyber network environments, a novel mix of techniques was presented (K-means clustering, naive Bayes (NB), Kruskal–Wallis (KW), and C4.5). It was possible to identify statistically important features and relevant feature sets using the NB feature selection and KW test, while the detection of SQL injection remained low because of the inclusion of these two techniques. PCA and Fisher’s discriminant ratio were used to remove low-variance features from the dataset and to remove noise. If the variation described by eigenvectors was large enough, (this strategy) used the most discriminative projections possible to achieve the best results. When the self-organizing process generated several prototypes, the Gaussian was utilized to model them. A single training session was all that was required; nonetheless, this study suffered from a low detection rate. Using chaos particle swarm optimization, Bamakan et al. [8] suggested a new machine learning IDS based on two conventional classifiers: multiple criteria linear programming and support vector machines.
This study also looked at whether the proposed model could be tested with data from the multicommodity futures index (MCX). Rao et al. [12] found that the model was superior to various population-inspired optimization frameworks. As a result, Rao and Patel [13] concluded that this technique can be easily applied to a wide range of optimization applications, regardless of sample size or generation number. For the difficulties mentioned in [9,12], weighted TLBO for global function optimization was employed by Satapathy et al. [14]. Also, multiobjective TLBO was developed by Lin et al. [15].
Teacher selection in TLBO is heavily weighted in favor of the best possible outcome in the problem space, and students are instructed to do nothing more than maximize that outcome. Solution space was sorted to find the best possible options for each problem. A multiobjective TLBO based on a variety of instructional methods was presented by the researchers Xu et al. [16]. As a teaching tool, they used a crossover operator (rather than a scalar function). A new multiobjective algorithm (NTLBO) combined with SVM was proposed by Ismail et al. [17]. The fastest algorithm was a multiobjective TLBO with scalar transformation; however, it had a restricted number of nondominant solutions among the approaches shown. For a nondominated set of solutions, a long execution time is required for a multiobjective TLBO with nondominated selection (MTLBO-NS). While MTLBO-NS creates solutions that are like those of MTLBO-MD, it does so in a substantially shorter period. The performance of the proposed multiobjective TLBO algorithms has been assessed with LR, SVM, and the extreme learning machine (ELM). For the first time, “a computer-vision approach to the diagnosis of alcoholism in healthy controls” was proposed by Wang et al. [18]. This approach relied on three components: the suggested wavelet Renyi entropy, a feed-forward neural network, and the proposed three-segment encoded JAYA algorithm.
A recent study by Migall’on et al. [19] showed that the suggested technique had good sensitivity, but it still must be refined in terms of accuracy. As a result, they came up with a hybrid algorithm that took advantage of parallelism in two distinct ways. Platforms using parallel shared memory at the lower level exploited the upper level, which was exploited by platforms using distributed shared memory. Scalability was a strong suit for both algorithms. Several processes with nearly perfect efficiency were thus effectively integrated into the hybrid algorithm. When tested on 30 unconstrained functions, the method’s efficiency was shown to be near ideal using 60 processes. To improve the performance of the original JAYA algorithm, Gong [20] proposed a “new E-Jaya algorithm”.
Using the average of the best and worst groups, the E-JAYA model proposed to find the best solution and was more precise compared with its original version. Instead of focusing on the best and worst of individual behavior, the E-JAYA considered the collective behavior of the swarm. To evaluate E-performance, JAYA’s 12 benchmark functions of different dimensions were used.
Residential HEMS could benefit from a demand-side management strategy [21]. The system was developed to cut electricity prices by preventing the emergence of peaks in demand. JAYA, SBA, and EDE were all used in this study, as was the TOU pricing scheme for calculating power bills. JAYA was able to reduce the customer’s electricity cost and PAR, which resulted in a satisfied customer. SBA also beat JAYA and EDE in terms of user comfortability, which had a negative correlation to a power bill. Improved JAYA (IJAYA), developed by Yu et al. [22], incorporated a self-adaptive weight for the adjustment of the likelihood of achieving the best solution and avoiding a bad one while searching for a PV model parameter estimation. The weight aided in ensuring that the framework reached the possible search area early and performed a local search afterward. The weight for population diversity, the algorithm included a learning technique derived from the experiences of other people.
Aljanabi et al. [23] investigated the issues, challenges, and needs of intrusion detection systems. They divided detection mechanisms used in IDSs as statistical methods, machine learning (ML), and data mining methods.
Khraisat et al. [24] reviewed the techniques, datasets, and challenges of intrusion detection systems. They concluded that machine learning techniques may have the problem of generating and updating information about new attacks and yield high false alarms or poor accuracy.
Kavak et al. [25] proposed a way forward on how simulations could broaden cyber security efforts. They stated that targeting systems requires overcoming organizations’ defense mechanisms, such as intrusion detection systems (IDSs).
Table 1 summarizes the limitations of feature selection in previous studies.
3. Optimization during FSS Phase
Here, we will talk about how to represent features and how to choose the best subset. An FSS is a subset of features from a bigger set that is selected for use. FSS reduces the number of features in a dataset to speed up classifiers and minimizes the amount of work they must do.
Reference [26] contains a variety of definitions of FSS, the most common of which is that the size of the selected subset is reduced, while prediction accuracy is improved in other definitions. FSS is a process of generating an effective subset of a dataset by deleting redundant and superfluous features. The goal of FSS is to find the smallest possible number of characteristics that have no impact on classification accuracy. A polynomial-time algorithm does not exist for solving FSS because of its complex character and the lack of a polynomial-time technique for solving it [27]. Typical FSS [27] consists of four steps, the first of which is the identification of candidate features for the subsets, followed by the assessment and comparison of these subsets.
In the third phase, if the termination condition is met, the first and second processes will be repeated. As a last step, we determine whether we have arrived at an optimal feature subset by using our prior information.
The optimization problem of this paper can be stated as:
Maximizing (f1 = accuracy of feature selection problem) and minimizing (f2 = number of selected subset features) simultaneously.
Since a decrease in the number of selected features can reduce the accuracy of intrusion detection, there is a need to use metaheuristic algorithms to optimize the problem simultaneously. So, in this research, the MTLBO algorithm was used during the FSS phase. An evolutionary algorithm named teaching–learning-based optimization (TLBO) is modified to solve nonlinear mixed integer optimization problems. The new modified TLBO method (MTLBO) is proposed to upgrade the convergence velocity and accuracy of the original TLBO algorithm using a new mutation operator. In each step, the algorithm mutates vectors by selecting three vectors , , from an initial population as , where is the number of population.
For each target vector , a mutant vector is generated as:
where is the number of vector components. The target vector is mixed with the mutated vector using the following scheme:
That leads to .
To decide whether, in the succeeding iteration, it should become a member of the population or not, the trial vector is compared with the target vector by computation of their objective functions. To solve the single objective problem, the trial vector is compared with the target vector as follow:
where and are the objective functions of the and , respectively. Since the goal of the presented paper is to solve the problem by calculation of more than one objective function, the trial vector is compared with the target vector as follows:
If none of the and vectors dominated each other, then the max–min method is utilized by application of the achieved of the following equation as follows:
where S is the number of objective functions.
4. Results and Discussion
Several SVM settings will be tweaked after selecting the best subset feature. The optimization of SVM parameters is a challenge that has the potential to affect the performance of the algorithm. Kernel function RBF of SVM is used to transform the nonseparable problem into an approximation separable state using RBF’s kernel function. A new feature space is suggested by parameter c in the RBF kernel, whereas parameter C indicates the magnitude of the penalty for classification error in the linear nonseparable scenario.
It is shown in the following equations that gamma is equal to 0. The MJAYA algorithm is used to tune the parameters (C and ) in the following section.
JAYA’s algorithm must be improved. We can see that the best and worst solutions can be sorted into two groups if we divide the population into two categories based on how well they perform in the JAYA algorithm. The best solution group [2] must contain the ideal solution. Based on this discovery, an enhancement in JAYA was made. The flowchart of MJAYA is shown in Figure 2.
Rather than sorting through all the possible answers to find a best-case scenario and a worst-case scenario, alternatives are separated into two categories. Best comes from the best group of solutions, and worst comes from the worst group of solutions, as the best solution from each group is selected as “Best”. This method preserves the population’s diversity and reduces the number of iterations needed to find the ideal solution. The JAYA algorithm is modified to simultaneously optimize two SVM classifier parameters. Following are the specific steps of the MJAYA process:
In step 1, choose how many people will be in the sample and how many design variables there will be. You should also set up the termination condition. We assume the following scenario to understand the parameter optimization: There are three population sizes, two design variables, and two criterion iterations involved. Each parameter C and has three values; hence, the population’s (e) value is the sum of these three values. (The values ranged from 0.001 to 100 for C and from 0.0001 to 64 for , chosen at random). The values of C and are shown in Table 2.
In the second step, the features to select, the C parameter’s value, and the parameter’s value are all that are required for SVM to categorize any labeled data.
In the third phase, the SVM is used to evaluate each value for both C and individually on the first student from Learner Phase 2 after applying crossover and mutation as stated in Table 3. is considered the default in Table 3 and Table 4.
There are two categories (best and worst groups) in Table 4 that represent the best and worst of the population, respectively.
The same process is used for the c parameter, but this time C is the default, and the new value of is 11.006. Accuracy based on γ is demonstrated in Table 5.
In the fourth step, the outcome will be utilized as the objective function for both C and , and this process will be continued until the termination requirement is satisfied. The best and worst groups for γ are shown in Table 6. The C parameter is considered the default in Table 6.
The new values of C and will be compared using the same subset feature as those in Table 7 to see whether they are equivalent.
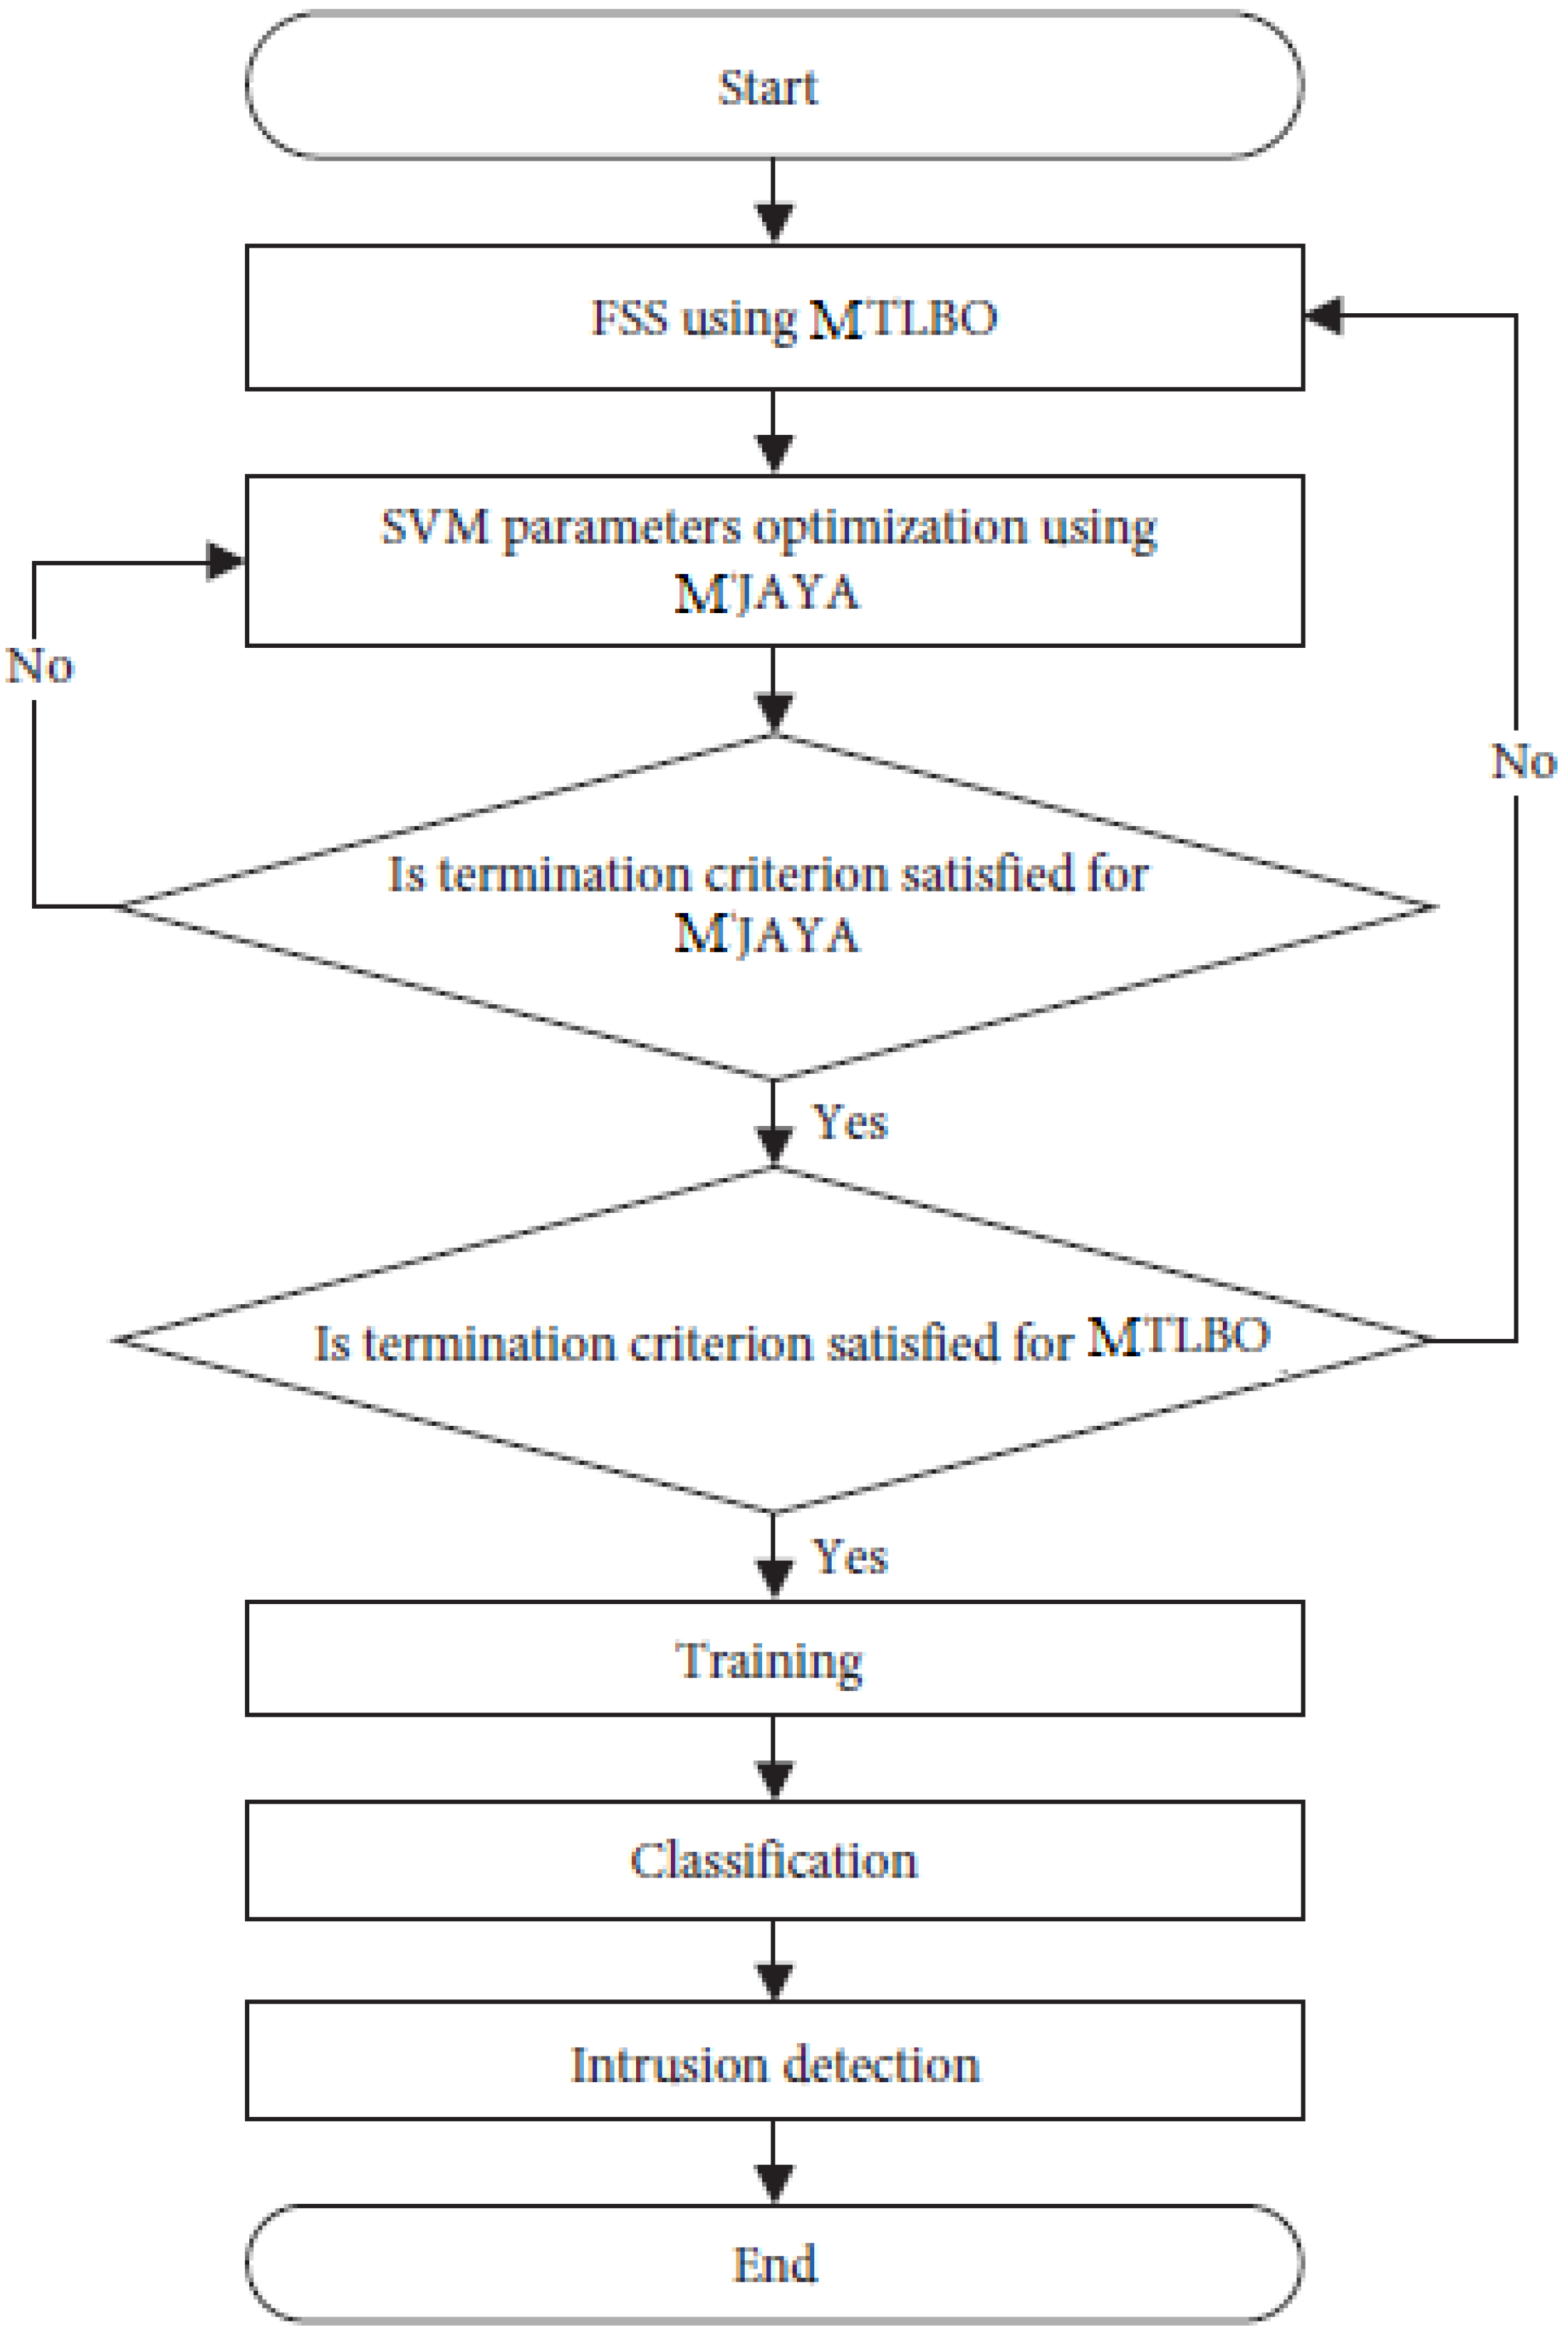
Algorithms complete the model’s job by completing a certain set of tasks. First, the MTLBO method is used to select the best subset of features from the entire collection. It is the MJAYA algorithm’s job to optimize the SVM parameters, which is why it is called the second algorithm. Thirdly, the SVM classifier is used to identify whether the traffic analyzed is an intrusion or normal traffic based on the results of the first two methods. The MTLBO-MJAYA-SVM flowchart is demonstrated in Figure 3.
MTLBO-MJAYA-SVM is broken down as follows:
The generation of a random population is performed in the first step. From one to the maximum number of attributes, each population has a unique collection of characteristics. The second step is to compute the weighted average of each population. The third step is to find the finest instructor for your child. Each student has their own relationship with the teacher they have chosen. All the resultant individuals will be subjected to mutation after each crossover. The half-uniform crossover and bit-flip mutation operator are utilized in the crossover. Check the chromosomal population (crossover and mutation) in step 4. Otherwise, if the new one is superior to the old one, you should keep the old one. Classification accuracy is measured using two populations: the best and the worst. This is termed the Teacher phase because everyone learns from the best person (teacher). Then comes the start of Learner Phase 1. Choose the best two students and apply crossover between these two students in step 5. The new one can then be subjected to mutation. Keep the new student if they outperform the previous two; if not, keep the best of the old students and apply this principle to everyone else (students). Once a student is selected, they will not be selected again. Learner Phase 1 has concluded. It is in step 6 of Learner Phase 2 that the SVM parameters are optimized, and students are encouraged to learn from one another. This phase begins by selecting two random people (students) and then applying crossover and mutation to the new individual. Check to see whether the new student is better than the two previous students after that and before the classification process begins. The MJAYA parameter optimization process begins at the 29th step by establishing the MJAYA population size, MJAYA number of design variables, and MJAYA end-of-run criteria. Prior to the execution, the population size can be defined, and each population is created at random. The two SVM parameters that need to be optimized are the SVM’s designed variables. Finally, if the new population is better than the old one, the population is recalculated and updated. The MJAYA loop is iterated indefinitely until the end criterion is met. For the final stage of MJAYA, the optimum value of the two parameters to be employed by SVM is provided by MJAYA. The parameter optimization is currently complete, and the next step in Learner Phase 2 is to continue. In step 7, use the results of MJAYA to examine the chromosomes of the people. You should keep the new student if they are better than the other two, or the best of the old ones. All other students should follow this procedure. The first three stages of the MTLBO are now complete. Check to see whether the termination requirements are met; if they are, continue to the next step. Otherwise, the three main stages are repeated in their entirety. The classifier’s accuracy is defined as its ability to accurately anticipate the actual class. The final step, step 8, is to sort the results using nondominated sorting. When sorting in a nondominated fashion, no result (individual) is favored over any of the others.
As shown in Table 8, the false positive rate (FPR) is the percentage of samples mistakenly projected as positive by the classification algorithm. The false negative rate (FNR) is the percentage of data mistakenly categorized as negative by a classifier. The percentage of samples in the right class, as determined by the classifier, is known as the detection rate (DR). Using all of the positive predictions, recall determines how many were correct. To quantify both the detection rate and recall simultaneously, F-Measure (F-M) was developed. The error rate (ER) is the proportion of incorrectly classified patterns in the model.
Preparation and partitioning of a dataset is the next step. This step involves preprocessing the entire dataset. Scaling and normalization are two separate processes. During the scaling step, the dataset is transformed from a string representation to a numerical representation. When it comes to the dataset’s class label, “Normal” and “Attack” are two separate categories. A label of “1” indicates a nonattacking situation, and a labeled “0” indicates an attack. The normalization step [28] must be performed. Normalization reduces the range differences between features by removing the noise in the dataset. The following equation illustrates how the max–min normalization method was used in this study:
where denotes the currently normalized feature and and denote the feature’s minimal and maximum values, respectively. The objective function quantifies the SVM’s accuracy when tested on the validation set. The validation set is comprised of elements from the training set. K-fold cross-validation can be used to improve the fairness of the validation [29]. K equals ten good error estimates. The NSL-KDD and CICIDS 2017 datasets were utilized to assess the suggested model’s performance. The proposed approach was evaluated in this study using NSL-KDD datasets. (This dataset was proposed in 2009 by Tavallaee et al. [30] as a workaround for the shortcomings of KDD CUP99.) The accuracy of the presented method against others for the NSL-KDD dataset is shown in Figure 4.
The NSL-KDD dataset is frequently used to evaluate the performance of novel identification techniques, particularly anomaly-based network identification. The NSL-KDD contains enough testing and training records. Each traffic record in this dataset has 41 features and one class label. The features are grouped into three categories: fundamental, content, and traffic, as shown in Table 9.
The NSL-KDD classifies attacks based on their feature characteristics [28]. The false alarm rate (FAR) against the number of features for the NSL-KDD dataset is shown in Figure 5. The execution time in the presented algorithm against others for the NSL-KDD dataset is shown in Figure 6.
The findings of the new technique based on the MTLBO-MJAYA algorithm are presented in this section. The SVM parameters are updated using this method, which selects the best features. A “parallel execution” approach to updating SVM parameters was proposed in this work. A table of parameters utilized in this investigation is presented in Table 10 (MTLBO-JAYA, MTLBO, and MTLBO-MIAYA). A comparison of algorithms with different features (normalized chart) is shown in Figure 6. It can be concluded from Figure 7 that the performance of MTLBO-MIAYA is better than other studied algorithms, i.e., MTLBO-JAYA, MTLBO, and original TLBO.
Three techniques are evaluated using the NSL-KDD dataset, and the metrics utilized are maximum accuracy, average accuracy, detection rate, false alarm rate, false negative rate, F-measure (F-M) recall, and erroneous rate of detection (ER). Results from MTLBO, MTLBO-JAYA, and MTLBO-MJAYA are shown in Table 11. It is clear from the results that MTLBO-MJAYA is superior in every metric to both MTLBO and MTLBO-JAYA.
Statistical significance tests, such as the t-test made on the distribution of values in the samples, showed a significant difference. The test shows the dominance of MJAYA-MTLBO-SVM over JAYA-MTLBO-SVM. The P and T values are shown in Table 11. In this table, the small values show the high significance of the MJAYA-MTLBO-SVM method.
5. Conclusions
This paper presented and discussed in depth an enhanced intrusion detection technique for multiclass classification. The proposed solution utilized a combination of the modified teaching–learning-based optimization (MTLBO) algorithm, the modified JAYA (MJAYA) algorithm, and a support vector machine (SVM). MTLBO was used in conjunction with supervised machine learning (ML) to choose feature subsets.
The proposed MTLBO-MJAYA-SVM algorithm can be used to improve the accuracy and efficiency of intrusion detection systems (IDSs), which are essential for protecting financial systems from cyberattacks.
Selection of the fewest features possible without impairing the accuracy of the results in feature subset selection (FSS) is a multiobjective optimization issue. This paper presented MTLBO as a mechanism and investigated its algorithm-specific, parameter-free idea. MJAYA was utilized in this paper to update the support vector machine’s C and gamma parameters. Numerous studies on the well-known intrusion machine learning dataset revealed considerable improvements when the proposed MTLBO-MJAYA-SVM technique was compared with the original TLBO and JAYA algorithms.
Author Contributions
Conceptualization, A.L.; Methodology, A.L. and F.D.; Software, A.L. and F.D.; Validation, A.L.; Formal analysis, A.L.; Investigation, A.L.; Resources, A.L.; Data curation, A.L.; Writing—original draft, A.L. and F.D.; Writing—review & editing, A.L. and F.D.; Visualization, F.D.; Supervision, A.L.; Project administration, A.L. All authors have read and agreed to the published version of the manuscript.
Funding
No funding was received for this research.
Institutional Review Board Statement
Not applicable.
Informed Consent Statement
Not applicable.
Data Availability Statement
The data used to support the findings of this study are available online at https://www.unb.ca/cic/datasets/nsl.html (accessed on 5 October 2022).
Conflicts of Interest
The authors declare that they have no conflicts of interest.
References
- Ogundokun, R.O.; Awotunde, J.B.; Sadiku, P.; Adeniyi, E.A.; Abiodun, M.; Dauda, O.I. An enhanced intrusion detection system using particle swarm optimization feature extraction technique. Procedia Comput. Sci. 2021, 193, 504–512. [Google Scholar] [CrossRef]
- Houssein, E.H.; Gad, A.G.; Wazery, Y.M. Jaya algorithm and applications: A comprehensive review. Metaheuristics Optim. Comput. Electr. Eng. 2021, 696, 3–24. [Google Scholar]
- Zitar, R.A.; Al-Betar, M.A.; Awadallah, M.A.; Doush, I.A.; Assaleh, K. An intensive and comprehensive overview of JAYA algorithm, its versions and applications. Arch. Comput. Methods Eng. 2022, 29, 763–792. [Google Scholar] [CrossRef] [PubMed]
- Mohammadi, M.; Rashid, T.A.; Karim, S.H.T.; Aldalwie, A.H.M.; Tho, Q.T.; Bidaki, M.; Rahmani, A.M.; Hosseinzadeh, M. A comprehensive survey and taxonomy of the SVM-based intrusion detection systems. J. Netw. Comput. Appl. 2021, 178, 102983. [Google Scholar] [CrossRef]
- Ahmad, Z.; Shahid Khan, A.; Wai Shiang, C.; Abdullah, J.; Ahmad, F. Network intrusion detection system: A systematic study of machine learning and deep learning approaches. Trans. Emerg. Telecommun. Technol. 2021, 32, e4150. [Google Scholar] [CrossRef]
- Zheng, K.; Wang, X.; Wu, B.; Wu, T. Feature subset selection combining maximal information entropy and maximal information coefficient. Appl. Intell. 2020, 50, 487–501. [Google Scholar] [CrossRef]
- Aljanabi, M.; Ismail, M.A.; Mezhuyev, V. Improved TLBO-JAYA algorithm for subset feature selection and parameter optimisation in intrusion detection system. Complexity 2020, 2020, 528768. [Google Scholar] [CrossRef]
- Mojtaba, S.; Bamakan, H.; Wang, H.; Tian, Y.; Shi, Y. An effective intrusion detection framework based on MCLP/SVM optimized by time-varying chaos particle swarm optimization. Neuro Comput. 2016, 199, 90–102. [Google Scholar]
- Rao, R.V.; Venkata Rao, R. Teaching-Learning-Based Optimization Algorithm; Springer International Publishing: Berlin/Heidelberg, Germany, 2016. [Google Scholar]
- Das, S.P.; Padhy, S. A novel hybrid model using teaching learning-based optimization and a support vector machine for commodity futures index forecasting. Int. J. Mach. Learn. Cybern. 2018, 9, 97–111. [Google Scholar] [CrossRef]
- Das, S.P.; Achary, N.S.; Padhy, S. Novel hybrid SVMTLBO forecasting model incorporating dimensionality reduction techniques. Appl. Intell. 2016, 45, 1148–1165. [Google Scholar] [CrossRef]
- Rao, R.V.; Patel, V. An improved teaching-learning-based optimization algorithm for solving unconstrained optimization problems. Sci. Iran. 2013, 20, 710–720. [Google Scholar] [CrossRef]
- Rao, R.V.; Patel, V. Multi-objective optimization of heat exchangers using a modified teaching-learning-based optimization algorithm. Appl. Math. Model. 2013, 37, 1147–1162. [Google Scholar] [CrossRef]
- Satapathy, S.C.; Naik, A.; Parvathi, K. Weighted teaching-learning-based optimization for global function optimization. Appl. Math. 2013, 4, 28834. [Google Scholar] [CrossRef]
- Lin, W.; Yu, D.Y.; Wang, S.; Zhang, C.; Zhang, S.; Tian, H.; Luo, M.; Liu, S. Multi-objective teaching–learning-based optimization algorithm for reducing carbon emissions and operation time in turning operations. Eng. Optim. 2015, 47, 994–1007. [Google Scholar] [CrossRef]
- Xu, Y.; Wang, L.; Wang, S.-Y.; Liu, M. An effective teaching-learning-based optimization algorithm for the flexible job-shop scheduling problem with fuzzy processing time. Neuro Comput. 2015, 148, 260–268. [Google Scholar] [CrossRef]
- Al-Al-Janabi, M.; Ismail, M.A. Improved intrusion detection algorithm based on TLBO and GA algorithms. Int. Arab J. Inf. Technol. 2021, 18, 170–179. [Google Scholar]
- Wang, S.H.; Muhammad, K.; Lv, Y.; Sui, Y.; Han, L.; Zhang, Y.D. Identification of Alcoholism based on wavelet Renyi entropy and three-segment encoded Jaya algorithm. Complexity 2018, 2018, 3198184. [Google Scholar] [CrossRef]
- Migall’on, H.; Jimeno-Morenilla, A.; Sanchez-Romero, J.-L. Parallel improvements of the Jaya optimization algorithm. Appl. Sci. 2018, 8, 819. [Google Scholar] [CrossRef]
- Gong, C. An enhanced Jaya algorithm with a two group Adaption. Int. J. Comput. Intell. Syst. 2017, 10, 1102–1115. [Google Scholar] [CrossRef]
- Samuel, O.; Javaid, N.; Aslam, S.; Rahim, M.H. JAYA optimization based energy management controller for smart grid: JAYA optimization based energy management controller. In Proceedings of the 2018 International Conference on Computing, Mathematics and Engineering Technologies (iCoMET), Sukkur, Pakistan, 3–4 March 2018. [Google Scholar]
- Yu, K.; Liang, J.J.; Qu, B.Y.; Chen, X.; Wang, H. Parameters identification of photovoltaic models using an improved JAYA optimization algorithm. Energy Convers. Manag. 2017, 150, 742–753. [Google Scholar] [CrossRef]
- Aljanabi, M.; Ismail, M.A.; Ali, A.H. Intrusion detection systems, issues, challenges, and needs. Int. J. Comput. Intell. Syst. 2021, 14, 560–571. [Google Scholar] [CrossRef]
- Khraisat, A.; Gondal, I.; Vamplew, P.; Kamruzzaman, J. Survey of intrusion detection systems: Techniques, datasets and challenges. Cyber Secur. 2019, 2, 1–22. [Google Scholar] [CrossRef]
- Kavak, H.; Padilla, J.J.; Vernon-Bido, D.; Diallo, S.Y.; Gore, R.; Shetty, S. Simulation for cyber security: State of the art and future directions. J. Cyber Secur. 2021, 7, tyab005. [Google Scholar] [CrossRef]
- Dash, M.; Liu, H. Feature selection for classification. Intell. Data Anal. 1997, 1, 131–156. [Google Scholar] [CrossRef]
- Dumais, S.; Platt, J.; Heckerman, D.; Sahami, M. Inductive learning algorithms and representations for text categorization. In Proceedings of the Seventh International Conference on Information and Knowledge Management-CIKM’98, Bethesda, MD, USA, 3–7 November 1998. [Google Scholar]
- Jahan, A.; Mustapha, F.; Ismail, M.Y.; Sapuan, S.M.; Bahraminasab, M. A comprehensive VIKOR method for material selection. Mater. Des. 2011, 32, 1215–1221. [Google Scholar] [CrossRef]
- Rodriguez, J.D.; Perez, A.; Lozano, J.A. Sensitivity analysis of k-Fold cross validation in prediction error estimation. IEEE Trans. Pattern Anal. Mach. Intell. 2010, 32, 569–575. [Google Scholar] [CrossRef]
- Tavallaee, M.; Bagheri, E.; Lu, W.; Ghorbani, A.A. A detailed analysis of the KDD CUP 99 data set. In Proceedings of the 2009 IEEE Symposium on Computational Intelligence for Security and Defense Applications, Ottawa, ON, Canada, 8–10 July 2009; pp. 1–6. [Google Scholar]
- Al-Qatf, M.; Lasheng, Y.; Al-Habib, M.; Al-Sabahi, K. Deep learning approach combining sparse autoencoder with SVM for network intrusion detection. IEEE Access 2018, 6, 52843–52856. [Google Scholar] [CrossRef]
Figure 1.
Typical feature selection problem.

Figure 2.
MJAYA flowchart.

Figure 3.
MTLBO-MJAYA-SVM flowchart.

Figure 4.
Accuracy of the presented method against others in the NSL-KDD dataset.

Figure 5.
False alarm rate (FAR) against the number of features in the dataset.

Figure 6.
Execution time in the presented algorithm against others in the dataset.

Figure 7.
Comparison of algorithms with different features (normalized chart).


Table 1.
Limitation of feature selection in previous studies.
| Ref. | Limitation |
|---|---|
| [6] | Computational cost |
| [7] | Classification accuracy |
| [8] | The need for training the model when adding new features |
Table 2.
C and values.
| C | γ |
|---|---|
| 16 | 8 |
| 2 | 4 |
| 8 | 0.56 |
| 0.2 | 2 |
Table 3.
Accuracy based on C.
| C | Subset Feature | Accuracy |
|---|---|---|
| 16 | Fixed | 0.96 |
| 2 | Fixed | 0.87 |
| 8 | FIXED | 0.97 |
| 0.2 | Fixed | 0.963 |
Table 4.
Best and worst groups for C.
| C | Subset Feature | Accuracy | |
|---|---|---|---|
| 16 | Constant | 0.96 best of worst | Worst group |
| 2 | Constant | 0.87 | |
| 8 | Constant | 0.97 best of best | Best group |
| 0.2 | Constant | 0.963 |
Table 5.
Accuracy based on .
| Subset Feature | Accuracy | |
|---|---|---|
| 8 | Constant | 0.96 |
| 4 | Constant | 0.97 |
| 0.56 | Constant | 0.982 |
| 2 | Constant | 0.98 |
Table 6.
Best and worst groups for .
| Subset Feature | Accuracy | ||
|---|---|---|---|
| 8 | Constant | 0.96 | Worst group |
| 4 | Constant | 0.97 best of worst | |
| 0.56 | Constant | 0.982 best of best | Best group |
| 2 | Constant | 0.98 |
Table 7.
Evaluation of features based on new C and γ.
| C | γ | Subset Feature | Accuracy |
|---|---|---|---|
| 11.96 | 11.74 | Fixed | Result |
Table 8.
A review of the metrics and measures utilized in evaluating system performance.
| Measure | Formula |
|---|---|
| Accuracy | |
| False positive rate (FPR) | |
| False negative rate (FNR) | |
| Detection rate (DR) | |
| Recall | |
| F-Measure (F-M) | |
| Error rate (ER) |
TP, true positive; TN, true negative; FP, false positive; FN, false negative.
Table 9.
NSL-KDD dataset [31].
Table 9.
NSL-KDD dataset [31].
| Attack Classes | 22 Types of Attacks | No. of Instances |
|---|---|---|
| Normal | 67,343 | |
| Dos | Smurt, Neptune, pod, teardrop, back, land | 45,927 |
| R2L | Phf, ftp-write, imap, multihop, warezclient, warezmaster, spy, guess password | 995 |
| U2R | Perl, loadmodule, buffer-overflow, rootkit | 52 |
| Probing | Portsweep, ipsweep, satan, nmap | 11,656 |
Table 10.
Parameters applied to different algorithms.
| Parameter | Value |
|---|---|
| MTLBO Population size | 41 |
| MTLBO Number of generations | 82 |
| JAYA Population size | 41 |
| JAYA Number of generations | 82 |
| MJAYA Population size | 41 |
| MJAYA Number of generations | 82 |
| MTLBO Population size | 41 |
| MJAYA Number of generations | 82 |
Table 11.
Statistical significance tests.
| t-Test on NSL-KDD Dataset | Value |
|---|---|
| p-value | 0.02 |
| T-value | 3.2 |
Disclaimer/Publisher’s Note: The statements, opinions and data contained in all publications are solely those of the individual author(s) and contributor(s) and not of MDPI and/or the editor(s). MDPI and/or the editor(s) disclaim responsibility for any injury to people or property resulting from any ideas, methods, instructions or products referred to in the content. |
© 2023 by the authors. Licensee MDPI, Basel, Switzerland. This article is an open access article distributed under the terms and conditions of the Creative Commons Attribution (CC BY) license (https://creativecommons.org/licenses/by/4.0/).
Share and Cite
MDPI and ACS Style
Larijani, A.; Dehghani, F. An Efficient Optimization Approach for Designing Machine Models Based on Combined Algorithm. FinTech 2024, 3, 40-54. https://doi.org/10.3390/fintech3010003
AMA Style
Larijani A, Dehghani F. An Efficient Optimization Approach for Designing Machine Models Based on Combined Algorithm. FinTech. 2024; 3(1):40-54. https://doi.org/10.3390/fintech3010003
Chicago/Turabian StyleLarijani, Ata, and Farbod Dehghani. 2024. "An Efficient Optimization Approach for Designing Machine Models Based on Combined Algorithm" FinTech 3, no. 1: 40-54. https://doi.org/10.3390/fintech3010003