Abstract
Purpose: FinTech research has grown rapidly, but few studies have measured the levels of scientific collaboration among authors, institutions, and nations. This study aimed to reveal the status and levels of scientific collaboration in this field. The results will help scholars to combine their knowledge and resources to generate new ideas that may not have been possible if they worked alone and enable them to work more efficiently, resulting in higher-quality results for all parties. Design/methodology/approach: Research papers in the FinTech field indexed in the Web of Science databases from 1999 to 2022 were included in the research dataset. Using R-bibliometrix and VOS viewer (Visualisation of Similarities viewer), co-authorship networks were drawn. Additionally, some measures of the co-authorship network were assessed, such as the links, total link strength, total number of articles, total citations, normalized total citations, average year of publication, average citations, and average normalized normal citations. Beyond bibliometric analyses, this research gathers other statistics for analysis to gain further insights. Result: A total of 1792 publications were identified, and a number of these revealed an increase in the forms of collaboration, including collaboration among authors and institutions. Three lists of the most collaborative authors, institutions, and countries were compiled. The top authors, affiliations, and countries were ranked according to their total links, citations, average citations, and annual normalized citations. There were six distinct clusters of collaboration among authors, thirteen among affiliations, and eleven among countries. In terms of author collaborations, the links and total link strength had three nodes and four nodes, respectively. John Goodell, Chi-Chuan Le, and Shaen Corbet were the top three collaborative authors. In terms of affiliations, the two strength attributes were 8 and 12 nodes, with Sydney University, Hong Kong University, and the Shanghai University of Finance and Economics topping the list. In terms of collaboration among countries, these two attributes had 14 and 34 nodes. Three of the most collaborative countries were England, the People’s Republic of China, and the United States. Originality/value: In contrast with previous systematic literature reviews, this study quantitatively examines the collaboration status in the FinTech field on three levels: authors, affiliations, and countries.
Keywords:
fintech; financial technology; bibliometric analysis; co-authorship; collaboration network JEL:
O03; G04
1. Introduction
FinTech, a portmanteau of the words “finance” and “technology”, refers to all those activities related to financial innovation that apply technology to enhance or automate financial services [1]. The term “FinTech” originated in the 1990s when Citigroup launched a project called the “Financial Services Technology Consortium”, which later became the foundation of the FinTech research field. The purpose of the project was to explore the potential of developing new technologies for use in the finance sector. Subsequently, the attention of scholars and practitioners has been drawn to new technologies, such as blockchain, cryptocurrencies, the Ethereum ecosystem (decentralized blockchain platform), digital payment, Internet of Things (IoT), inclusive finance, and digital transformation. As a result, FinTech is being used to attract traditional banking clients, optimize commercial transactions, improve credit granting, and simplify banking operations. Financial services are thus being automated, resulting in a correspondingly necessary and accelerated process of transformation. Among the technologies used in this process are big data, blockchain, artificial intelligence, machine learning, cryptocurrencies, and biometric recognition.
Researchers and practitioners, institutions, and even countries across many fields, including FinTech, engage in collaboration (involving two or more persons or entities) to achieve common goals. Often focused on addressing complex issues and solving a variety of problems, collaboration enables participants to accomplish more than they would if working alone. Through collaboration, participants can serve large groups of people, grow as individuals, and serve larger groups of people than they can individually [2,3]. A collaborative research network can assist other researchers in expanding their fields of research or joining study groups in the same field. The frequency of scientific collaboration has been analyzed bibliometrically across various fields, with results showing that there are different levels of cooperation in research practice [4,5]. Analysis of co-authorship networks is one method for studying such collaboration, as it finds patterns in contacts between social actors. It is possible to measure the different levels of cooperation among authors, institutions, and countries by analyzing their co-occurrence relationships. This is important because this relationship can tell us more about the cooperative nature of scientific research and academic communication [6,7].
Collaboration studies are important for academic improvement because they allow scientists to combine their knowledge and resources to generate new ideas that may not have been possible if they worked alone. Consequently, they are able to work more efficiently, resulting in higher-quality results. To date, however, only a few studies have conducted a bibliometric analysis of the FinTech scientific literature that focuses on collaboration and co-authorship. The purpose of this study was to resolve this research gap. As such, this study aimed to describe the diversity of collaboration among authors, institutions, and countries in the study of FinTech. Specifically, our objectives are threefold: to analyze the overall status of collaborative research among authors, affiliations, and countries; to determine the authors, affiliations, and countries at the core of the cooperative research network; and to identify authors, affiliations, and countries that have strong collaborative relationships and contributions to the FinTech field. The following four questions will be answered in this research.
RQ1. How productive is FinTech research in terms of publications? Researchers will gain insight into the number and growth of scientific articles and citations in the field.
RQ2. How do authors collaborate in the FinTech field? Scholars will be presented with details of the authors’ collaboration networks and the characteristics of each network, including key contributors.
RQ3. How do research institutions collaborate in the FinTech field? Scholars will be informed as to how academic information is exchanged among institutions.
RQ4. How do countries collaborate in the FinTech field? Scholars will be presented with the collaboration networks of the countries and the attributes of each network.
RQ5. Does international collaboration play an important role in the development of FinTech research?
By answering the above research questions, this paper provides empirical knowledge in relation to impactful authors, affiliations, and countries, details of the co-authorship networks among those three levels, and, importantly, an analysis of the characteristics of networks/clusters to deliver insights regarding collaborations in FinTech research. Wu et al. (2019) [3] summarized many benefits of collaboration for scholars based on the report from the National Academies of the USA, including opportunities to: (1) expand thinking and learn new things; (2) serve a larger population by having access to people not normally reachable; (3) develop lifelong relationships and bonds; (4) gain from other people’s wisdom; (5) access new resources and skill development; (6) increase productivity by completing more work in fewer hours; (7) share recognition and accolades; (8) be associated with successful people; (9) share costs; (10) access more funds, as some funding bodies support collaborative projects only; (11) contribute to the cross-fertilization of knowledge; and (12) pool knowledge for tackling large and complex problems.
Therefore, the findings of this study are of great interest to FinTech scholars, institutions, and policymakers. It is essential for scholars to become familiar with existing networks in their fields in order to facilitate communication among academics working in similar fields. In order to facilitate the success of current projects and research findings, institutions must be familiar with the best institutional networks. It is through this process that institutions are able to avoid the duplication of projects and recruit the best partners. Information regarding the availability of resources for cooperation is provided by the country networks to policymakers.
This article is structured as follows. An overview of bibliometric analysis and its application in FinTech is provided in Section 2, which justifies the importance of the systematic literature review, such as bibliometric analysis, approach in advancing a research field. In Section 3, we describe this study’s research design. The research results are presented and discussed in Section 4. The main conclusions and forecasted future research directions are presented in the last section.
2. Systematic Literature Review as an Approach in Advancing FinTech Knowledge
In academic research, systematic literature reviews are essential to gathering existing knowledge and assessing the state of the field [5]. Bibliometric reviews, hybrid reviews, conceptual reviews, and meta-analytical reviews are among the types of systematic literature reviews classified [1]. Despite this, business and management researchers regularly rely on cursory and narrative reviews without systematically evaluating the literature. The most common method for organizing and analyzing massive amounts of data in researching a field of knowledge is bibliometrics. With the advent of various bibliometric methods, scientometrics analysis has made knowledge synthesis much easier. Since computerized data treatment has greatly improved these methods, there has been a huge increase in scientometrics research in all disciplines in recent years. A bibliometric method is statistically reliable only when it makes use of a sufficient amount of data, partly because of computerized methods. According to Syndey (2019), a systematic literature review can provide answers to research questions that no single study can because it integrates findings and perspectives from a wide range of empirical studies
As a method for systematic literature reviews [6,8], various journals, such as Sustainability, the Journal of Risk and Financial Management, Technological Forecasting and Social Change, Finance Research Letters, and Financial Innovation, have begun using bibliometric analysis to provide an overview of the articles they have published. In the FinTech field, researchers have extensively used bibliometric analysis in different research subjects, including crowdfunding [9], the effects of financial innovation [10], financial inclusion [11], FinTech in society and the environment [12], Big Data, artificial intelligence, and machine learning applications [13,14], FinTech and financial services, such as microfinance institutions and microfinance [15,16].
Appendix A provides some examples of using systematic literature reviews, including the bibliometric approach, in FinTech research for advancing knowledge. The review by Tello-Gamarra et al. (2022) [17] provides a framework for describing the changes in institutional models proposed by FinTech. This framework is based on a regulatory and financial institution-adaptive perspective. Using this framework, researchers can clarify how FinTech can modify institutional behavior. Sun et al.’s (2022) [18] investigation identified the business value generated by transactions, crypto-economic models, and automated and analytical processes involving organizations, individuals, and technologies. Blockchain-based applications solve various economic problems, such as storing/sharing information and generating consensus. Rahman et al. (2022) [19] found that green securities, green investments, climate finance, green insurance, green credit, green bonds, and green infrastructure are the primary green finance products offered by Bangladeshi banks. Additional factors include environmental performance, green economic growth, energy efficiency, green finance policies, environmental protection, and the impact of a bank’s policy formulation on risk.
As Paul et al. (2021) [20] reported that a successful literature review facilitates the development of theories, identify areas of research aplenty, and identify research needs. To summarize the latest literature reviews for FinTech mentioned above, it is noticed that these reviews create firm foundations for advancing the field knowledge by (1) providing the state-of-the-art of the latest literature, (2) knowledge mapping of the field in conceptual structures and intellectual structures, (3) establishing research and analytical frameworks, (4) forecasting future research directions, and (5) conducting thematic analyses and discovering the field’s evolution. Rather than focusing on a particular subject/area or technology, this research adopted the bibliometric analysis approach to advance knowledge and establish new knowledge in the generic FinTech field. Unfortunately, none of these reviews addressed scientific collaboration research, which is the focus of this study.
3. Research Design
In this integrated systematic review, bibliometric analysis was used to organize and analyze FinTech research for the purpose of knowledge mapping. The data were collected manually from the Web of Science repository, and bibliometric analyses were performed using R-bibliometrix (version 4.1.4) and VOSviewer (version 1.6.19).
3.1. The Protocol of This Systemic Literature Review (SPAR-4-SLR)
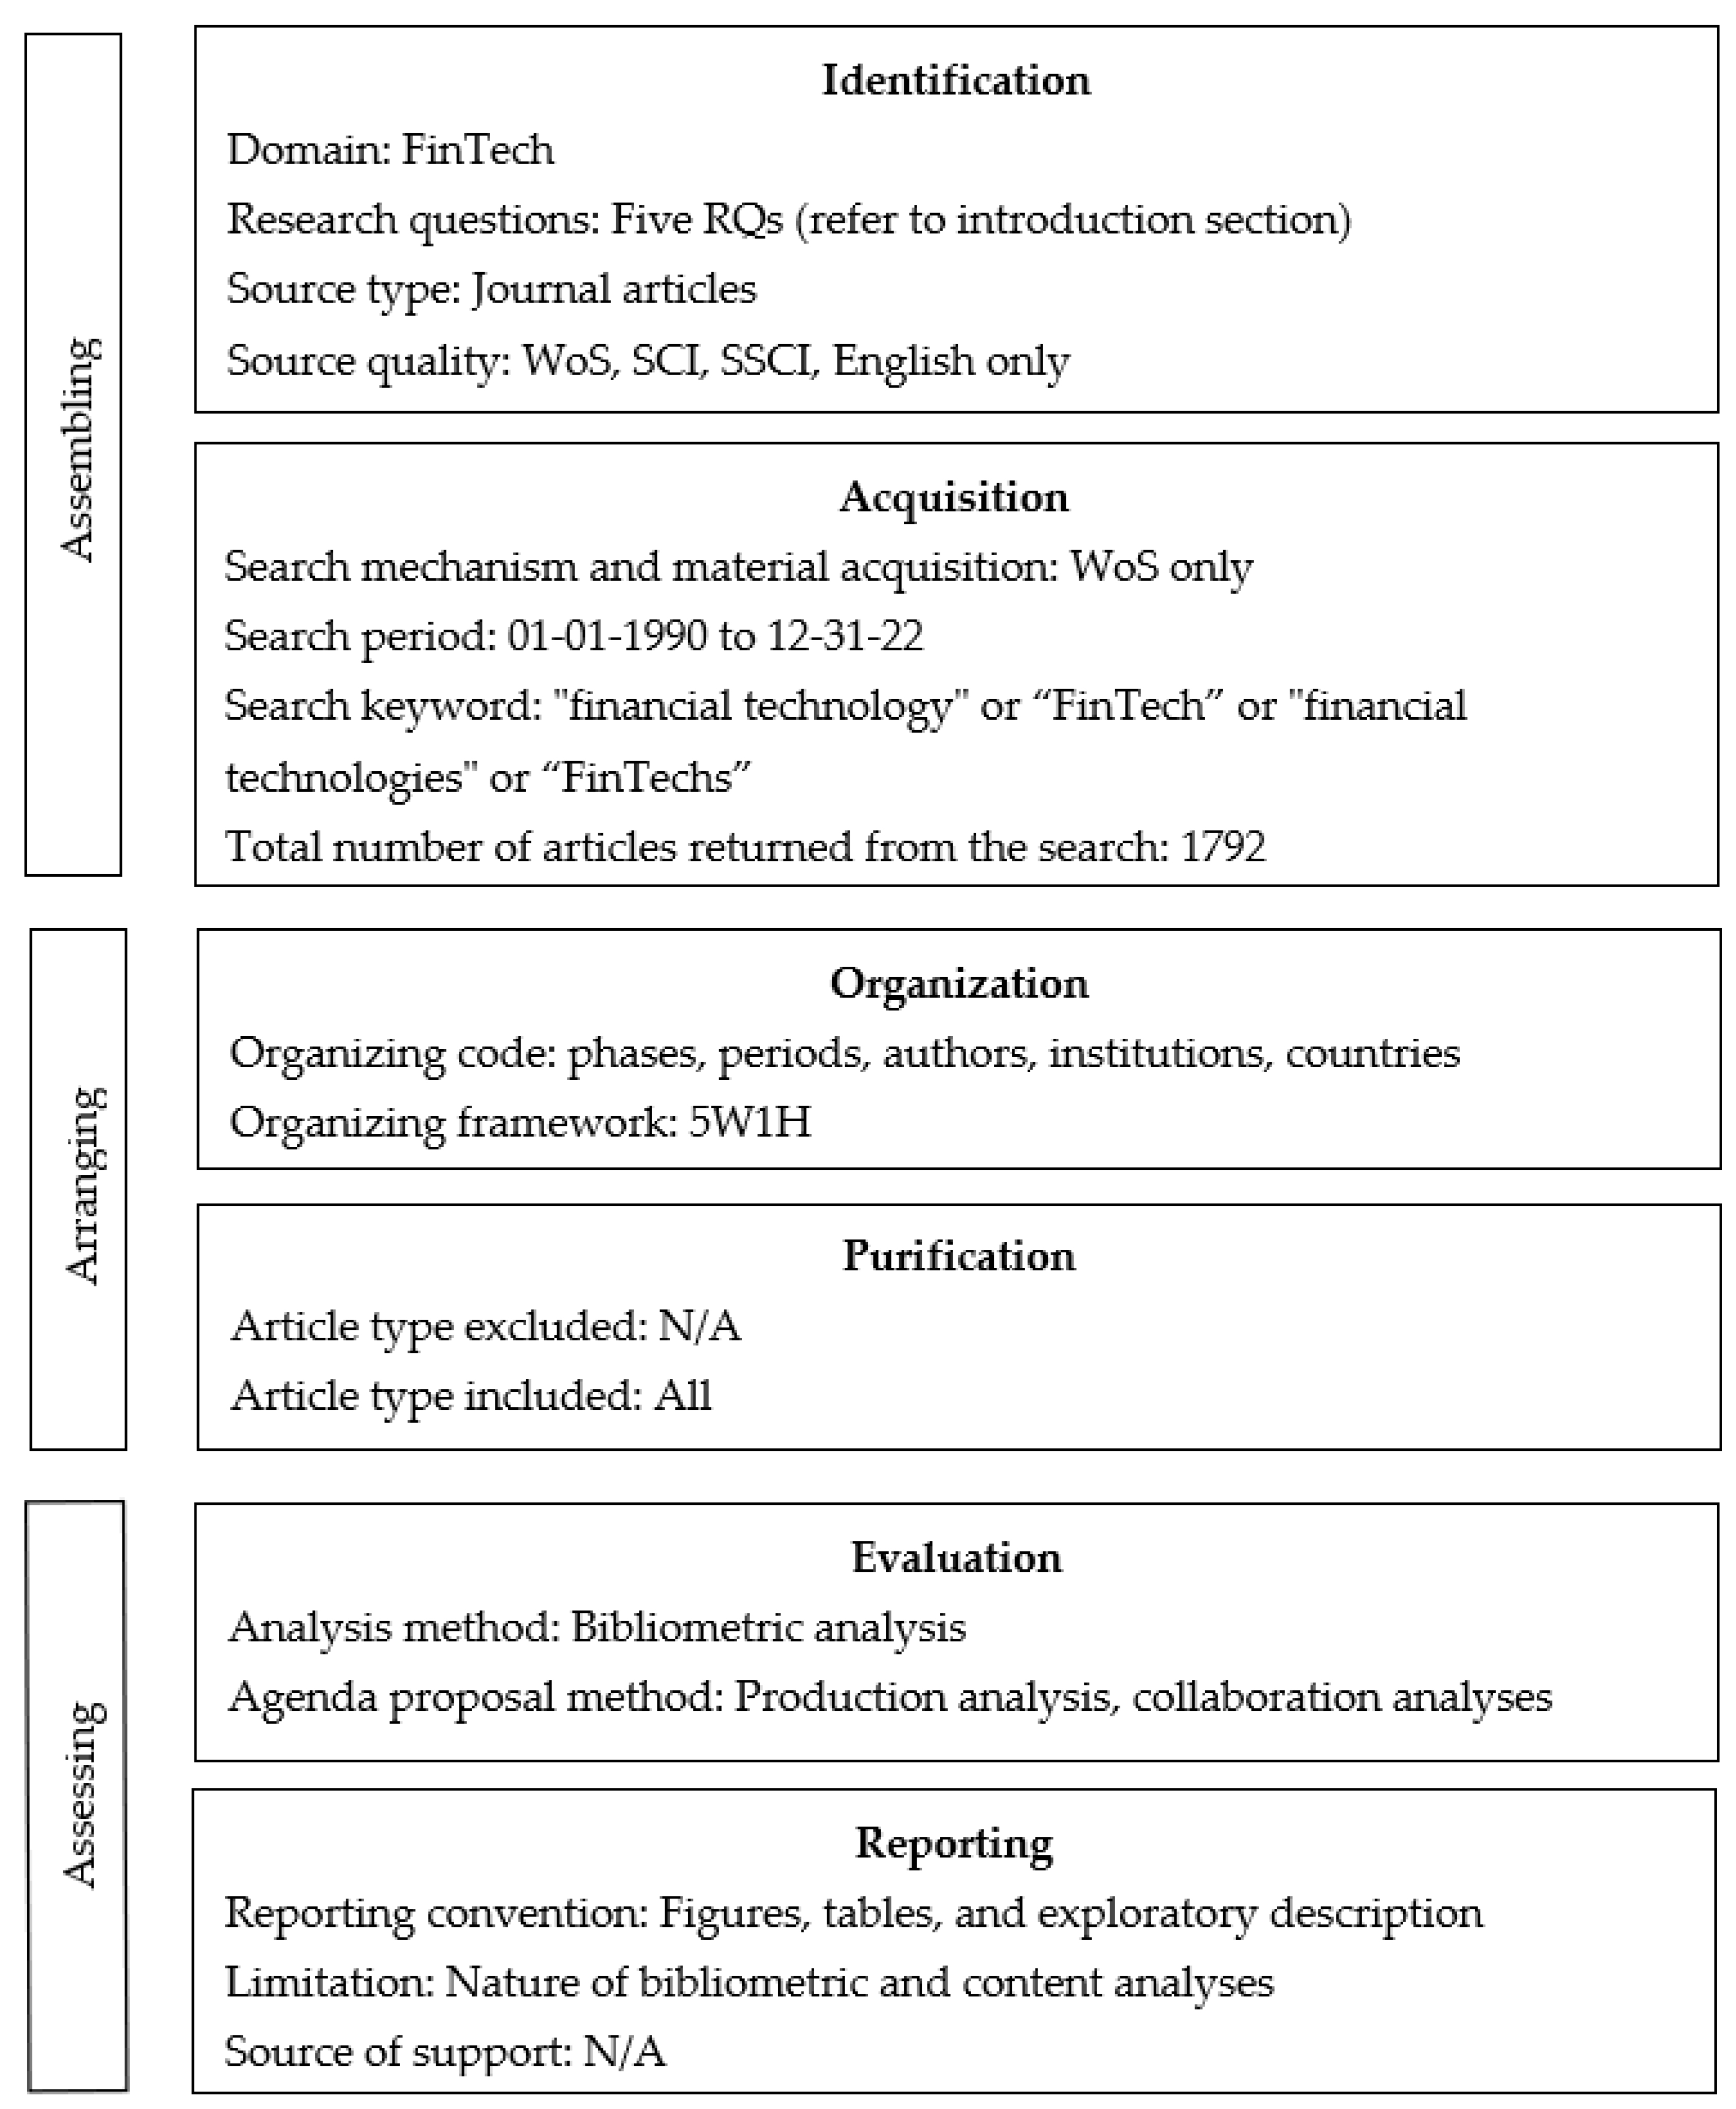
Paul et al. (2021) [20] and Kumar et al. (2022) [21] recommended the Scientific Procedures and Rationales for Systematic Literature Reviews (SPAR-4-SLR) protocol, as Figure 1 illustrates, in order to assist researchers in reviewing a specific domain systematically and justifying the decisions they make. There are three stages and six sub-stages in this bibliometric analysis for FinTech (Figure 1). The first stage involves identifying and acquiring literature that has not been synthesized. During the second stage, literature in the process of being synthesized is organized and purified. The third stage involves evaluating and reporting the synthesized literature. Conducting a systematic literature review by using the SPAR-4-SLR protocol can produce enhanced state-of-the-art insights and stimulate agendas to advance knowledge in the review domain [20,21]. In addition, the SPAR-4-SLR protocol will deliver such insights and agendas in a clear, transparent, and logical manner based on logical and pragmatic reasoning. Paul et al. (2021) [20] strongly discouraged researchers from altering the arrangements and conventions in SPAR-4-SLR protocol in order to maintain its rigor (e.g., efficiency and effectiveness).
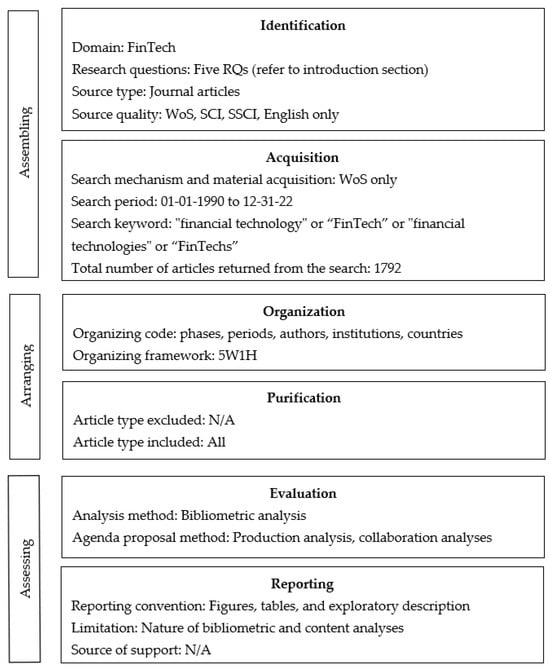
Figure 1.
Research flow of this FinTech review with SPAR-4-SLR protocol.
The present study analyzes the literature on FinTech studies using bibliometric analysis, including scientific production, co-authorship networks, institution collaboration, and country cooperation. Bibliometric analysis is used as a process of analyzing FinTech literature by using quantitatively analyzed metadata of publications within a retrieved dataset by design. By utilizing this well-recognized method of scientific inquiry, the methodology has applications in a variety of fields, including subjects associated with FinTech, as a standard approach. Owing to its reliance on a review protocol and quantitative analytical techniques, the bibliometric method is the most objective method to review a research subject. As a result of the absence of objective analysis techniques (e.g., thematic), other review methods either lack a review protocol (e.g., critical) or are limited to subjective interpretations. In contrast, bibliometric analysis enables one to gain a comprehensive understanding of any field’s de facto structure and evolutionary nuances, identify the research clusters that constitute the field, identify emerging trends, and gain a broader perspective on the concepts at the core of the field [22,23]. Figure 1 provides an overview of this study’s methodology.
3.2. Bibliometric Analysis
Bibliometric analysis has become one of the critical instruments for knowledge advancement in fast-growing fields of study [5,24]. One antecedent of the increasing popularity of bibliometric analyses is the ongoing differentiation of business and management research into narrowly defined subdisciplines, which demands studies that are interdisciplinary and ‘break the walls’ [25]. Bibliometrics can reveal the macro and meso structures of scientific production development and its application, the development history of a specific field, current research trends, and future development directions [24]. Scholars have highlighted that the basic items of bibliometric analysis are articles, authors, citations, co-citations, partnerships, co-authorships, affiliations, countries, and journals, as well as the interrelationship among these attributes [22]. Bibliometric analysis allows for the formation of a foundation that represents the most comprehensive collaboration networks among authors, institutions, and countries [4,26].
3.3. Data Collection and Analysis Process
Processable data for selected data processing applications should be collected before conducting scientometric analysis. In this study, we were seeking high-quality papers in the field of FinTech that present significant achievements. Such high-quality research was sourced from the WoS, since it provides publications with detailed metadata, including the indexing information of the title, keywords, abstract, author, affiliation, and cited references. No other database was included in this research, since WoS alone is frequently recommended for bibliometric analysis [27,28]. In terms of scientometric analysis, this database is of good design and is well recognized. “FinTech” or “FinTechs” or “financial technology” or “financial technologies” were selected as the topics of consideration. From inclusive criteria perspectives, SCI (SCI-EXPANDED) and SSCI (Social Science Citation Index) were selected as database restrictions for the search expression “TOPIC: (“financial technology”) OR TOPIC: (FinTech) OR (“financial technologies”) OR TOPIC: (FinTech).” By using “1 January 1990 to 31 December 2022” as the time frame to cover the last 32 years, the latest and historical FinTech research were included. From exclusive criteria perspectives, the language was limited to English. The required document types were “Article” and “Review Articles,” concerning the validity of all research papers in the WoS database.
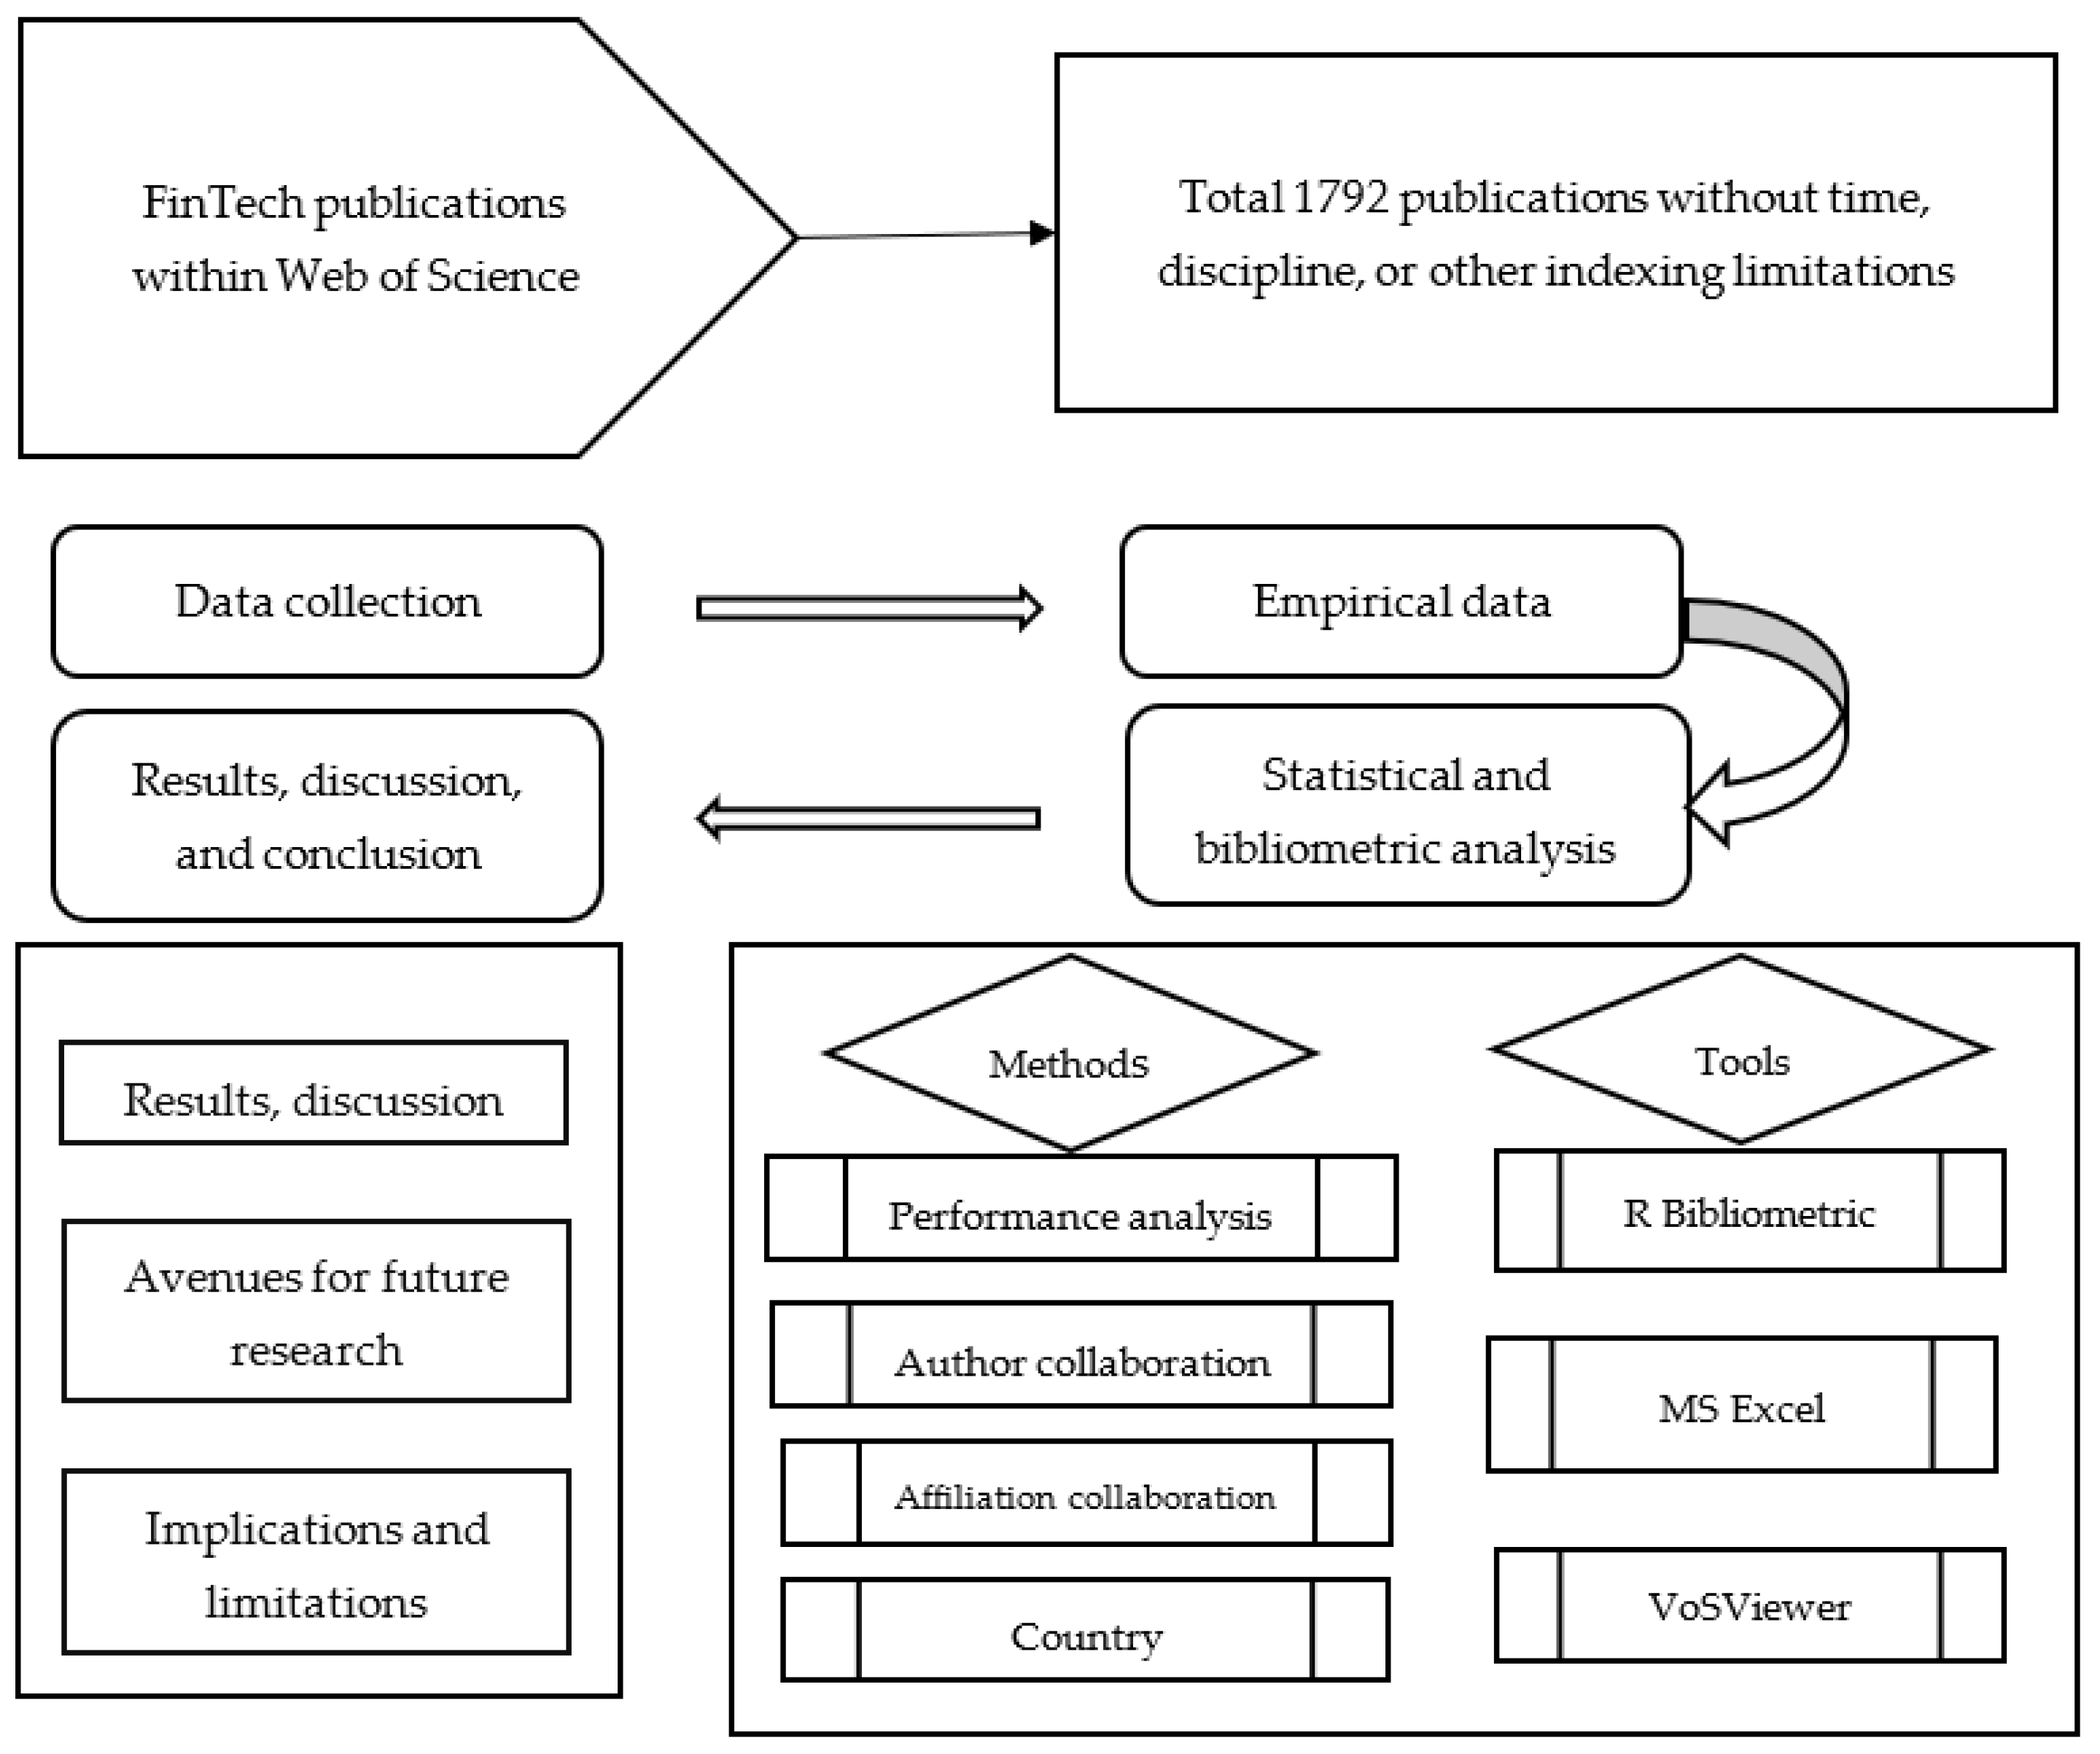
Figure 2 shows the process of data collection and the research framework. All metadata were imported into a plain text file for further analyses by R-bibliometrix, MS Excel, and VoSViewer. Four steps of data analysis were conducted, and they were (1) scientific production and citation, (2) authors’ collaboration networks, (3) institutional collaboration networks, and (4) countries’ collaboration networks. This paper provides enriched information for each network, including the average publication year, links, total link strength, number of articles, citations, normalized number of citations, average citations, and average normalized citations. After that, this paper calculates a time overlay of collaboration networks to depict the year each network was established. All these networks with the names of authors, institutions, and countries were visualized using the VOSviewer tool.
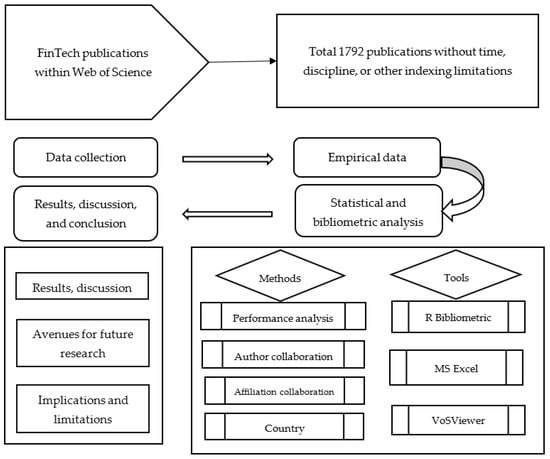
Figure 2.
Research framework and process [1].
4. Results
The purpose of this section is to present the results of the bibliometric analysis conducted using R-bibliometrix and VOSviewer. In the first section, we present the outputs of the scientific production in the FinTech field, as well as the performance analysis. Then, we analyze the social structure–collaboration patterns of authors, affiliations, and countries.
4.1. Production Analysis
Table 1 shows the database search results: 1792 articles for the period from 1999 to 2023 and the corresponding quantitative analysis of the main information. Even though data extraction was conducted on 31 December 2022, there was one article for 2023, since WoS accepted advance online publication. The total number of authors within the collections was 1099. These articles were published by 738 sources for all document types (journal articles, book chapters, etc.). In total, the collection cited 80,507 references. The table also illustrates a large number of international co-authorships, calculated as 32.7%. For the last 23 years, the average annual growth rate of the number of publications has been 2.93%. The document average age is 1.56 years, which indicates that most of the publications are recent; thus, the dataset can represent the latest developments in the FinTech domain. Further, the table indicates that 4427 author keywords were found, and over 1946 keywords were generated from titles and keywords.

Table 1.
Description of the dataset.
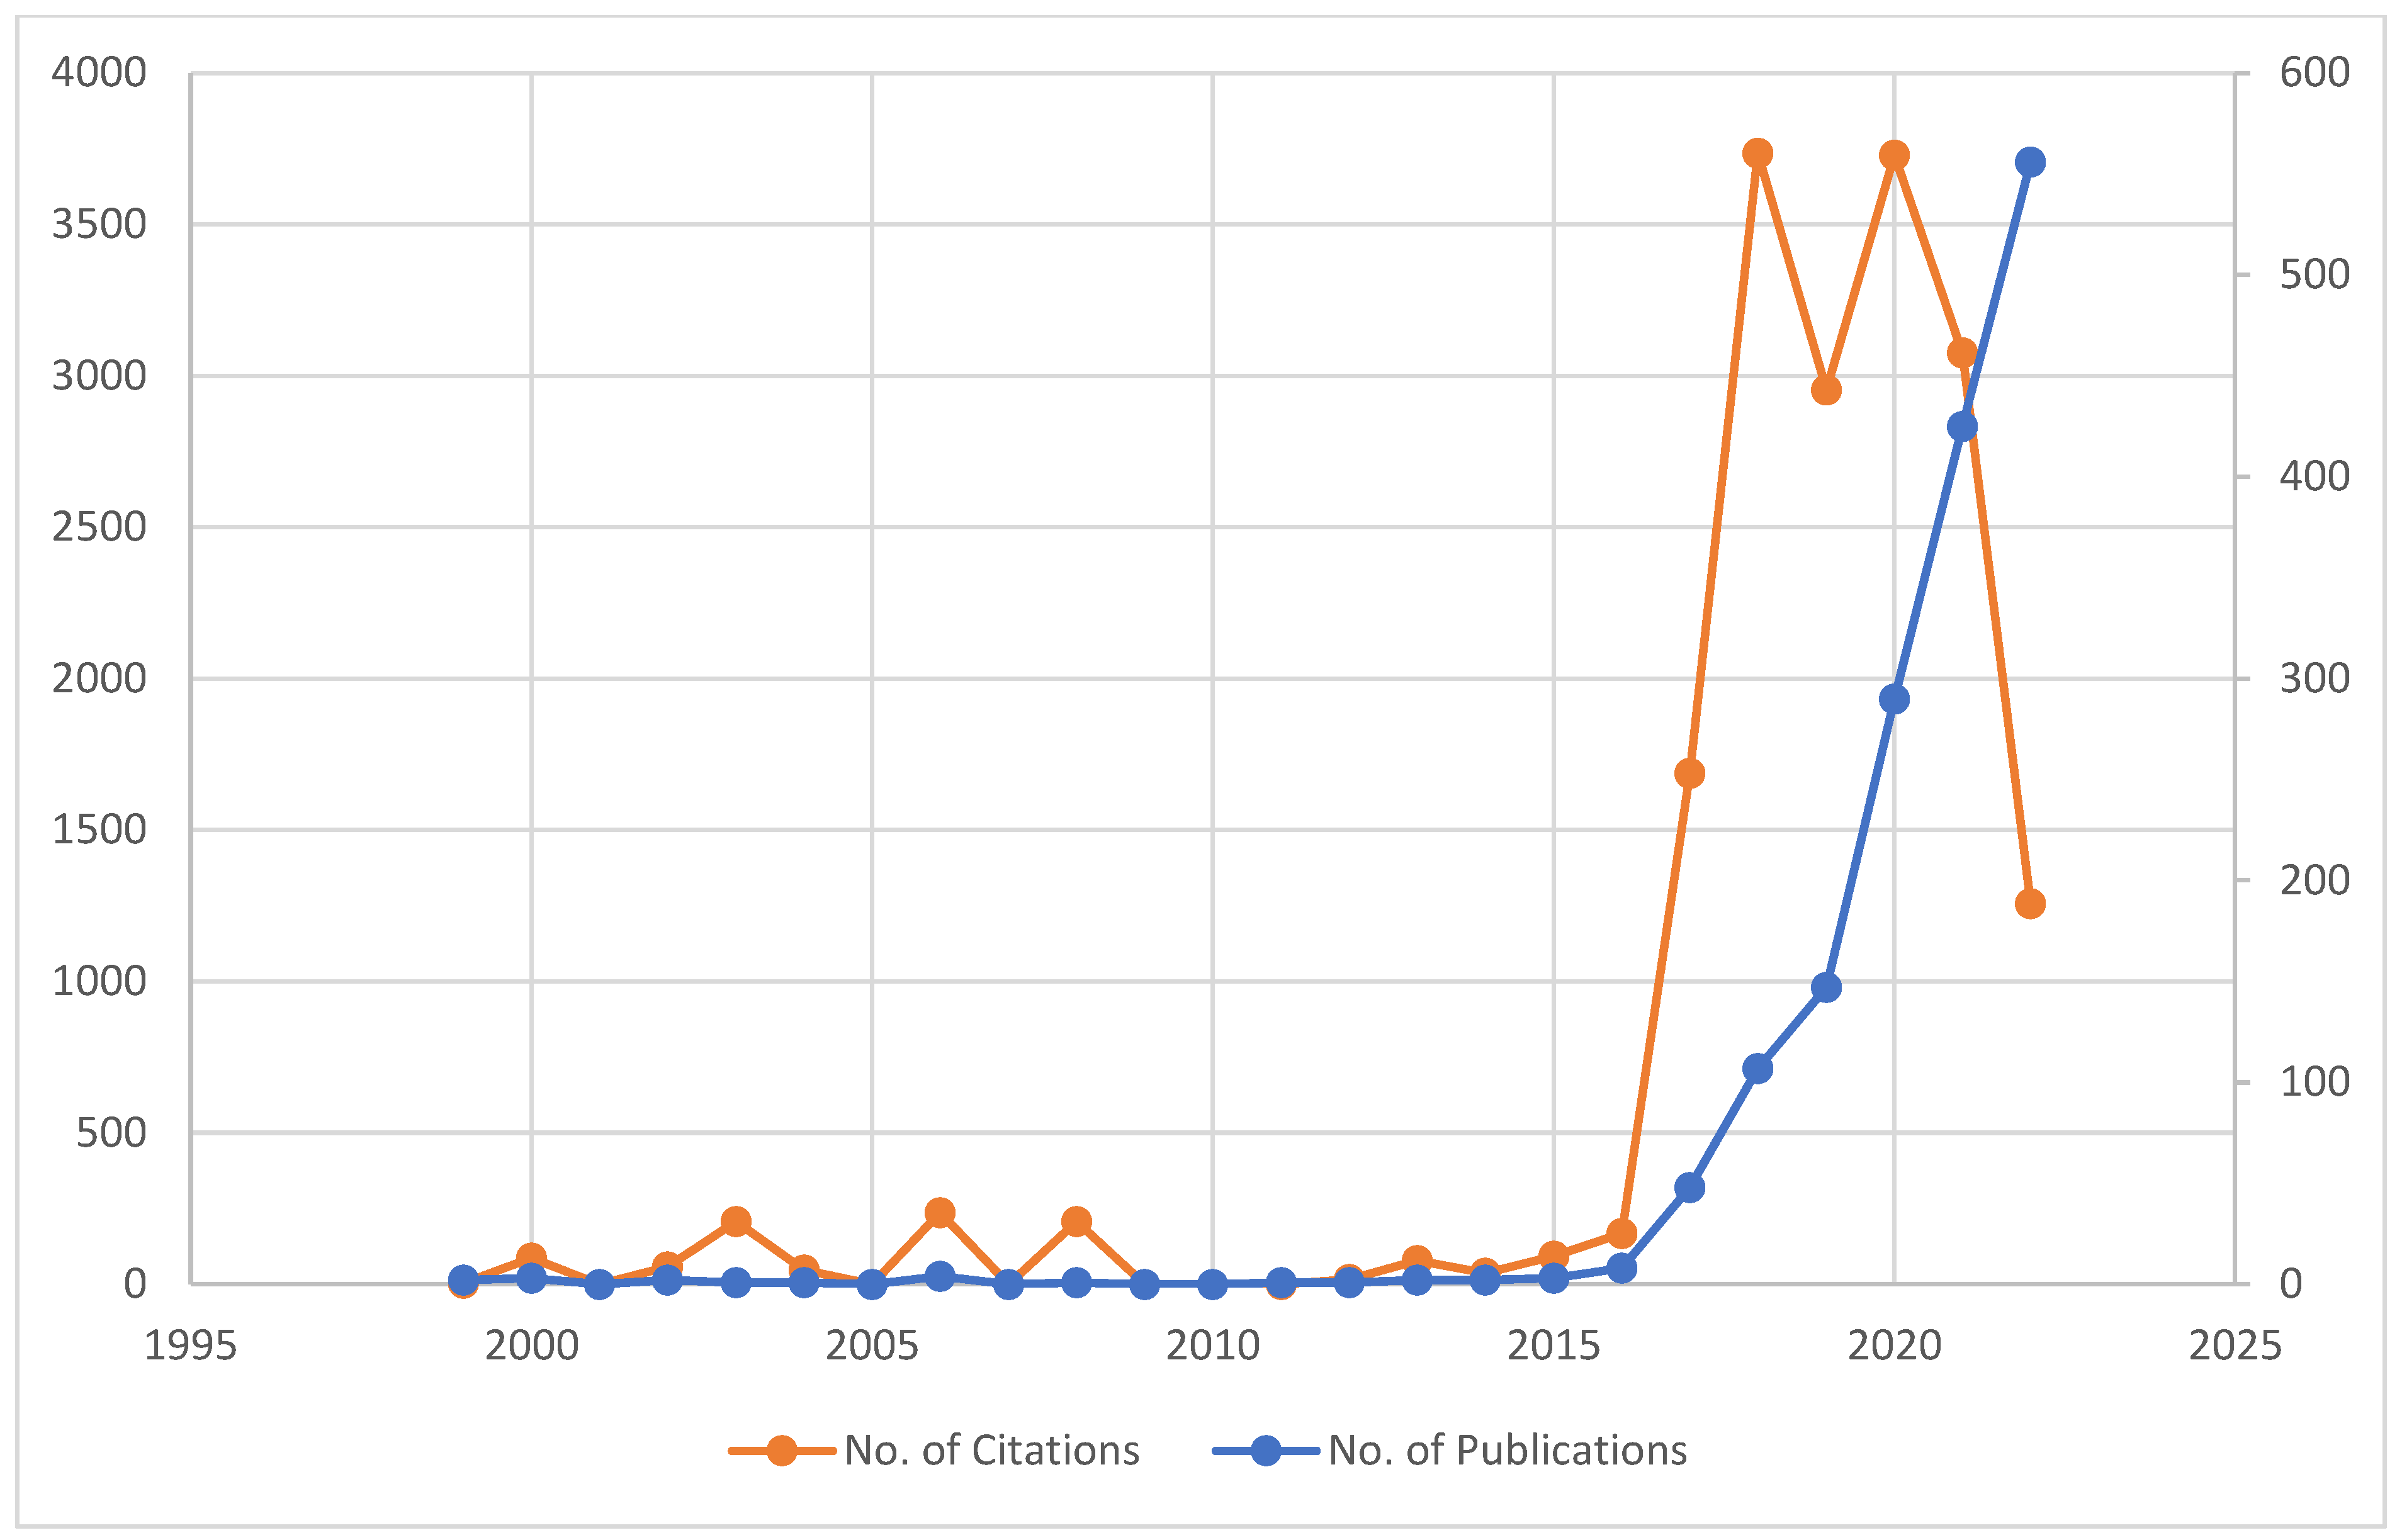
Figure 3 shows the results of the WoS search by yearly publication and citation numbers for the dataset period of 1999–2022. During this period of more than 30 years, scientific production in FinTech research increased, albeit at different rates. The blue line, representing scientific production, indicates three phases: a slow-growing period (1999–2016) in which the number of publications increased from two to eight, thus named as the “initiation” period; a medium-growing period (2017–2019), named the “development” period, in which the number of publications increased from 48 to 147; and a fast-growing period (2012–now), in which the number of publications grew from 290 to 556, named accordingly as “fast-growing”. Since the period of 2020–2022 covers the COVID-19 period, future research can use these results for the study of the pandemic crisis.
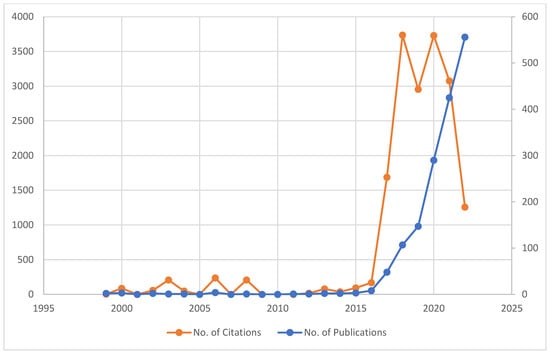
Figure 3.
Yearly publications and total citation numbers in FinTech (1999–2022).
The number of citations increased exponentially for articles published between 2016 and 2018: yearly citation numbers grew from 167 (2016) to 3736 (2018), which equals 1864 citations per year and 11.4 citations per year per article. The number of citations peaked in 2018. Starting from 2019, the number of citations plateaued. On average, between 2019 and 2022, the numbers of citations received were at 2955, 3729, 3077, and 1257. The average number of citations was 2754 per year, which worked out as 1.9 times per article per year. The citable years were not considered in regard to these calculations.
The first article published in the research target was “Business as Usual and Rare Events: The odd couple of risk management coming together” published in the Journal of Portfolio Management [29]. Here, the author indicated that derivatives had shown a surprising level of success in eliminating risk in business-as-usual conditions, with failures being rare events. Financial technology plays a key role in the success of risk management. By applying financial technology to risk management, the author argued that it is more robust than previously thought.
Even though a number of scholars [30] believe that FinTech research started in the early 1990s, this research found that it began in the late 1990s or, as Figure 2 shows more specifically, in 1999. This result is also at variance with the assertion from other scholars, who indicated that FinTech only “entered the literature five years ago” ([31] p. 1).
4.2. Social Structure-Collaboration among Authors, Affiliations, and Countries
Co-authorship status in scientific papers reflects the collaboration among authors, and the results of scientific research are published as papers. In scientometric research, the co-authorship of papers produced by multiple authors is considered a significant indicator of author cooperation [3]. When this co-authorship happens among affiliations and countries, the results will reflect inter-institutional and international collaborations. Some evidence shows that there is a direct correlation between the strength of collaboration at all levels and the quality of the research paper [2].
Two standard weight attributes are the links and the total link strength in co-authorship/collaboration analysis. An item’s link and total link strength attributes indicate how many and how strong its links are with other items. In the case of co-authorship links between researchers, affiliations, and countries, the links attribute indicates how many co-authorship links a given researcher, affiliation, or a country has with other researchers, affiliations, and countries. The total link strength measures the strength of all co-authorship links between researchers, affiliations, and countries and other researchers, affiliations, and countries.
4.2.1. Authors’ Collaboration Networks
In order to analyze the cooperation pattern among authors, organizations, and countries publishing on smart cities, the co-authorship visualization module of VOSviewer was used. Figure 4 illustrates the collaboration network of authors in FinTech research based on 1792 publications with contributions of 4473 different authors. Unless the author used a unique digital identity strategy like ORCID, it was not possible to merge publications with different names.
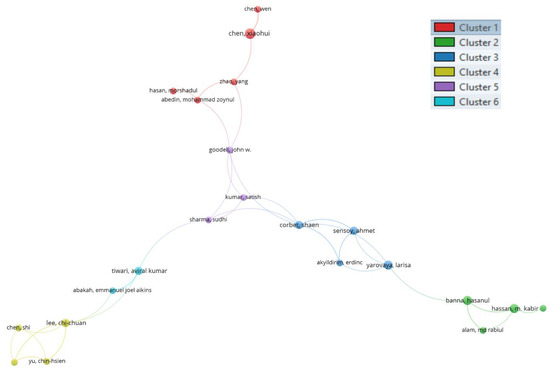
Figure 4.
Authors’ collaboration networks in FinTech field.
A proportion of 10.70% of authors (n = 479/4473) were credited with two FinTech-related publications, 1.53% (n = 113/4473) with at least three publications, 0.9% (n = 40/4473) with four publications, and 0.45% (n = 20/4473) with five or more publications. To find the prominent authors (n = 479) who published work on the topic of FinTech, the threshold value was set at two when creating author data based on the co-authorship map. Despite this, some of the 456 authors were not connected with one another. A total of 23 items were analyzed. Co-authorship of 0.51% was low compared with similar research on other subjects [32,33].
Cluster 1 contained five authors (Table 2), including M. Z. Abedin, X. H. Chen, Y. Zhao, W. Chen, and M. Hasan. The average publication year was between 2021 and 2022. With two publications, M. Z. Abedin scored the highest number of links (3) and total link strength (3). With five articles, X. H. Chen had the highest normalized citation number (7.96) and second highest number of citations (19); this author’s links and total link strength were two and three, respectively. M. Hasan had the highest citation number (22).
Table 2.
Collaboration network of authors in FinTech from 1999–2022 (ranked by total link strength).
In cluster 2, there were four collaborating authors: H. Banna, K. M. Hassan, R. M. Alam, and M. Selim. Their co-authored articles were published between 2021 and 2022. H. Banna had the highest total link strength (5), followed by K. M. Hassan (4), R. M. Alam (3), and M. Selim (1). From the perspective of the number of publications, H. Banna and K. M. Hassan each published four papers, and R. M. Alam and M. Selim each published two. From the perspective of citations and normalized citations, H. Banna had 32 citations, and 8.89 normalized citations, followed by K. M. Hassan (16, 4.49), R. M. Alam (17, 4.47), and M. Selim (5, 1.3).
There were four authors in cluster 3: S. Corbet, E. Akyildirim, A. Sensoy, and L. Yarovaya. Their collaboration mostly happened between 2019 and 2021. A. Sensoy had the highest number of citations (117) for all authors with co-authored work. The links and total link strength for these four authors, in the order listed above, were six and eight, three and five, three and five, and four and four, respectively.
In cluster 4, C. C. Lee, C. H. Yu, J. Zhao, and S. Chen were the four authors with the highest normalized citation number (14.39, 14.39, 14.39, and 9.28), average normalized citations (4.80, 7.20, 7.20, and 4.64), reasonably high total citations (58, 58, 58, and 22) and moderate numbers of publications (3, 2, 2, and 2). The order ranked by the total link strength and links is C. C. Lee (7, 5), C. H. Yu (5, 3), J. Zhao (5, 3), and S. Chen (3, 3). These four authors collaborated only in 2022.
Cluster 5 comprised three authors, W. J. Goodell, S. Sharma, and S. Kumar, who collaborated in 2022. The order ranked by the total link strength and links was W. J. Goodell (5, 5), S. Sharma (4, 4), and S. Kumar (3, 3). Each of them had two publications. S. Kumar was the only one with citations (13), with normalized citations of 5.75, average citations of 6.5, and average normalized citations of 2.87. Regarding the last cluster, K. A. Tiwari and A. J. E. Abakah were authors who collaborated in 2021.
Several features of author collaboration can be summarized. First, all collaborations happened between 2019 and 2022, even though FinTech research started in 1999. Second, only a small proportion of authors have engaged in research collaboration: 23 authors out of 4473 in six clusters. Third, the average number of publications for all authors who engaged in collaboration was three (Table 2), which means that each collaborative author in FinTech research only contributed a small number of papers in comparison with other subjects. Finally, cluster 5 (purple) played a central role in the linking of all clusters, as Figure 5 indicates.
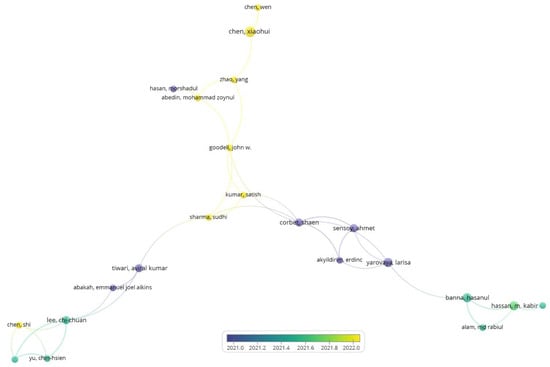
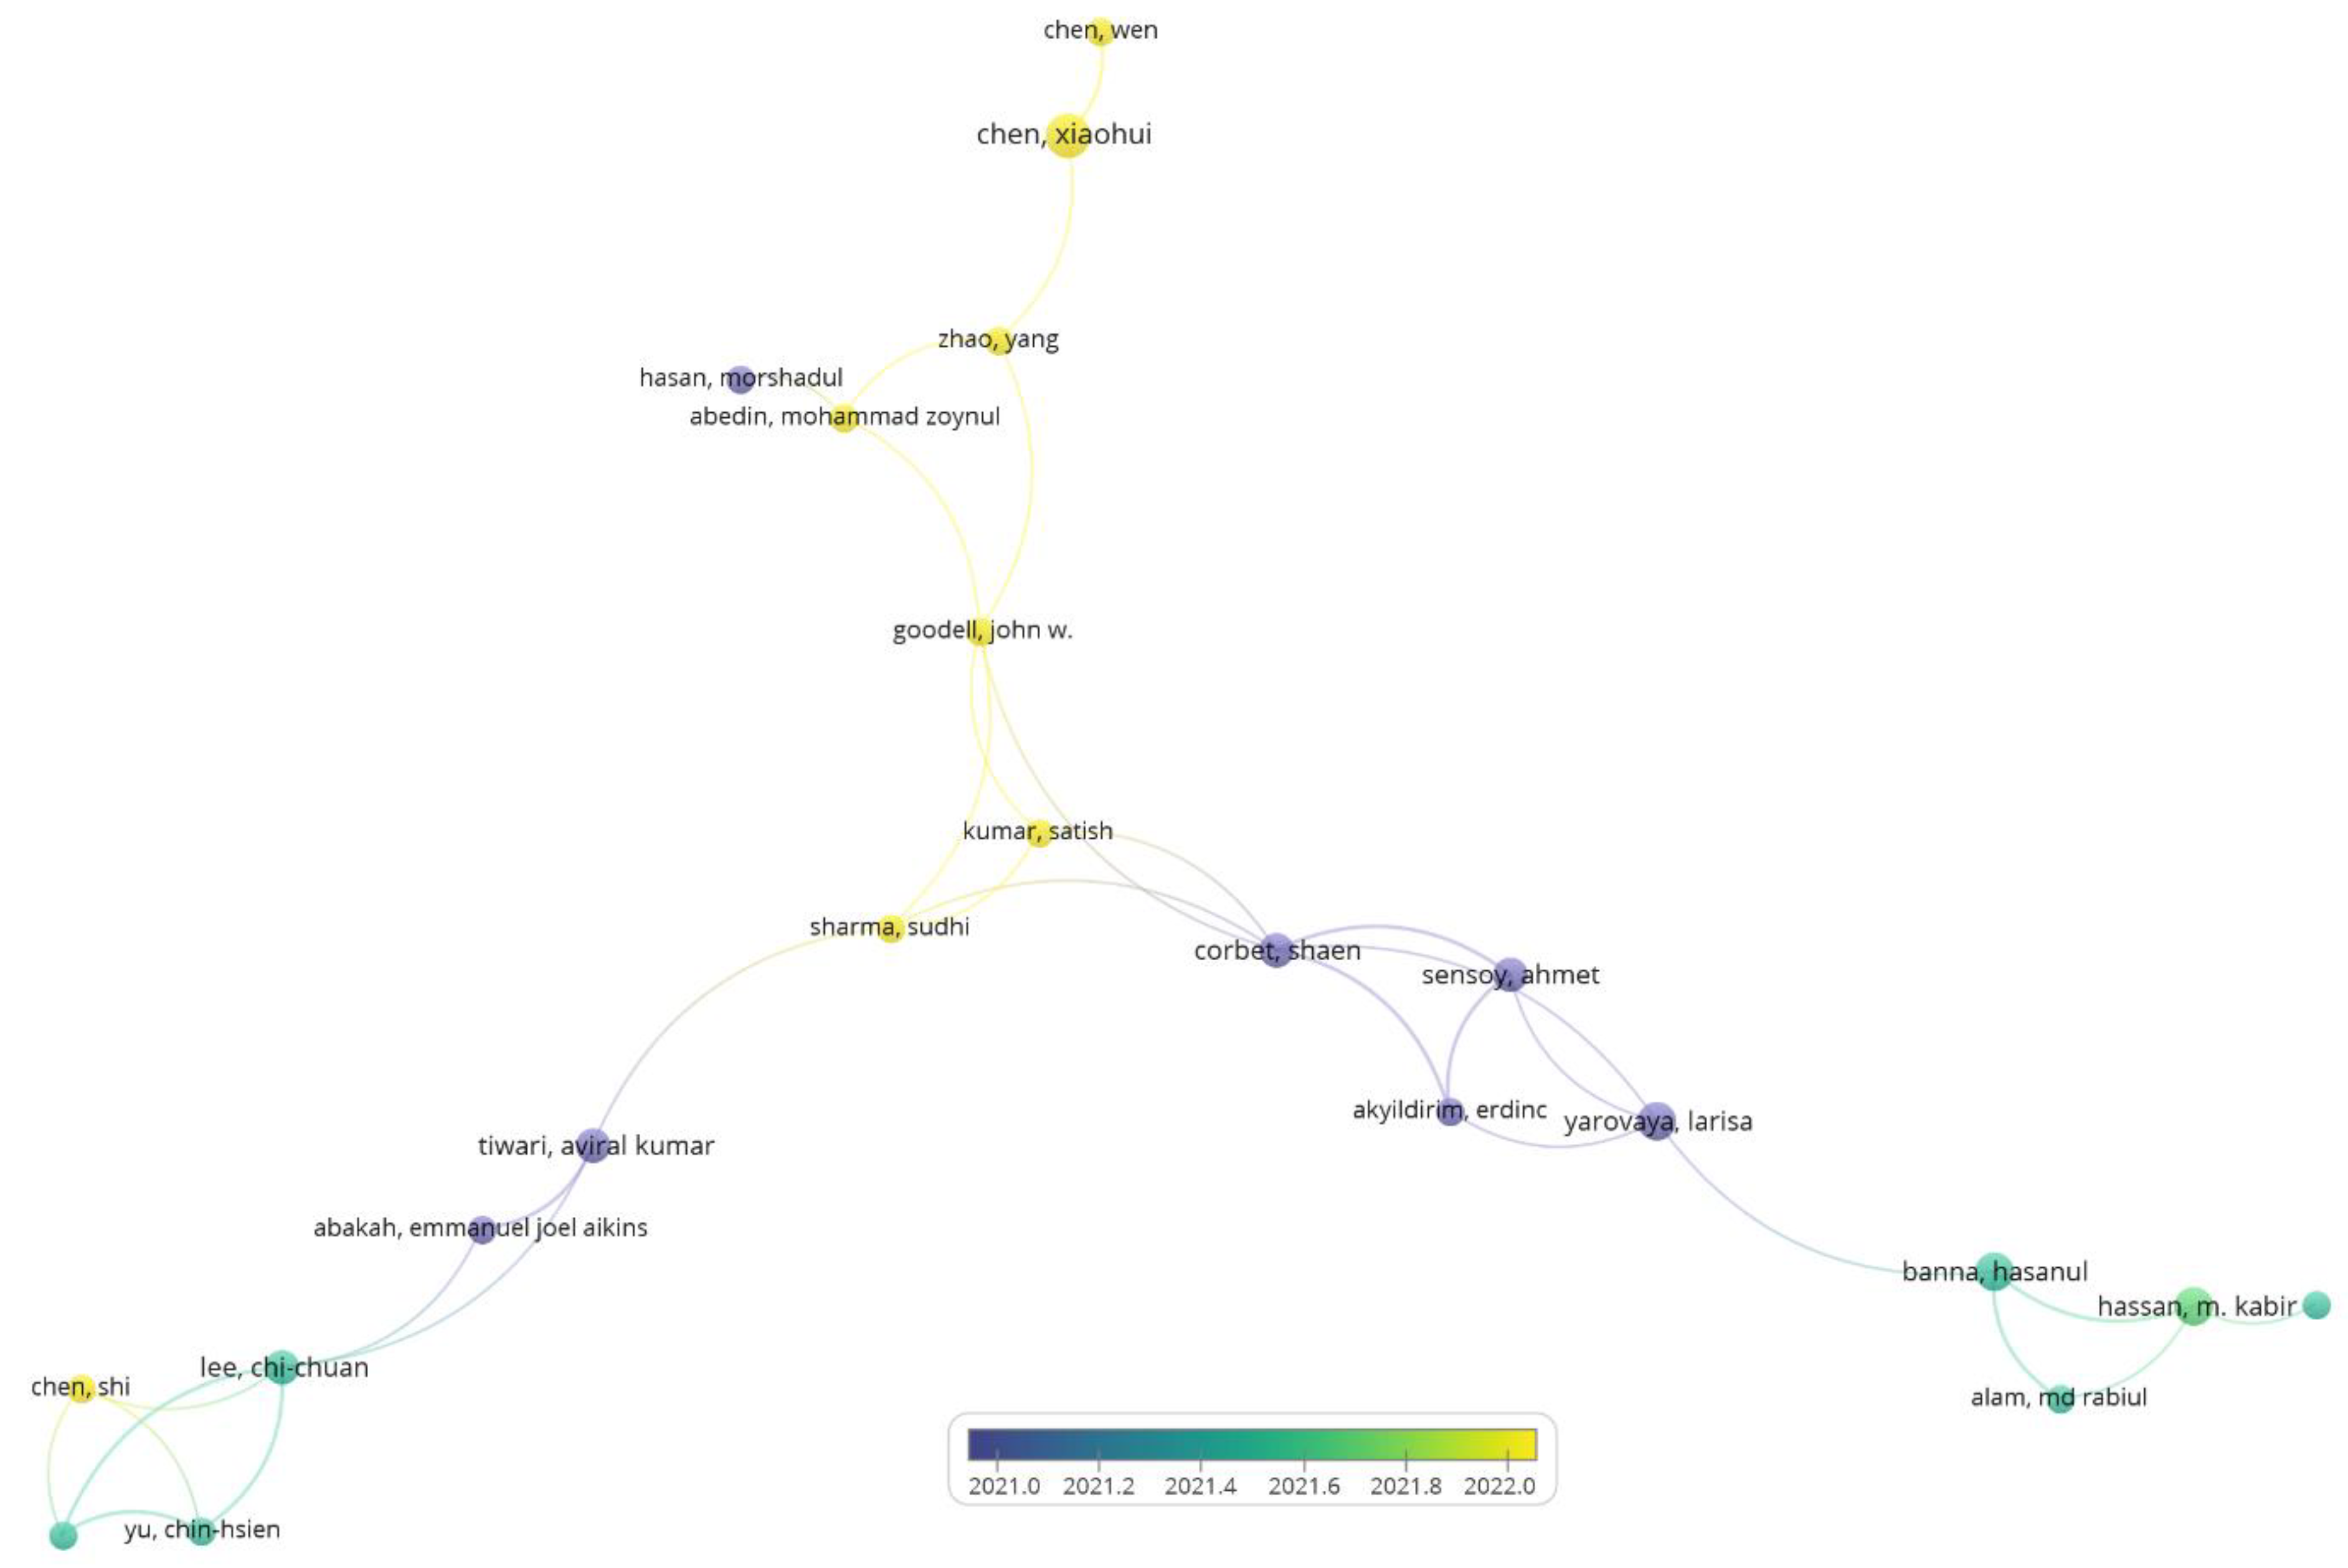
Figure 5.
Time-overlay co-authorship in FinTech research.
Figure 5 shows the time overlay of author collaboration in FinTech research. The darker the color, the earlier the authors participated in co-authorship. The result shows that clusters 3 and 6 comprised the first authors to be involved in co-authorship (see the time slice indicator in Figure 5). After that, collaboration appeared in clusters 2 and 4. Finally, collaboration occurred in clusters 1 and 5.
4.2.2. Institutional Collaboration Networks
By analyzing the institutional relationships of research collaboration, scholars will be informed about how academic information is exchanged in scientific collaboration [3]. Table 3 lists the top ten most collaborative affiliations in FinTech research. It shows that Hong Kong University is positioned at the top, followed by the University of Sydney, University of Luxembourg, University of New South Wales, Australia, Shanghai University of Finance and Economics, and others. It should be noted that UNSW Sydney and Univ. New South Wales are treated as different entries, appearing as fourth and eighth in the top ten and in clusters 10 and 11, respectively, even though they are one university. After combining the two entries, the University of New South Wales ranks as the most collaborative university for FinTech research in terms of links (18), total link strength (40), total articles (23), and total citations (448).
Table 3.
Top 10 most collaborative affiliations in the FinTech field.
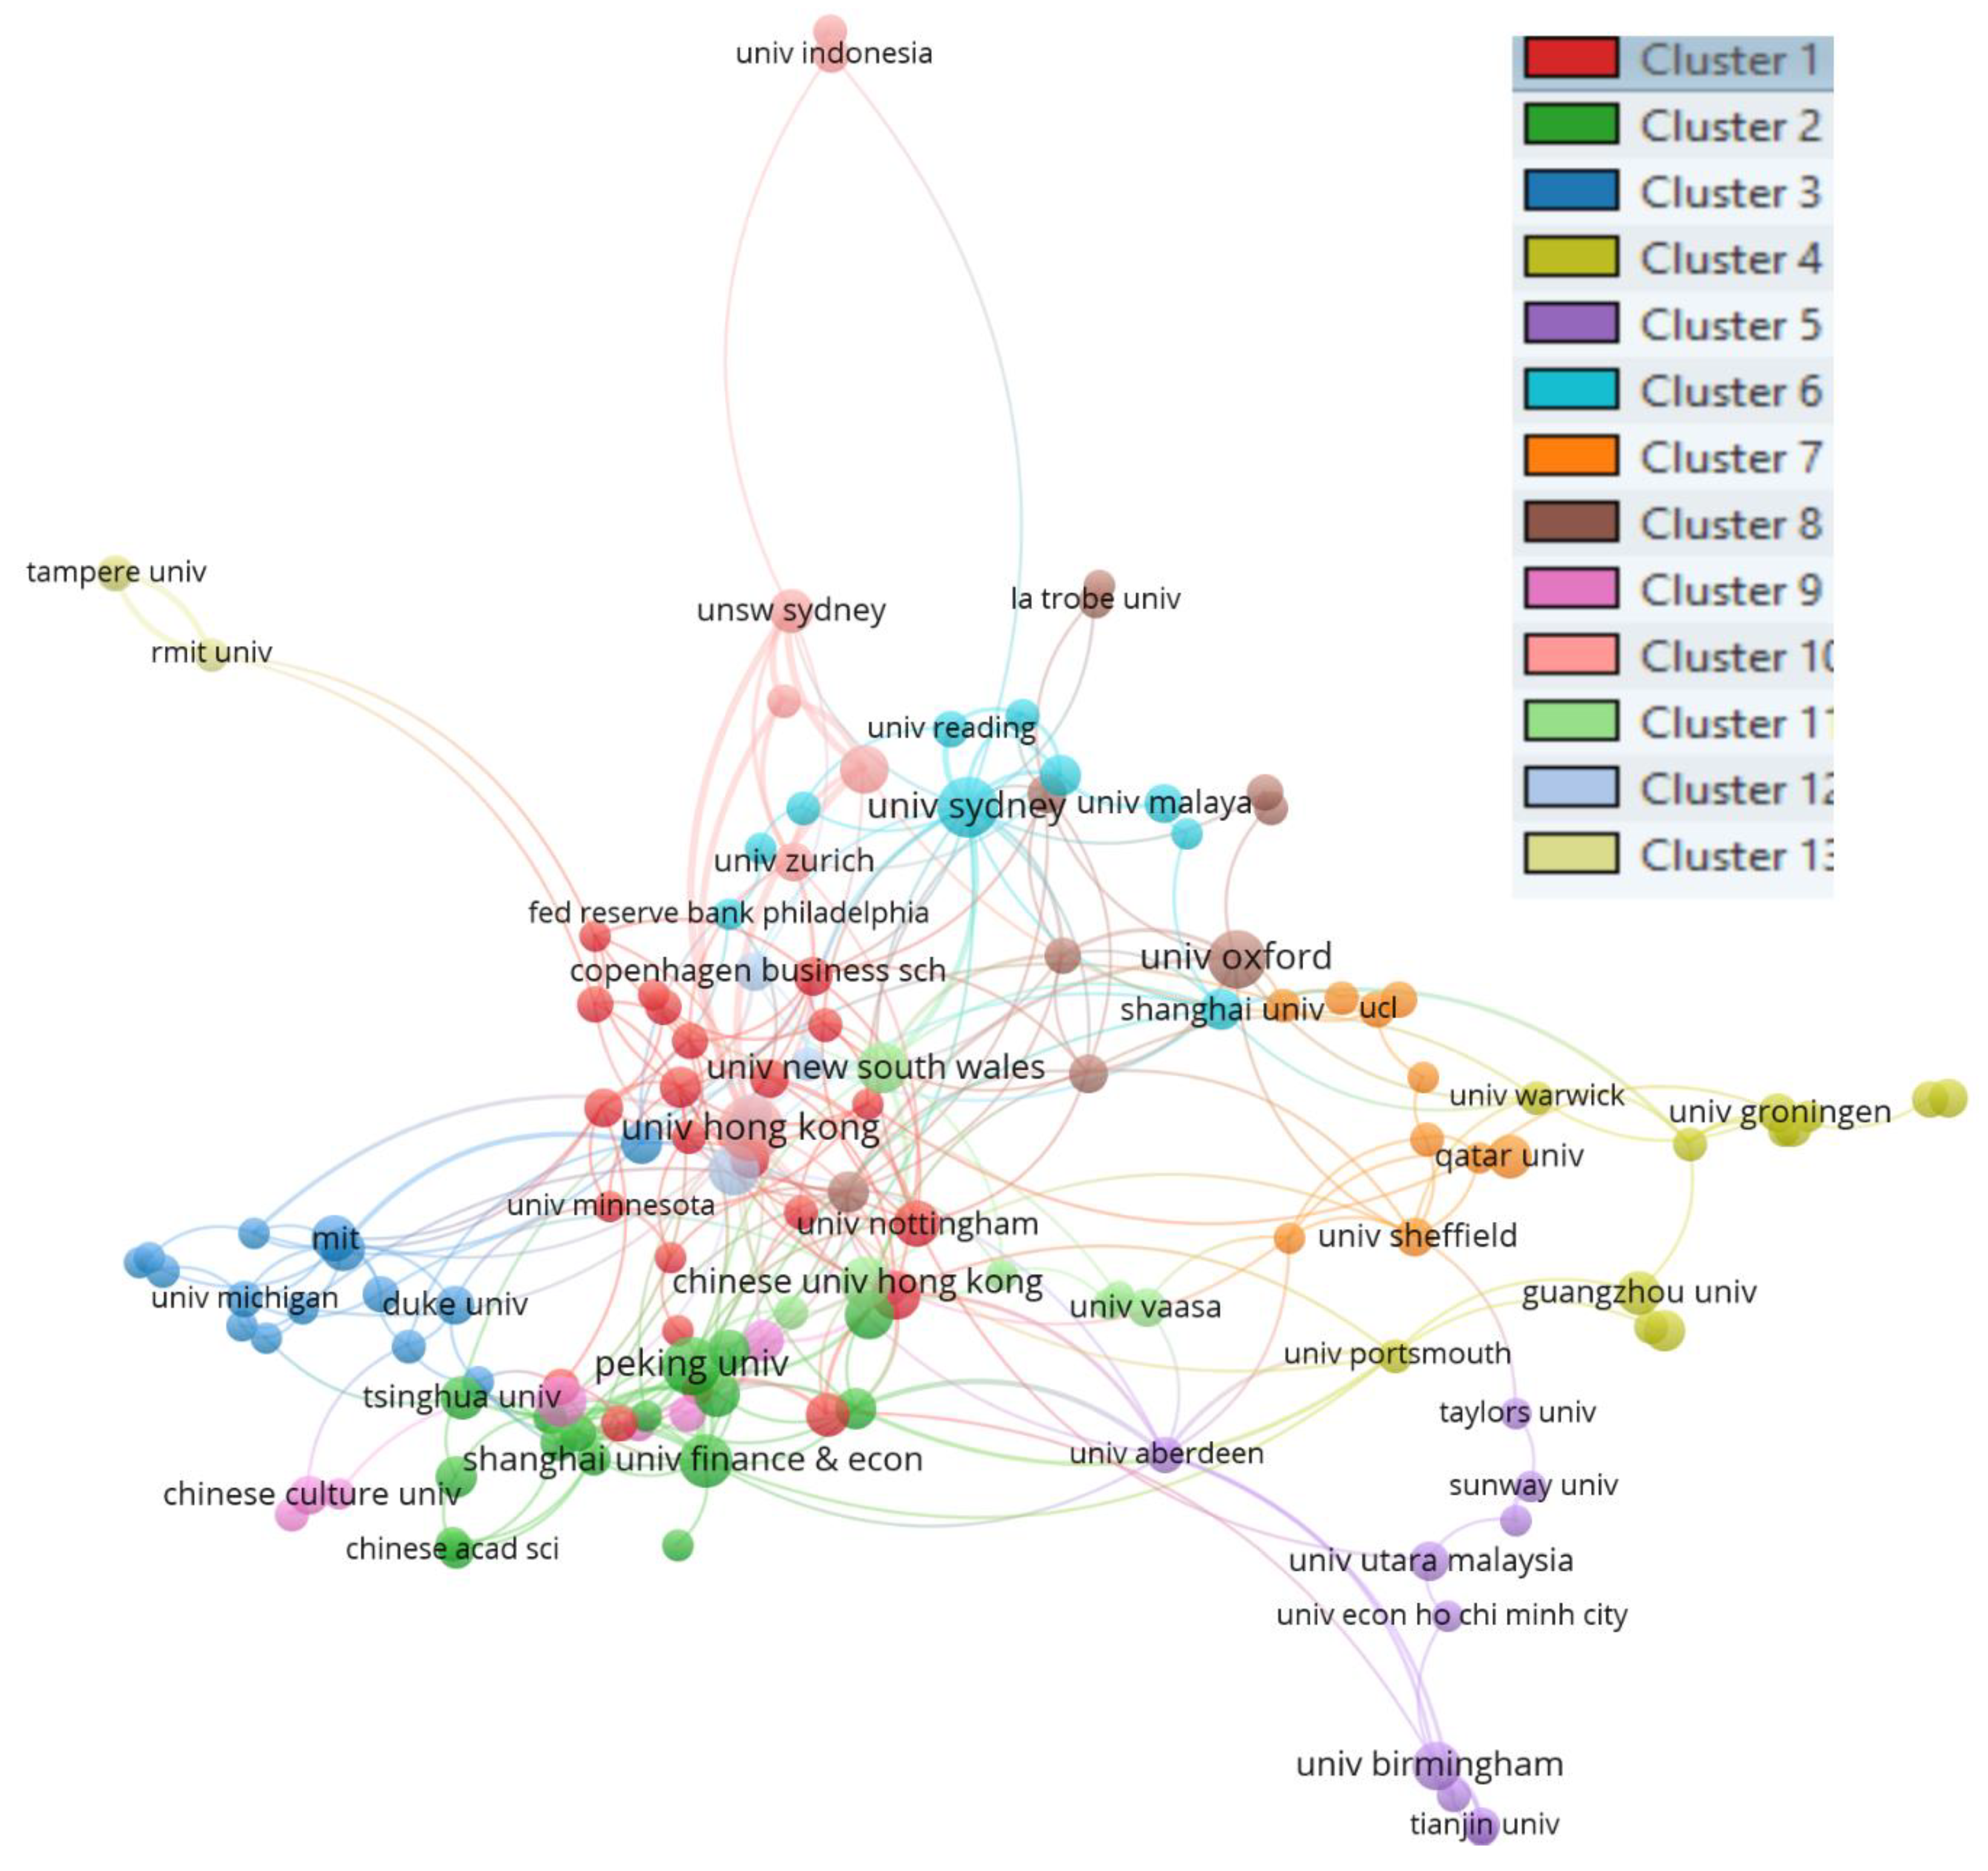
Figure 6 illustrates the collaboration network of affiliations in FinTech research based on 1792 publications with contributions from 2073 different institutions in 13 clusters. The size of the node indicates the total link strength in collaboration networks.
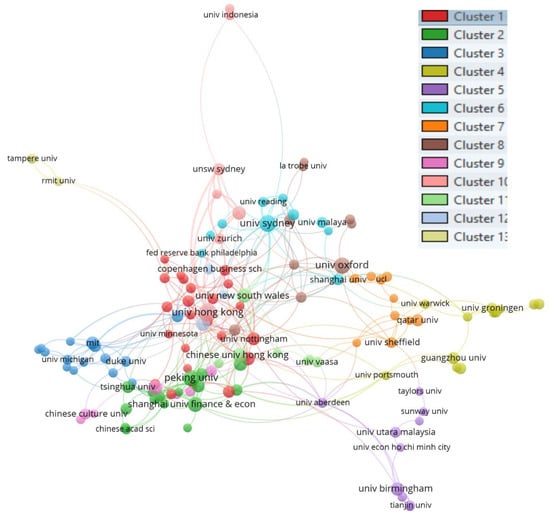
Figure 6.
Institutional collaboration networks in FinTech field.
The percentages for affiliations credited with FinTech-related publications were as follows: 32.47% (n = 673/2073) with two publications; 18.14% (n = 376/2073) with at least three publications; 11.33% (n = 235/4473) with four publications; and 7.67% (n = 159/2073) with five or more publications. To find the prominent authors (n = 159) who published work on the topic of FinTech, the threshold value was set at five when creating affiliation data based on the co-authorship map. Despite this, only 136 affiliations were connected with one another.
Based on the average year of the published articles for each cluster (Table 4), clusters 7, 3, 11, 6, 10, 8, and 1 were established in 2020, and clusters 13, 4, 5, 12, 2, and 9 were formed in 2021. Therefore, there was no institutional cluster created before 2020. This result is consistent with the author collaboration analysis in Section 4.2.1.
Table 4.
Cluster description of clustering network of affiliation collaboration.
When sorted by total link strength, cluster 10 is positioned at the top (total link strength valued at 17 and links at 7), followed by cluster 2 (9, 7), cluster 13 (9, 3), cluster 6 (8, 5), cluster 8 (7, 6), cluster 11 (7, 5), cluster 1 (6, 6), cluster 5 (6, 3), cluster 3 (5, 5), cluster 12 (5, 4), cluster 9 (5, 4), cluster 7 (4, 4), and cluster 4 (4, 3). The results highlight the total strength of the links of each cluster with other clusters.
When sorted by the average number of publications for each cluster, the sequence was cluster 10 (10 articles), 2 (9), 8 (8), 11 (8), 12 (8), 6 (8), 9 (8), 1 (7), 4 (7), 3 (7), 5 (7), 7 (7), and 13 (6). The results show no direct connection between the size of the cluster and the average number of articles published. When considering the average links and average total link strength, it can be noticed that the average number of publications tended to have the same trend as the average links and average total link strength. The average total citations and average normalized citations also had the same trend as the average number of publications, as Table 4 shows.
Table 5 lists all clusters ranked by the total link strength and affiliations in each cluster. Cluster 1 was the largest, with 23 affiliations, and was led by the University of Edinburgh, the University of Nottingham, and Singapore Management University (one Asian and two European). Cluster 2 was led by three Chinese universities: Shanghai University of Finance and Economics, Peking University, and Fudan University. Table 5 shows that most of the universities in cluster 2 were Chinese universities. The results express a significant interest in geographic affiliation collaboration in FinTech research, particularly inter-country collaboration.
Table 5.
Affiliations in each cluster (total 135 affiliations, ranked by the size of the cluster).
The smallest cluster was cluster 13, which only contained three universities: RMIT University, Singapore University of Social Sciences, and Tampere University. The cluster’s average links, total link strength, total number of articles, total citations, and normalized total citations were 3, 9, 6, 43, and 6.15, respectively. In comparison with the average values for all affiliations of 8, 12, 9, 145, and 12.98, the values of cluster 13 were noticeably low. Whether the size of the cluster is related to these values requires further investigation.
Wu et al. (2019) [3] found that papers generated by institutional cooperation accounted for 56.6% of all SCI journal papers, followed by papers produced through intra-institutional collaboration (accounting for 36.1%) and those produced without collaboration (accounting for only 7.4%). Our VOSviewer analysis shows that the average number of links was eight out of nine, which equaled 89% of institutional collaboration for all published articles in the FinTech field, which was much higher than the previously identified 56.6% for SCI journal papers. This indicates that Fintech research collaboration among affiliations is strong in comparison with other disciplines.
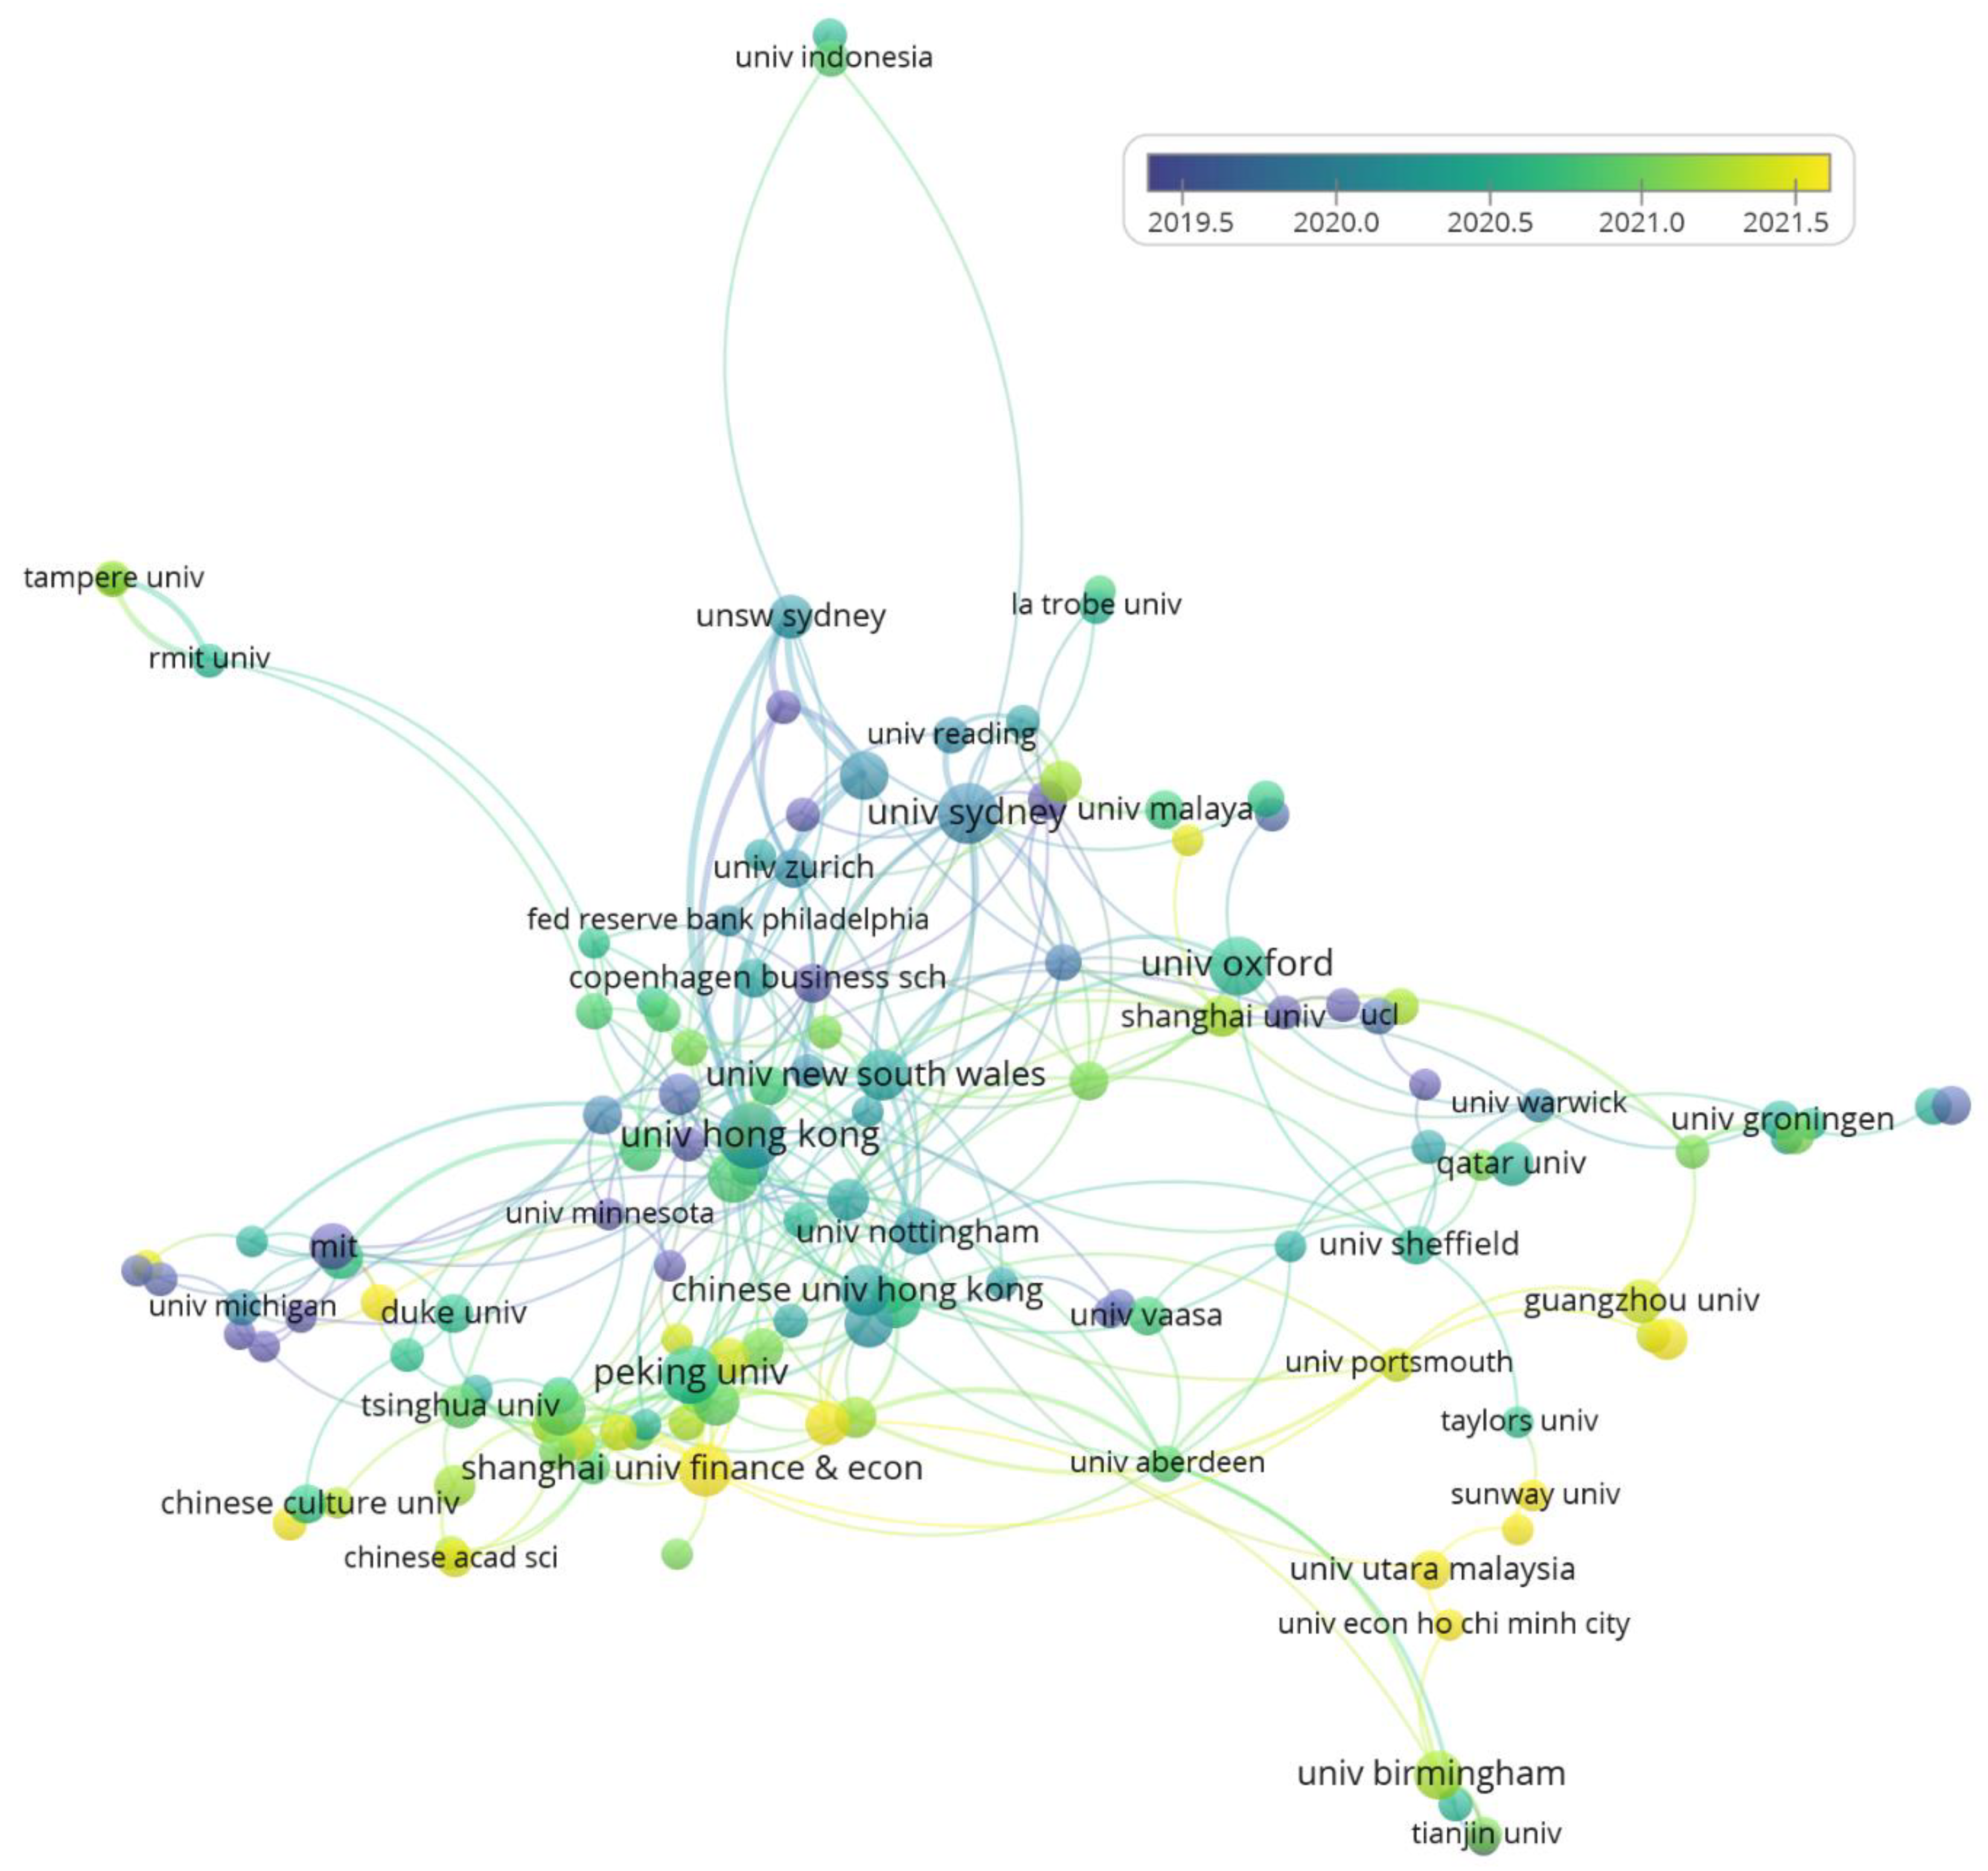
Figure 7 shows the time overlay of the collaboration network’s formation in FinTech research and the time of affiliations participating in the conversation. The darker the color, the earlier the cluster was established. The figure indicates that the earliest nodes joined the networks in early 2019, despite the networks being established in 2020 and 2021, assessed by the average publishing year.
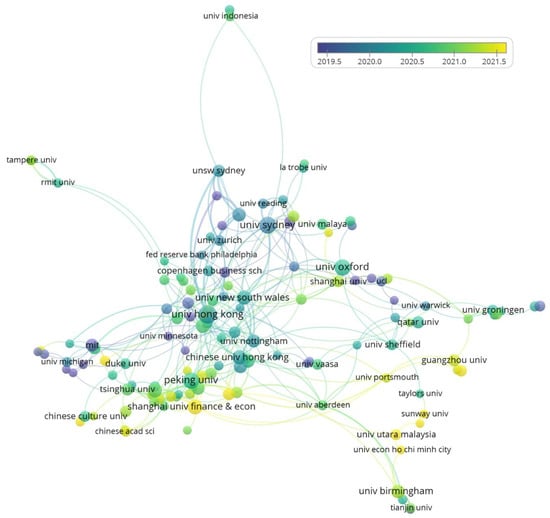
Figure 7.
Time overlay of institutional co-authorship in FinTech field.
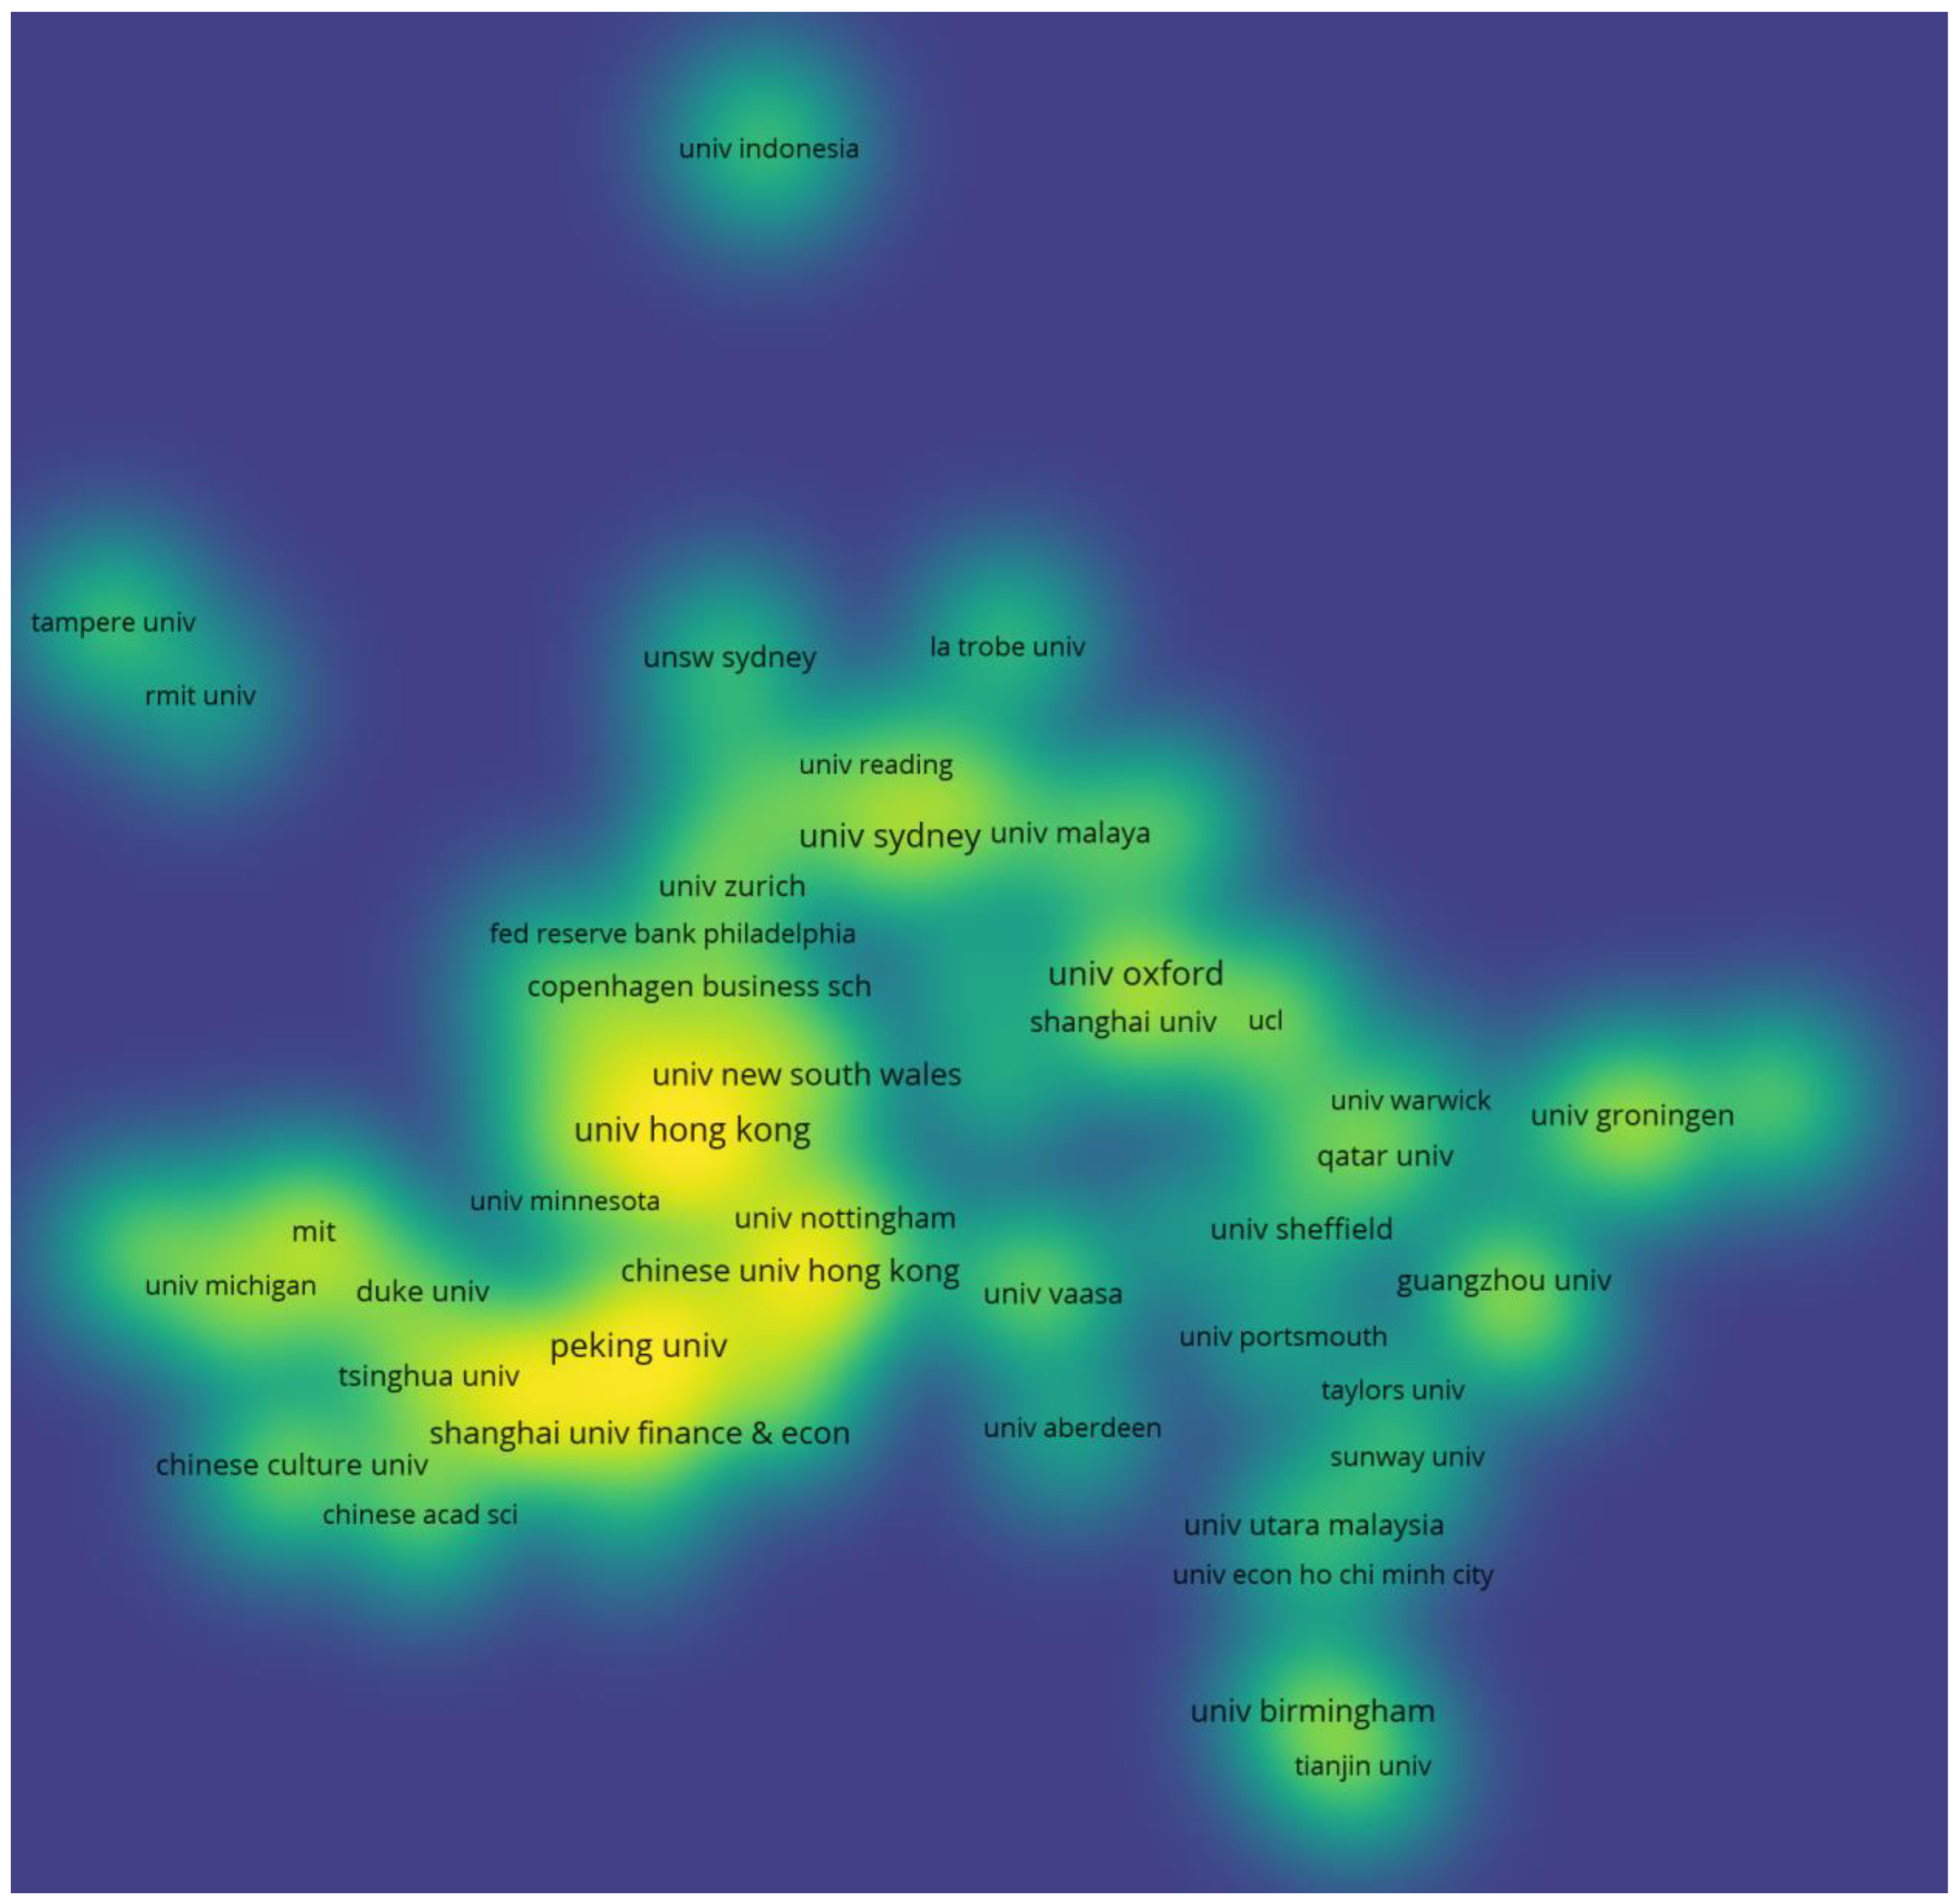
In Figure 8, thirteen major clusters can be distinguished by the size and the brightness of some nodes.

Figure 8.
Density view of co-authorship networks of institutions in FinTech.
4.2.3. Countries’ Collaboration Networks
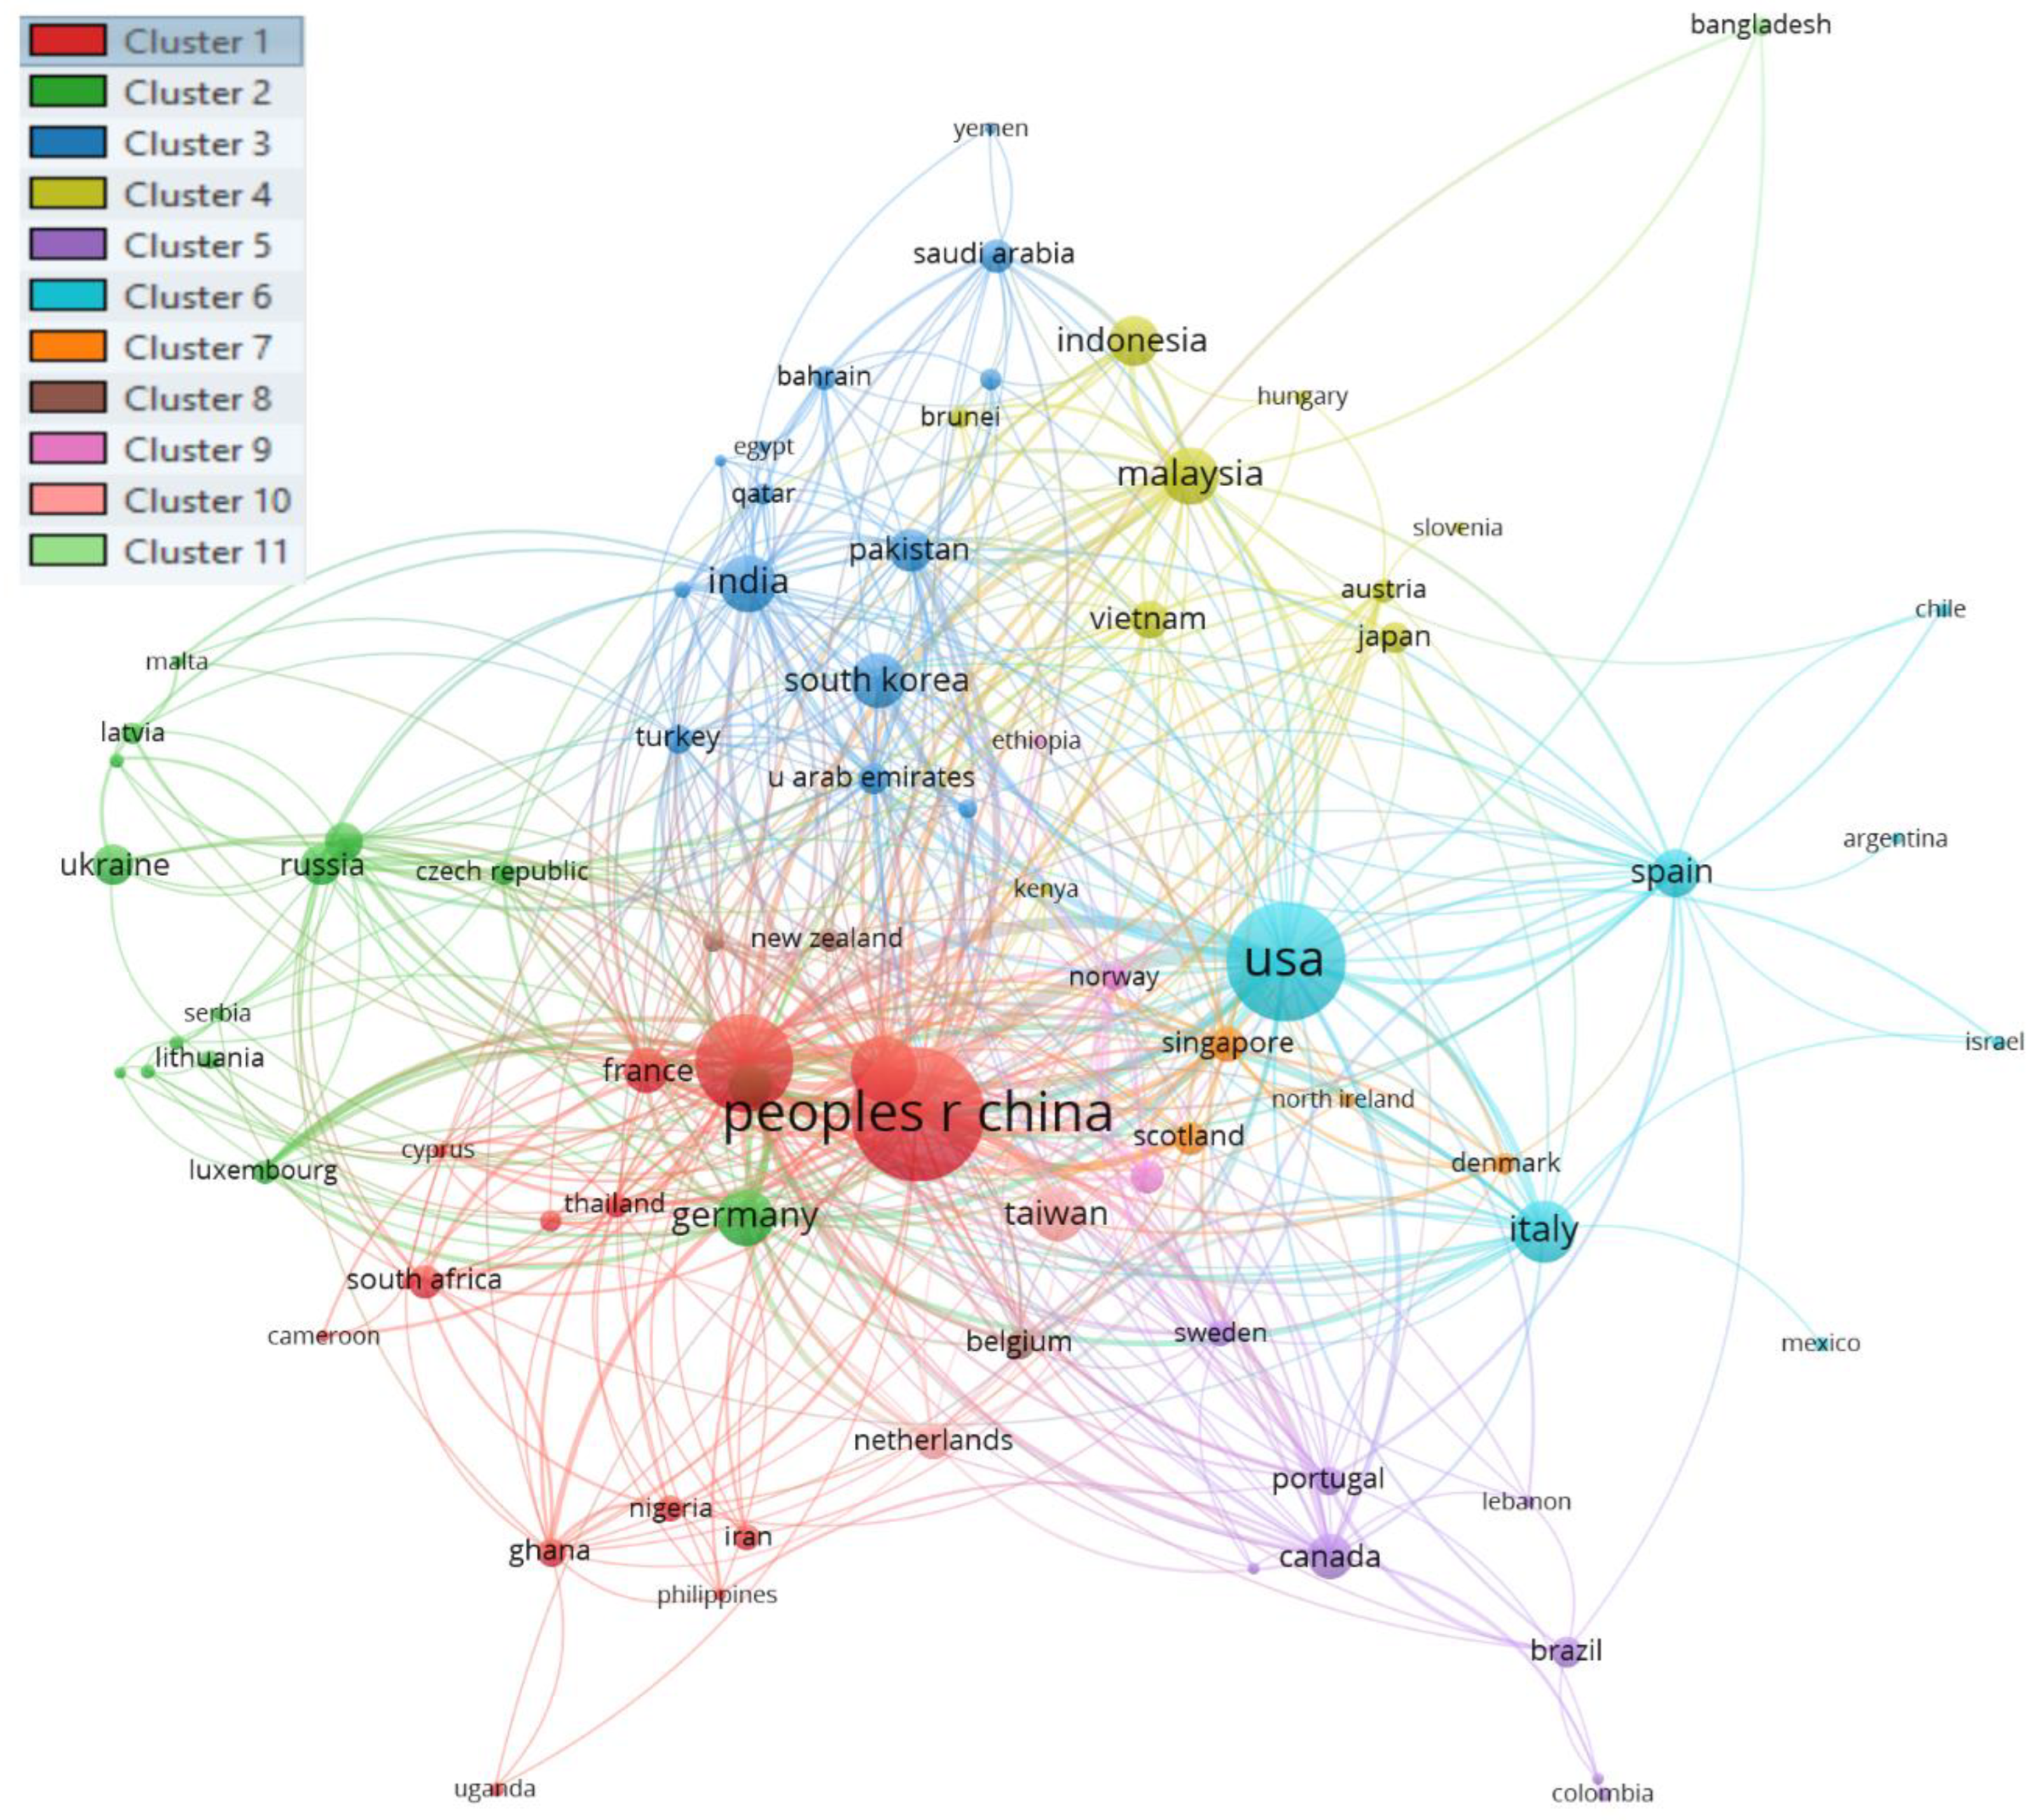
By setting the minimum number of articles of a country to three, Figure 9 provides a VOSviewer visualization of 81 out of 105 countries that met the threshold in 11 clusters. Figure 10 is a time overlay of country collaboration in FinTech field to represent the starting year of collaborations. The co-authorship analysis of countries illustrates the degree of collaboration between countries in the FinTech field. Nodes with a large size represent the most productive countries in the FinTech field; nodes with a thicker and longer link represent countries with a cooperative relationship. As shown in the figure, the 81 most productive countries were grouped into 11 collaboration clusters that were distinguished by different colors. China had the highest total link strength with 416 documents and a link strength of 291, followed by England with 217 documents and a total link strength of 265. The USA was in the third position, with 324 documents and a total link strength of 247 (Table 6).
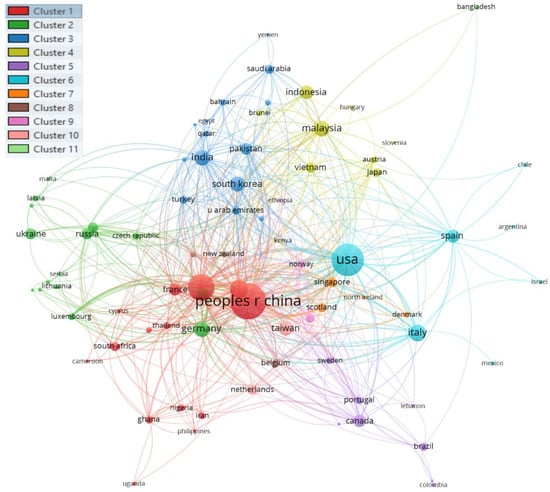
Figure 9.
Collaboration network of countries.

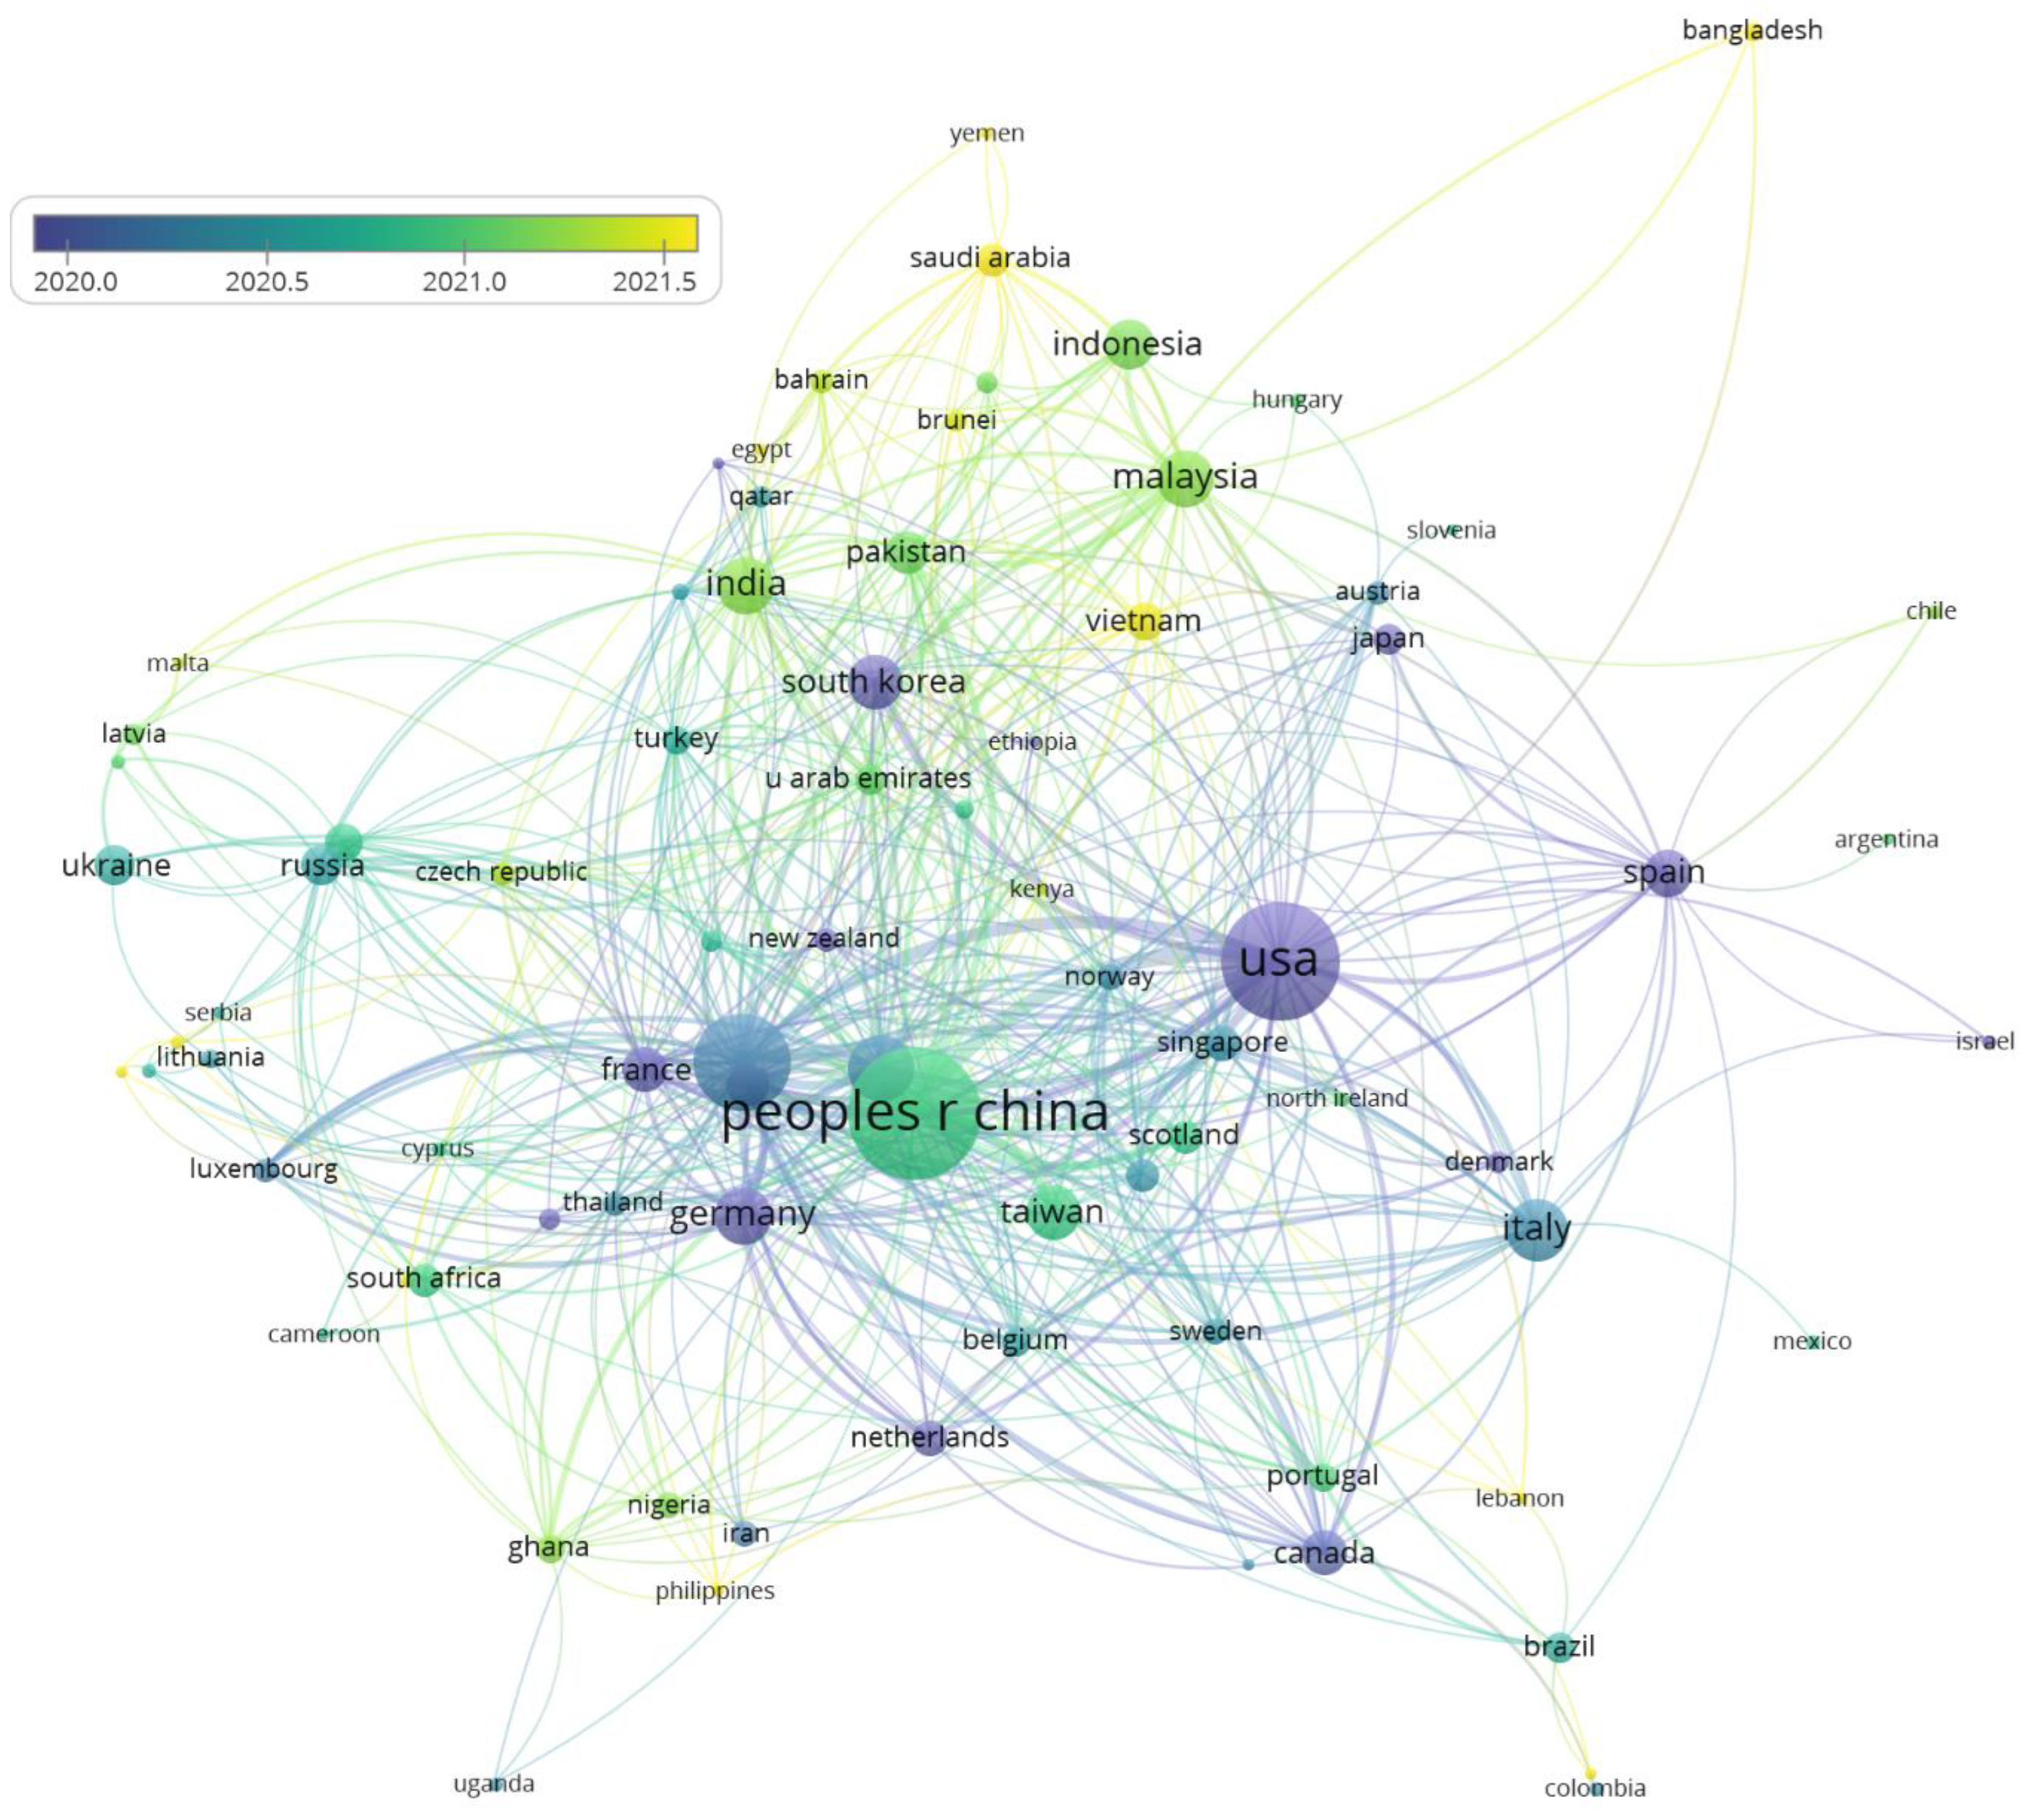
Figure 10.
Time overlay of country collaboration in FinTech field.
Table 6.
Clustering collaboration network of countries.
Cluster 1 contained 15 countries, including five Asia–Pacific countries (Peoples R. China, Australia, Thailand, Philippines, and Iran), six African countries (South Africa, Ghana, Nigeria, Morocco, Uganda, and Cameroon), and four European countries (England, France, Cyprus, and Romania). This was the largest cluster of collaboration networks in FinTech research with a combination of countries from Asia–Pacific, Europe, and Africa. The dominant players were Peoples R. China, England, and Australia.
Cluster 2 consisted of 15 countries, mainly from Europe. They were Germany, Switzerland, Russia, Luxembourg, Poland, Czech Republic, Latvia, Ukraine, Greece, Malta, Serbia, Slovakia, Estonia, Lithuania, and Bulgaria.
With 14 countries, Cluster 3, which contained India, Pakistan, South Korea, U. Arab Emirates, Turkey, Saudi Arabia, Tunisia, Bahrain, Qatar, Wales, Jordan, Oman, Egypt, and Yemen, was mainly South Asia and Middle East countries.
Cluster 4 consisted of nine countries, including Malaysia, Vietnam, Indonesia, Austria, Japan, Brunei, Kenya, Hungary, and Slovenia. Most of them were Asia–Pacific countries.
Cluster 5 comprised mainly European and North and South American countries including Canada, Portugal, Sweden, Brazil, Lebanon, Croatia, Peru, and Colombia.
Cluster 6 was similar to cluster 5 insofar as it contained European and North and South American countries, including the USA, Italy, Spain, Chile, Argentina, and Mexico, as well as one in the Middle East, Israel.
These top six clusters comprised the key countries involved in collaboration networks for the study of FinTech. Clusters 7 to 11 were all small networks. The evidence shows that continental geographic networks were a distinguishing characteristic of country collaboration. Some collaborations mainly occurred within one continent, such as Cluster 2, which contained European countries only.
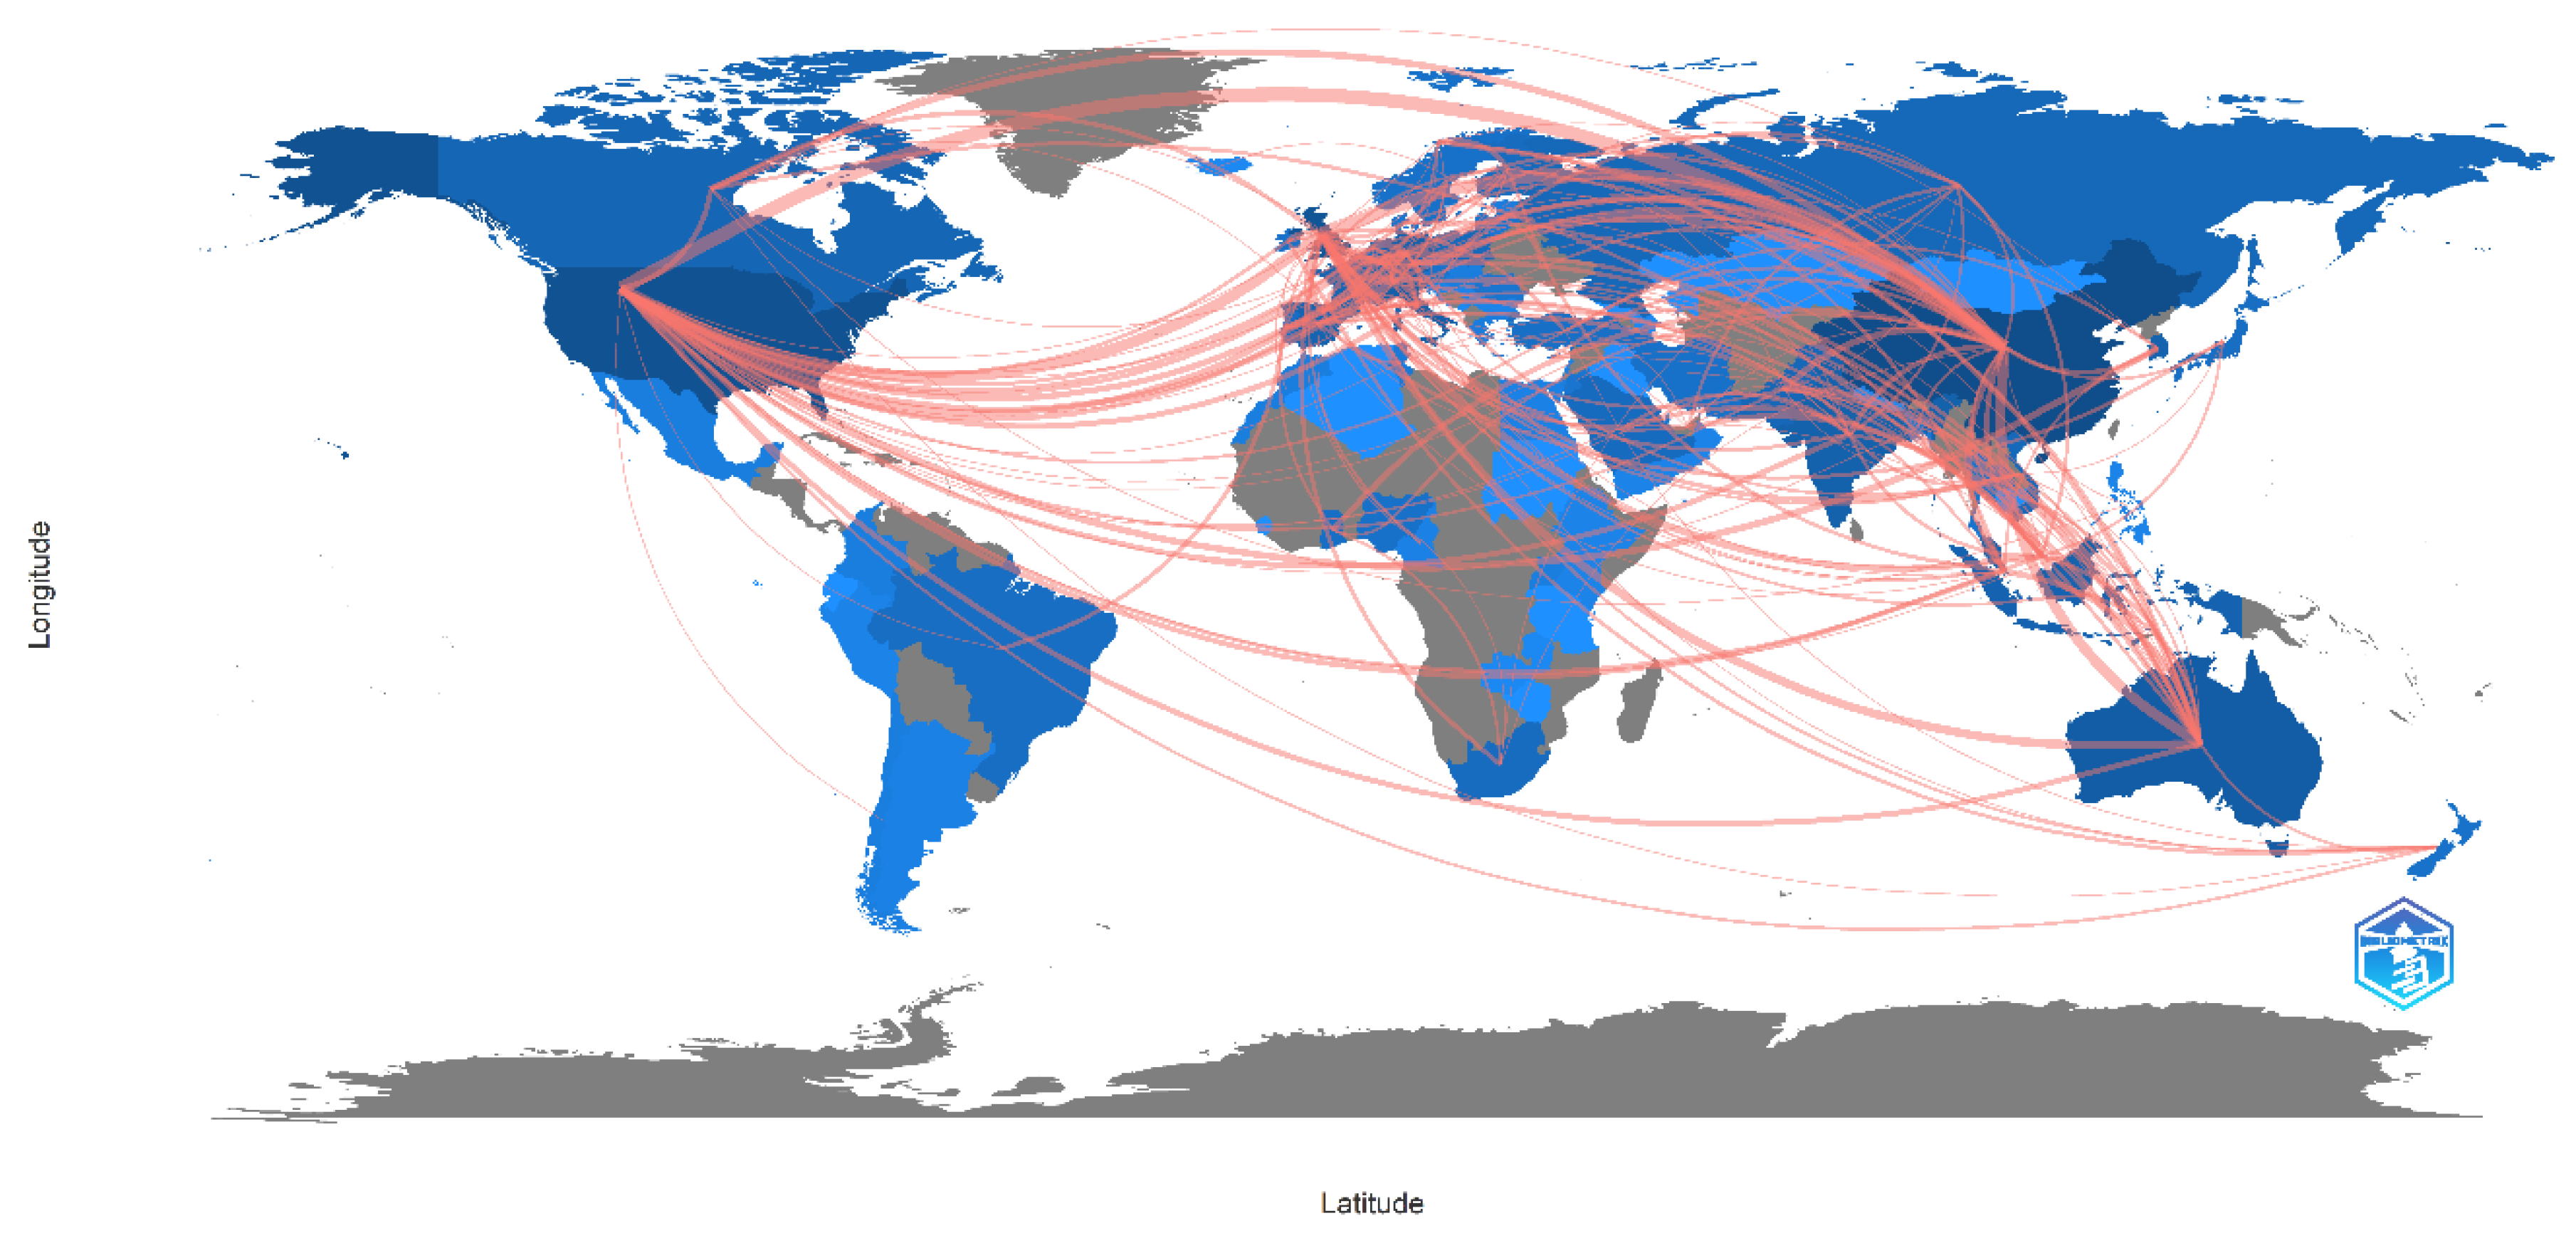
The collaboration of countries’ scientific production in FinTech can also be presented in a world map of the linkage of the countries (Figure 11).
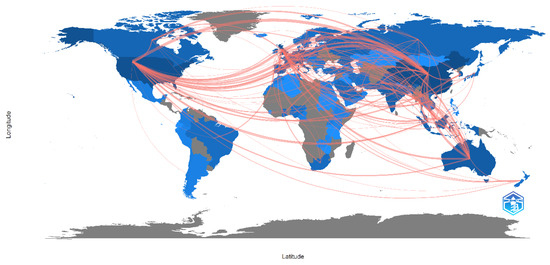
Figure 11.
World map of the linkage of countries’ collaboration.
5. Conclusions
This study explored the scientometric indicators in the field of FinTech through bibliometric analysis, which has been defined as quantitative research on research and the science of science [6]. In this study, we conducted a detailed systematic analysis and description of FinTech research collaboration among authors, institutions, and countries. Research questions were proposed and addressed using a bibliometric methodology consisting of analyses of scientific performance and the collaboration activities of authors, institutions, and countries. Here, we summarize the results and, on that basis, identify areas for future research.
The results of the performance analysis revealed that the FinTech field’s development has been through three phases: a slow-growing (initiation) period (1999–2016) in which the number of publications increased from two to eight; a medium-growing (development) period (2017–2019) in which the number of publications increased from 48 to 147; and a fast-growing period (2012–2022), in which the number of publications grew from 290 to 556. The results suggest that FinTech research has not been negatively affected by COVID-19 so far. However, the characteristics of the three phases are beyond the scope of this paper and, thus, are worth further investigation.
The research results are of great interest to FinTech scholars, institutions, and policymakers. To improve communication among academics in the same field, scholars must be familiar with the existing networks in the field. It is important that institutions are aware of the best institutional networks for their current projects and research findings. By doing so, institutions can avoid duplicating projects and recruit the best partners. The country networks provide policymakers with information regarding the available resources for cooperation. Based on the author’s knowledge, this is the first FinTech literature review focusing on three levels of collaboration among authors, institutions, and countries. In comparison with other reviews (Appendix A), scholars will benefit from various findings, which include (1) the place of origin of new knowledge and field development; (2) the scale of population and groups of FinTech research activities; (3) the resource of developing lifelong relationships and bonds; (4) the sources to gain people’s wisdom, skills development, and increasing productivity; (5) the dataset of successful academics with whom to associate and share recognition and accolades; (6) cutting costs; (7) the way to access more funds as some funding bodies only support collaborative projects; and (8) the way to contribute to the cross-fertilization of knowledge and pool knowledge for tackling large and complex problems.
The author collaboration analysis revealed six clusters. The results showed that all collaborations occurred in the last four years, even though FinTech research started in 1999. There was a lack of author collaboration before 2019. The analysis showed that only a small proportion of authors (23 out of 4473) have engaged in collaboration. Further statistical analysis illustrated that the average number of publications for all authors who engaged in collaboration was three, which is reasonably low in comparison with the research results for other fields (refer to Section 4.2.1). In addition, the visualization showed that one cluster (cluster 5) played a key role in researchers’ collaboration, since it linked all clusters as one, as Figure 4 depicts. The reason why only a small proportion of the authors participated in collaboration networks requires deeper examination.
Regarding institutions, 136 out of 2037 (6.5%) participated in collaboration networks. The analysis revealed that the average links and total link strength for an affiliation (node on the figure) were 8 and 12 nodes, with Sydney University, Hong Kong University, and Shanghai University of Finance and Economics topping the list. The percentages of the numbers of publications by institutions were as follows: 32.47% published two articles; 18.14% published three articles; 11.33% published four articles; and 7.67% published five or more articles.
When considering the average links and average total link strength, this study found that the average number of publications tended to follow the same trend as the average number of links and average total link strength. In addition, the average total and normalized citations also followed the same trend as the average number of publications. The author noticed that, in comparison with the average values for all affiliations in links, total link strength, and number of publications and citations, the values of small clusters were noticeably low. However, whether the size of the collaboration network relates to these attributes requires further investigation.
In terms of country collaboration, 81 out of 105 (77%) countries had international collaborations. The average number of links and total link strength were 14 and 34 nodes, respectively, for internationally collaborative countries. Three of the most collaborative countries were revealed to be England, the People’s Republic of China, and the United States. This study also found that collaborative countries were often geographically interconnected, with 11 major clusters identified as representing country-to-country collaboration. There was a large proportion of developing countries on the list of co-authorship.
There is no doubt that systematic literature reviews are valuable vehicles for advancing knowledge and improving research [17]. This research contributes to FinTech literature by providing a more extensive view of collaborations in existing studies in the field. Future FinTech collaboration studies should anticipate multiple research contexts as shown by the results by countries’ collaboration networks, such as developed and developing countries, large and small countries, and North American and Asian countries, given that FinTech is a complex phenomenon that requires the involvement of various parties and technologies. From an institutional perspective and the results from the institutional collaboration perspective, there is a lack of studies from institutions in African countries. Furthermore, each collaborative author in FinTech research only contributed a small number of papers in comparison with other subjects, such as the sharing economy [23,34] and entrepreneurship [1].
As one of the first studies to describe research collaboration in FinTech systematically, it is important to highlight its limitations. We included book chapters, early access articles, proceedings papers, and review articles in order to ensure a holistic analysis of the FinTech literature, which may have resulted in different results from the studies that solely focused on journal articles. In spite of the fact that the results of this study were based on the WoS database, it is acknowledged that other databases, such as Scopus, may produce results that are not statistically significant. Finally, bibliometric results should always be interpreted cautiously since no database is perfect and some inclusive criteria might be biased by over-representing journals that use the English language.
Funding
This research received no external funding.
Conflicts of Interest
The author declares no conflict of interest.
Appendix A. Examples of Systematic Literature Reviews in FinTech
| Reference | Focuses of the Review | Findings and Contributions |
| [17] | FinTech and institutions | A framework for describing the changes in institutional models proposed by FinTech. This framework is based on a regulatory and financial institution adaptive perspective. Using this framework, we can clarify how FinTech modifies institutional behavior. |
| [18] | Blockchain and its potential applications | Identifying the business value generated by transactions, crypto-economic models, and automated and analytical processes involving organizations, individuals, and technologies. Blockchain-based applications solve various economic problems, such as storing/sharing information and generating consensus. |
| [19] | Green finance in developing countries | Green securities, green investments, climate finance, green insurance, green credit, green bonds, and green infrastructure are the primary green finance products offered by Bangladeshi banks. Additional factors include environmental performance, green economic growth, energy efficiency, green finance policies, environmental protection, and the impact of a bank’s policy formulation on risk. |
| [35] | Crowdfunding and P2P lending research | This study provides an overview of the current state of crowdfunding and peer-to-peer lending literature. Furthermore, it provides details on the co-citation analysis of authors, the co-occurrence analysis of author keywords, and the citation analysis of documents. Finally, the paper discusses the future directions for research in this burgeoning field. |
| [36] | Blockchain in FinTech | Fintech ecosystems are always evolving into new regimes. Blockchain is here to stay and is slowly permeating all aspects of society. Based on the categories of distributed ledger technologies and the most widely used blockchain platforms, a taxonomy of blockchain platforms was developed. After describing each Fintech ecosystem extensively, the paper presents use cases. Furthermore, it concludes that blockchain, at least in enterprise contexts, still faces a number of challenges due to its infancy. |
| [37,38] | Financial innovations | Based on the analysis, disciplines differ in their research methodologies, units of analysis, data sources, and innovations. There was a positive trend in the number of articles published during this period. The majority of studies, however, have been conducted in the USA and Europe, and less so in other parts of the world. In light of the three market disruptions, the literature synthesis identifies research gaps in the available research that highlight future research opportunities. Due to disruptions within and outside the industry as well as the entrance of new generations of consumers, the financial services industry is on the brink of a new era. In addition, the financial industry has become a fertile ground for innovative services, processes, and business models. In this way, financial innovations can bridge the gap between product and service innovation research. |
| [39] | Crowdfunding and token issues in FinTech | Contrary to traditional methods of raising funds, these innovations: (1) use modern technology (online transactions, blockchain, etc.) much more actively; (2) are usually faster in reaching potential investors/funders; and (3) utilize more active network benefits, such as large interactions between investors/funders and between funders and firms. |
| [40,41] | Impact of COVID-19 on FinTech | The outbreak of COVID-19 has caused significant economic issues including risky stock market and trade price movements, decreased bank performance, fluid crisis, and credit rating failures. |
| [34] | Artificial intelligence in FinTech | At the beginning of this century, AI research was focused on credit risk in the financial sector. Expert systems were increasingly replaced by data-driven, “algorithmic” AI during the 2010s. There was a lot of hype around big data in that decade, which faded later due to unsuccessful implementation. There is a great deal of published research on big data that relates to machine learning and deep learning, but not to big data in itself. |
References
- Duan, C. Knowledge mapping of entrepreneurship research during COVID-19 and forecasting research directions for the post-pandemic era. Aslib J. Inf. Manag. 2023. ahead-of-print. [Google Scholar] [CrossRef]
- Green, B.N.; Johnson, C.D. Interprofessional collaboration in research, education, and clinical practice: Working together for a better future. J. Chiropr. Educ. 2015, 29, 1–10. [Google Scholar] [CrossRef]
- Wu, W.; Xie, Y.; Liu, X.; Gu, Y.; Zhang, Y.; Tu, X.; Tan, X. Analysis of Scientific Collaboration Networks among Authors, Institutions, and Countries Studying Adolescent Myopia Prevention and Control: A Review Article. Iran J. Public Health 2019, 48, 621–631. [Google Scholar] [CrossRef] [PubMed]
- Duan, C. A state-of-the-art review of the sharing economy business models and forecast of future research directions: Bibliometric analysis approach. Sustainability 2023, 15, 4568. [Google Scholar] [CrossRef]
- Kumar, S.; Lim, W.M.; Pandey, N.; Christopher Westland, J. 20 years of Electronic Commerce Research. Electron. Commer. Res. 2021, 21, 1–40. [Google Scholar] [CrossRef]
- Donthu, N.; Kumar, S.; Mukherjee, D.; Pandey, N.; Lim, W.M. How to conduct a bibliometric analysis: An overview and guidelines. J. Bus. Res. 2021, 133, 285–296. [Google Scholar] [CrossRef]
- Snyder, H. Literature review as a research methodology: An overview and guidelines. J. Bus. Res. 2019, 104, 333–339. [Google Scholar] [CrossRef]
- Kumar, S.; Lim, W.M.; Sivarajah, U.; Kaur, J. Artificial Intelligence and Blockchain Integration in Business: Trends from a Bibliometric-Content Analysis. Inf. Syst. Front. 2022, 25, 871–896. [Google Scholar] [CrossRef] [PubMed]
- Martinez-Climent, C.; Zorio-Grima, A.; Ribeiro-Soriano, D. Financial return crowdfunding: Literature review and bibliometric analysis. Int. Entrep. Manag. J. 2018, 14, 527–553. [Google Scholar] [CrossRef]
- Chen, T.H.; Peng, J.L. Statistical and bibliometric analyses of the effects of financial innovation. Libr. Hi Tech 2020, 38, 308–319. [Google Scholar] [CrossRef]
- Galvez-Sanchez, F.J.; Lara-Rubio, J.; Verdu-Jover, A.J.; Meseguer-Sanchez, V. Research Advances on Financial Inclusion: A Bibliometric Analysis. Sustainability 2021, 13, 3156. [Google Scholar] [CrossRef]
- Nasir, A.; Shaukat, K.; Khan, K.I.; Hameed, I.A.; Alam, T.M.; Luo, S.H. Trends and Directions of Financial Technology (Fintech) in Society and Environment: A Bibliometric Study. Appl. Sci. 2021, 11, 353. [Google Scholar] [CrossRef]
- Nobanee, H.; Dilshad, M.N.; Al Dhanhani, M.; Al Neyadi, M.; Al Qubaisi, S.; Al Shamsi, S. Big Data Applications the Banking Sector: A Bibliometric Analysis Approach. SAGE Open 2021, 11, 21582440211067234. [Google Scholar] [CrossRef]
- Ahmed, S.; Alshater, M.M.; El Ammari, A.; Hammami, H. Artificial intelligence and machine learning in finance: A bibliometric review. Res. Int. Bus. Financ. 2022, 61, 101646. [Google Scholar] [CrossRef]
- Ali, A.; Ramakrishnan, S.; Faisal, F.; Ullah, Z. Bibliometric analysis of global research trends on microfinance institutions and microfinance: Suggesting new research agendas. Int. J. Financ. Econ. 2022, 28, 3552–3573. [Google Scholar] [CrossRef]
- Bhatt, A.; Joshipura, M.; Joshipura, N. Decoding the trinity of Fintech, digitalization and financial services: An integrated bibliometric analysis and thematic literature review approach. Cogent Econ. Financ. 2022, 10, 2114160. [Google Scholar] [CrossRef]
- Tello-Gamarra, J.; Campos-Teixeira, D.; Longaray, A.A.; Reis, J.; Hernani-Merino, M. Fintechs and Institutions: A Systematic Literature Review and Future Research Agenda. J. Theor. Appl. Electron. Commer. Res. 2022, 17, 722–750. [Google Scholar] [CrossRef]
- Sun, Y.; Jiang, S.Q.; Jia, W.J.; Wang, Y. Blockchain as a cutting-edge technology impacting business: A systematic literature review perspective. Telecommun. Policy 2022, 46, 102443. [Google Scholar] [CrossRef]
- Rahman, S.; Moral, I.H.; Hassan, M.; Hossain, G.S.; Perveen, R. Review A systematic review of green finance in the banking industry: Perspectives from a developing country. Green Financ. 2022, 4, 347–363. [Google Scholar] [CrossRef]
- Paul, J.; Lim, W.M.; O‘Cass, A.; Hao, A.W.; Bresciani, S. Scientific procedures and rationales for systematic literature reviews (SPAR-4-SLR). Int. J. Consum. Stud. 2021, 45, O1–O16. [Google Scholar] [CrossRef]
- Kumar, S.; Sahoo, S.; Lim, W.M.; Dana, L.-P. Religion as a social shaping force in entrepreneurship and business: Insights from a technology-empowered systematic literature review. Technol. Forecast. Soc. Chang. 2022, 175, 121393. [Google Scholar] [CrossRef]
- Kraus, N.M.; Kraus, K.M.; Andrusiak, N.O. Digital cubic space as a new economic augmented reality. Sci. Innov. 2020, 16, 92–105. [Google Scholar] [CrossRef]
- Duan, C. Thematic evolution, emerging trends for sharing economy business model research, and future research directions in the post-COVID-19 era. R D Manag. 2023. ahead-of-print. [Google Scholar] [CrossRef]
- Klarin, A.; Suseno, Y. A state-of-the-art review of the sharing economy: Scientometric mapping of the scholarship. J. Bus. Res. 2021, 126, 250–262. [Google Scholar] [CrossRef]
- Block, J.H.; Fisch, C. Eight tips and questions for your bibliographic study in business and management research. Manag. Rev. Q. 2020, 70, 307–312. [Google Scholar] [CrossRef]
- Duan, C. Towards a comprehensive analytical framework and future research agenda for research on sharing economy business models: Thematic analyses approach. Inf. Syst. e-Business Manag. 2023, 21, 977–1016. [Google Scholar] [CrossRef]
- Bajwa, I.A.; Rehman, S.U.; Iqbal, A.; Anwar, Z.; Ashiq, M.; Khan, M.A. Past, Present and Future of FinTech Research: A Bibliometric Analysis. SAGE Open 2022, 12, 21582440221131242. [Google Scholar] [CrossRef]
- Vergura, D.T.; Zerbini, C.; Luceri, B.; Palladino, R. Investigating sustainable consumption behaviors: A bibliometric analysis. Br. Food J. 2023, 125, 253–276. [Google Scholar] [CrossRef]
- Focardi, S. Business as usual and rare events. J. Portf. Manag. 1999, 25, 47–54. [Google Scholar] [CrossRef]
- Tepe, G.; Geyikci, U.B.; Sancak, F.M. FinTech Companies: A Bibliometric Analysis. Int. J. Financ. Stud. 2022, 10, 2. [Google Scholar] [CrossRef]
- Donthu, N.; Gremler, D.D.; Kumar, S.; Pattnaik, D. Mapping of Journal of Service Research Themes: A 22-Year Review. J. Serv. Res. 2022, 25, 187–193. [Google Scholar] [CrossRef]
- Kumari, A.; Devi, N.C. The Impact of FinTech and Blockchain Technologies on Banking and Financial Services. Technol. Innov. Manag. Rev. 2022, 12, 1–11. [Google Scholar] [CrossRef]
- Elsbach, K.D.; Knippenberg, D. Creating High-Impact Literature Reviews: An Argument for ‘Integrative Reviews’. J. Manage. Stud. 2020, 57, 1277–1289. [Google Scholar] [CrossRef]
- Herrmann, H.; Masawi, B. Three and a half decades of artificial intelligence in banking, financial services, and insurance: A systematic evolutionary review. Strateg. Chang. 2022, 31, 549–569. [Google Scholar] [CrossRef]
- Rabbani, M.R.; Bashar, A.; Hawaldar, I.T.; Shaik, M.; Selim, M. What Do We Know about Crowdfunding and P2P Lending Research? A Bibliometric Review and Meta-Analysis. J. Risk Financ. Manag. 2022, 15, 451. [Google Scholar] [CrossRef]
- Nelaturu, K.; Du, H.; Le, D.P. A Review of Blockchain in Fintech: Taxonomy, Challenges, and Future Directions. Cryptography 2022, 6, 18. [Google Scholar] [CrossRef]
- Nejad, M.G. Research on financial innovations: An interdisciplinary review. Int. J. Bank Mark. 2022, 40, 578–612. [Google Scholar] [CrossRef]
- Wang, J.; Zhao, C.; Huang, L.; Yang, S.; Wang, M. Uncovering research trends and opportunities on FinTech: A scientometric analysis. Electron. Commer. Res. 2022, 24, 105–129. [Google Scholar] [CrossRef]
- Miglo, A. Theories of Crowdfunding and Token Issues: A Review. J. Risk Financ. Manag. 2022, 15, 218. [Google Scholar] [CrossRef]
- Jing, W.L.; Rashid, S.B.A.; Islam, M.U. The Impact of COVID-19 on Financial Markets & Institutions: A Literature Review. Int. J. Early Child. Spec. Educ. 2022, 14, 6488–6502. [Google Scholar]
- Duan, C. and K. Sandhu, Advancement of sharing economy for digital innovation in emerging countries. Econ. Lett. 2023, 233, 111364. [Google Scholar] [CrossRef]

Disclaimer/Publisher’s Note: The statements, opinions and data contained in all publications are solely those of the individual author(s) and contributor(s) and not of MDPI and/or the editor(s). MDPI and/or the editor(s) disclaim responsibility for any injury to people or property resulting from any ideas, methods, instructions or products referred to in the content. |
© 2024 by the author. Licensee MDPI, Basel, Switzerland. This article is an open access article distributed under the terms and conditions of the Creative Commons Attribution (CC BY) license (https://creativecommons.org/licenses/by/4.0/).