

Financial Overconfidence and High-Cost Borrowing: The Moderating Effect of Mobile Payments


Abstract
1. Introduction
2. Literature Review
2.1. Alternative Financial Services (AFSs)
2.2. Financial Overconfidence
2.3. Role of Mobile Payments (MPs)
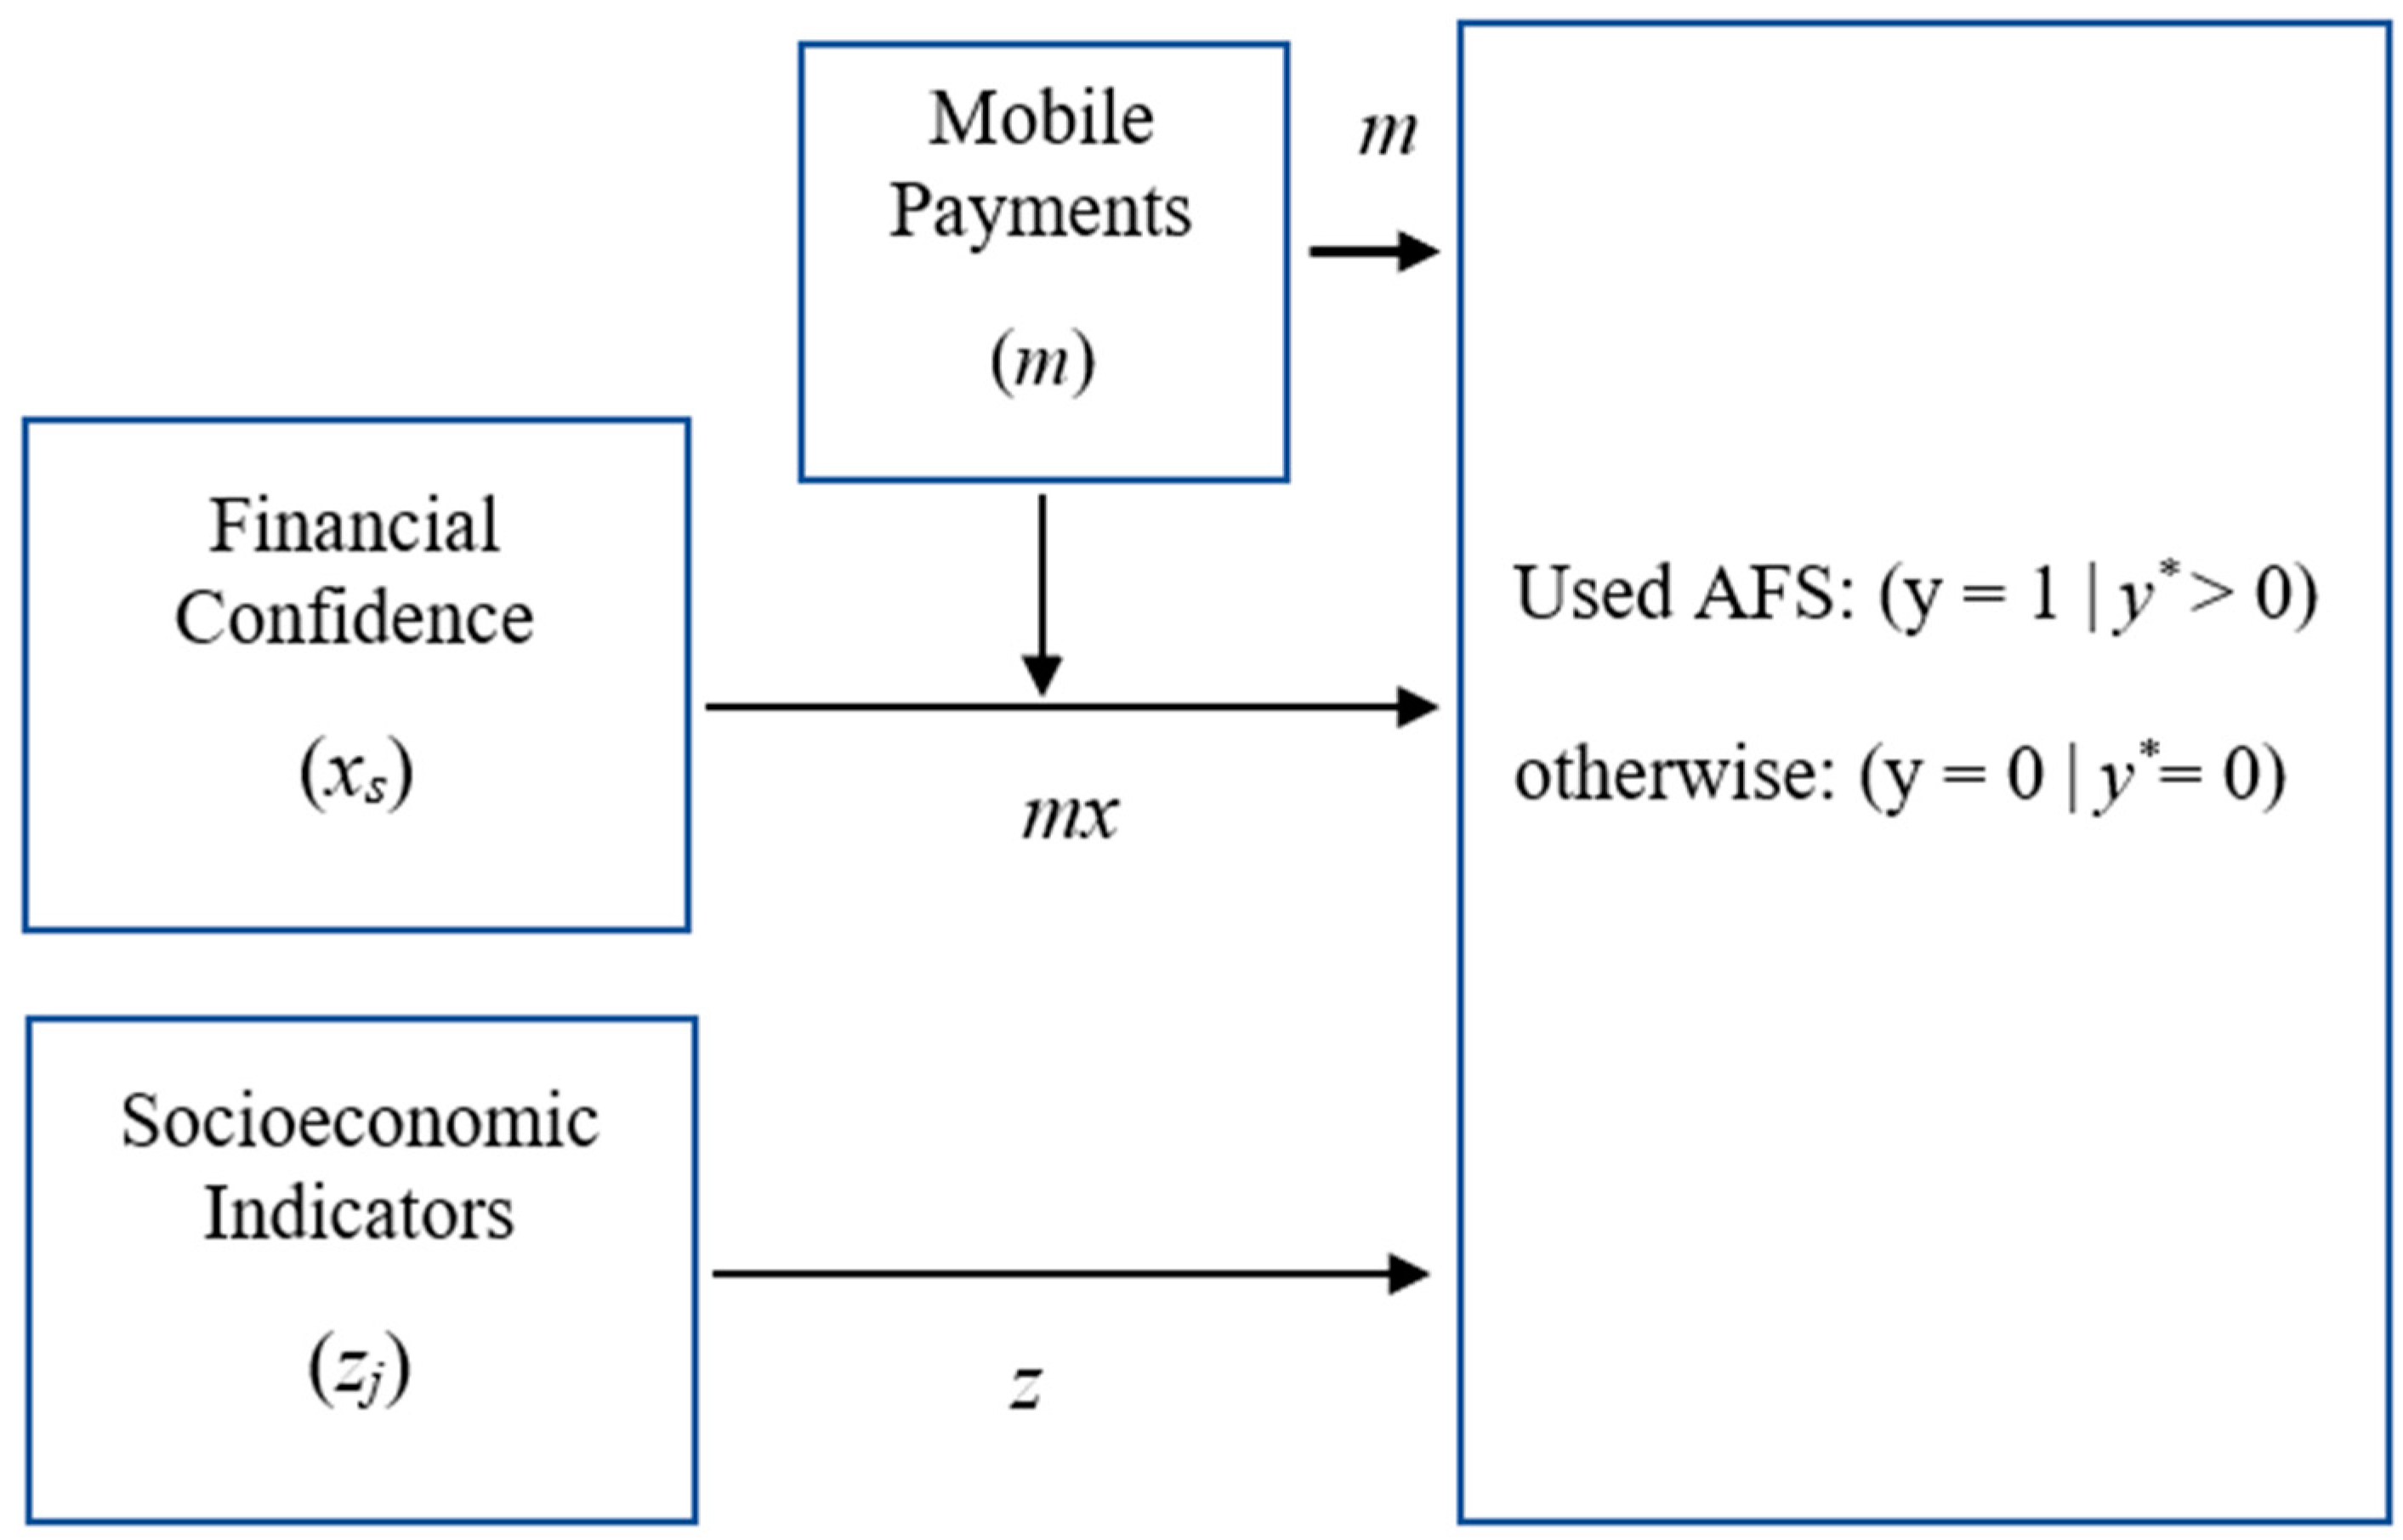
2.4. Theoretical Framework
3. Methods
3.1. Data and Sample
3.2. Measures
3.2.1. Dependent Variable
3.2.2. Independent Variables
3.3. Analytical Model
4. Results
4.1. Descriptive Statistics
4.2. Multivariate Logistic Regression Results
4.3. Discussion and Implications
4.4. Limitations
5. Future Research
6. Conclusions
Author Contributions
Funding
Data Availability Statement
Conflicts of Interest
References
- FDIC. Opportunities for Mobile Financial Services to Engage Underserved Consumers. 2016. Available online: https://www.fdic.gov/consumers/community/mobile/mfs_qualitative_research_report.pdf (accessed on 25 May 2016).
- Liu, Y.; Luo, J.; Zhang, L. The effects of mobile payment on consumer behavior. J. Consum. Behav. 2021, 20, 512–520. [Google Scholar] [CrossRef]
- Ma, Q.; Tan, Y.; He, Y.; Cheng, L.; Wang, M. Why does mobile payment promote purchases? Revisiting the pain of paying and understanding the implicit pleasure via selective attention. PsyCh J. 2024, 13, 760–779. [Google Scholar] [CrossRef] [PubMed]
- Federal Deposit Insurance Corporation. 2009 Annual Report. 2009. Available online: https://archive.fdic.gov/view/fdic/215 (accessed on 30 June 2010).
- Lee, J.M.; Park, N.; Heo, W. Importance of subjective financial knowledge and perceived credit score in payday loan use. Int. J. Financ. Stud. 2019, 7, 53. [Google Scholar] [CrossRef]
- Lusardi, A.; Scheresberg, C.d.B. Financial Literacy and High-Cost Borrowing in the United States; NBER Working Paper No. 18969; National Bureau of Economic Research: Cambridge, MA, USA, 2013. [Google Scholar] [CrossRef]
- Scheresberg, C.d.B.; Hasler, A.; Lusardi, A. Millennial Mobile Payment Users: A Look into Their Personal Finances and Financial Behavior. GFLEC Insights Report. 2020. Available online: https://gflec.org/wp-content/uploads/2018/04/GFLEC-Insight-Report-Millennial-Mobile-Payment-Users-Final.pdf (accessed on 1 January 2020).
- Shaikh, A.A.; Alamoudi, H.; Alharthi, M.; Glavee-Geo, R. Advances in mobile financial services: A review of the literature and future research directions. Int. J. Bank Mark. 2023, 41, 1–33. [Google Scholar] [CrossRef]
- Ahn, S.Y.; Nam, Y. Does mobile payment use lead to overspending? The moderating role of financial knowledge. Comput. Hum. Behav. 2022, 134, 107319. [Google Scholar] [CrossRef]
- Bradley, C.; Burhouse, S.; Gratton, H.; Miller, R.-A. Alternative financial services: A primer. FDIC Q. 2009, 3, 39–47. [Google Scholar]
- Wang, S. Risk preference, payday loans and other alternative financial services. Rev. Behav. Financ. 2024, 16, 581–599. [Google Scholar] [CrossRef]
- Birkenmaier, J.; Fu, Q. The association of alternative financial services usage and financial access: Evidence from the National Financial Capability Study. J. Fam. Econ. Issues 2016, 37, 450–460. [Google Scholar] [CrossRef]
- Robb, C.; Babiarz, P.; Woodyard, A.; Seay, M. Bounded rationality and use of alternative financial services. J. Consum. Aff. 2015, 49, 407–435. [Google Scholar] [CrossRef]
- Disney, R.; Gathergood, J. Financial Literacy and Consumer Credit Use (CFCM Discussion Paper No. 12/01). Centre for Finance, Credit and Macroeconomics, University of Nottingham. 2012. Available online: https://www.nottingham.ac.uk/cfcm/documents/papers/12-01.pdf (accessed on 5 February 2013).
- Kaiser, T.; Lusardi, A.; Menkhoff, L.; Urban, C. Financial education affects financial knowledge and downstream behaviors. J. Financ. Econ. 2022, 145, 255–272. [Google Scholar] [CrossRef]
- McKernan, S.-M.; Lacko, J.M.; Hastak, M. Empirical evidence on the determinants of rent-to-own use and purchase behavior. Econ. Dev. Q. 2003, 17, 33–52. [Google Scholar] [CrossRef]
- Bertrand, M.; Morse, A. Information disclosure, cognitive biases, and payday borrowing. J. Financ. 2011, 66, 1865–1893. [Google Scholar] [CrossRef]
- Courchane, M.; Gailey, A.; Zorn, P. Consumer credit literacy: What price perception? J. Econ. Bus. 2008, 60, 125–138. [Google Scholar] [CrossRef]
- Zinman, J. Debit or credit? J. Bank. Financ. 2009, 33, 358–366. [Google Scholar] [CrossRef]
- Cattanach, J. 2024 Household Financial Insecurity Report. LendingTree. 2024. Available online: https://www.lendingtree.com/debt-consolidation/household-expenses-struggles-study/ (accessed on 8 July 2024).
- Bai, R. Impact of financial literacy, mental budgeting and self control on financial wellbeing: Mediating impact of investment decision making. PLoS ONE 2023, 18, e0294466. [Google Scholar] [CrossRef]
- Lusardi, A.; Messy, F.-A. The importance of financial literacy and its impact on financial wellbeing. J. Financ. Lit. Wellbeing 2023, 1, 1–11. [Google Scholar] [CrossRef]
- Woodyard, A.S.; Robb, C.; Babiarz, P.; Jung, J. Knowledge and practice: Implications for cash and credit management behaviors. Fam. Consum. Sci. Res. J. 2017, 45, 300–314. [Google Scholar] [CrossRef]
- Robb, C.A.; Woodyard, A.S. Financial knowledge and best practice behavior. J. Financ. Couns. Plan. 2011, 22, 60–70. [Google Scholar]
- Barber, B.M.; Odean, T. Boys will be boys: Gender, overconfidence, and common stock investment. Q. J. Econ. 2001, 116, 261–292. [Google Scholar] [CrossRef]
- Singh, D.; Malik, G.; Jain, P.; Abouraia, M. A systematic review and research agenda on the causes and consequences of financial overconfidence. Cogent Econ. Financ. 2024, 12, 2348543. [Google Scholar] [CrossRef]
- Camerer, C.; Lovallo, D. Overconfidence and excess entry: An experimental approach. Am. Econ. Rev. 1999, 89, 306–318. [Google Scholar] [CrossRef]
- Atlas, S.A.; Lu, J.; Micu, P.D.; Porto, N. Financial knowledge, confidence, credit use, and financial satisfaction. J. Financ. Couns. Plan. 2019, 30, 175–190. [Google Scholar] [CrossRef]
- Porto, N.; Xiao, J.J. Financial literacy overconfidence and financial advice seeking. J. Financ. Serv. Prof. 2016, 70, 78–88. [Google Scholar]
- Courchane, M.J. Consumer Literacy and Creditworthiness. In Proceedings of the Federal Reserve System Community Affairs Reseach Conference, Washington, DC, USA, 7–8 April 2005; Available online: https://econpapers.repec.org/RePEc:fip:fedhpr:950 (accessed on 7 April 2005).
- Wann, C.R.; Brockman, B.K.; Brockman, C.M. Credit record overconfidence and alternative financial service use. Rev. Behav. Financ. 2023, 15, 488–510. [Google Scholar] [CrossRef]
- Agbo, D. Mobile Payment: Definition, Evolution, and Benefits; SuperMoney: Santa Ana, CA, USA, 2024; Available online: https://www.supermoney.com/encyclopedia/mobile-payment (accessed on 15 March 2024).
- Yang, W.; Vatsa, P.; Ma, W.; Zheng, H. Does mobile payment adoption really increase online shopping expenditure in China: A gender-differential analysis. Econ. Anal. Policy 2023, 77, 99–110. [Google Scholar] [CrossRef]
- Xue, J.; Lin, L. Analysis of the Influence of Mobile Payment on Consumer Behavior. In Proceedings of the 2019 4th International Conference on Humanities Science and Society Development (ICHSSD 2019), Xiamen, China, 24–26 May 2019; pp. 121–127. [Google Scholar]
- Garrett, J.L.; Rodermund, R.; Anderson, N.; Berkowitz, S.; Robb, C.A. Adoption of mobile payment technology by consumers. Fam. Consum. Sci. Res. J. 2014, 42, 358–368. [Google Scholar] [CrossRef]
- Mokhtari, M.; Chawla, I. Financial literacy overconfidence, mobile financial service use, and high-cost borrowing. J. Financ. Couns. Plan. 2023, 34, 184–203. [Google Scholar] [CrossRef]
- Xu, Y.; Ghose, A.; Xiao, B. Mobile Payment Adoption: An Empirical Investigation of Alipay. Inf. Syst. Res. 2023, 35, 807–828. [Google Scholar] [CrossRef]
- Chun, S.; Johnson, D.S. The effects of mental budgeting and pain of payment on the financial decision making of socially excluded people. Int. J. Bank Mark. 2021, 39, 886–899. [Google Scholar] [CrossRef]
- Morgan, P.J. Fintech and financial inclusion in Southeast Asia and India. Asian Econ. Policy Rev. 2022, 17, 183–208. [Google Scholar] [CrossRef]
- Liao, C.-F.; Chen, C.-D. Financial literacy and mobile payment behaviors. J. Account. Financ. 2020, 20, 120–132. [Google Scholar] [CrossRef]
- Hoch, S.J.; Loewenstein, G.F. Time-inconsistent preferences and consumer self-control. J. Consum. Res. 1991, 17, 492–507. [Google Scholar] [CrossRef]
- Rook, D.W. The buying impulse. J. Consum. Res. 1987, 14, 189–199. [Google Scholar] [CrossRef]
- Eckel, C.; Johnson, C.; Montmarquette, C. Saving decisions of the working poor: Short- and long-term horizons. Res. Exp. Econ. 2005, 10, 219–260. [Google Scholar] [CrossRef]
- Guiso, L.; Paiella, M. The Role of Risk Aversion in Predicting Individual Behaviors. SSRN 2004. Available online: https://papers.ssrn.com/sol3/papers.cfm?abstract_id=608262 (accessed on 1 March 2024).
- Falk, T.; Kunz, W.H.; Schepers, J.J.L.; Mrozek, A.J. How mobile payment influences the overall store price image. J. Bus. Res. 2016, 69, 2417–2423. [Google Scholar] [CrossRef]
- Park, H.; Feigenbaum, J. Bounded rationality, lifecycle consumption, and social security. J. Econ. Behav. Organ. 2018, 146, 65–105. [Google Scholar] [CrossRef]
- de Bruin, A.; Flint-Hartle, S. A bounded rationality framework for property investment behaviour. J. Prop. Invest. Financ. 2003, 21, 271–284. [Google Scholar] [CrossRef]
- Zellermayer, O. The Pain of Paying (Order No. 9713193). ProQuest Dissertations & Theses Global. 1996. Available online: https://www.proquest.com/dissertations-theses/pain-paying/docview/304238079/se-2 (accessed on 1 January 1996).
- Prelec, D.; Loewenstein, G. The red and the black: Mental accounting of savings and debt. Mark. Sci. 1998, 17, 4–28. [Google Scholar] [CrossRef]
- Wang, M.; Ling, A.; He, Y.; Tan, Y.; Zhang, L.; Chang, Z.; Ma, Q. Pleasure of paying when using mobile payment: Evidence from EEG studies. Front. Psychol. 2022, 13, 1004068. [Google Scholar] [CrossRef] [PubMed]
- FINRA Investor Education Foundation. National Financial Capability Study 2018. 2019. Available online: https://finrafoundation.org/data-and-downloads (accessed on 3 June 2019).
- Lind, T.; Ahmed, A.; Skagerlund, K.; Strömbäck, C.; Västfjäll, D.; Tinghög, G. Competence, confidence, and gender: The role of objective and subjective financial knowledge in household finance. J. Fam. Econ. Issues 2020, 41, 626–638. [Google Scholar] [CrossRef]
- Kim, K.T.; Lee, J.; Hanna, S.D. The effects of financial literacy overconfidence on the mortgage delinquency of US households. J. Consum. Aff. 2020, 54, 517–540. [Google Scholar] [CrossRef]
- Lee, S.T.; Hanna, S.D. Financial knowledge overconfidence and early withdrawals from retirement accounts. Financ. Plan. Rev. 2020, 3, e1091. [Google Scholar] [CrossRef]
- Pett, M.A. Evaluating the characteristics of data. In Nonparametric Statistics for Health Care Research: Statistics for Small Samples and Unusual Distributions, 2nd ed.; SAGE Publications: London, UK, 2015; pp. 17–46. [Google Scholar]
- Martial, A. Apple Pay vs. Google Pay: What Is the Best Contactless Payment for Retailers? KORONA POS. 2024. Available online: https://koronapos.com/blog/apple-pay-vs-google-pay/ (accessed on 27 March 2024).
- Masseran, N. Logistic regression approach on classifying air-pollution events: A parsimony technique. Environ. Res. Commun. 2024, 6, 101002. [Google Scholar] [CrossRef]
- Pulenyane, M. Purposeful Covariate Selection Methods for Parsimonious Binary Logistic Regression Models. Master’s Thesis, North-West University, Potchefstroom, South Africa, 2020. Available online: https://repository.nwu.ac.za/handle/10394/37032 (accessed on 1 April 2020).
- Inghelbrecht, K.; Tedde, M. Overconfidence, financial literacy and excessive trading. J. Econ. Behav. Organ. 2024, 219, 152–195. [Google Scholar] [CrossRef]
- Reshadi, F.; Fitzgerald, M.P. The pain of payment: A review and research agenda. Psychol. Mark. 2023, 40, 1672–1688. [Google Scholar] [CrossRef]
- Goodstein, R.M.; Rhine, S.L. The effects of bank and nonbank provider locations on household use of financial transaction services. J. Bank. Financ. 2017, 78, 91–107. [Google Scholar] [CrossRef]
- Nigam, A.; Khan, F.S.; Mazhar, S.S. Consumer perceptions and attitudes towards e-payment services offered by fintech companies: Evidence from India. J. Infrastruct. Policy Dev. 2024, 8, 7522. [Google Scholar] [CrossRef]
- Matveeva, V.A.; Valentinovna, S.; Vilisova, M.L.; Fateeva, S.V.; Kolomoets, N.I. Determinants of financial behaviour of individual investors: In context with financial literacy, overconfidence and herding. Pac. Bus. Rev. Int. 2024, 16, 45–60. [Google Scholar]

| Variables (0, 1) | Full Analytical Sample | Did Not Use MPs | Used MPs | |||
|---|---|---|---|---|---|---|
| (n = 26,017) | (n = 17,222) | (n = 8795) | ||||
| Mean | SD | Mean | SD | Mean | SD | |
| Used Alternative Financial Services (AFSs) | 0.27 | 0.44 | 0.2 | 0.39 | 0.39 | 0.51 |
| Mobile Payment (MP) Users | 0.36 | 0.48 | ||||
| Financial Knowledge | ||||||
| Very High Financial Knowledge | 0.07 | 0.26 | 0.08 | 0.27 | 0.06 | 0.24 |
| Very Low Financial Knowledge | 0.06 | 0.25 | 0.06 | 0.23 | 0.07 | 0.27 |
| Very High Self-Assessed Financial Knowledge | 0.16 | 0.36 | 0.12 | 0.32 | 0.22 | 0.43 |
| Very Low Self-Assessed Financial Knowledge | 0.03 | 0.16 | 0.03 | 0.16 | 0.03 | 0.17 |
| Self-assessed Financial Knowledge | 5.11 | 1.38 | 5.04 | 1.35 | 5.26 | 1.41 |
| Objective Financial Knowledge | 3.10 | 1.65 | 3.25 | 1.63 | 2.87 | 1.619 |
| Financial knowledge Confidence | ||||||
| Appropriate High | 0.21 | 0.4 | 0.22 | 0.41 | 0.18 | 0.39 |
| Overconfident | 0.21 | 0.4 | 0.16 | 0.36 | 0.28 | 0.47 |
| Underconfident | 0.21 | 0.4 | 0.23 | 0.41 | 0.17 | 0.39 |
| Appropriate Low | 0.38 | 0.48 | 0.38 | 0.48 | 0.37 | 0.5 |
| Gender | ||||||
| Male | 0.49 | 0.5 | 0.46 | 0.49 | 0.55 | 0.52 |
| Female | 0.51 | 0.5 | 0.54 | 0.49 | 0.45 | 0.52 |
| Age | ||||||
| 18 to 24 | 0.11 | 0.32 | 0.08 | 0.27 | 0.17 | 0.39 |
| 25 to 34 | 0.18 | 0.39 | 0.13 | 0.33 | 0.28 | 0.47 |
| 35 to 44 | 0.16 | 0.37 | 0.14 | 0.34 | 0.21 | 0.42 |
| 45 to 54 | 0.17 | 0.37 | 0.17 | 0.37 | 0.16 | 0.38 |
| 55 to 64 | 0.18 | 0.38 | 0.22 | 0.41 | 0.11 | 0.32 |
| 65 and above | 0.19 | 0.39 | 0.26 | 0.43 | 0.07 | 0.27 |
| Ethnicity | ||||||
| White | 0.64 | 0.48 | 0.71 | 0.45 | 0.52 | 0.52 |
| Non-White | 0.36 | 0.48 | 0.29 | 0.45 | 0.48 | 0.52 |
| Marital Status | ||||||
| Married | 0.51 | 0.5 | 0.53 | 0.49 | 0.48 | 0.52 |
| Single | 0.32 | 0.47 | 0.28 | 0.44 | 0.4 | 0.51 |
| Separated/Divorced/Widowed | 0.02 | 0.12 | 0.02 | 0.12 | 0.02 | 0.13 |
| Education | ||||||
| Postgraduate | 0.1 | 0.31 | 0.1 | 0.29 | 0.12 | 0.33 |
| Bachelor’s Degree | 0.18 | 0.38 | 0.17 | 0.36 | 0.19 | 0.41 |
| Associate Degree | 0.09 | 0.28 | 0.08 | 0.27 | 0.1 | 0.31 |
| Some College or no degree | 0.19 | 0.4 | 0.18 | 0.38 | 0.22 | 0.43 |
| High School Graduate/GED | 0.33 | 0.47 | 0.35 | 0.47 | 0.3 | 0.47 |
| Did not complete High School | 0.09 | 0.28 | 0.09 | 0.28 | 0.07 | 0.27 |
| Occupation Stage | ||||||
| Retired | 0.22 | 0.41 | 0.29 | 0.44 | 0.09 | 0.3 |
| Self-employed | 0.05 | 0.22 | 0.07 | 0.24 | 0.09 | 0.29 |
| Full-time | 0.05 | 0.22 | 0.34 | 0.46 | 0.52 | 0.52 |
| Part-time | 0.04 | 0.2 | 0.09 | 0.28 | 0.1 | 0.3 |
| Homemaker | 0.07 | 0.26 | 0.07 | 0.26 | 0.07 | 0.26 |
| Full-time Student | 0.09 | 0.29 | 0.03 | 0.17 | 0.06 | 0.24 |
| Disabled | 0.4 | 0.49 | 0.06 | 0.24 | 0.04 | 0.19 |
| Unemployed | 0.07 | 0.26 | 0.05 | 0.22 | 0.04 | 0.21 |
| Income (USD) | ||||||
| Less than 15,000 | 0.12 | 0.32 | 0.12 | 0.32 | 0.11 | 0.33 |
| 15,000–25,000 | 0.11 | 0.31 | 0.11 | 0.31 | 0.1 | 0.3 |
| 25,000–35,000 | 0.11 | 0.31 | 0.11 | 0.31 | 0.11 | 0.32 |
| 35,000–50,000 | 0.15 | 0.35 | 0.15 | 0.35 | 0.13 | 0.35 |
| 50,000–75,000 | 0.19 | 0.39 | 0.19 | 0.39 | 0.19 | 0.4 |
| 75,000–100,000 | 0.14 | 0.35 | 0.13 | 0.32 | 0.16 | 0.38 |
| 100,000–150,000 | 0.12 | 0.33 | 0.12 | 0.32 | 0.13 | 0.35 |
| 150,000 and above | 0.06 | 0.24 | 0.06 | 0.23 | 0.07 | 0.27 |
| Panel A | Panel B | |||||
|---|---|---|---|---|---|---|
| Including MPs | Including Moderation | |||||
| Coef. | S.E. | Odds | Coef. | S.E. | Odds | |
| Constant | −3.82 *** | 0.16 | 0.02 | −3.63 *** | 0.16 | 0.03 |
| Subjective Financial Knowledge | 0.14 *** | 0.01 | 1.15 | 0.07 *** | 0.01 | 1.07 |
| Objective Financial Knowledge | −0.13 *** | 0.01 | 0.88 | −0.06 *** | 0.01 | 0.94 |
| Mobile Payments (MPs) | 0.65 *** | 0.04 | 1.92 | 0.62 *** | 0.05 | 1.86 |
| Interaction Term (Financial Knowledge * MPs) | ||||||
| Subjective Financial Knowledge * MPs | 0.52 *** | 0.06 | 1.68 | |||
| Objective Financial Knowledge * MPs | −0.52 *** | 0.06 | 0.59 | |||
| Bank account Ownership | −0.53 *** | 0.06 | 0.59 | −0.53 *** | 0.06 | 0.59 |
| Credit Record (reference: Very Good) | ||||||
| Very Bad | 1.78 *** | 0.08 | 5.92 | 1.76 *** | 0.08 | 5.82 |
| Bad | 1.86 *** | 0.06 | 6.39 | 1.89 *** | 0.06 | 6.61 |
| About average | 1.19 *** | 0.05 | 3.28 | 1.23 *** | 0.05 | 3.42 |
| Good | 0.61 *** | 0.05 | 1.85 | 0.64 *** | 0.05 | 1.89 |
| Gender (reference: Female) | ||||||
| Male | 0.32 *** | 0.04 | 1.38 | 0.29 *** | 0.04 | 1.35 |
| Age (reference: 65 and above) | ||||||
| 18–24 | 1.42 *** | 0.10 | 4.12 | 1.40 *** | 0.09 | 4.06 |
| 25–34 | 1.42 *** | 0.09 | 4.15 | 1.39 *** | 0.09 | 4.03 |
| 35–44 | 1.14 *** | 0.09 | 3.14 | 1.13 *** | 0.09 | 3.11 |
| 45–54 | 0.83 *** | 0.09 | 2.30 | 0.83 *** | 0.08 | 2.30 |
| 55–64 | 0.41 *** | 0.08 | 1.88 | 0.40 *** | 0.08 | 1.49 |
| Ethnicity (reference: White) | ||||||
| Non-White | −0.28 *** | 0.04 | 1.50 | 0.27 *** | 0.03 | 1.31 |
| Marital Status (reference: Married) | ||||||
| Single | −0.29 *** | 0.04 | 0.75 | −0.28 *** | 0.04 | 0.75 |
| Separated/Divorced/Widowed | 0.10 | 0.12 | 1.11 | 0.09 | 0.12 | 1.10 |
| Education (reference: Did not complete High School) | ||||||
| Postgraduate | −0.26 *** | 0.08 | 0.77 | −0.26 ** | 0.08 | 0.77 |
| Bachelor’s Degree | −0.19 ** | 0.07 | 0.83 | −0.18 ** | 0.07 | 0.83 |
| Associate Degree | −0.03 | 0.08 | 0.97 | −0.03 | 0.07 | 0.97 |
| Some College or No-degree | 0.13 * | 0.06 | 1.14 | 0.11 | 0.06 | 1.12 |
| High School Graduate/GED | −0.03 | 0.06 | 0.97 | −0.04 | 0.06 | 0.96 |
| Occupation Stage(reference: Retired) | ||||||
| Self-employed | 0.25 *** | 0.08 | 1.29 | 0.23 * | 0.09 | 1.26 |
| Full-time | 0.11 | 0.08 | 1.12 | 0.10 *** | 0.07 | 1.10 |
| Part-time | 0.09 | 0.09 | 1.09 | 0.08 | 0.09 | 1.08 |
| Homemaker | −0.06 | 0.09 | 0.94 | −0.06 | 0.09 | 0.93 |
| Full-time Student | −0.07 | 0.11 | 0.93 | −0.07 | 0.11 | 0.93 |
| Disabled | 0.22 ** | 0.09 | 1.25 | 0.21 * | 0.09 | 1.24 |
| Unemployed | −0.03 | 0.10 | 0.97 | −0.02 | 0.10 | 0.98 |
| Income (USD): (reference: 150,000 and above) | ||||||
| Less than 15,000 | 0.75 *** | 0.11 | 2.11 | 0.73 *** | 0.11 | 2.08 |
| 15,000–25,000 | 1.11 *** | 0.11 | 3.05 | 1.11 *** | 0.11 | 3.04 |
| 25,000–35,000 | 1.04 *** | 0.11 | 2.84 | 1.03 *** | 0.10 | 2.81 |
| 35,000–50,000 | 0.97 *** | 0.10 | 2.63 | 0.96 *** | 0.10 | 2.63 |
| 50,000–75,000 | 0.69 *** | 0.10 | 1.99 | 0.68 *** | 0.10 | 1.98 |
| 75,000–100,000 | 0.87 *** | 0.10 | 2.39 | 0.83 *** | 0.10 | 2.29 |
| 100,000–150,000 | 0.48 *** | 0.11 | 1.61 | 0.47 *** | 0.10 | 1.60 |
| Likelihood Ratio Test (2) (p-value) | 5934.34 (0.00) | 6062.95 (0.00) | ||||
| df | 36 | 38 | ||||
| McFadden R2 | 0.19 | 0.21 | ||||
| Panel A | Panel B | |||||
|---|---|---|---|---|---|---|
| Including MPs | Including Moderation | |||||
| Coef. | S.E. | Odds | Coef. | S.E. | Odds | |
| Constant | −3.46 | 0.14 | 0.031 | −3.37 *** | 0.14 | 0.035 |
| Confidence Category (reference: Appropriate Low) | 0.14 *** | 0.01 | 1.15 | 0.07 *** | 0.01 | 1.07 |
| Appropriate High | −0.26 *** | 0.06 | 0.77 | −0.26 *** | 0.07 | 0.77 |
| Overconfident | 0.26 *** | 0.02 | 1.29 | 0.08 * | 0.03 | 1.08 |
| Underconfident | −0.10 *** | 0.02 | 0.91 | −0.09 *** | 0.02 | 0.92 |
| Mobile Payments (MPs) | 0.64 *** | 0.04 | 1.90 | 0.50 *** | 0.05 | 1.66 |
| Interaction Terms (reference: Appropriate Low × MPs) | ||||||
| Appropriate High × MPs | 0.05 | 0.10 | 1.05 | |||
| Overconfident × MPs | 0.66 *** | 0.09 | 1.94 | |||
| Underconfident × MPs | −0.09 | 0.10 | 0.91 | |||
| Bank account Ownership | −0.51 *** | 0.06 | 0.60 | −0.51 *** | 0.06 | 0.60 |
| Credit Record (reference: Very Good) | ||||||
| Very Bad | 1.70 *** | 0.08 | 5.48 | 1.70 *** | 0.08 | 5.48 |
| Bad | 1.85 *** | 0.05 | 6.37 | 1.87 *** | 0.05 | 6.48 |
| About average | 1.19 *** | 0.05 | 3.29 | 1.22 *** | 0.05 | 3.38 |
| Good | 0.61 *** | 0.05 | 1.85 | 0.63 *** | 0.05 | 1.88 |
| Gender (reference: Female) | ||||||
| Male | 0.32 *** | 0.04 | 1.38 | 0.30 *** | 0.04 | 1.36 |
| Age (reference: 65 and above) | ||||||
| 18–24 | 1.40 *** | 0.10 | 4.06 | 1.37 | 0.10 | 3.95 |
| 25–34 | 1.42 *** | 0.09 | 4.12 | 1.37 | 0.09 | 3.95 |
| 35–44 | 1.14 *** | 0.09 | 3.14 | 1.12 | 0.09 | 3.05 |
| 45–54 | 0.83 *** | 0.09 | 2.29 | 0.81 | 0.09 | 2.24 |
| 55–64 | 0.42 *** | 0.08 | 1.52 | 0.40 | 0.08 | 1.49 |
| Ethnicity (reference: White) | ||||||
| Non-White | 0.27 *** | 0.03 | 1.31 | 0.27 *** | 0.03 | 1.31 |
| Marital Status (reference: Married) | ||||||
| Single | −0.30 *** | 0.04 | 0.74 | −0.31 *** | 0.04 | 0.74 |
| Separated/Divorced/Widowed | 0.10 | 0.12 | 1.11 | 0.09 | 0.12 | 1.10 |
| Education (reference: Did not complete High School) | ||||||
| Postgraduate | −0.24 ** | 0.08 | 0.78 | −0.25 ** | 0.08 | 0.78 |
| Bachelor’s Degree | −0.18 ** | 0.07 | 0.84 | −0.18 ** | 0.07 | 0.84 |
| Associate Degree | −0.01 ** | 0.07 | 0.99 | −0.01 | 0.07 | 0.99 |
| Some College or No-degree | 0.12 | 0.06 | 1.13 | 0.11 | 0.06 | 1.12 |
| High School Graduate/GED | −0.05 | 0.06 | 0.95 | −0.05 | 0.06 | 0.95 |
| Occupation Stage (reference: Retired) | ||||||
| Self-employed | 0.27 ** | 0.09 | 1.31 | 0.26 ** | 0.09 | 1.29 |
| Full-time | 0.11 | 0.08 | 1.12 | 0.10 | 0.08 | 1.11 |
| Part-time | 0.05 | 0.09 | 1.05 | 0.05 | 0.09 | 1.05 |
| Homemaker | −0.06 | 0.09 | 0.94 | −0.07 | 0.09 | 0.93 |
| Full-time Student | −0.04 | 0.11 | 0.96 | −0.04 | 0.11 | 0.96 |
| Disabled | 0.21 * | 0.09 | 1.23 | 0.20 * | 0.09 | 1.22 |
| Unemployed | −0.03 | 0.10 | 0.97 | −0.04 | 0.10 | 0.97 |
| Income (USD): (reference: 150,000 and above) | ||||||
| Less than 15,000 | 0.70 *** | 0.11 | 2.01 | 0.70 *** | 0.11 | 2.01 |
| 15,000–25,000 | 1.06 *** | 0.11 | 2.90 | 1.07 *** | 0.11 | 2.90 |
| 25,000–35,000 | 1.00 *** | 0.11 | 2.72 | 1.00 *** | 0.11 | 2.73 |
| 35,000–50,000 | 0.92 *** | 0.10 | 2.52 | 0.93 *** | 0.10 | 2.54 |
| 50,000–75,000 | 0.64 *** | 0.10 | 1.90 | 0.65 *** | 0.10 | 1.91 |
| 75,000–100,000 | 0.81 *** | 0.10 | 2.25 | 0.79 *** | 0.10 | 2.19 |
| 100,000–150,000 | 0.43 *** | 0.10 | 1.54 | 0.43 *** | 0.11 | 1.54 |
| Likelihood Ratio Test (2) (p-value) | 6100.94 (0.00) | 6173.99 (0.00) | ||||
| df | 37 | 40 | ||||
| McFadden R2 | 0.21 | 0.22 | ||||
| Model Fit | 0.75 | 0.76 | ||||
Disclaimer/Publisher’s Note: The statements, opinions and data contained in all publications are solely those of the individual author(s) and contributor(s) and not of MDPI and/or the editor(s). MDPI and/or the editor(s) disclaim responsibility for any injury to people or property resulting from any ideas, methods, instructions or products referred to in the content. |
© 2025 by the authors. Licensee MDPI, Basel, Switzerland. This article is an open access article distributed under the terms and conditions of the Creative Commons Attribution (CC BY) license (https://creativecommons.org/licenses/by/4.0/).
Share and Cite
Chawla, I.; Mokhtari, M. Financial Overconfidence and High-Cost Borrowing: The Moderating Effect of Mobile Payments. FinTech 2025, 4, 9. https://doi.org/10.3390/fintech4010009
Chawla I, Mokhtari M. Financial Overconfidence and High-Cost Borrowing: The Moderating Effect of Mobile Payments. FinTech. 2025; 4(1):9. https://doi.org/10.3390/fintech4010009
Chicago/Turabian StyleChawla, Isha, and Manouchehr Mokhtari. 2025. "Financial Overconfidence and High-Cost Borrowing: The Moderating Effect of Mobile Payments" FinTech 4, no. 1: 9. https://doi.org/10.3390/fintech4010009
APA StyleChawla, I., & Mokhtari, M. (2025). Financial Overconfidence and High-Cost Borrowing: The Moderating Effect of Mobile Payments. FinTech, 4(1), 9. https://doi.org/10.3390/fintech4010009