Article

Selecting Non-Line of Sight Critical Scenarios for Connected Autonomous Vehicle Testing

1
Institute of Artificial Intelligence, Faculty of Computing, Engineering and Media, De Montfort University, Leicester LE1 9BH, UK
2
HORIBA MIRA Ltd., Watling Street, Nuneaton CV10 0TU, UK
*
Author to whom correspondence should be addressed.
Software 2022, 1(3), 244-264; https://doi.org/10.3390/software1030011
Submission received: 31 March 2022 / Revised: 30 May 2022 / Accepted: 7 July 2022 / Published: 13 July 2022

Abstract

:
The on-board sensors of connected autonomous vehicles (CAVs) are limited by their range and inability to see around corners or blind spots, otherwise known as non-line of sight scenarios (NLOS). These scenarios have the potential to be fatal (critical scenarios) as the sensors may detect an obstacle much later than the amount of time needed for the car to react. In such cases, mechanisms such as vehicular communication are required to extend the visibility range of the CAV. Despite there being a substantial body of work on the development of navigational and communication algorithms for such scenarios, there is no standard method for generating and selecting critical NLOS scenarios for testing these algorithms in a scenario-based simulation environment. This paper puts forward a novel method utilising a genetic algorithm for the selection of critical NLOS scenarios from the set of all possible NLOS scenarios in a particular road environment. The need to select critical scenarios is pertinent as the number of all possible driving scenarios generated is large and testing them against each other is time consuming, unnecessary and expensive. The selected critical scenarios are then validated for criticality by using a series of MATLAB based simulations.

1. Introduction

Connected autonomous vehicles (CAVs) utilise sensors to perceive their environment. This data is brought together using sensor fusion algorithms and integrated onto the maps available within the vehicle or in the cloud to support navigation. These sensors can perceive up to a certain range (150–250 m at a maximum speed of 120 km/h [1,2,3]). This perception range can be further limited due to sensor occlusion, sensor noise or scenarios with blind spots, such as corners and intersections [4,5]. Such scenarios in which a vehicle’s perception is occluded due to a blind-spot or geometry of the road are referred to as non-line of sight scenarios (NLOS). Such scenarios are the main focus of this paper. In such cases, scenario perception range of autonomous vehicles (AVs) needs to be extended by enabling the receipt of information about obstacles far in advance of being detected by on-board sensors in order to avoid a collision. The need to increase vehicle perception range in the presence of blind spots has been a focus of research within both academia and industry [6,7,8,9,10,11,12,13]. The most common method within the literature for extending perception range in NLOS scenarios is through vehicle-to-everything (V2X) communication [14,15,16,17,18,19]. There are a number of studies that have looked into developing algorithms (obstacle detection, trajectory planning, collision avoidance, etc.) and communication protocols (e.g., routing protocols [19]) for such NLOS scenarios. These algorithms need to be tested to ensure quality and adherence to system requirements, paving the way for safe deployment of autonomous vehicles. Testing is primarily conducted through on-road testing, simulation or scenario-based methods. On-road testing incurs enormous resources in terms of time, cost and human resources, while simulation-based testing requires a large volume of data; both methods cannot ensure coverage of all critical scenarios. A scenario-based approach facilitates the development of suitable driving scenarios that can incorporate specific requirements, such as critical scenarios.
Menzel et al. [20] proposed a three-terminology framework along V-model-based scenario development of the ISO26262 standard for the development of scenarios to test and validate the functionalities of autonomous vehicles. This consists of functional scenarios, which are the most abstract way of describing a scenario and involve the description of on-road scenario concepts (e.g., road segments) and their relation (e.g., road segment has a relation to lane segment) in a linguistic manner, as well as logical scenarios, which specify a value range for each attribute of a concept in a scenario state space (e.g., a road segment has an attribute length which consists of a range of values for possible lengths), and concrete scenarios which specify a specific value for each parameter from within the respective value range. The scenario development process can be visualised in Figure 1. However, the scenarios generated from functional and logical scenarios are a substantial number, equivalent to the number of combinations of every value of each attribute (for example, the speed and position of the roads in the scenario) making up the scenario. Not all scenarios within this scenario space will be relevant for desired functionality testing and testing against each one will be costly and time consuming. Therefore, there is a need to select concrete scenarios which are relevant to certain functional requirements, for example, scenarios that are critical in nature.
There have been numerous studies on concrete scenario generation for various applications, for example, free driving, following, lane keeping, traffic scenarios, overtaking obstacle detection, etc. [21,22,23,24]. However, there are none that cover the selection of NLOS critical scenarios. Subsequently, the focus of this paper is the selection of critical concrete NLOS scenarios. To search the large scenario space and identify critical scenarios, this paper proposes an innovative way of utilising a genetic algorithm (GA). The selected critical scenarios are then tested and validated on a MATLAB simulated driving environment. As the majority of the proposed algorithms developed to safely manoeuvre a NLOS scenario utilise vehicular communication to detect and avoid obstacles, the implementation platform presented in this paper incorporates vehicular communication as a means for allowing the testing of these algorithms in the future.
Thus, the primary contribution of the paper is:
  • The development of a new and effective methodology to search for critical NLOS scenarios from a large scenario space. This involved defining a critical scenario as used in this paper and included the development of a methodology to evaluate critical scenarios for NLOS cases. This has been performed by combining several indicators, for example, time to collision (TTC) and total stopping time (TST), as presented in Section 3. This is followed by searching for critical scenarios within the scenario search space through the unique use of a genetic algorithm.
  • The subsequent implementation framework that simulates the scenarios selected by the GA. This platform incorporates vehicular communication.
We envisage this contribution to be utilised for testing AV algorithms developed for NLOS road scenarios and these algorithms include built-for-purpose communication protocols.
The paper is organised as follows: Section 2 discusses the related works on AV testing methods, critical scenario selection and the use of evolutionary algorithms to search the scenario space. Section 3 discusses the methodology for determining the metric for identifying NLOS critical scenarios (adopted as a fitness function for the GA); details of the GA and simulation environment were used to validate GA output. The experiments and results are presented in Section 4, followed by discussion in Section 5 and conclusion in Section 6.

2. Related Work

This section reviews related work on testing and validating CAV algorithms (Section 2.1) and metrics for selecting safety critical concrete scenarios (Section 2.2). Finally, Section 2.3 provides a brief introduction of genetic algorithms and their application in the current context.

2.1. Automotive Software Testing

There are several methods for assessing the safety capabilities of AVs. These include: formal verification [25,26,27,28], a function-based approach [29], shadow mode [30,31,32], real-world testing [33,34,35], a simulation-based approach [36,37,38,39,40] and a scenario-based approach [41,42,43,44,45]. Throughout the literature, the most common approaches used are real-world testing, the simulation-based approach and the scenario-based approach [46].
Real-world testing is the most realistic of the validation methods, but it necessitates more effort and comes at a higher cost due to the high level of realism required. Furthermore, the authors Kalra and Paddock [47] stated that driving 11 billion miles is required to prove statistically with 95% confidence that an autonomous vehicle is 20% better than a human driver (based on the failure rate). They concluded that in the real world, the traditional “miles driven” approach is not economically viable. Another issue with this statistical approach is that it fails to account for how eventful the miles driven are. For example, an AV can complete the miles requirement by driving on a relatively simple road. To address this, companies in California are now required to publish “disengagement reports” as per California State law. Disengagements are situations in which human intervention is required during an automated operation due to an unsafe decision made by an AV due to the criticality of the situation or a technological failure [48].
AVs can be tested through simulations with varying levels of fidelity instead of being tested in real-world settings. Dedicated software with a simple or complex mathematical representation of the subsystems can be used depending on the purpose. In April 2020, Waymo announced that it had driven 20 million miles on public roads and 15 billion miles in its simulator [49]. Tesla’s Dojo supercomputer replays recorded data in order to retrain its full self-driving software stack [38]. Scalability and cost-efficiency are two advantages of simulation testing. Simulation models, on the other hand, must be tested in the real world. Nonetheless, AV testing can be accelerated by combining simulation and real-world testing.
Scenario-based testing focuses on specific scenarios, such as safety-critical scenario cases, to reduce testing time and effort by generating proof of correct functionality using a scenario coverage matrix rather than relying on the statistical distribution used in real-world testing. In the PEGASUS project, scenario-based testing was used to test ADAS systems. The ability to use only the data that are required is a significant benefit of scenario-based testing. Several proposed methods, including clustering, rule-based and machine learning-based methods, are used to identify representative scenarios [41,42,43]. Other methods focus on categorising scenarios based on their rarity. Scenario-based testing, in which individual traffic scenarios are tested using virtual simulation, is a promising method [50,51]. It has a number of advantages. It can be significantly faster than other approaches because it does not require real-time execution and testing can be used in parallel. Another significant advantage of this method is the assurance of safety during testing. Critical accident scenarios can be simulated in a virtual environment without endangering real-world traffic participants. However, because the simulated world deviates from the real world at times, model–world mismatches can occur. The primary goal of reproducing failure scenarios after they have occurred is to reduce as many failures as possible ahead of time.
Although there has been some research looking at test case generation using scenario-based methods, none of these focused on incorporating scenarios that included blind spots, i.e., the presence of obstacles that are not in direct sight of the onboard sensors. This research uses a scenario-based approach to generate NLOS safety-critical scenarios for connected autonomous vehicles.

2.2. Metrics

To evaluate the safety of a concrete scenario, Key Performance Indicators (KPIs) are required. Since accidents are rare, criticality metrics such as KPIs are advantageous [52]. The most well-known criticality measure is time-to-collision (TTC) [53]. The goal is to detect scenarios which jeopardise vehicle safety by using criticality measurements. Some of the metrics used in previous works are summarised in Table 1.
As mentioned earlier, TTC is a well-known representative temporal metric and it is presented in the works of Saffarzadeh et al. [65]. The TTC measure, while simple to calculate and interpret, is unable to account for the participants’ acceleration and deceleration behaviour because it is a stationary metric. As a result, combining different metrics from different basic methods for a comprehensive assessment is required. This paper will discuss combining different metrics in order to determine NLOS safety-critical scenarios.

2.3. Evolutionary Algorithm

An evolutionary algorithm is an optimisation-based approach that uses the design variables, the constraints, the fitness function, and the optimiser (i.e., the solver) to search the scenario space for critical scenarios [66]. The fitness function is the quantified criticality measure and has been further discussed in Section 3.1.
The problem formulation, particularly the transparency and complexity of the underlying models, has a significant impact on the optimiser chosen. When estimating criticality measures, a simulator is frequently used. Because of high model complexity, simulation and system analysis of the system of interest (SoI) can be computationally expensive in many cases. As a result, the SoI’s behaviour is treated as a black box. Thus, the corresponding search procedure can be considered as a black-box optimisation problem.
The relationship between the input (i.e., scenario parameters) and the output (i.e., simulation results) for a black-box optimisation problem can only be analysed by external observation through simulations [67]. Various heuristic methods, such as a genetic algorithm [68,69,70], Bayesian optimisation [71,72] and simulated annealing [68], can be used to approximate the fitting function and find the global minimum iteratively to solve this problem. Furthermore, domain-specific heuristic techniques, such as rule-based searching [73], heuristic simulation-based gradient descent [74] and zoom-in sampler [75], help to identify multiple local minimums of feasible solutions. Feng et al. [76,77] formulated scenario searching as a two-step optimisation problem. The first step in the optimisation process is to find as many local optimal solutions as possible. The neighbourhood of the local optimal solutions is searched in the second step to find all the scenarios whose criticalities are within a certain threshold.
It is a well-known approach to use genetic algorithms for test generation and optimisation. Stahmer [78] demonstrated in his Ph.D. thesis in 1995 that using genetic algorithms to generate test data is an order of magnitude more efficient than using random selection. Abdessalem et al. [69] were also inspired by the idea of using evolutionary algorithms. They demonstrated in their paper that evolutionary algorithms are well-suited for testing vision-based control systems and characterising critical input space regions. In addition, [79] proposed a genetic algorithm-based approach for testing an autonomous parking system. Bueheler et al. [80] used a similar technique to perform evolutionary functional testing of a vehicle brake assistant system, concluding that system errors discovered by evolutionary function testing are fairly unlikely to be discovered using traditional testing techniques.
Acknowledging the power of evolutionary algorithms to search through solution spaces to identify optimum solutions based on certain criteria and associated constraints, in this research a genetic algorithm approach is used to select NLOS safety-critical scenarios which require communication in order to avoid a collision. Unlike previous works, this work uses a GA to select critical scenarios for testing the functionalities for connected autonomous vehicles. The use of a GA for scenario selection has been further discussed in Section 3.

3. Methodology

To test autonomous vehicle algorithms against test scenarios requires the selection of a set of scenarios complying with testing criteria from the entire range of scenarios which would help with evaluation of the algorithm [29]. It must be noted that selecting scenarios is an essential step as the number of possible test scenarios a vehicle can encounter is very large and it would be very time consuming to test against each scenario. In addition, many scenarios are trivial in that they will not lead to a safety critical event. Furthermore, many scenarios are essentially similar and hence testing against one is enough for the cluster of similar scenarios. The research presented in this paper will select scenarios that have the potential to lead to a collision as a result of the ego vehicle (vehicle under test) not being aware of the obstacle until it is too late to avoid collision. These scenarios are referenced to as critical scenarios in this paper. The selection of critical scenarios comes under concrete scenarios within the development process of functional, logical and concrete scenarios along the V-model based development process of ISO26262. Concrete scenarios correspond to the selection of a scenario from the scenario space (logical scenario). For the test case, we have used a T-junction scenario to determine critical NLOS scenarios; statistically T-junctions have a high number of collisions as discussed in [81,82,83]. This simple yet powerful scenario can be easily expanded to include more roads (forming crossroads and roundabouts) or adapted to form blind bends on the same road. Similarly, more cars and road users can be added. Figure 2 illustrates an example of a NLOS T-junction scenario.
As illustrated in Figure 2, both vehicles (ego and CAV) have a range of NLOS positions they can occupy, as represented by the black bounding box and speed as detailed in Section 3.3. The bounding box position was determined through simulation and represents locations from where the ego vehicle’s on-board sensors do not detect the CAV, even though it is within the range of the sensors, as a result of obstacles present in its line-of-sight. This creates a large scenario space where a scenario is made up of a combination of attribute values over the underlying T-junction layout. Figure 3 (with each vertical line representing an attribute and where the attributes included are the starting position and speed of both the ego and CAV) shows a sample of 1000 possible scenarios (represented by the blue and red lines that connect the values of the attributes for that particular scenario) within the scenario space. Not all scenarios within this scenario space will lead to a collision and not all collision scenarios are critical in nature. In this Figure, the red and blue lines are mapped to the corresponding fitness value (detailed in the next section) and subsequently to its collision status; red lines indicate parameter value combinations that result in a collision and blue lines indicate those scenarios where collision is not possible.

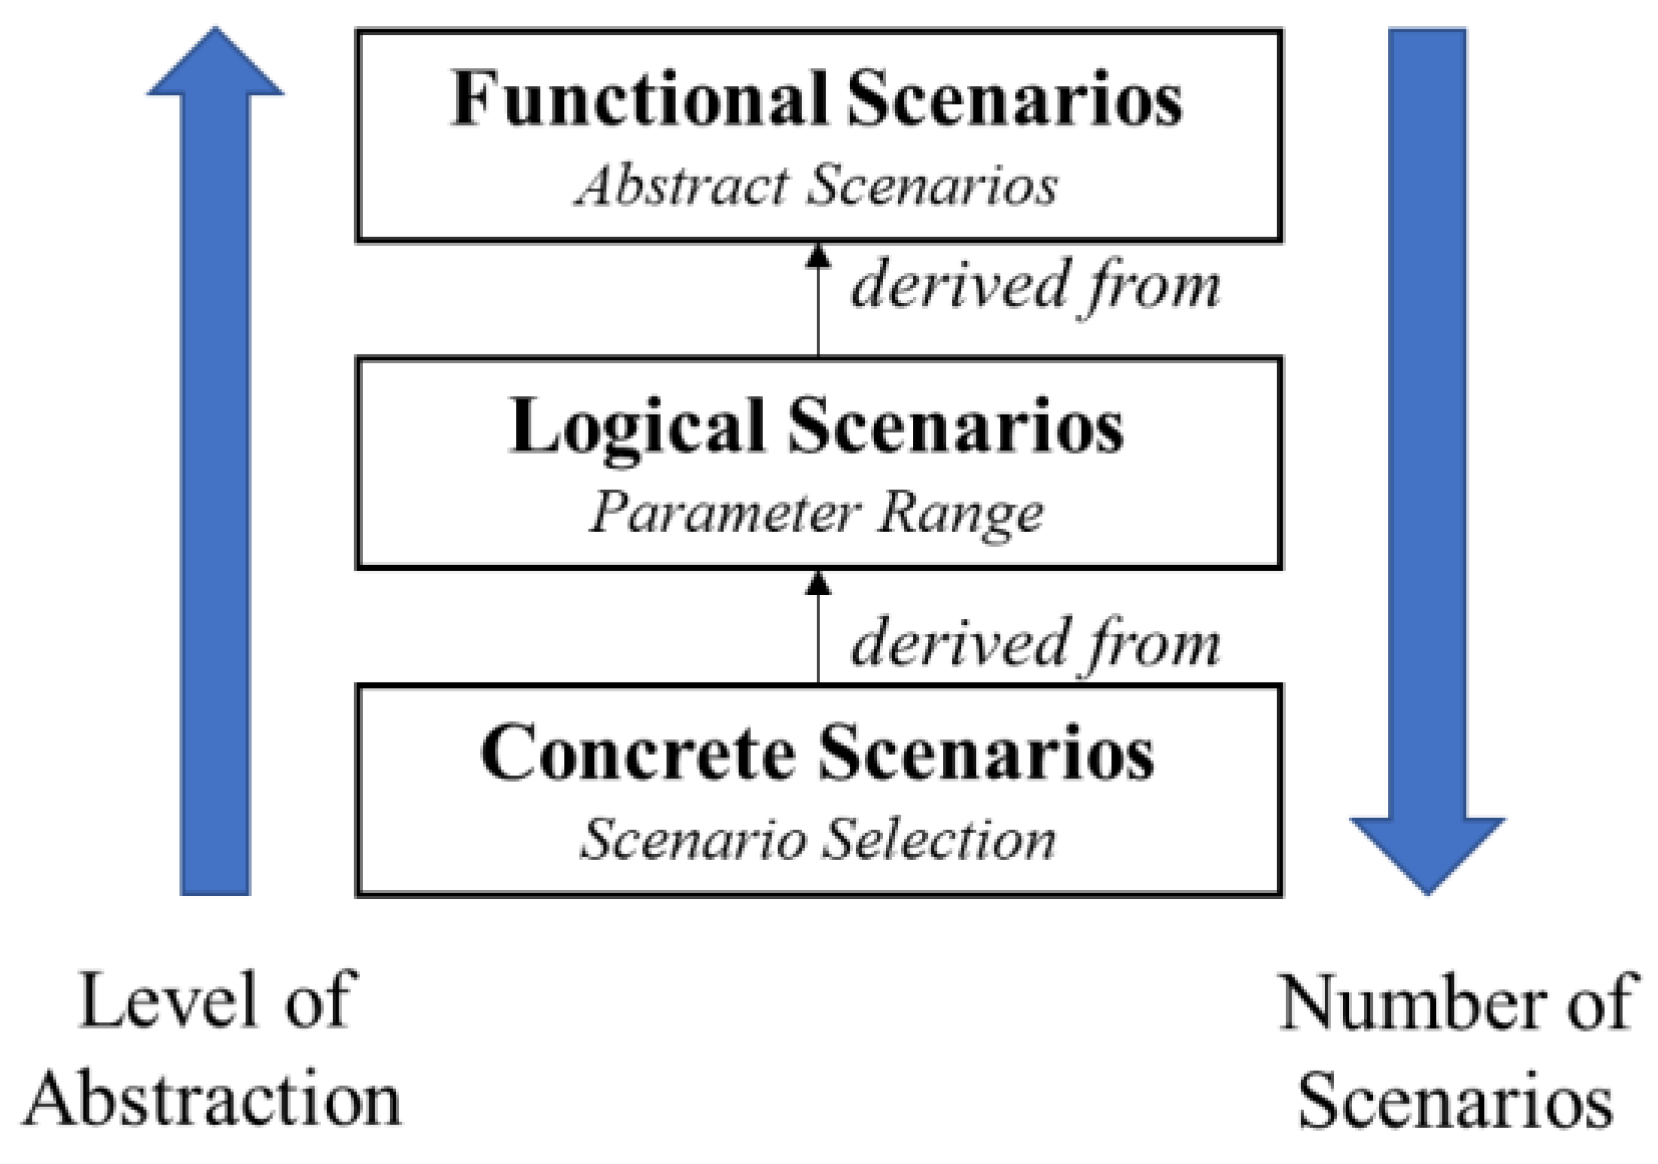
3.1. Critical Scenarios

The most common measure used in the literature to determine the criticality of scenario is time-to-collision (TTC) [56]. This can be defined as the remaining time from the current time to the time for two objects to collide if they persist on their current planned trajectory (speed and direction). The lower the value of TTC, the more critical a scenario.
This paper focuses on scenarios where TTC represents the time for the two NLOS vehicles (ego and CAV) to collide. Given the current planned trajectory, td is the point in time along the planned trajectory after which, if the ego detects the CAV, there is not sufficient time for the vehicle to react, manoeuvre or brake in order to avoid a collision (and to note that the presence of an obstacle or the geometry of the road prevents early detection of the CAV before td). In such a scenario, if the ego vehicle receives information regarding an oncoming object before the td, this would allow for an early reaction that would change speed or direction in order to avoid the collision. The TTC is determined via the simulation-based approach rather than mathematically. A simulation-based approach is used as this can be easily implemented for any scenario with any underlying road network with no or little change to the function to determine TTC. This is more advantageous than any mathematical calculation as it takes into consideration all varying parameters, such as yaw, and can be easily implemented for corner scenarios.
The total time taken for an ego vehicle to detect and react is termed as total stopping time (TST), as depicted in Equation (1). This is the time taken for the vehicle to travel the total stopping distance which is made up of the braking distance and reaction time. The time to react is the product of perception–reaction time and speed of the vehicle [84].
T S T = T T S + T T D + T T R
where TTS is time to stop, TTD is time to detect and TTR is time to react. TTS can be acquired by first determining the braking distance. The braking distance is shown in Equation (2) [85,86].
d = 1 2 K a ln ( 1 + K a K t v 2 )  
where:
K a = ρ 2 m ( C D )
K t = ( 0.01 + µ ) g
and v , ρ , m , g   , µ and C D depict velocity, atmospheric density, mass, acceleration due to gravity, road friction coefficient and drag factor, respectively.
TTS can be determined using Equation (5):
T T S = v d  
To calculate time to detect (TTD), the following inputs are required: the starting position x p , position of detection x d and velocity v , as shown in Equation (6). Time to React (TTR) has been calculated incorporating vehicle dynamics.
T T D = ( x d x p ) v
Therefore, a critical scenario is defined as a scenario involving at least two dynamic objects (for example, the ego vehicle or the vehicle under test and a CAV) such that the ego and CAV are in NLOS from each other and their planned trajectories and speed will lead to a collision. Therefore, a criticality metric is developed using TTC and TST (obtained as explained above) which meets the following conditions:
  • The position of both dynamic objects must be within NLOS (i.e., the ego vehicle’s on-board sensors have not detected the CAV) from each other.
  • There must exist a point of interaction between the trajectories of both dynamic objects, which is also known as the collision point (CP).
  • The time taken for both dynamic objects to reach the CP must be within TTC.
  • The time taken for the ego vehicle to perceive and react to the oncoming dynamic object and reach a velocity of zero is known as the TST.
  • A scenario is therefore critical if TTC < TST or within a safety parameter.
Section 3.2 discusses the selection of a critical scenario using a T-junction scenario whose boundaries and parameters are depicted in Figure 6.

3.2. Simulation Environment

The simulation environment used was MATLAB/Simulink with Automated Driving Toolbox which streamlines the implementation and evaluation of autonomous driving concepts.
In this work, the design and simulation of the environment (Figure 4) and vehicle dynamics (Figure 5) have been carried out with the use of MATLAB built-in libraries, models and algorithms. The vehicle model used was the force input bicycle model, as seen in Figure 5. The kinematic bicycle model, while a simplification of the kinematic four-wheel model, is considered to be sufficiently representative over a large range of operations, hence it has been widely adopted in many studies by academia and industry [87,88].
Automated Driving Toolbox and MATLAB-based functions were also used to compute TTC. A simulation-based approach is used as this can be easily implemented for any scenario with any underlying road network with no or little change to the function to determine TTC. This is more advantageous to mathematical calculation as it incorporates the dynamics of the environment and actors in a scenario.
A dedicated MATLAB function has been written to send/receive messages at regular intervals when the vehicles are within communication range. It must be noted here that aspects of the communication such as latency, maximum range of communication and other protocols can be tested using the generated scenarios to validate, for example, how suitable a particular communication technology is to mitigate arising critical scenarios.
The genetic algorithm presented in Section 3.3 was also implemented within a MATLAB/Simulink environment.

3.3. Genetic Algorithm

A GA is an optimisation algorithm that is utilised in the current context to identify a set of safety-critical scenarios from the set of all NLOS scenarios for a given road layout. For proof of concept, this research will use a T-junction as an example of NLOS scenarios as illustrated in Figure 6. This scenario consists of a road layout as well as an obstacle to obscure vehicle perception.
The GA will seek to identify critical scenarios by determining the fitness value of a scenario given a set of input parameters. For the purpose of this experiment, we will fix the number of road users to two: the ego vehicle and the connected autonomous vehicle. The speed ranges use UK government data [89] acquired from the probability of speed distribution given a particular speed limit; a function for the probability distribution is an input to the GA. The scenario space for each individual scenario is made up of a set of parameters which are inputted to the GA. The scenario space has these parameters:
  • Position of the ego vehicle [XEgo, YEgo, ZEgo].
  • Position of the CAV [XCAV, YCAV, ZCAV].
  • The position is based on bounding box range as shown in Figure 2. Upper and lower limits for the X and Y position of the ego vehicle and CAV are within NLOS range. As mentioned above, this has been determined through simulation.
  • Speed of the ego vehicle.
  • Speed of the CAV.
The speed for the initial population is selected from the speed distribution depicted in Figure 7. The likelihood of a speed being selected is directly proportional to its probability within the speed probability distribution. A MATLAB function has been defined to facilitate this selection. Algorithm 1 below shows the genetic algorithm steps.
Algorithm 1 below shows the genetic algorithm steps.
Algorithm 1: Genetic algorithm for NLOS critical scenario selection
Input:
Population size, n
Maximum number of iterations, MAX
Output:
Critical scenario
Begin:
Generate initial population (randomly) of n chromosomes Yi (i = 1, 2, …, n)
Set iteration counter t = 0
Compute the fitness values of each chromosome
while
(t < MAX) Step 1: The individuals are ranked according to fitness value
Step 2: The elitism rate is checked and, depending on the value, the appropriate number of individuals are taken over to the next generation
Step 3: Select a pair of chromosomes from the current generation based on fitness
Step 4: Apply crossover operation on the selected pair with crossover probability
Step 5: Select a chromosome from the current generation based on fitness
Step 6: Apply mutation on the selected individual with mutation probability
Step 7: Replace the old population with a newly generated population
Step 8: Increment the current iteration t by 1
end while
return the critical scenario
end
The input parameters to the GA are as follows: population size, number of generations, probability of crossover (Pc), probability of mutation (Pm) and elitism rate (Er). The values for these have been determined empirically through experimentation. The chromosomes are represented using real-value encoding. The genes of each chromosome include Position of the Ego, Position of the Car, Speed of the Ego and Speed of the Car.
The fitness function evaluates the fitness value f (Y) of each individual, Yi, in the population. To determine the fitness value of each individual, the metric that represents the criticality of the scenarios is used (as discussed in Section 3.1). The fitness value is then evaluated (by using a normalised value of the difference between TTC and TST) by comparing the TTC and the TST (TTC < TST). The lower the fitness value, the lower the difference between TTC and TST. A roulette wheel selection function [90] is used to select individuals with lower fitness values for the next generation.
An individual or a scenario outputted from the GA can be within one of the following categories as discussed below and shown in Figure 8.
  • Category 1:
This comprises individuals whose TTC < TST. Individuals in this category require information before hand in order to avoid a collision. These individuals make up a small percentage within the large scenario space.
  • Category 2:
This comprises individuals whose TTC is not less than TST but is within a certain safety parameter (which has been assumed to be 5 m). Individuals in this category could result in a collision and can move to category 1 if any parameter is changed negatively, for example, road surface conditions become icy. The individuals in this category require communication despite the possibility of being able to avoid a collision narrowly.
  • Category 3:
The individuals in this category have TST < TTC and would therefore not require communication in order to avoid a collision. However, if any parameter is changed negatively, the individuals in this category can move to Category 2.
  • Category 4:
Category 4 comprises those individuals in which no collision occurs. Since there would have been no collision that would have occurred, there would be no value for TTC. The TTC for individuals in this category is equal to the total run time of the simulation. Thus, having a larger value for TTC.
The GA is used to search for solutions that lay within Category 1 and Category 2.

4. Results

To guide the GA, a fitness value is assigned to each scenario using the metrics time-to-collision (TTC) and total stopping time (TST). The lower a fitness value, the more critical a scenario and the more likely that a scenario is taken to the next generation. The entire implementation of the GA was conducted within the MATLAB environment utilising the Automated Driving Toolbox. The parameters used to run the GA are as follows:
  • Population Size: 50.
  • Number of Generations: 100.
  • Crossover Rate: 0.85.
  • Mutation Rate: 0.1.
  • Elitism Rate: 0.2.
To conduct the experiment, the GA was executed multiple times (greater than 100) for the selected road layout with a different combination of speed limits. For each speed limit combination, the GA outputs a slightly different optimum scenario, e.g., a T-junction with a chosen speed limit for the road segment with the GA selecting a certain value of road user positions and speeds (corresponding to the speed limit) that leads to a critical scenario. As part of implementation for each speed limit combination (within the UK context which is in mph and is as follows: [20,30,50,60,70]), the optimum chromosome is outputted after maximum generation has been reached.
Table 2 shows the results of a sample of 25 experiments (the best 25 of all the GA runs or the most critical scenarios with lowest fitness values) each resulting in the optimum chromosome being selected with its corresponding fitness value. Next, a test is conducted to ensure all scenarios selected by the GA do lead to a collision and hence validate the approach. To conduct this test, the chromosome is inputted to the simulation environment, where through simulation it is determined whether a collision will occur or not. All scenarios within Table 2 lead to a collision. The scenario crash validates that none of the outputted scenarios lay within scenario Category 4 (as discussed in Section 3.3). The simulations within this section assumed that the ego vehicle did not react, even when the sensors detected the other vehicle (of course detection range is still satisfying the criticality scenario), and hence these tests are termed as lower bound tests as they depict tests in the most pessimistic layout.
However, the ego vehicle will react depending upon its software algorithms (for example, collision avoidance algorithm or trajectory planning) and control systems.

5. Discussion

This section discusses the efficacy of the proposed GA approach in identifying critical scenarios. This has been performed by discussing the validation of the GA selected scenarios on the MATLAB simulation platform and categorising them as discussed in Section 3.3. We highlight that experiments have been conducted in ideal scenarios and factored in realistic attributes, such as weather and road surface condition, that will make the selected scenarios more critical in nature. We go on to discuss that the scenarios and MATLAB platform can be utilised to test algorithms incorporating vehicular communication through another experiment and discuss a possible way to validate the success of the tested algorithms, i.e., through measurement of TTC.
In Section 4, a lower bound test was conducted to ensure all scenario outputted from the GA are within the first three categories. A lower bound test is one that was conducted in the most pessimistic setting assuming that the ego vehicle does not react and apply brakes on detection of the obstacle. As discussed earlier, a critical scenario resides within Category 1 and 2. To determine this, a second experiment was conducted. This experiment differs from the initial experiment by including straightforward braking (assuming negligible algorithm processing and reaction time) such that when the sensors detect an oncoming obstacle, braking is applied. This experiment measures the distance from the point where the trajectories of the ego vehicle and CAV intersect (otherwise known as the collision point).
Furthermore, a third experiment was set up which incorporated vehicular communication which was configured to send information from the CAV to the ego vehicle. The information included its current time, position, speed and heading [83]. The third experiment was set up to determine how early detection has an effect on distance from collision point.
The sample results which consisted of critical scenarios from Section 4 (Table 2) were inputted into both simulation environments: a scenario with no communication (Experiment 2) and a scenario with communication (Experiment 3). Table 3 shows the stopping distance from the collision point without communication and with communication for the same underlying scenario.
From Table 3, it can be observed that the distance from the collision point is much greater when communication is introduced or when the ego vehicle is aware of the obstacle much earlier. Looking into the results of Table 3 under column 1 more minutely, in scenario number 4 the ego vehicle was only 1.39 m away from the collision point when it came to a stop on braking initiation. Similarly, several other scenarios have less than 3 m distance from the collision point. This distance is the distance where the ego vehicle comes to a complete halt upon initiating braking from the point the sensors detect the oncoming CAV. This is in the most optimistic road and weather condition, or in other words the best-case scenario, and hence if any of these parameters were to change slightly, Category 3 scenarios would move to Category 2 and Category 2 scenarios would likewise be in Category 1. These results show the GA was successfully able to search the scenario space for critical scenarios. Figure 9 illustrates the results from Table 3 and the corresponding scenario categories of the simulation without communication.
Figure 9 shows the scenario categories; the red dots indicate scenarios in Category 2 and the orange dots indicate scenarios in Category 3. From Figure 9 it can be observed that a large number of scenarios have a stopping distance from collision point of less than 5 m (Category 2) with many coming under 3 m. From the results it can be seen that the scenarios outputted from the GA fit within the definition of critical scenarios as discussed in Section 3.1. A scenario is considered critical if TTC < TST (Category 1) or within a threshold safety value (Category 2). The safety value is when the stopping distance is within a small distance from the collision point, which has been assumed to be 5 m. If there was a change in weather condition which would lead to the need for a much larger braking distance, this could result in a collision and the Category 2 scenarios would very likely be Category 1 scenarios. Furthermore, if system performance or reaction time was to change as suggested by Hammerschmidt et al. [84], an autonomous vehicle could have a reaction time of up to 0.5 s and, with these parameters, all the scenarios from Category 2 would be within Category 1 and all scenarios within Category 3 would be either within Category 1 or within the upper limits of Category 2. Figure 10 compares these results with communication to determine the braking distance if communication was received beforehand.
Figure 10 shows the comparison of the results of distance to collision point with and without communication. From Figure 10 it can be observed that most of the critical scenarios acquired from the GA have a stopping distance of less than 5 m, with a few a little over 5 m and an outlier at just under 10 m. These scenarios are critical scenarios, as discussed earlier, where any change in parameters leads to a collision. These scenarios can be used as test scenarios to test algorithms, for example, obstacle detection, trajectory planning or collision avoidance. Comparing this to results acquired with a communication network, it can be observed that the stopping distance from the collision point for most of the scenarios was over 15 m. This confirms the need for communication beforehand in order to avoid a collision. From this it is clearly seen that the scenarios are also capable of being used as test scenarios for any new development within the V2X communcation area and not just for autonomous vehicle navigation algorithms.

6. Conclusions and Future Work

This paper discuses a methodology for selecting NLOS critical scenarios. This has been achieved using a GA. The fitness function in the GA uses the criticality metric discussed in Section 3 to search the scenario space and filter out identified scenarios. From Figure 11, results demonstrating how effectively the genetic algorithm searched the scenario space can be seen. Several simulations of the genetic algorithm were run (with setting parameters as discussed in Section 4), and results are visualised in the graphs below:
From the graphs (A and B) in Figure 11, it can be seen that the genetic algorithm was searching the scenario space effectively by having a population with a lower fitness after each generation. Based on the empirical data collated when testing the scenario, we can assume that there is high probability of obtaining a collision scenario. From this data, it can be noted that the GA is able to effectively locate valid scenarios. From the categories defined in Section 3.3, most scenarios seem to fall between Category 2 and 3. This is perhaps because the GA is getting stuck in a local minima and hence Category 1 is not identified. An improvement to the GA would be to locate Category 1 scenarios by coming out of the local minima. Another possibility is that they are not sufficiently complex because the current test scenarios are not Category 1. A more complex scenario would include more traffic participants, various driving manoeuvres and more underlying parameters, such as weather and road surface conditions. Furthermore, this research also addresses the need for vehicle-to-vehicle communication, as shown from the results. When the vehicle receives information beforehand, the distance to the collision point increases and thus reverts the criticality of the scenario.
The methodology outlined within this paper can be easily expanded to a crossroad, developed into a roundabout or adapted to be a simpler curve (with blind corners) on the same road by removing one outgoing road. Once the underlying road network is selected, additional genes (to represent additional road user parameters, weather conditions, road surface conditions, etc.) can be added to an individual chromosome. Much of the GA will remain the same, with a need to review the fitness function so that it incorporates additional factors such as road surface conditions, thus identifying critical NLOS test scenarios which can be used to validate algorithms as discussed.

Author Contributions

Conceptualization, T.A., L.D. and D.P.; methodology, T.A. and L.D.; software, T.A. and D.P.; validation, T.A., L.D. and D.P.; investigation, T.A.; resources, T.A., L.D. and D.P.; data curation, T.A.; writing—original draft preparation, T.A.; writing—review and editing, T.A., L.D. and D.P.; visualization, T.A., L.D. and D.P.; supervision, D.E., L.D. and D.P.; project administration, L.D.; funding acquisition, No external funding. PhD project. All authors have read and agreed to the published version of the manuscript.

Funding

This research received no external funding.

Data Availability Statement

Can be made available upon request.

Conflicts of Interest

The authors declare no conflict of interest.

References

  1. Van Brummelen, J.; O’brien, M.; Gruyer, D.; Najjaran, H. Autonomous vehicle perception: The technology of today and tomorrow. Transp. Res. Part C 2018, 89, 384–406. [Google Scholar] [CrossRef]
  2. Rasshofer, R.H.; Gresser, K. Automotive Radar and Lidar Systems for Next Generation Driver Assistance Functions. Adv. Radio Sci. 2005, 3, 205–209. [Google Scholar] [CrossRef] [Green Version]
  3. Mohammed, A.S.; Amamou, A.; Ayevide, F.K.; Kelouwani, S.; Agbossou, K.; Zioui, N. The perception system of intelligent ground vehicles in all weather conditions: A systematic literature review. Sensors 2020, 20, 6532. [Google Scholar] [CrossRef] [PubMed]
  4. Leibe, B.; Seemann, E.; Schiele, B. Pedestrian detection in crowded scenes. In Proceedings of the 2005 IEEE Computer Society Conference on Computer Vision and Pattern Recognition (CVPR 2005), San Diego, CA, USA, 20–25 June 2005; Volume I, pp. 878–885. [Google Scholar]
  5. Bogdoll, D.; Breitenstein, J.; Heidecker, F.; Bieshaar, M.; Sick, B.; Fingscheidt, T.; Zöllner, J.M. Description of Corner Cases in Automated Driving: Goals and Challenges. In Proceedings of the IEEE/CVF International Conference on Computer Vision, Montreal, BC, Canada, 7 October 2021; pp. 1023–1028. [Google Scholar]
  6. Elliott, D.; Keen, W.; Miao, L. Recent advances in connected and automated vehicles. J. Traffic Transp. Eng. 2019, 6, 109–131. [Google Scholar] [CrossRef]
  7. Saito, Y.; Sugaya, F.; Inoue, S.; Raksincharoensak, P.; Inoue, H. A context-aware driver model for determining recommended speed in blind intersection situations. Accid. Anal. Prev. 2021, 163, 106447. [Google Scholar] [CrossRef]
  8. Hussein, M.; Erol-Kantarci, M.; Sorour, S. Connected and Autonomous Vehicles in Smart Cities; CRC Press: Boca Raton, FL, USA, 2020. [Google Scholar]
  9. Payen de La Garanderie, G.; Atapour Abarghouei, A.; Breckon, T.P. Eliminating the blind spot: Adapting 3D object detection and monocular depth estimation to 360° Panoramic Imagery. In Proceedings of the European Conference on Computer Vision (ECCV), Munich, Germany, 8–14 September 2018; pp. 789–807. [Google Scholar]
  10. Kwon, D.; Malaiya, R.; Yoon, G.; Ryu, J.-T.; Pi, S.-Y. A Study on Development of the Camera-Based Blind Spot Detection System Using the Deep Learning Methodology. Appl. Sci. 2018, 9, 2941. [Google Scholar] [CrossRef] [Green Version]
  11. Kukkala, V.K.; Tunnell, J.; Pasricha, S.; Bradley, T. Advanced Driver-Assistance Systems: A Path Toward Autonomous Vehicles. IEEE Consum. Electron. Mag. 2018, 7, 18–25. [Google Scholar] [CrossRef]
  12. Urmson, C.; Anhalt, J.; Bagnell, D.; Baker, C.; Bittner, R.; Clark, M.N.; Dolan, J.; Duggins, D.; Galatali, T.; Geyer, C.; et al. Autonomous driving in Urban environments: Boss and the Urban Challenge. In The DARPA Urban Challenge; Springer: Berlin/Heidelberg, Germany, 2009; Volume 56, pp. 1–59. [Google Scholar]
  13. Chu, K. Methods and Systems for Blind Spot Detection in an Autonomous Vehicle. U.S. Patents 20190011913A1, 7 May 2017. Available online: https://patents.google.com/patent/US20190011913A1/en (accessed on 17 January 2020).
  14. HMinn, H.; Zeng, M.; Bhargava, V. Towards a definition of the {Internet of Things (IoT)}. IEEE Internet Initiat. 2015, 1, 1–86. [Google Scholar]
  15. Anaya, J.J.; Talavera, E.; Gimenez, D.; Gomez, N.; Felipe, J.; Naranjo, J.E. Vulnerable Road Users Detection Using V2X Communications. In Proceedings of the 2015 IEEE 18th International Conference on Intelligent Transportation Systems, Gran Canaria, Spain, 15–18 September 2015; pp. 107–112. [Google Scholar]
  16. Hobert, L.; Festag, A.; Llatser, I.; Altomare, L.; Visintainer, F.; Kovacs, A. Enhancements of V2X communication in support of cooperative autonomous driving. IEEE Commun. Mag. 2015, 53, 64–70. [Google Scholar] [CrossRef]
  17. Hussein, A.; Marín-Plaza, P.; García, F.; Armingol, J.M. Autonomous cooperative driving using V2X communications in off-road environment. In Proceedings of the 2017 IEEE 20th International Conference on Intelligent Transportation Systems (ITSC), Yokohama, Japan, 16–19 October 2019. [Google Scholar]
  18. Naranjo, J.E.; Jiménez, F.; Anaya, J.J.; Talavera, E.; Gómez, O. Application of vehicle to another entity (V2X) communications for motorcycle crash avoidance. J. Intell. Transp. Syst. 2016, 21, 285–295. [Google Scholar] [CrossRef]
  19. Alodadi, K.; Al-Bayatti, A.H.; Alalwan, N. Cooperative volunteer protocol to detect non-line of sight nodes in vehicular ad hoc networks. Veh. Commun. 2017, 9, 72–82. [Google Scholar] [CrossRef]
  20. Menzel, T.; Bagschik, G.; Maurer, M. Scenarios for Development, Test and Validation of Automated Vehicles. In Proceedings of the 2018 IEEE Intelligent Vehicles Symposium, Changshu, China, 26–30 June 2018. [Google Scholar]
  21. Chen, J.; Yuan, B.; Tomizuka, M. Model-free Deep Reinforcement Learning for Urban Autonomous Driving. In Proceedings of the 2019 IEEE Intelligent Transportation Systems Conference, Auckland, New Zealand, 27–30 October 2019; pp. 2765–2771. [Google Scholar]
  22. Amersbach, C.; Winner, H. Functional decomposition—A contribution to overcome the parameter space explosion during validation of highly automated driving. Traffic Inj. Prev. 2019, 20 (Suppl. S1), S52–S57. [Google Scholar] [CrossRef] [PubMed] [Green Version]
  23. Riedmaier, S.; Schneider, D.; Watzenig, D.; Diermeyer, F.; Schick, B. Model validation and scenario selection for virtual-based homologation of automated vehicles. Appl. Sci. 2021, 11, 35. [Google Scholar] [CrossRef]
  24. Ortega, J.; Lengyel, H.; Szalay, Z. Overtaking maneuver scenario building for autonomous vehicles with PreScan software. Transp. Eng. 2020, 2, 100029. [Google Scholar] [CrossRef]
  25. Wongpiromsarn, T.; Murray, R.M. Formal Verification of an Autonomous Vehicle System. In Proceedings of the Conference on Decision and Control 2008, Cancún, Mexico, 9–11 December 2008. [Google Scholar]
  26. Ireland, M.L.; Hoffmann, R.; Miller, A.; Norman, G.; Veres, S.M. A Continuous-Time Model of an Autonomous Aerial Vehicle to Inform and Validate Formal Verification Methods. arXiv 2016, arXiv:1609.00177. [Google Scholar]
  27. Althoff, M.; Rajhans, A.; Krogh, B.H.; Yaldiz, S.; Li, X.; Pileggi, L. Formal verification of phase-locked loops using reachability analysis and continuization. Commun. ACM 2013, 56, 97–104. [Google Scholar] [CrossRef] [Green Version]
  28. Shalev-Shwartz, S.; Shammah, S.; Shashua, A. On a Formal Model of Safe and Scalable Self-driving Cars. arXiv 2017, arXiv:1708.06374. [Google Scholar]
  29. Riedmaier, S.; Ponn, T.; Ludwig, D.; Schick, B.; Diermeyer, F. Survey on Scenario-Based Safety Assessment of Automated Vehicles. IEEE Access 2020, 8, 87456–87477. [Google Scholar] [CrossRef]
  30. Koenig, A.; Witzlsperger, K.; Leutwiler, F.; Hohmann, S. Overview of HAD validation and passive HAD as a concept for validating highly automated cars. Automatisierungstechnik 2018, 66, 132–145. [Google Scholar] [CrossRef]
  31. Wachenfeld, W.; Winner, H. Virtual Assessment of Automation in Field Operation. A New Runtime Validation Method. Rob. Auton. Syst. 2015, 10, 60. [Google Scholar]
  32. Zong, W.; Zhang, C.; Wang, Z.; Zhu, J.; Chen, Q. Architecture design and implementation of an autonomous vehicle. IEEE Access 2018, 6, 21956–21970. [Google Scholar] [CrossRef]
  33. Waymo, Safety Report and Whitepapers—Waymo. 2020. Available online: https://waymo.com/safety/ (accessed on 4 December 2021).
  34. Barnard, Y.; Innamaa, S.; Koskinen, S.; Gellerman, H.; Svanberg, E.; Chen, H. Methodology for Field Operational Tests of Automated Vehicles. Transp. Res. Procedia 2016, 14, 2188–2196. [Google Scholar] [CrossRef] [Green Version]
  35. Ziegler, J.; Bender, P.; Schreiber, M.; Lategahn, H.; Strauss, T.; Stiller, C. Making Bertha Drive—An Autonomous Journey on a Historic Route. IEEE Intell. Transp. Syst. Mag. 2014, 6, 8–20. [Google Scholar] [CrossRef]
  36. Althoff, M.; Dolan, J.M. Online verification of automated road vehicles using reachability analysis. IEEE Trans. Robot. 2014, 30, 903–918. [Google Scholar] [CrossRef] [Green Version]
  37. Waymo, Waymo Opens Robo-Taxi Service to the Public in US City of Phoenix | Technology News. 2020. Available online: https://gadgets.ndtv.com/transportation/news/google-waymo-self-driving-cars-phoenix-launch-2307438 (accessed on 4 December 2021).
  38. Tesla, Tesla’s ‘Dojo’ Deployment in 2021 Will Make Autopilot and FSD a ‘Distant First’ against Rivals. 2020. Available online: https://www.teslarati.com/tesla-dojo-autopilot-fsd-improvements-release-date/ (accessed on 4 December 2021).
  39. Bach, J.; Holzäpfel, M.; Otten, S.; Sax, E. Reactive-Replay Approach for Verification and Validation of Closed-Loop Control Systems in Early Development. SAE Technol. Pap. 2017. [Google Scholar] [CrossRef]
  40. Nilsson, J. Computational Verification Methods for Automotive Safety Systems; Chalmers Tekniska Hogskola: Gothenburg, Sweden, 2014. [Google Scholar]
  41. Kruber, F.; Wurst, J.; Botsch, M. An Unsupervised Random Forest Clustering Technique for Automatic Traffic Scenario Categorization. In Proceedings of the 2018 21st International Conference on Intelligent Transportation Systems (ITSC), Maui, HI, USA, 4–7 November 2018; pp. 2811–2818. [Google Scholar]
  42. Bolte, J.A.; Bar, A.; Lipinski, D.; Fingscheidt, T. Towards corner case detection for autonomous driving. In Proceedings of the 2019 IEEE Intelligent Vehicles Symposium (IV), Paris, France, 9–12 June 2019; pp. 438–445. [Google Scholar]
  43. Lenard, J.; Badea-romero, A.; Danton, R. Typical pedestrian accident scenarios for the development of autonomous emergency braking test protocols. Accid. Anal. Prev. 2014, 73, 73–80. [Google Scholar] [CrossRef] [Green Version]
  44. Tuncali, C.E.; Pavlic, T.P.; Fainekos, G. Utilizing S-TaLiRo as an automatic test generation framework for autonomous vehicles. In Proceedings of the 2016 IEEE 19th International Conference on Intelligent Transportation Systems (ITSC), Rio de Janeiro, Brazil, 1–4 November 2016; pp. 1470–1475. [Google Scholar]
  45. Tuncali, C.E.; Fainekos, G.; Ito, H.; Kapinski, J. Simulation-based Adversarial Test Generation for Autonomous Vehicles with Machine Learning Components. In Proceedings of the 2018 IEEE Intelligent Vehicles Symposium (IV), Changshu, China, 26–30 June 2018; pp. 1555–1562. [Google Scholar]
  46. Nalic, D.; Mihalj, T.; Baumler, M.; Lehmann, M. Scenario Based Testing of Automated Driving Systems: A Literature Survey. Proc. FISITA Web Congr. 2020, 30, 1–10. [Google Scholar]
  47. Kalra, N.; Paddock, S.M. Driving to safety: How many miles of driving would it take to demonstrate autonomous vehicle reliability? Transp. Res. Part A Policy Pract. 2016, 94, 182–193. [Google Scholar] [CrossRef]
  48. Ma, J.; Schwarz, C.; Wang, Z.; Elli, M.; Ros, G.; Feng, Y. New simulation tools for training and testing automated vehicles. In Proceedings of the Automated Vehicles Symposium 2019, Orlando, FL, USA, 15 July 2019; pp. 111–119. [Google Scholar]
  49. Waymo. 2020. Available online: https://waymo.com/ (accessed on 7 April 2021).
  50. Weber, H.; Bock, J.; Klimke, J.; Roesener, C.; Hiller, J.; Krajewski, R.; Zlocki, A.; Eckstein, L. Traffic Injury Prevention A framework for definition of logical scenarios for safety assurance of automated driving A framework for definition of logical scenarios for safety assurance of automated driving. Traffic Inj. Prev. 2019, 20, S65–S70. [Google Scholar] [CrossRef] [Green Version]
  51. Nitsche, P. Safety-Critical Scenarios and Virtual Testing Procedures for Automated Cars at Road Intersections. Ph.D. Thesis, Loughborough University, Loughbrough, UK, 2018. [Google Scholar]
  52. Mahmud, S.M.S.; Ferreira, L.; Hoque, M.S.; Tavassoli, A. Application of proximal surrogate indicators for safety evaluation: A review of recent developments and research needs. IATSS Res. 2017, 41, 153–163. [Google Scholar] [CrossRef]
  53. Hayward, J.C. Near-Miss Determination through use of a scale of danger. Highw. Res. Board 1972, 24–35. Available online: https://onlinepubs.trb.org/Onlinepubs/hrr/1972/384/384-004.pdf (accessed on 30 March 2022).
  54. Junietz, P.; Bonakdar, F.; Klamann, B.; Winner, H. Criticality Metric for the Safety Validation of Automated Driving using Model Predictive Trajectory Optimization. In Proceedings of the 2018 21st International Conference on Intelligent Transportation Systems, Maui, HI, USA, 4–7 November 2018; pp. 60–65. [Google Scholar]
  55. Matthias, S.; Volker, W.; Jurgen, A. An Integrated Approach to Maneuver-Based Trajectory Prediction and Criticality Assessment in Arbitrary Road Environments. IEEE Trans. Intell. Transp. Syst. 2016, 17, 2751–2766. [Google Scholar]
  56. Minderhoud, M.M.; Bovy, P.H.L. Extended time-to-collision measures for road traffic safety assessment. Accid. Anal. Prev. 2001, 33, 89–97. [Google Scholar] [CrossRef]
  57. Yang, H.; Ozbay, K.; Bartin, B. Application of Simulation-Based Traffic Conflict Analysis for Highway Safety Evaluation. Sel. Proc. World Conf. Transp. Res. 2010, 12, 14. [Google Scholar]
  58. Yang, H. Simulation-Based Evaluation of Traffic Safety Performance Using Surrogate Safety Measures; Rutgers The State University of New Jersey-New Brunswick: New Brunswick, NJ, USA, 2012. [Google Scholar]
  59. Taieb-Maimon, M.; Shinar, D. Minimum and Comfortable Driving Headways: Reality versus Perception. Hum. Factors 2016, 43, 159–172. [Google Scholar] [CrossRef] [PubMed]
  60. Vogel, K. A comparison of headway and time to collision as safety indicators. Accid. Anal. Prev. 2003, 35, 427–433. [Google Scholar] [CrossRef]
  61. Shbeeb, L. Development of Traffic Conflicts Technique for Different Environments: A Comparative Study of Pedestrian Conflicts in Sweden and Jordan. 2000. Available online: https://lup.lub.lu.se/search/publication/19830 (accessed on 1 September 2021).
  62. Archer, J.; Kungl, T. Indicators for Traffic Safety Assessment and Prediction and Their Application in Micro-Simulation Modelling: A Study of Urban and Suburban Intersections. Ph.D. Dissertaion, KTH Royal Institute of Technology, Stockholm, Sweden, 2005. [Google Scholar]
  63. Songchitruksa, P.; Tarko, A.P. Practical Method for Estimating Frequency of Right-Angle Collisions at Traffic Signals. Transp. Res. Rec. 2006, 1953, 89–97. [Google Scholar] [CrossRef]
  64. Cunto, F. Assessing Safety Performance of Transportation Systems using Microscopic Simulation. Ph.D. Dissertation. UWSpace. Available online: http://hdl.handle.net/10012/4111 (accessed on 1 September 2021).
  65. Saffarzadeh, M.; Nadimi, N.; Naseralavi, S.; Mamdoohi, A.R. A general formulation for time-to-collision safety indicator. Proc. Inst. Civ. Eng. Transp. 2013, 166, 294–304. [Google Scholar] [CrossRef]
  66. Kochenderfer, M.J.; Wheeler, T.A. Algorithms for Optimization; The MIT Press Cambridge: London, UK, 2019. [Google Scholar]
  67. Li, W.; Xiao, J.K.; Li, W.M.; Xiao, X.R. Optimization on Black Box Function Optimization Problem. Math. Probl. Eng. 2015, 2015, 647234. [Google Scholar]
  68. Kluck, F.; Zimmermann, M.; Wotawa, F.; Nica, M. Genetic Algorithm-Based Test Parameter Optimization for ADAS System Testing. In Proceedings of the 19th IEEE International Conference on Software Quality, Reliability, and Security, QRS 2019, Sofia, Bulgaria, 22–26 July 2019; pp. 418–425. [Google Scholar]
  69. Abdessalem, R.B.; Nejati, S.; Briand, L.C.; Stifter, T. Testing vision-based control systems using learnable evolutionary algorithms. In Proceedings of the International Conference on Software Engineering, Gothenburg, Sweden, 27 May–3 June 2018; pp. 1016–1026. [Google Scholar]
  70. Cutrone, S.; Liew, C.W.; Utter, B.; Brown, A. A Framework for Identifying and Simulating Worst-Case Animal-Vehicle Interactions. In Proceedings of the 2018 IEEE International Conference on Systems, Man, and Cybernetics, SMC 2018, Miyazaki, Japan, 7–10 October 2018; pp. 1995–2000. [Google Scholar]
  71. Gladisch, C.; Heinz, T.; Heinzemann, C.; Oehlerking, J.; von Vietinghoff, A.; Pfitzer, T. Experience Paper: Search-Based Testing in Automated Driving Control Applications. In Proceedings of the 2019 34th IEEE/ACM International Conference on Automated Software Engineering, San Diego, CA, USA, 10–15 November 2019; pp. 26–37. [Google Scholar]
  72. Gangopadhyay, B.; Khastgir, S.; Dey, S.; Dasgupta, P.; Montana, G.; Jennings, P. Identification of Test Cases for Automated Driving Systems Using Bayesian Optimization. In Proceedings of the 2019 IEEE Intelligent Transportation Systems Conference, ITSC 2019, Auckland, New Zealand, 27–30 October 2019; pp. 1961–1967. [Google Scholar]
  73. Masuda, S.; Nakamura, H.; Kajitani, K. Rule-based searching for collision test cases of autonomous vehicles simulation. IET Intell. Transp. Syst. 2018, 12, 1088–1095. [Google Scholar] [CrossRef]
  74. Huang, Z.; Lam, H.; Zhao, D. Sequential experimentation to efficiently test automated vehicles. In Proceedings of the IEEE Winter Simulation Conference (WSC), Las Vegas, NV, USA, 3–6 December 2017; p. 3078. [Google Scholar]
  75. Beglerovic, H.; Stolz, M.; Horn, M. Testing of autonomous vehicles using surrogate models and stochastic optimization. In Proceedings of the IEEE Conference on Intelligent Transportation Systems, ITSC, Yokohama, Japan, 16–20 October 2017. [Google Scholar]
  76. Feng, S.; Feng, Y.; Yan, X.; Shen, S.; Xu, S.; Liu, H.X. Safety assessment of highly automated driving systems in test tracks: A new framework. Accid. Anal. Prev. 2020, 144, 105664. [Google Scholar] [CrossRef]
  77. Feng, S.; Feng, Y.; Sun, H.; Bao, S.; Zhang, Y.; Liu, H.X. Testing Scenario Library Generation for Connected and Automated Vehicles, Part II: Case Studies. IEEE Trans. Intell. Transp. Syst. 2021, 22, 5635–5647. [Google Scholar] [CrossRef]
  78. Sthamer, H.-H. The Automatic Generation of Software Test Data Using Genetic Algorithms—ProQuest; ProQuest Dissertations Publishing (University of South Wales): Pontypridd, UK, 1995. [Google Scholar]
  79. Bühler, O.; Wegener, J. Automatic Testing of an Autonomous Parking System Using Evolutionary Computation; SAE Technical Papers; Soceity of Automotive Engineers: Warrendale, PA, USA, 2004; pp. 115–122. [Google Scholar]
  80. Buehler, O.; Wegener, J. Evolutionary Functional Testing of a Vehicle Brake Assistant System Introduction to Evolutionary Testing. In Proceedings of the 6th Metaheuristics International Conference, Wien, Austria, 22–26 August 2005; pp. 157–162. [Google Scholar]
  81. O’Kelly, M.; Abbas, H.; Mangharam, R. Computer-aided design for safe autonomous vehicles. In Proceedings of the 2017 Resilience Week, RWS 2017, Wilmington, DE, USA, 18–22 September 2017; pp. 90–96. [Google Scholar]
  82. Nitsche, P.; Thomas, P.; Stuetz, R.; Welsh, R. Pre-crash scenarios at road junctions: A clustering method for car crash data. Accid. Anal. Prev. 2017, 107, 137–151. [Google Scholar] [CrossRef] [PubMed] [Green Version]
  83. Sandin, J. Analysis of intersection crash statistics to define pre-crash test scenarios for detection sensors. In SAFER Report Project Scenario Based Testing of Pre-Crash Systems; SAFER-Vehicle and Traffic Safety Centre at Chalmers: Gothenburg, Sweden, 2009. [Google Scholar]
  84. Liang, X.; Guler, S.I.; Gayah, V.V. Joint Optimization of Signal Phasing and Timing and Vehicle Speed Guidance in a Connected and Autonomous Vehicle Environment. Transp. Res. Rec. 2019, 2673, 70–83. [Google Scholar] [CrossRef]
  85. Kavitha, C.; Ashok, B.; Nanthagopal, K.; Desai, R.; Rastogi, N.; Shetty, S. Braking distance algorithm for autonomous cars using road surface recognition. IOP Conf. Ser. Mater. Sci. Eng. 2017, 263, 062034. [Google Scholar] [CrossRef]
  86. Greibe, P. Determination of Braking Distance and Driver Behaviour Based on Braking Trials. In Proceedings of the 87th Transportation Research Board Annual Meeting, Washington DC, USA, 13–17 January 2008. [Google Scholar]
  87. Kong, J.; Pfeiffer, M.; Schildbach, G.; Borrelli, F. Kinematic and dynamic vehicle models for autonomous driving control design. In Proceedings of the IEEE Intelligent Vehicles Symposium, Seoul, Korea, 28 June–1 July 2015; pp. 1094–1099. [Google Scholar]
  88. Paden, B.; Čáp, M.; Yong, S.Z.; Yershov, D.; Frazzoli, E. A survey of motion planning and control techniques for self-driving urban vehicles. IEEE Trans. Intell. Veh. 2016, 1, 33–55. [Google Scholar] [CrossRef] [Green Version]
  89. UK GOV, Speed Limits—GOV.UK. 2020. Available online: https://www.gov.uk/speed-limits. (accessed on 9 August 2021).
  90. Sharma, P.; Wadhwa, A.; Komal, K. Analysis of Selection Schemes for Solving an Optimization Problem in Genetic Algorithm. Int. J. Comput. Appl. 2014, 93, 1–3. [Google Scholar] [CrossRef]
Figure 1. Scenario Development Process.
Software 01 00011 g001
Figure 2. Example NLOS scenario (T-junction).
Software 01 00011 g002
Figure 3. Sample Scenario Space.
Software 01 00011 g003
Figure 4. MATLAB/Simulink model of a vehicle and environment.
Software 01 00011 g004
Figure 5. MATLAB/Simulink vehicle dynamics model.
Software 01 00011 g005
Figure 6. T−junction scenario.
Software 01 00011 g006
Figure 7. Speed distribution for different speed limits. Adopted from [89].
Software 01 00011 g007
Figure 8. Categories for scenarios.
Software 01 00011 g008
Figure 9. Scenario categories (orange dots indicate Category 3 scenarios and red dots Category 2).
Software 01 00011 g009
Figure 10. Comparison of distances from collision point.
Software 01 00011 g010
Figure 11. Fitness value convergence curves of two example scenarios (Scenario 19 in (A) and Scenario 8 in (B) of Table 2).
Software 01 00011 g011
Table 1. Review of Safety Indicators.
Indicator Description Collision Type Reference
Time-to-collision (TTC) or Time-measured-to-collision (TMTC) The time it would take for the vehicles to collide if they continued on their current paths at their current speeds.Rear-end collision, weaving/turning, colliding with objects/parked vehicles, crossing and colliding with a pedestrian. [54,55]
Time exposed time-to-collision (TET) Sum of all times (during the time period under consideration) when a driver approaches a front vehicle with a TTC value less than TTC.As a result of a rear-end collision, turning/weaving, hitting objects/parked vehicles, crossing, hitting a pedestrian and vehicle–vehicle collision. [56]
Time integrated time-to-collision (TIT) The integral when TTC is below the threshold. As a result of a rear-end collision, turning/weaving, hitting objects/parked vehicles, crossing, hitting a pedestrian and vehicle–vehicle collision. [56]
Modified time-to-collision (MTTC)Models that were modified to account for all possible longitudinal conflict scenarios caused by acceleration or deceleration discrepancies.As a result of a rear-end collision, turning/weaving, hitting objects/parked vehicles, crossing, hitting a pedestrian and vehicle–vehicle collision.[57,58]
Crash index (CI)The effect of collision speed on the kinetic energy involved.As a result of a rear-end collision, turning/weaving, hitting objects/parked vehicles, crossing, hitting a pedestrian and vehicle–vehicle collision. [57]
Headway (H)The time it takes for the front of the leading vehicle to pass a point on the road and for the front of the following vehicle to pass the same point. As a result of a rear-end collision, turning/weaving, hitting objects/parked vehicles, crossing, hitting a pedestrian and vehicle–vehicle collision.[59,60]
Time-to-accident (TA) The time-to-accident (TA) is the amount of time it takes for an accident to occur from the time one of the road users begins an evasive action and continues at the same speed and direction.As a result of a rear-end collision, turning/weaving, hitting objects/parked vehicles, crossing, hitting a pedestrian and vehicle–vehicle collision.[61,62]
Post-encroachment time (PET) The time between the moment that a road user (vehicle) leaves the area of potential collision and the other road user arrives at the collision area.Mostly for right-angle or crossing crashes that result in a pedestrian being hit. Head-on collision when merging/diverging (to a certain extent).[63,64]
Table 2. Genetic Algorithm Simulation Results.
U.K
Speed Limit
(mph)
Scenario
No.
Best ChromosomeFitness Value
Ego
Speed
(m/s)
CAV
Speed
(m/s)
Ego
Initial
Position
[x, y, z] (m)
CAV
Initial
Position
[x, y, z] (m)
20117.1216.67[13.91, 0.97, 0][37.26, −24.12, 0]264.50
220.3917.17[10.86, 1.41, 0][38.37, −22.81, 0]261.94
315.8717.52[13.97, 1.69, 0][38.37, −26.86, 0]248.93
411.3114.31[15.24, 1.25, 0][38.12, −26.79, 0]247.71
516.9913.81[14.59, 1.33, 0][38.35, −21.87, 0]282.01
30617.6616.14[13.94, 1.96, 0][37.65, −25.83, 0]226.72
713.443.62[13.91, 1.82, 0][38.57, −26.99, 0]227.47
819.3618.42[15.17, 2.13, 0][38.35, −22.87, 0]291.26
915.8413.87[15.46, 1.68, 0][38.24, −25.00, 0]250.67
1013.0815.04[16.74, 1.76, 0][37.81, −23.86, 0]194.25
501128.3924.10[15.11, 1.32, 0][37.30, −24.77, 0]137.22
1225.8524.21[14.67, 1.60, 0][38.54, −25.51, 0]151.71
1324.1828.68[15.28, 1.51, 0][38.46, −25.80, 0]158.10
1427.9624.15[15.42, 1.66, 0][38.01, −22.36, 0]147.22
1525.0322.31[11.98, 1.96, 0][38.61, −27.08, 0]142.73
601639.2639.17[14.02, 1.47, 0][37.86, −22.98, 0]111.79
1724.7527.11[16.46, 2.05, 0][37.59, −27.42, 0]130.46
1825.6724.02[16.68, 1.53, 0][38.04, −26.41, 0]138.12
1935.5832.86[16.87, 1.14, 0][37.30, −23.20, 0]107.88
2028.3023.88[14.28, 2.08, 0][37.61, −25.60, 0]137.09
702137.3734.69[12.13, 2.14, 0][38.61, −27.60, 0]107.47
2220.1222.11[15.13, 1.56, 0][38.12, −27.66, 0]178.85
2335.1834.11[15.85, 1.62, 0][38.70, −27.38, 0]173.33
2419.5323.00[17.13, 1.87, 0][38.73, −26.59, 0]175.19
2521.7720.92[15.37, 1.16, 0][38.57, −26.94, 0]165.69
Table 3. Results for Experiments 2 and 3.
Scenario NumberDistance to Collision
without Communication (m)
Distance to Collision with
Communication (m)
12.5217.88
22.4217.63
32.9616.64
41.3914.36
52.5218.13
63.6417.58
75.2418.85
84.7617.31
95.2118.92
103.2317.28
119.2523.25
123.0016.32
132.7614.66
143.9517.92
154.0118.10
165.1620.33
177.5519.48
186.6017.61
195.4218.15
206.0218.37
218.7120.85
227.3920.74
232.6014.43
244.1417.06
255.6121.49
Publisher’s Note: MDPI stays neutral with regard to jurisdictional claims in published maps and institutional affiliations.

