Proceeding Paper

Two Optimized IoT Device Architectures Based on Fast Fourier Transform to Monitor Patient’s Photoplethysmography and Body Temperature †

Digital Business and Innovations, Tokyo International University, Saitama 350-1197, Japan
*
Author to whom correspondence should be addressed.
Presented at the 1st International Electronic Conference on Algorithms, 27 September–10 October 2021; Available online: https://ioca2021.sciforum.net/.
Comput. Sci. Math. Forum 2022, 2(1), 7; https://doi.org/10.3390/IOCA2021-10905
Published: 26 September 2021
(This article belongs to the Proceedings of The 1st International Electronic Conference on Algorithms)

Abstract

:
The measurement of blood-oxygen saturation (SpO2), heart rate (HR), and body temperature are very critical in monitoring patients. Photoplethysmography (PPG) is an optical method that can be used to measure heart rate, blood-oxygen saturation, and many analytics about cardiovascular health of a patient by analyzing the waveform. With the COVID-19 pandemic, there is a high demand for a product that can remotely monitor such parameters of a COVID-19 patient. This paper proposes two major design architectures for the product with optimized system implementations by utilizing the ESP32 development environment and cloud computing. In one method, it discusses edge computing with the fast Fourier transform (FFT) and valley detection algorithms to extract features from the waveform before transferring data to the cloud, and the other method transfers raw sensor values to the cloud without any loss of information. This paper especially compares the performance of both system architectures with respect to bandwidth, sampling frequency, and loss of information.

1. Introduction

Monitoring patients with highly contagious illnesses is extremely dangerous for medical staff as they also can be exposed to an unhealthy and harmful environment. IoT remote monitoring devices are very helpful to solve this problem by providing a remote dashboard to visualize needed medical parameters in real-time without being in physical contact with the patients. These systems also reduce the time spent by the medical officers in checking each patient. Furthermore, these systems have a potential to enhance patient monitoring with smart functions such as generation of notifications and reports, etc. [1]
Telemedicine systems with remote monitoring facilities became popular over the past few decades. Some of the IoT pulse oximetry systems are designed to be used in a limited area with wireless communication. Example implementations for these methods are personal ad-hoc wireless networks using Wi-Fi with station mode (STA) and point access mode (AP) [2] and wireless sensor networks (WSN) using ZigBee [3]. Some other existing efforts have been focused on real-time personal pulse oximetry monitoring with reduced data transferring time by using ISO/IEEE 11073 message format and server-side data processing in order to reduce the average response time to 251 milliseconds [4].
This paper discusses two efficient design architectures to implement IoT systems with a comparison of their capabilities. Both architectures include a cloud data server, dashboard, a capturing device to create an interface with a clinical PPG sensor, and a body temperature sensor as shown in Figure 1. This paper explains the architecture of each subsection of the systems with algorithms and methodologies used to improve the proposed systems by eliminating limitation such as high bandwidth usage and accessibility limitations of existing systems. The first part of the paper discusses the main idea of the two proposed architectures in detail as shown in Figure 2. Then the second part discusses the comparison of the results obtained from the two methods. Finally, there is the conclusion and suggestions for future work according to the obtained results.

2. Methodology

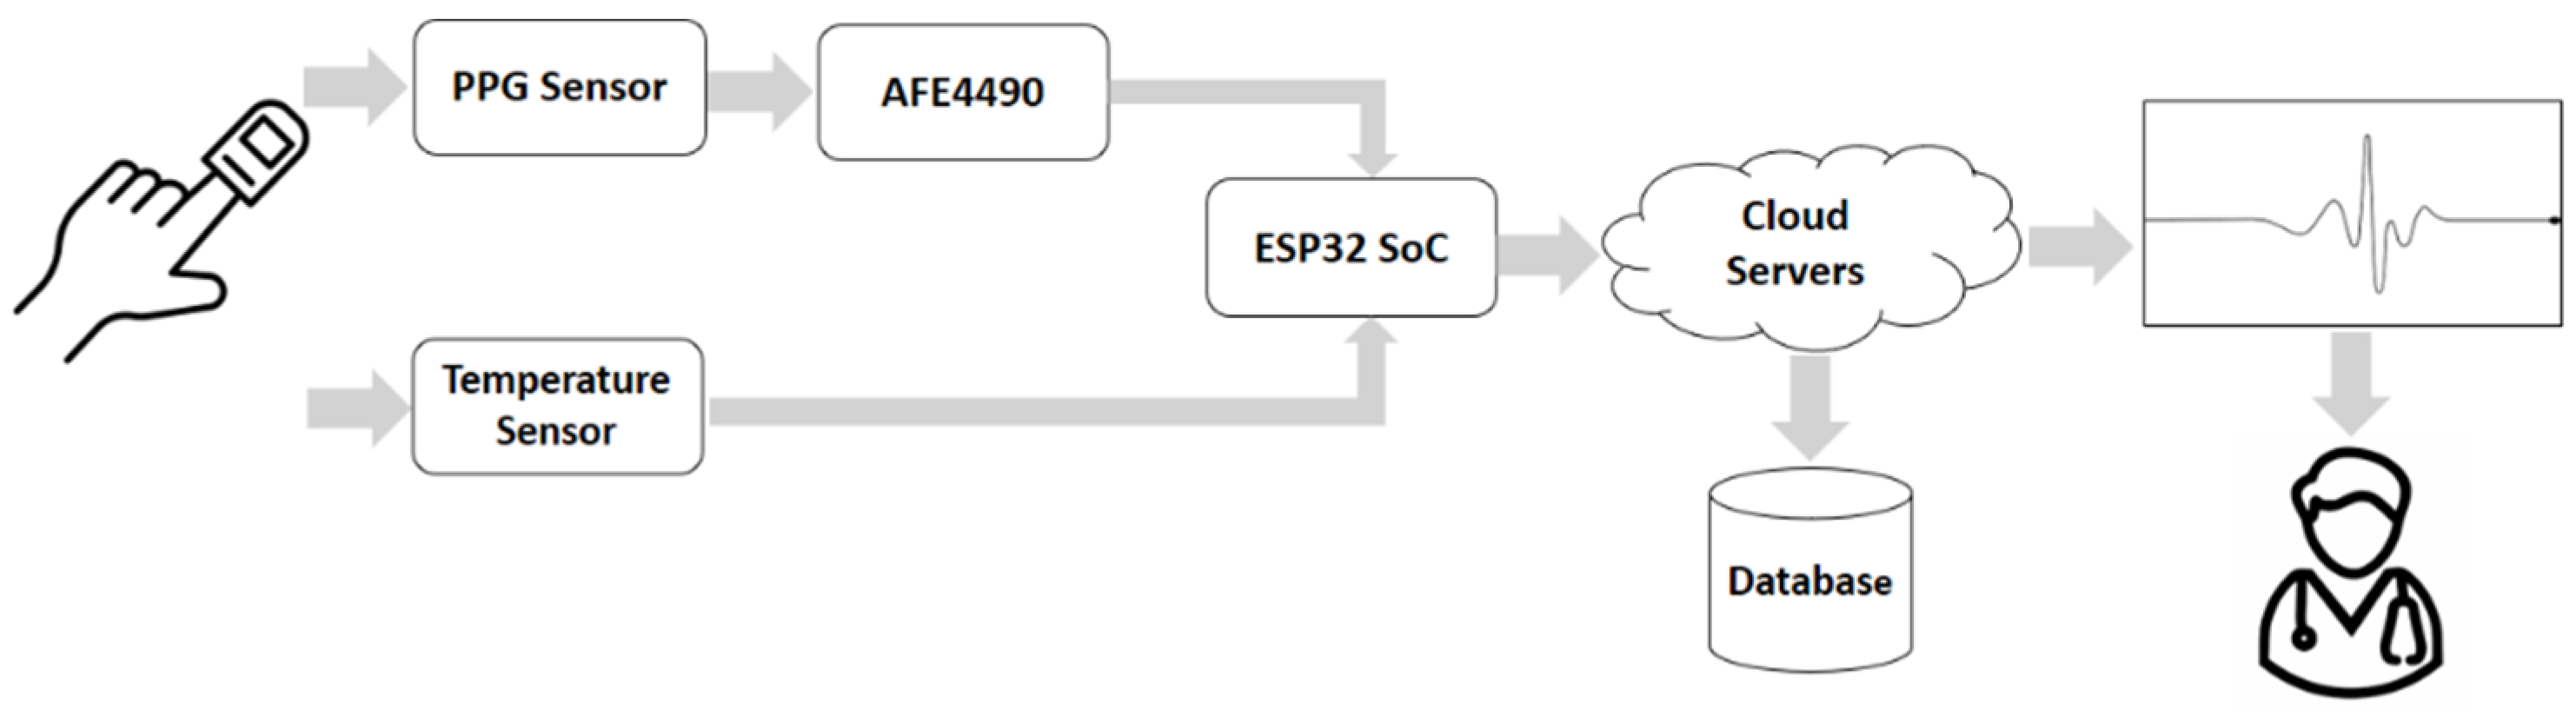
2.1. System Overview

The proposed IoT system consists of loosely coupled layered architecture with five main layers. Service oriented loosely coupled architecture of the system ensures the scalability of the system as well as an increase in the ability to change, remove, or upgrade each layer without affecting any other layer of the system.
In the sensing layer, the wireless sensor module is used to produce the readings. This hardware module is the only part that comes into physical contact with the patient. ESP32 has the built-in Wi-Fi function and 240 MHz clock speed required to become a good candidate for an IoT system, with its 32-bit microcontroller and other useful features. Hence, it is capable of the signal processing and data encoding described in the later sections in this paper. Moreover, the proposed system is enhanced with wireless data transmission, optimized data transferring with minimum bandwidth usage, flow control as well as data encoding and decoding, with a sliding window method to ensure minimum error occurrence. Further, it is focused on secure sensor data communication using TCP, and data layer isolation using an API platform.
Optimized data processing and transmission algorithms of the proposed system are the most important and mostly heavily focused upon aspect in this paper. Data processing is performed in a separate layer with the ability to integrate it in the cloud or in the hardware module itself according to the preferred architecture. These two architectures are discussed in detail under the following sections in this paper. In the presentation layer, a scalable and user-friendly web interface (dashboard) is developed to visualize obtained vital signs in real-time, which is accessible through the internet everywhere.

2.2. System Architecture

2.2.1. System Architecture I

In this architecture, as shown in the Figure 2a, both the Sensing layer and the Processing layer are within the hardware module. In this method, all the required measurements (SpO2 and heart rate) are calculated within the microcontroller (ESP32) unit itself using obtained sensor values. Data from PPG sensor (IR and red values) are being fed to the SpO2 calculation algorithm and heart rate calculation algorithm. SpO2 level calculation is performed using valley detection algorithms [5] and heart rate is calculated with FFT. To produce a better heart rate value, the valley detection algorithm also calculates heart rate again. Body temperature sensor readings, as a 10-bit analog-to-digital converted (ADC) value, are sent without processing. Calculated hart rate values, SpO2 values, and temperature values are sent to the cloud server where the data receiver and data decoder are running. Decoded data are then sent to the data layer to be stored in the database via the API server running on the network layer. Stored data can be retrieved whenever they are needed for visualization. Then, in the presentation layer, all the measurements are visualized in the dashboard graphically in real-time. In summary, this architecture sends and stores only the calculated measurements. Therefore, there can be a loss of other embedded information of the original waveform.

2.2.2. System Architecture II

Unlike in the Architecture I, in this method data do not process within the microcontroller. Instead, it sends raw data obtained from sensors as a byte stream to the data receiver in the cloud and stores all the data in the database without loss of any information in the original waveform. Then the data processing is performed within the data processing layer, which is also in the cloud, and this visualizes them in the same way as described in Architecture I. Thus, only the sensing layer is located within the hardware module, while all the other layers are in the cloud as shown in the Figure 2b. Stored readings can be used for further medical studies related to PPG signal analysis as well.

2.3. Bandwith Requirement Analysis

Data transmission is performed by the TCP socket server connection, which secures a high quality of service (QoS). Error handling and flow controlling are also handled within the TCP protocol. The following analysis discusses the payload optimization that can be obtained with the proposed architecture compared to the common practices. Note that, there we only discuss the bandwidth requirement for the parameter data of the TCP transmission.

2.3.1. Bandwidth Requirement Analysis for Architecture I

In this architecture, all the parameters are calculated within the hardware. Calculated heart rate has an integer value that normally reaches 3-digit numbers of beats per minute. SpO2 level is also a percentage value with an integer with maximum 3-digits.
Generally, a data frame can be defined with human readable format as follows,
H (3 bytes)—Heart rate value: (3-digit number)
S (3 bytes)—SpO2 level: (3-digit number)
T (4 bytes)—Temperature reading (10-bit value number from 0 to 210): (4-digit number)
C (1 byte)—Separation character
Data frame size(common) = H + C + S + C + T + C = 3 + 1 + 3 + 1 + 4 + 1 = 13 bytes
If the database update rate is given by FDB, required bandwidth needed only for the parameters is given by following equation.
Required bandwidth(common) = FDB × 13 bytes/s = FDB × 13 × 8 bits /s = 104 FDB bits/s
If FDB = 10 Hz, then the expected bit rate will be: 1040 bits/s (1.015625 kbits/s).
In the proposed Architecture I, because both heart rate and SpO2 values are integers, they can be represented by using only 1 byte. Thus, optimized data frame with proposed data encoder is as follows,
H1 (8 bits)—Heart rate value: (1 byte)
S1 (8 bits)—SpO2 level (1 byte)
T1 (10 bits)—Temperature reading: (10 bits)
FC1 (6 bits)—Flow control: (6 bits)
Data frame size(optimized) = H1 + S1 + T1 + FC1 = 8 + 8 + 10 + 6 = 32 bits = 4 bytes
If the database update rate is given by FDB, required bandwidth needed only for the parameters is given by following equation.
Required bandwidth(optimized) = FDB × 32 bits/s =32 FDB bits/s
If FDB = 10 Hz, then the expected bit rate only for data transmission is 320 bits/s (0.3125 kbits/s).
According to Equations (1) and (3), it is clear that optimized data frame can save up to 9 bytes for each parameter set compared to the common practice, which will result in considerable impact on bandwidth, by optimizing payload of TCP transmission packets.

2.3.2. Bandwidth Requirement Analysis for Architecture II

In this architecture, raw sensor data are sent to the data receiver. Raw data have two 24-bit readings for each red and IR LEDs of the PPG sensor. In addition to that, the 10-bit temperature reading must also be transmitted.
Generally, a data frame can be defined with human readable format as follows,
R (8 bytes)—Red LED value (24-bit value from 0–224): (8-digit number)
I (8 bytes)—IR LED value (24-bit value from 0–224): (8-digit number)
T (4 bytes)—Temperature reading (10-bit value number from 0 to 210): (4-digit number)
C (1 byte)—Separation character
Data frame size(common) = R + C + I + C + T + C = 8 + 1 + 8 + 1 + 4 + 1 = 23 bytes
If the sensor reading rate is given by Fs, required bandwidth needed only for the parameters is given by the following equation.
Required bandwidth(common) = Fs × 23 bytes /s = Fs × 23 × 8 bits/s = 184 Fs bits/s
If Fs = 400Hz, then the expected bit rate is 73,600 bits/s (71.875 kbits/s).
In the proposed Architecture II, IR and red readings are 24-bit numbers, which can be represented by 3 byte each. Thus, optimized data frame with proposed data encoder is as follows,
R1 (24 bits)—Red LED value: (24 bits)
I1 (24 bits)—IR LED value: (24 bits)
T1 (10 bits)—Temperature reading: (10 bits)
FC1 (6 bits)— Flow control: (6 bits)
Data frame size(optimized) = R1 + I1 + T1 + FC1 = 24 + 24 + 10 + 6 = 64 bits = 8 bytes
If the sensor reading rate is given by Fs, required bandwidth needed only for the parameters is given by following equation.
Required bandwidth(optimized) = Fs × 64 bits/s = 64 Fs bits/s
If F = 400 Hz, then the expected bit rate is 25,600 bits/s (25 kbits/s).
According to Equations (5) and (7), optimized data frame can save up to 15 bytes for each parameter set compared to the common practice, which will result in considerable impact on bandwidth, by optimizing payload of TCP transmission packets. This can be a huge advantage for applications which use high sampling rates, because the bandwidth usage is a function of the sensor sampling rate with a proportional relationship.

2.4. Data Encoder

Depending on the architecture used, representation of each byte of the data frame is different. The structures of the encoded data frames for each architecture are shown in Figure 3. Regarding flow controlling, the last 6 bits were used in such a manner that can differentiate each frame for the sliding window method in the data decoder.
This proposed encoding method uses the last 6 bits of each frame to represent 000000- and 111111-bit patterns, to gain the maximum difference between flow control values of the consecutive data frames. This method minimizes the error rate due to the fact that two consecutive sensor reading values cannot produce a very large variation nor the flipping pattern of the flow controlling bits. For example, in the Architecture II, the data frame size is 64 bits. If Nth data frame carries 111111-bit pattern as the last six bits of the data frame, the (N+1)th data frame carries 000000-bit pattern as the ending bits, as shown in the Figure 4a.

2.5. Data Receiver

The data receiver is a TCP server located in the cloud that listens for the data from the hardware device. For each architecture, different data receivers are used according to the size and the structure of the receiving data frames. Data receivers are responsible for four different tasks.
(I)
Receiving data from hardware module via TCP socket.
(II)
Decoding data using windowed method using data decoder.
(III)
Calculating SpO2 and HR values.
(IV)
Sending data to the data layer.
This uses the Central API calls for task I and IV.

2.6. Data Decoder

The data decoder uses the sliding window method with optimization on receiving consecutive sensor readings. Every data frame received by the receiver consists of 6 bits for flow controlling at the end of the data frame, as shown in Figure 4a. The last 6 bits (flow controlling bits) have either a 000000-bit pattern or 111111-bit pattern. This flipping six-bit pattern is responsible for avoiding reading data field as flow controlling bits by mistake when the sliding window method is being used. The sliding window method uses a fixed window size, which equals to the data frame size in each architecture. Use of flow controlling bits for decoding the receiving data frames are explained below.
The length of the sliding window is 8 bytes for Architecture I and 4 bytes for Architecture II. Once the data stream is being receiving, the algorithm executes the following steps:
Step 1: The window shifts over the received data buffer one byte at a time until a matching combination occurs (flipped bits of the current window’s flow controlling bits should appear in the following window’s ending bits). This is shown in Figure 4b. When a match occurs, the algorithm calls Step 2 with the proceeding data window.
Step 2: Parameters are calculated using the data within the window. This then goes to Step 3.
Step 3: The algorithm will shift along the data buffer from the single window size and validate it every time with the ending bits of each window to follow the expected bit pattern. If a mismatch occurs with flow controlling bit patterns, the algorithm goes back to Step 1. Otherwise, the algorithm goes to Step 2 again.
This method guarantees the reliable delivery of the data as well as ensures that the data are delivered in order.

2.7. Central API

Central API is a RESTful API that consists of globally accessible functions that interact with the database. Although this Central API is globally accessible, it also handles the authentication with JSON Web Token (JWT) to limit the accessibility to ensure the network layer security. This API service consists of full functionalities including create, read, update, and delete (CRUD) operations for data records, and one special function to retrieve the last n number of records for visualization purposes. All the communication between the database and the other layers is conducted only through the central APIs, which ensures the security of the data layer. Moreover, changes conducted for the hardware layer (IoT Device) or presentation layer (Dashboard) will not affect each other or any middle layers.

3. Results and Discussion

We have created the described system and tested for both design Architecture I and design Architecture II. We will focus more on the results of design Architecture II here because unlike Architecture I, Architecture II has to use more bandwidth due to the raw data format, real-time transmission, and its high sampling frequency. The data receiver handles continuous data streaming over several hours of testing without any connection failure. This ensures the capabilities of the data encoder running on hardware device and the data decoder running on the cloud server. The decoded message is shown in Figure 5a. We have run the real-time data processing on the cloud to calculate heart rate and SpO2 level before visualizing it on the web dashboard (Figure 5b).
The MySQL database and Node.js Central API server worked ideally and enabled the responsive dashboard to visualize all the acquired vital signs graphically using real-time updating of graphs and labels in a user-friendly way. This allows the user (medical officer) to check patients whilst using a minimum amount of time and gaining accurate data.

4. Conclusions

The proposed wireless SpO2, heart rate, and body temperature monitoring system has been implemented and tested. Bandwidth optimization algorithm plays the key role in this system, enabling the system to be performed as expected in the case of data transmission. Even when there is a bandwidth limitation, this optimization on data frame sizes will result in high data throughput on transmission according to the Little’s law [6].
The proposed system allows real-time monitoring of the SpO2, heart rate, and body temperature of a patient from a remote location without requiring the physician to take the measurements. The proposed bandwidth optimization algorithm enables these two design architectures to be cost-effective for long-time usage compared to the existing general methods of sending data in other formats. Furthermore, the proposed layered architecture enables the system to be scalable and adaptive to future needs.

Author Contributions

J.K.—System architecture, algorithm development and embedded system development; D.D.A.—Software development of backend, frontend, and API server of the proposed system; S.T.—Gathering data and testing the system; J.R.—Guiding and advising the research. All authors have read and agreed to the published version of the manuscript.

Funding

This research received no external funding.

Institutional Review Board Statement

Not applicable.

Informed Consent Statement

Not applicable.

Data Availability Statement

Not applicable.

Conflicts of Interest

The authors declare no conflict of interest.

References

  1. Rani, S.U.; Ignatious, A.; Hari, B.V.; Balavishnu, V.J. Iot Patient Health Monitoring System. Indian J. Public Health Res. Dev. 2017, 8, 4. [Google Scholar] [CrossRef]
  2. Ayance, A.T.; Ramırez, H.S.; Perez, J.M.R.; Palacios, C.G.T. Wireless Heart Rate and Oxygen Saturation Monitor. XV Mexican Symposium on Medical Physics. In Proceedings of the AIP Conference Proceedings 2090, Mexico CIty, Mexico, 13–15 June 2018; pp. 040010-1–040010-4. [Google Scholar]
  3. Rotariu, C.; Manta, V. Wireless system for remote monitoring of oxygen saturation and heart rate. In Proceedings of the Federated Conference on Computer Science and Information Systems (FedCSIS), Wroclaw, Poland, 9–12 September 2012. [Google Scholar]
  4. Pak, J.G.; Park, K.H. Advanced Pulse Oximetry System for Remote Monitoring and Management. J. Biomed. Biotechnol. 2012, 2012, 930582. [Google Scholar] [CrossRef] [PubMed]
  5. Joeng, H.; Kim, K.; Hwang, S.; Lee, M. A new algorithm for P-wave detection in the ECG signal. Images of the Twenty-First Century. In Proceedings of the Annual International Engineering in Medicine and Biology Society, Seattle, WA, USA, 9–12 November 1989. [Google Scholar]
  6. Little, J.D. A proof for the queuing formula: L= λ w. Oper. Res. 1961, 9, 383–387. [Google Scholar] [CrossRef]
Figure 1. Structure of the proposed IoT system.
Csmf 02 00007 g001
Figure 2. System architectures of two proposed methods (hardware layers are represented in the dark colors while cloud layers are represented by the light colors in the figure): (a) Architecture I—describes an IoT system with data processing layer on the hardware itself. (b) Architecture II—describes an IoT system with data processing layer on the cloud.
Csmf 02 00007 g002
Figure 3. Optimized data frames after encoding.
Csmf 02 00007 g003
Figure 4. Structure of data frames used for the optimized data transmission: (a) Encoded data frames of n number of bytes with flow controlling bit patterns of 000000 and 111111 at last 6 bits; (b) sliding- window of size n with matched data frame.
Csmf 02 00007 g004
Figure 5. Decoded data and data visualization: (a) Decoded data frames in the decoder before it sends to the database for visualization; (b) Web Dashboard: SpO2 and heart rate values are displayed in the labels on the top left. Body temperature values displayed in a different graph in the bottom left while IR and red values are displayed in the same graph at the bottom left corner.
Csmf 02 00007 g005
Publisher’s Note: MDPI stays neutral with regard to jurisdictional claims in published maps and institutional affiliations.

