
Measuring Embedded Human-Like Biases in Face Recognition Models †


Abstract
:1. Introduction
- We introduce FEAT to measure racial, gender, age, and an intersectional bias in face recognition models with images.
- Our new dataset and implementations are publicly available (https://github.com/sange1104/face-embedding-association-test, accessed on 28 February 2022).
2. Related Work
3. Methods
3.1. Face Embedding Association Test
3.2. Face Recognition Models
3.3. Dataset
4. Experiments and Results
- Race test, in which two target race concepts are tested for association with a pair of stereotypical attributes (e.g., “European American” vs. “Asian American”, “Pleasant” vs. “Unpleasant”).
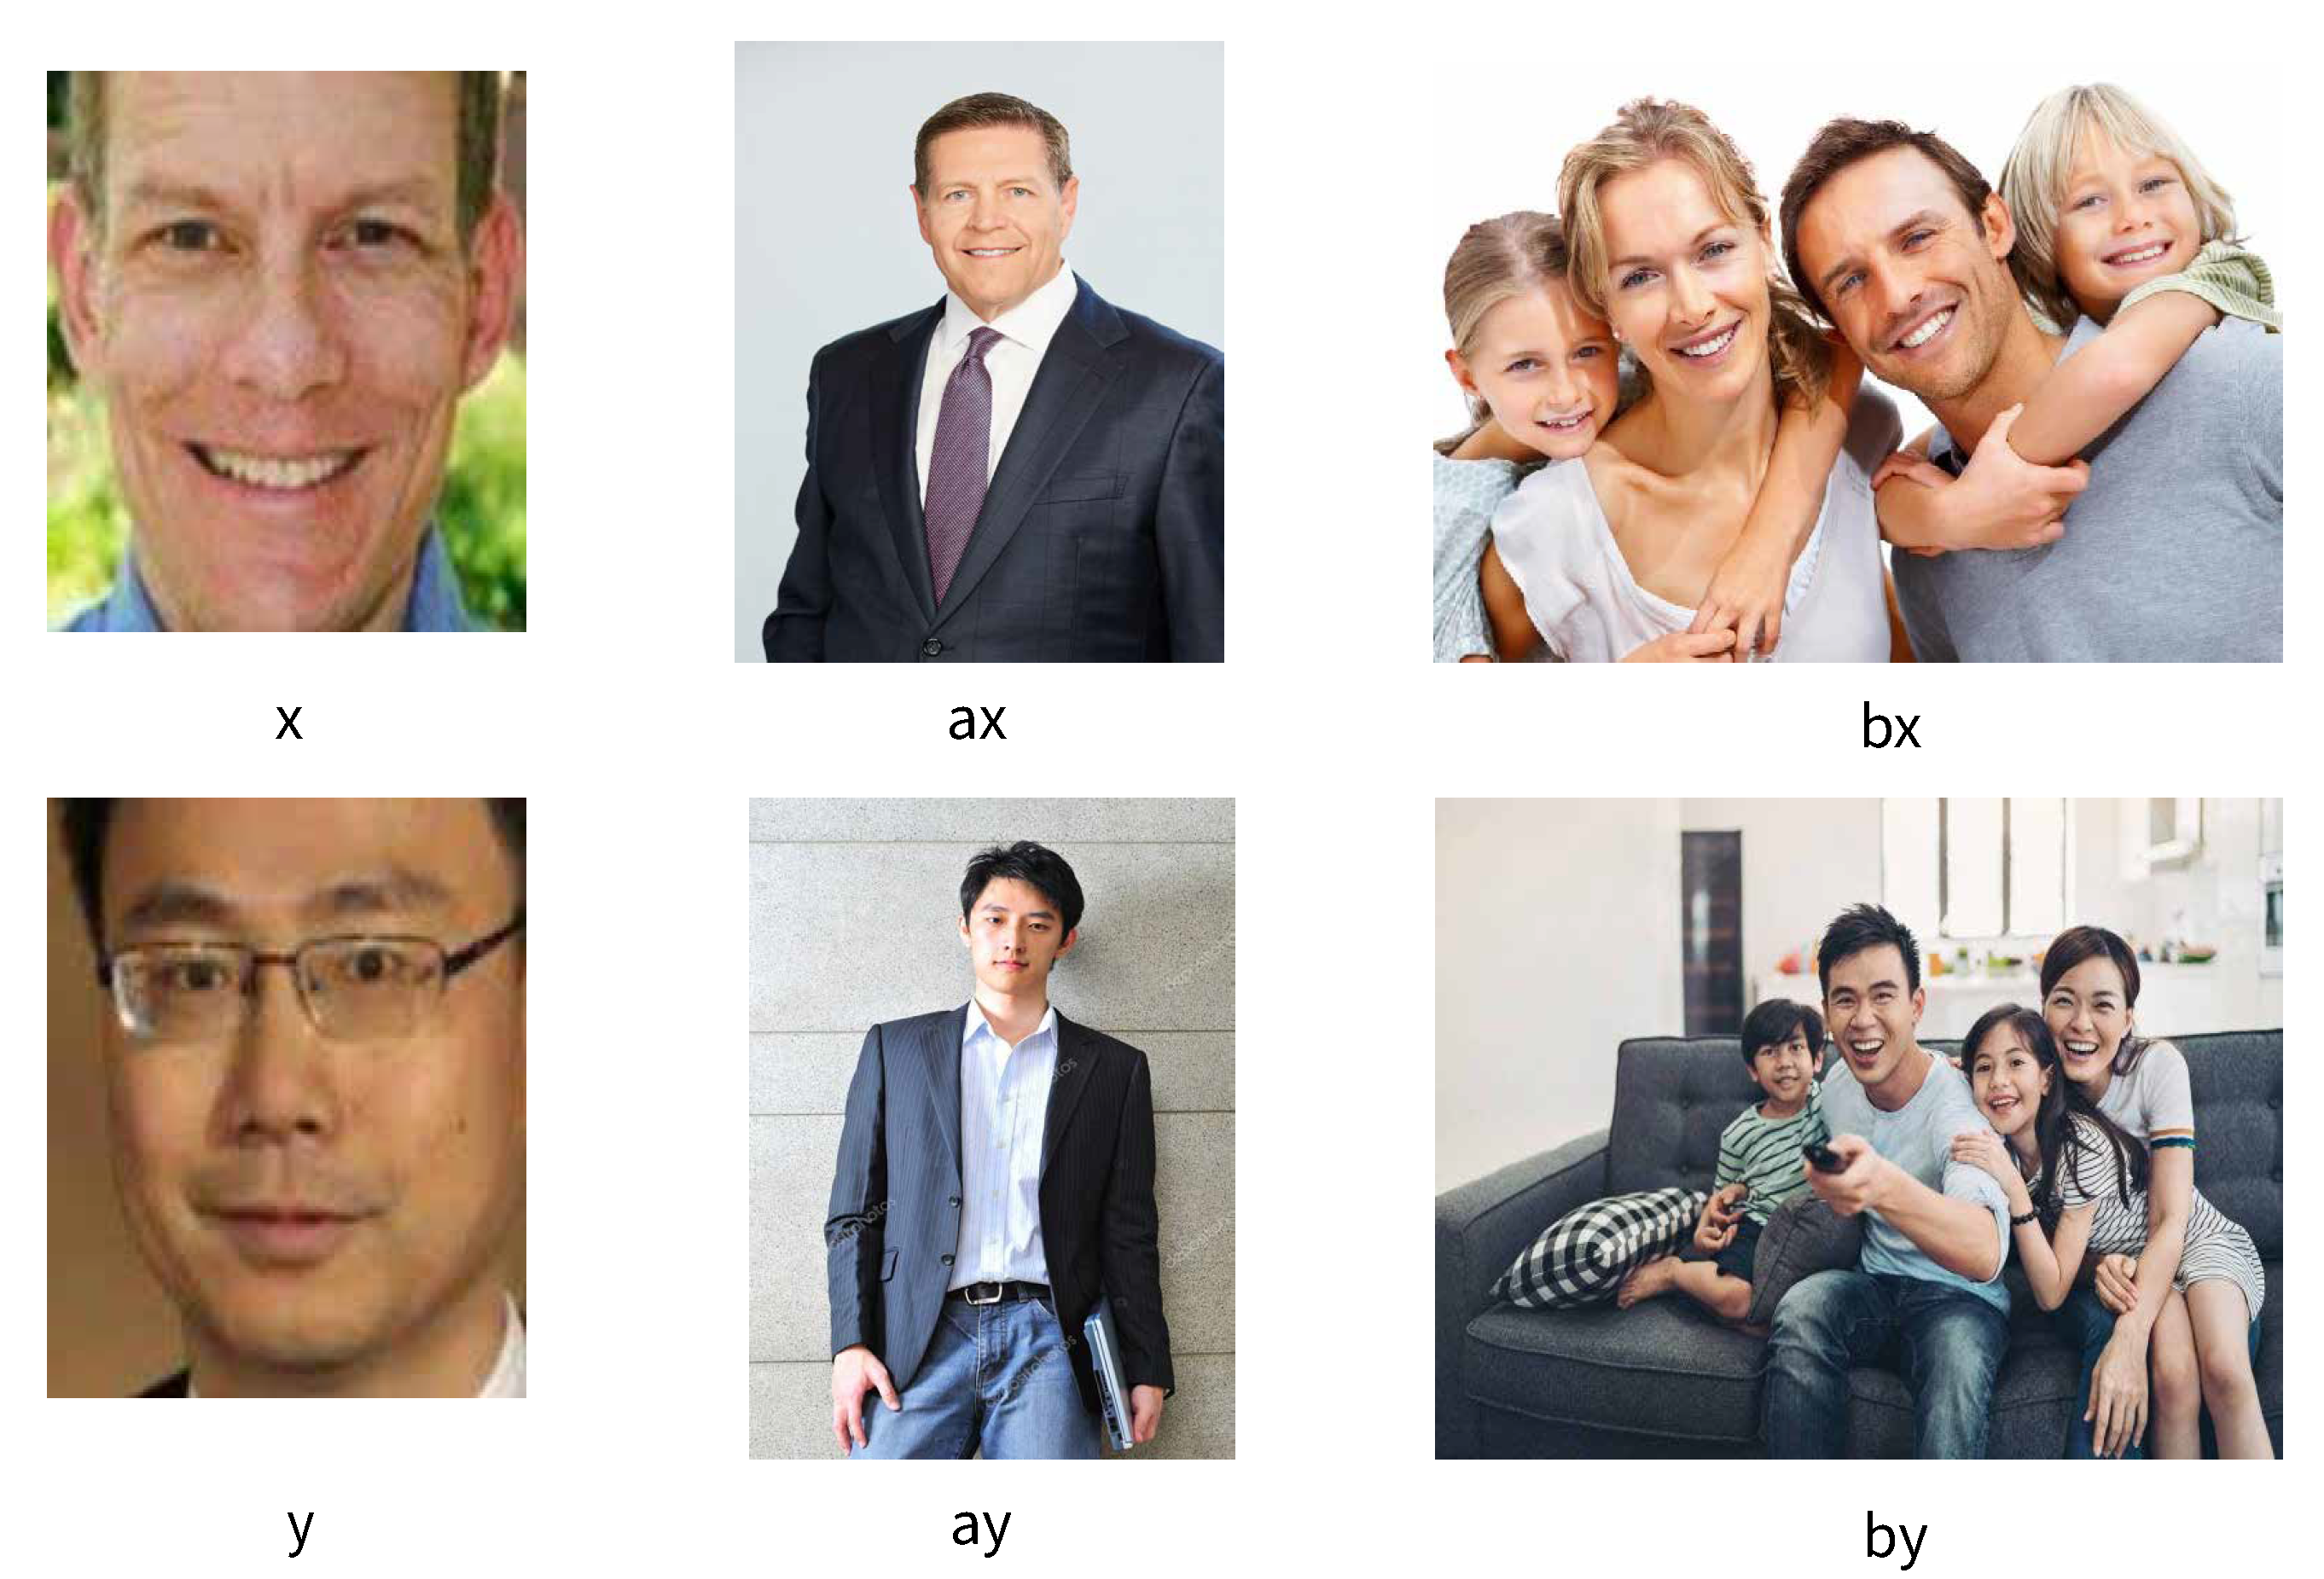
- Gender test, where two target gender images are tested for stereotypical association (e.g., “Male” vs. “Female”, “Career” vs. “Family”).
- Age test, where two target age images are tested for stereotypical association (e.g., “Young” vs. “Old”, “Career” vs. “Family”).
- Intersectional test, we term as gendered racism to measure well-known stereotype toward Asian Female; “Asian women are considered as incompetent; not a leader, submissive, and expected to work at a low-level gendered job [12]”.
4.1. Experiment 1: Do Face Recognition Models Contain Racial Biases?
4.2. Experiment 2: Do Face Recognition Models Contain Gender Stereotypes?
4.3. Experiment 3: Do Face Recognition Models Contain Age Stereotypes?
4.4. Experiment 4: Are Face Recognition Models Gendered Racism?
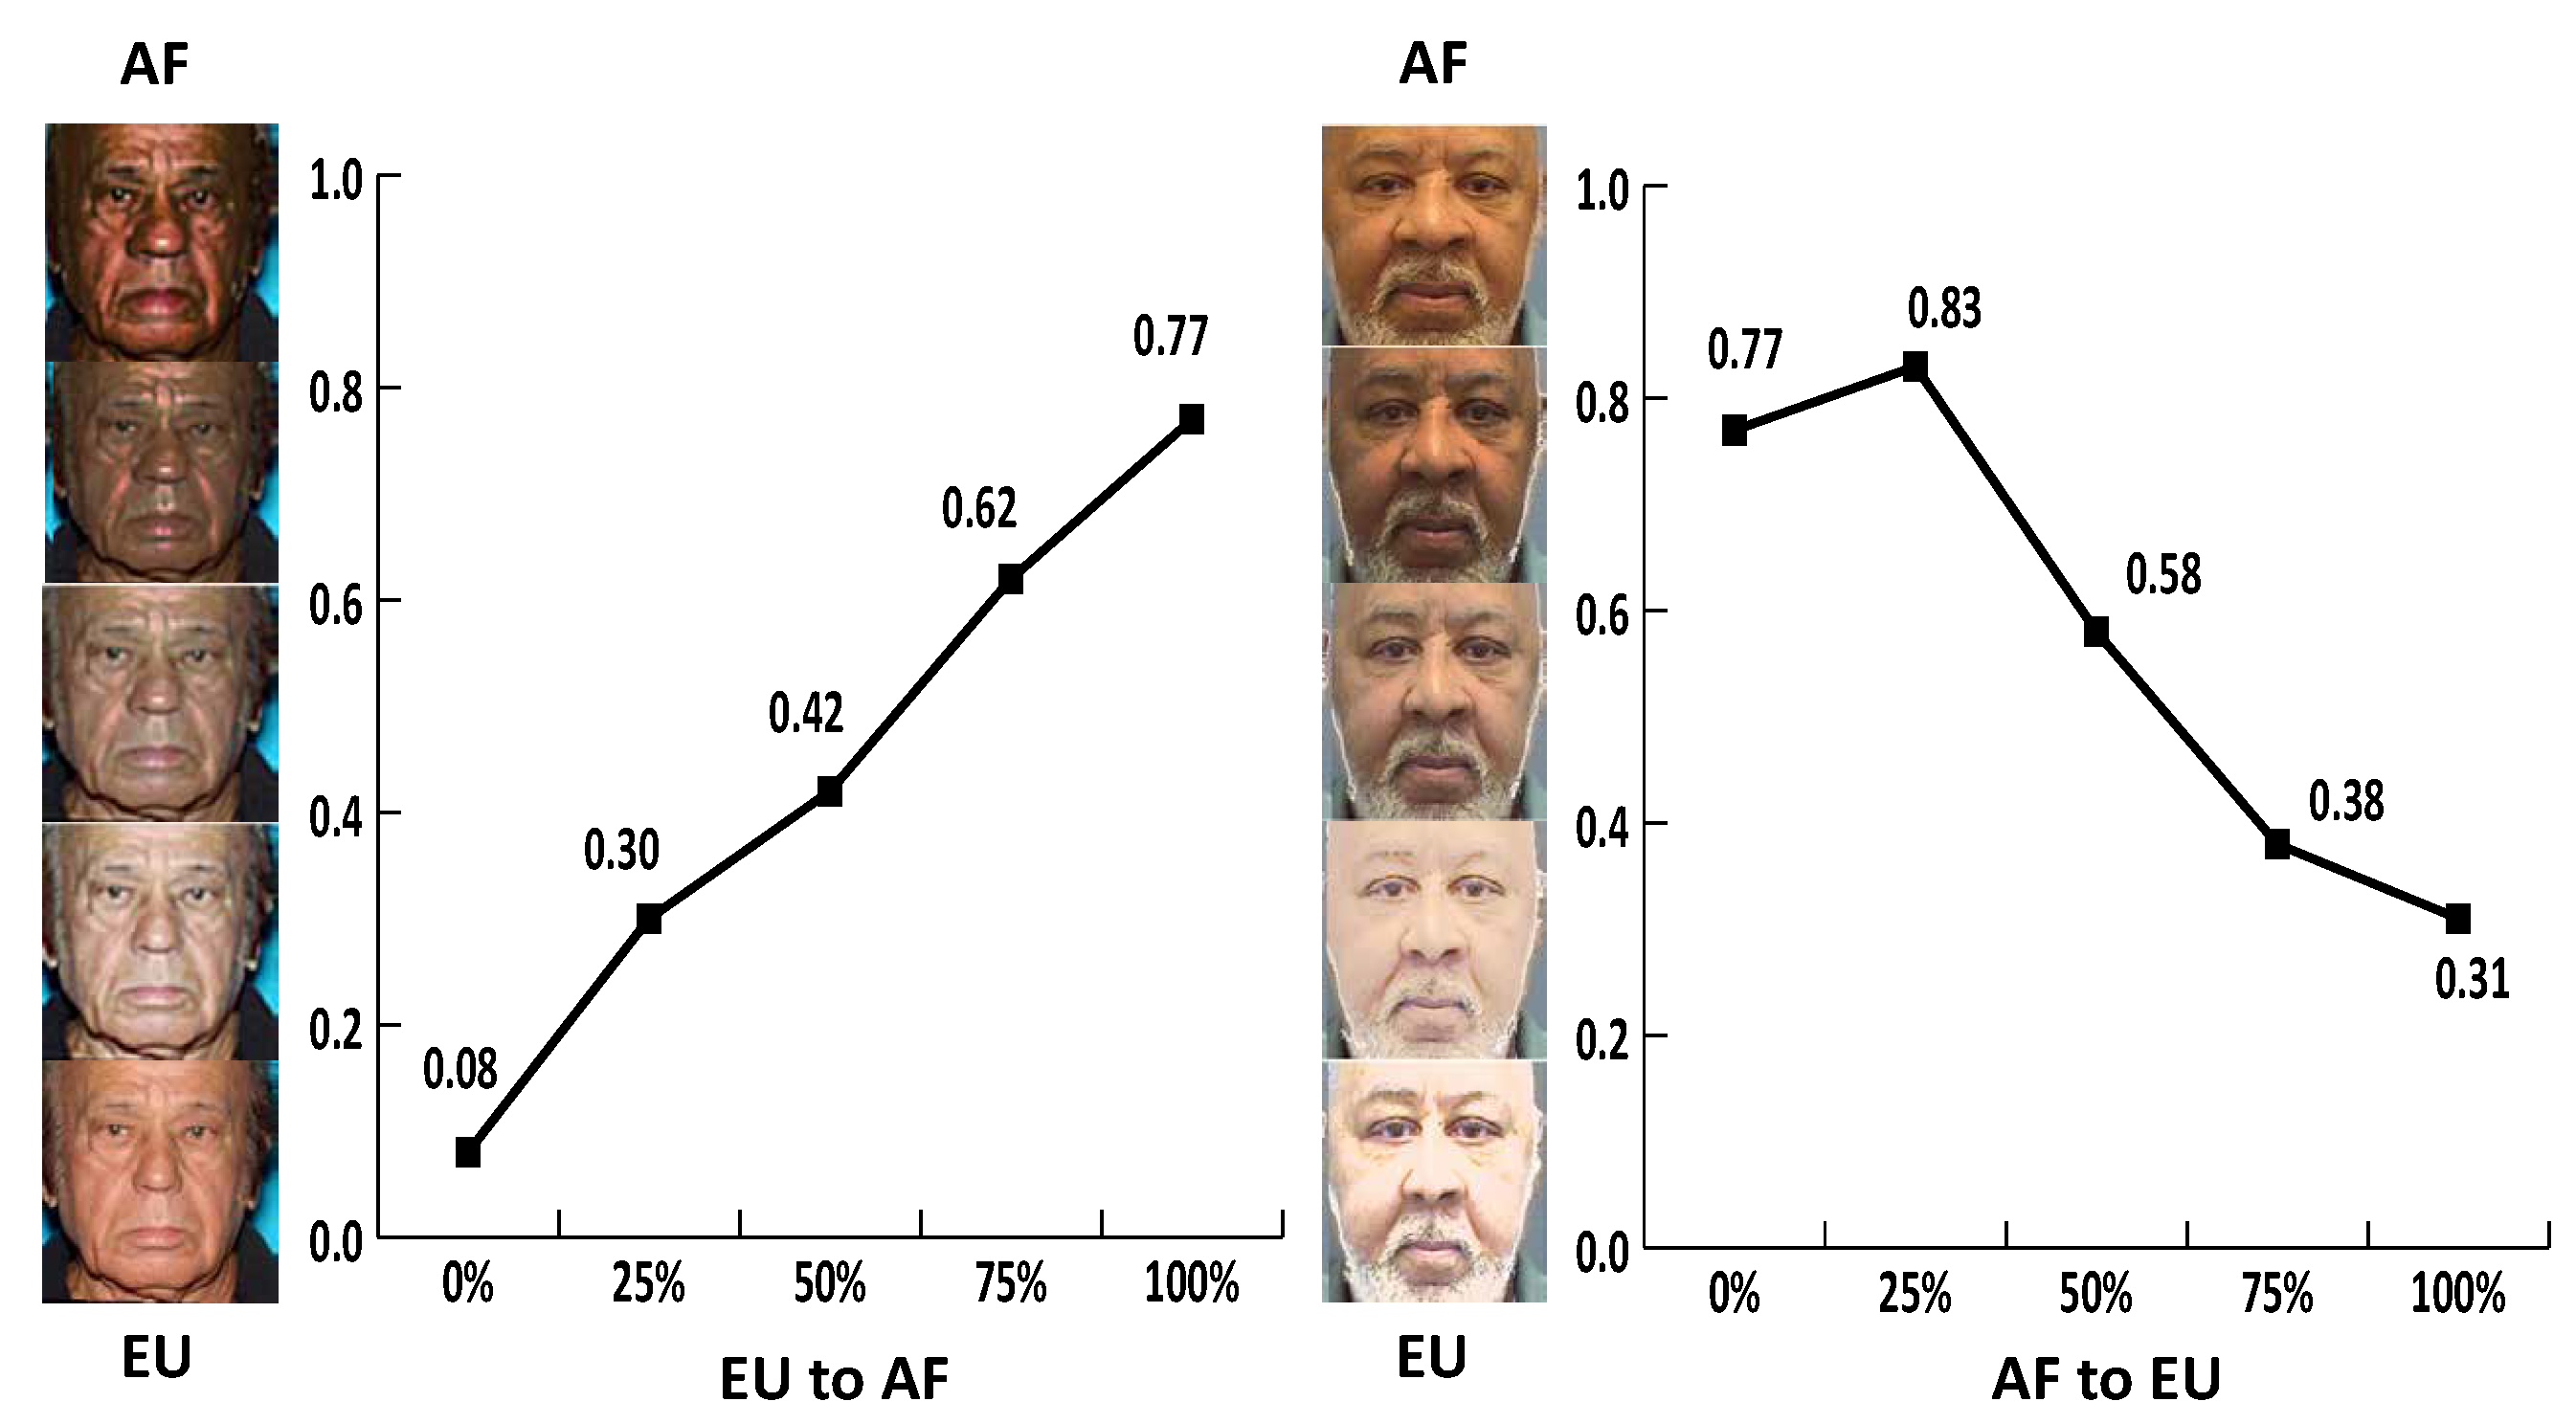
4.5. Race Sensitivity Analysis
5. Discussion
Author Contributions
Funding
Institutional Review Board Statement
Informed Consent Statement
Data Availability Statement
References
- Steed, R.; Caliskan, A. Image Representations Learned With Unsupervised Pre-Training Contain Human-like Biases. In Proceedings of the 2021 ACM Conference on Fairness, Accountability, and Transparency, Virtual Event, Canada, 3–10 March 2021; pp. 701–713. [Google Scholar]
- Tan, C.; Sun, F.; Kong, T.; Zhang, W.; Yang, C.; Liu, C. A survey on deep transfer learning. In Artificial Neural Networks and Machine Learning—ICANN 2018; Springer: Cham, Switzerland, 2018; pp. 270–279. [Google Scholar]
- Birhane, A.; Cummins, F. Algorithmic injustices: Towards a relational ethics. arXiv 2019, arXiv:1912.07376. [Google Scholar]
- Eubanks, V. Automating Inequality: How High-Tech Tools Profile, Police, and Punish the Poor; St. Martin’s Publishing Group: New York, NY, USA, 2018. [Google Scholar]
- O’neil, C. Weapons of Math Destruction: How Big Data Increases Inequality and Threatens Democracy; Crown Books: New York, NY, USA, 2016. [Google Scholar]
- Caliskan, A.; Bryson, J.J.; Narayanan, A. Semantics derived automatically from language corpora contain human-like biases. Science 2017, 356, 183–186. [Google Scholar] [CrossRef] [PubMed] [Green Version]
- Ross, C.; Katz, B.; Barbu, A. Measuring Social Biases in Grounded Vision and Language Embeddings. In Proceedings of the 2021 Conference of the North American Chapter of the Association for Computational Linguistics: Human Language Technologies, Mexico City, Mexico, 6–11 June 2021; pp. 998–1008. [Google Scholar]
- Glüge, S.; Amirian, M.; Flumini, D.; Stadelmann, T. How (not) to measure bias in face recognition networks. In Artificial Neural Networks in Pattern Recognition; Springer: Cham, Switzerland, 2020; pp. 125–137. [Google Scholar]
- Yucer, S.; Akçay, S.; Al-Moubayed, N.; Breckon, T.P. Exploring racial bias within face recognition via per-subject adversarially-enabled data augmentation. In Proceedings of the IEEE/CVF Conference on Computer Vision and Pattern Recognition Workshops, Seattle, WA, USA, 14–19 June 2020; pp. 18–19. [Google Scholar]
- Greenwald, A.G.; McGhee, D.E.; Schwartz, J.L. Measuring individual differences in implicit cognition: The implicit association test. J. Personal. Soc. Psychol. 1998, 74, 1464. [Google Scholar] [CrossRef]
- Lee, D.L.; Ahn, S. Racial discrimination and Asian mental health: A meta-analysis. Couns. Psychol. 2011, 39, 463–489. [Google Scholar] [CrossRef]
- Mukkamala, S.; Suyemoto, K.L. Racialized sexism/sexualized racism: A multimethod study of intersectional experiences of discrimination for Asian American women. Asian Am. J. Psychol. 2018, 9, 32. [Google Scholar] [CrossRef]
- Taigman, Y.; Yang, M.; Ranzato, M.; Wolf, L. Deepface: Closing the gap to human-level performance in face verification. In Proceedings of the IEEE Conference on Computer Vision and Pattern Recognition, Columbus, OH, USA, 23–28 June 2014; pp. 1701–1708. [Google Scholar]
- Sun, Y.; Wang, X.; Tang, X. Deep learning face representation from predicting 10,000 classes. In Proceedings of the IEEE Conference on Computer Vision and Pattern Recognition, Columbus, OH, USA, 23–28 June 2014; pp. 1891–1898. [Google Scholar]
- Parkhi, O.; Vedaldi, A.; Zisserman, A. Deep Face Recognition. In Proceedings of the 26th British Machine Vision Conference (BMVC), Swansea, UK, 7–10 September 2015; Xie, X., Jones, M.W., Tam, G.K.L., Eds.; BMVA Press: Durham, UK, 2015. [Google Scholar] [CrossRef] [Green Version]
- Schroff, F.; Kalenichenko, D.; Philbin, J. Facenet: A unified embedding for face recognition and clustering. In Proceedings of the IEEE Conference on Computer Vision and Pattern Recognition, Boston, MA, USA, 7–12 June 2015; pp. 815–823. [Google Scholar]
- Amos, B.; Ludwiczuk, B.; Satyanarayanan, M. Openface: A general-purpose face recognition library with mobile applications. CMU Sch. Comput. Sci. 2016, 6, 20. [Google Scholar]
- Deng, J.; Guo, J.; Xue, N.; Zafeiriou, S. Arcface: Additive angular margin loss for deep face recognition. In Proceedings of the IEEE/CVF Conference on Computer Vision and Pattern Recognition, Long Beach, CA, USA, 16–17 June 2019; pp. 4690–4699. [Google Scholar]
- Bellamy, R.K.; Dey, K.; Hind, M.; Hoffman, S.C.; Houde, S.; Kannan, K.; Lohia, P.; Martino, J.; Mehta, S.; Mojsilovic, A.; et al. AI Fairness 360: An extensible toolkit for detecting, understanding, and mitigating unwanted algorithmic bias. arXiv 2018, arXiv:1810.01943. [Google Scholar]
- Huang, C.; Li, Y.; Loy, C.C.; Tang, X. Deep imbalanced learning for face recognition and attribute prediction. IEEE Trans. Pattern Anal. Mach. Intell. 2019, 42, 2781–2794. [Google Scholar] [CrossRef] [Green Version]
- Wang, Z.; Qinami, K.; Karakozis, I.C.; Genova, K.; Nair, P.; Hata, K.; Russakovsky, O. Towards fairness in visual recognition: Effective strategies for bias mitigation. In Proceedings of the IEEE/CVF Conference on Computer Vision and Pattern Recognition, Seattle, WA, USA, 13–19 June 2020; pp. 8919–8928. [Google Scholar]
- Kortylewski, A.; Egger, B.; Schneider, A.; Gerig, T.; Morel-Forster, A.; Vetter, T. Analyzing and reducing the damage of dataset bias to face recognition with synthetic data. In Proceedings of the IEEE/CVF Conference on Computer Vision and Pattern Recognition Workshops, Long Beach, CA, USA, 16–17 June 2019. [Google Scholar]
- Sixta, T.; Junior, J.C.J.; Buch-Cardona, P.; Vazquez, E.; Escalera, S. Fairface challenge at eccv 2020: Analyzing bias in face recognition. In Computer Vision—ECCV 2020 Workshops. ECCV 2020; Springer: Cham, Switzerland, 2020; pp. 463–481. [Google Scholar]
- Wang, M.; Deng, W.; Hu, J.; Tao, X.; Huang, Y. Racial faces in the wild: Reducing racial bias by information maximization adaptation network. In Proceedings of the IEEE/CVF International Conference on Computer Vision, Long Beach, CA, USA, 16–17 June 2019; pp. 692–702. [Google Scholar]
- Robinson, J.P.; Livitz, G.; Henon, Y.; Qin, C.; Fu, Y.; Timoner, S. Face recognition: Too bias, or not too bias? In Proceedings of the IEEE/CVF Conference on Computer Vision and Pattern Recognition Workshops, Seattle, WA, USA, 13–19 June 2020. [Google Scholar]
- Morales, A.; Fierrez, J.; Vera-Rodriguez, R.; Tolosana, R. SensitiveNets: Learning agnostic representations with application to face images. IEEE Trans. Pattern Anal. Mach. Intell. 2020, 43, 2158–2164. [Google Scholar] [CrossRef]
- Del Bino, S.; Bernerd, F. Variations in skin colour and the biological consequences of ultraviolet radiation exposure. British Journal of Dermatology 2013, 169, 33–40. [Google Scholar] [CrossRef] [Green Version]
- Vowels, M.J.; Camgoz, N.C.; Bowden, R. NestedVAE: Isolating common factors via weak supervision. In Proceedings of the IEEE/CVF Conference on Computer Vision and Pattern Recognition, Seattle, WA, USA, 13–19 June 2020; pp. 9202–9212. [Google Scholar]
- Terhörst, P.; Kolf, J.N.; Damer, N.; Kirchbuchner, F.; Kuijper, A. Post-comparison mitigation of demographic bias in face recognition using fair score normalization. Pattern Recognit. Lett. 2020, 140, 332–338. [Google Scholar] [CrossRef]
- Bolukbasi, T.; Chang, K.W.; Zou, J.Y.; Saligrama, V.; Kalai, A.T. Man is to computer programmer as woman is to homemaker? debiasing word embeddings. Adv. Neural Inf. Process. Syst. 2016, 29, 4349–4357. [Google Scholar]
- Manzini, T.; Lim, Y.C.; Tsvetkov, Y.; Black, A.W. Black is to Criminal as Caucasian is to Police: Detecting and Removing Multiclass Bias in Word Embeddings. In Proceedings of the 2019 Annual Conference of the North American Chapter of the Association for Computational Linguistics (NAACL), Minneapolis, MN, USA, 2–7 June 2019. [Google Scholar]
- Nadeem, M.; Bethke, A.; Reddy, S. Stereoset: Measuring stereotypical bias in pretrained language models. arXiv 2020, arXiv:2004.09456. [Google Scholar]
- Acien, A.; Morales, A.; Vera-Rodriguez, R.; Bartolome, I.; Fierrez, J. Measuring the gender and ethnicity bias in deep models for face recognition. In Iberoamerican Congress on Pattern Recognition; Springer: Cham, Switzerland, 2018; pp. 584–593. [Google Scholar]
- Wang, T.; Zhao, J.; Yatskar, M.; Chang, K.W.; Ordonez, V. Balanced datasets are not enough: Estimating and mitigating gender bias in deep image representations. In Proceedings of the IEEE/CVF International Conference on Computer Vision, Long Beach, CA, USA, 16–17 June 2019; pp. 5310–5319. [Google Scholar]
- Albiero, V.; KS, K.; Vangara, K.; Zhang, K.; King, M.C.; Bowyer, K.W. Analysis of gender inequality in face recognition accuracy. In Proceedings of the IEEE/CVF Winter Conference on Applications of Computer Vision Workshops, Seattle, WA, USA, 13–19 June 2020; pp. 81–89. [Google Scholar]
- Dwork, C.; Hardt, M.; Pitassi, T.; Reingold, O.; Zemel, R. Fairness through awareness. In Proceedings of the 3rd Innovations in Theoretical Computer Science Conference, Cambridge, MA, USA, 8–10 January 2012; pp. 214–226. [Google Scholar]
- Garg, N.; Schiebinger, L.; Jurafsky, D.; Zou, J. Word embeddings quantify 100 years of gender and ethnic stereotypes. Proc. Natl. Acad. Sci. USA 2018, 115, E3635–E3644. [Google Scholar] [CrossRef] [PubMed] [Green Version]
- Kozlowski, A.C.; Taddy, M.; Evans, J.A. The geometry of culture: Analyzing the meanings of class through word embeddings. Am. Sociol. Rev. 2019, 84, 905–949. [Google Scholar] [CrossRef] [Green Version]
- May, C.; Wang, A.; Bordia, S.; Bowman, S.R.; Rudinger, R. On measuring social biases in sentence encoders. arXiv 2019, arXiv:1903.10561. [Google Scholar]
- Tan, Y.C.; Celis, L.E. Assessing social and intersectional biases in contextualized word representations. arXiv 2019, arXiv:1911.01485. [Google Scholar]
- Zhao, J.; Wang, T.; Yatskar, M.; Cotterell, R.; Ordonez, V.; Chang, K.W. Gender bias in contextualized word embeddings. arXiv 2019, arXiv:1904.03310. [Google Scholar]
- Chaloner, K.; Maldonado, A. Measuring gender bias in word embeddings across domains and discovering new gender bias word categories. In Proceedings of the First Workshop on Gender Bias in Natural Language Processing, Florence, Italy, 2 August 2019; pp. 25–32. [Google Scholar]
- Kurita, K.; Vyas, N.; Pareek, A.; Black, A.W.; Tsvetkov, Y. Measuring Bias in Contextualized Word Representations. In Proceedings of the First Workshop on Gender Bias in Natural Language Processing, Florence, Italy, 2 August 2019; pp. 166–172. [Google Scholar]
- Huang, G.B.; Mattar, M.; Berg, T.; Learned-Miller, E. Labeled faces in the wild: A database for studying face recognition in unconstrained environments. In Proceedings of the Workshop on Faces in’Real-Life’Images: Detection, Alignment, and Recognition, Marseille, France, 12–18 October 2008. [Google Scholar]
- Liu, Z.; Luo, P.; Wang, X.; Tang, X. Deep Learning Face Attributes in the Wild. In Proceedings of the Proceedings of International Conference on Computer Vision (ICCV), Santiago, Chile, 7–13 December 2015. [Google Scholar]
- Yi, D.; Lei, Z.; Liao, S.; Li, S.Z. Learning face representation from scratch. arXiv 2014, arXiv:1411.7923. [Google Scholar]
- Ng, H.W.; Winkler, S. A data-driven approach to cleaning large face datasets. In Proceedings of the 2014 IEEE International Conference on Image Processing (ICIP), Paris, France, 27–30 October 2014; pp. 343–347. [Google Scholar]
- Cao, Q.; Shen, L.; Xie, W.; Parkhi, O.M.; Zisserman, A. Vggface2: A dataset for recognising faces across pose and age. In Proceedings of the 2018 13th IEEE International Conference on Automatic Face & Gesture Recognition (FG 2018), Xi’an, China, 15–19 May 2018; pp. 67–74. [Google Scholar]
- Balakrishnan, G.; Xiong, Y.; Xia, W.; Perona, P. Towards Causal Benchmarking of Biasin Face Analysis Algorithms. In Deep Learning-Based Face Analytics; Springer: Cham, Switzerland, 2021; pp. 327–359. [Google Scholar]
- Nagpal, S.; Singh, M.; Singh, R.; Vatsa, M. Deep learning for face recognition: Pride or prejudiced? arXiv 2019, arXiv:1904.01219. [Google Scholar]
- Kay, M.; Matuszek, C.; Munson, S.A. Unequal representation and gender stereotypes in image search results for occupations. In Proceedings of the 33rd Annual ACM Conference on Human Factors in Computing Systems, Seoul, Korea, 18–23 April 2015; pp. 3819–3828. [Google Scholar]
- McDonough, C. The effect of ageism on the digital divide among older adults. J. Gerontol. Geriatr. Med. 2016, 2, 1–7. [Google Scholar] [CrossRef] [Green Version]
- Ayalon, L.; Dolberg, P.; Mikulionienė, S.; Perek-Białas, J.; Rapolienė, G.; Stypinska, J.; Willińska, M.; de la Fuente-Núñez, V. A systematic review of existing ageism scales. Ageing Res. Rev. 2019, 54, 100919. [Google Scholar] [CrossRef]
- Dugger, K. Social location and gender-role attitudes: A comparison of Black and White women. Gend. Soc. 1988, 2, 425–448. [Google Scholar] [CrossRef]
- Zhuang, Z.; Landsittel, D.; Benson, S.; Roberge, R.; Shaffer, R. Facial anthropometric differences among gender, ethnicity, and age groups. Ann. Occup. Hyg. 2010, 54, 391–402. [Google Scholar] [PubMed] [Green Version]
- Hosoi, S.; Takikawa, E.; Kawade, M. Ethnicity estimation with facial images. In Proceedings of the Sixth IEEE International Conference on Automatic Face and Gesture Recognition, Seoul, Korea, 19 May 2004; pp. 195–200. [Google Scholar]
- Kau, C.H.; Wang, J.; Davis, M. A cross-sectional study to understand 3D facial differences in a population of African Americans and Caucasians. Eur. J. Dent. 2019, 13, 485. [Google Scholar] [CrossRef] [Green Version]
- Shin, H.C.; Roth, H.R.; Gao, M.; Lu, L.; Xu, Z.; Nogues, I.; Yao, J.; Mollura, D.; Summers, R.M. Deep convolutional neural networks for computer-aided detection: CNN architectures, dataset characteristics and transfer learning. IEEE Trans. Med Imaging 2016, 35, 1285–1298. [Google Scholar] [CrossRef] [Green Version]
- Brunet, M.E.; Alkalay-Houlihan, C.; Anderson, A.; Zemel, R. Understanding the origins of bias in word embeddings. In Proceedings of the International Conference on Machine Learning. PMLR, Long Beach, CA, USA, 9–15 June 2019; pp. 803–811. [Google Scholar]


| Target | EU | AF | AS | M | F | Young | Old | EUF | AFF | ASF | |
|---|---|---|---|---|---|---|---|---|---|---|---|
| 3434 | 3434 | 3434 | 5244 | 5058 | 851 | 851 | 1515 | 1684 | 1859 | ||
| Attribute | Career/Family | 237 | 239 | 280 | 236 | 230 | 264 | 250 | - | - | - |
| Pleasant/Unpleasant | 541 | 579 | 681 | 546 | 541 | 713 | 537 | - | - | - | |
| Likable/Unlikable | 123 | 110 | 153 | 111 | 112 | 160 | 160 | - | - | - | |
| Competent/Incompetent | 177 | 155 | 189 | 158 | 148 | 200 | 197 | 92 | 82 | 92 | |
| DeepFace | DeepID | VGGFace | FaceNet | OpenFace | ArcFace | ||
|---|---|---|---|---|---|---|---|
| Career/Family | EU/AF | 0.095 * | 0.078 * | 0.294 * | 0.569 * | 0.148 * | −0.000 |
| EU/AS | −0.006 | −0.209 | −0.476 | −0.097 | 0.372 * | 0.078 * | |
| Pleasant/Unpleasant | EU/AF | 0.507 * | 0.557 * | 0.939 * | 1.081 * | 0.635 * | 0.277 * |
| EU/AS | −0.049 | −0.001 | −0.138 | 0.009 | 0.140 * | 0.165 * | |
| Likable/Unlikable | EU/AF | 0.134 * | 0.647 * | 0.021 | 1.084 * | 0.287 * | 0.517 * |
| EU/AS | −0.032 | −0.112 | −0.829 | −0.121 | 0.111 * | −0.524 | |
| Competent/Incompetent | EU/AF | −0.038 | −0.520 | −1.215 | 0.704 * | −0.575 | −0.200 |
| EU/AS | 0.012 | 0.075 * | 0.223 * | −0.123 | −0.334 | 0.186 * |
| DeepFace | DeepID | VGGFace | FaceNet | OpenFace | ArcFace | ||
|---|---|---|---|---|---|---|---|
| Career/Family | Male/Female | 0.002 | −0.412 | −0.197 | −0.106 | 0.445 * | 0.111 * |
| Pleasant/Unpleasant | 0.001 | −0.194 | −0.089 | −0.042 | 0.020 | 0.452 * | |
| Likable/Unlikable | 0.002 | −0.053 | −0.030 | 0.237 * | 0.053 | −0.243 | |
| Competent/Incompetent | −0.001 | −0.036 | 0.205 * | −0.343 | 0.212 * | 0.035 |
| DeepFace | DeepID | VGGFace | FaceNet | OpenFace | ArcFace | ||
|---|---|---|---|---|---|---|---|
| Career/Family | Young/Old | −0.055 | −0.376 | 0.344 * | −0.166 | 0.993 | −0.416 |
| Pleasant/Unpleasant | 0.062 | −0.036 | 1.406 * | 0.137 | 0.551 * | −0.260 | |
| Likable/Unlikable | 0.066 | 0.290 * | 1.222 * | 0.000 | 0.431 * | 0.509 * | |
| Competent/Incompetent | −0.021 | −0.001 | 1.046 * | 0.031 | 0.225 * | −0.477 |
| DeepFace | DeepID | VGGFace | FaceNet | OpenFace | ArcFace | ||
|---|---|---|---|---|---|---|---|
| Competent/Incompetent | EUF/AFF | −0.017 | 0.465 * | −1.007 | 0.748 * | −0.095 | 0.358 * |
| EUF/ASF | 0.007 | −0.172 | 0.029 | 0.165 * | −0.237 | 0.354 * | |
| AFF/ASF | 0.072 | 0.018 | 1.424 * | 0.451 * | 0.453* | −0.367 |
| Race Transformation | Attribute | DeepFace | DeepID | VGGFace | FaceNet | OpenFace | ArcFace |
|---|---|---|---|---|---|---|---|
| 25% | Career/Family | 0.598 * | 0.470 * | 0.354 * | 0.419 * | 0.657 * | 0.523 * |
| Pleasant/Unpleasant | 0.438 * | 0.314 * | 1.723 * | 0.720 * | 0.267 * | 0.901 * | |
| Likable/Unlikable | 0.796 * | 0.202 * | 1.414 * | 0.607 * | 0.756 * | 0.077 | |
| Competent/Incompetent | 0.957 * | 0.717 * | 1.420 * | 0.645 * | 1.306 * | 0.657 * | |
| 50% | Career/Family | −0.007 | −0.560 | −0.689 | −0.770 | −0.281 | −0.443 |
| Pleasant/Unpleasant | −0.029 | −0.409 | 1.591 * | −0.754 | −0.510 | 0.201 * | |
| Likable/Unlikable | 0.008 | −0.961 | 0.834 * | −0.729 | −0.378 | −0.951 | |
| Competent/Incompetent | −0.095 | −0.624 | 0.817 * | −0.716 | 0.308 * | −0.501 | |
| 75% | Career/Family | −0.768 | −1.226 | −1.362 | −1.467 | −1.134 | −1.089 |
| Pleasant/Unpleasant | −0.653 | −0.888 | 1.324 * | −1.547 | −1.188 | −0.475 | |
| Likable/Unlikable | −1.018 | −1.515 | −0.387 | −1.490 | −1.318 | −1.375 | |
| Competent/Incompetent | −1.170 | −1.439 | −0.549 | −1.509 | −1.036 | −1.278 | |
| 100% | Career/Family | −1.112 | −1.538 | −1.586 | −1.725 | −1.490 | −1.382 |
| Pleasant/Unpleasant | −0.999 | −1.200 | 0.761 * | −1.785 | −1.493 | −0.884 | |
| Likable/Unlikable | −1.448 | −1.733 | −1.102 | −1.745 | −1.619 | −1.593 | |
| Competent/Incompetent | −1.536 | −1.697 | −1.046 | −1.755 | −1.493 | −1.628 |
Publisher’s Note: MDPI stays neutral with regard to jurisdictional claims in published maps and institutional affiliations. |
© 2022 by the authors. Licensee MDPI, Basel, Switzerland. This article is an open access article distributed under the terms and conditions of the Creative Commons Attribution (CC BY) license (https://creativecommons.org/licenses/by/4.0/).
Share and Cite
Lee, S.; Oh, S.; Kim, M.; Park, E. Measuring Embedded Human-Like Biases in Face Recognition Models . Comput. Sci. Math. Forum 2022, 3, 2. https://doi.org/10.3390/cmsf2022003002
Lee S, Oh S, Kim M, Park E. Measuring Embedded Human-Like Biases in Face Recognition Models . Computer Sciences & Mathematics Forum. 2022; 3(1):2. https://doi.org/10.3390/cmsf2022003002
Chicago/Turabian StyleLee, SangEun, Soyoung Oh, Minji Kim, and Eunil Park. 2022. "Measuring Embedded Human-Like Biases in Face Recognition Models " Computer Sciences & Mathematics Forum 3, no. 1: 2. https://doi.org/10.3390/cmsf2022003002
APA StyleLee, S., Oh, S., Kim, M., & Park, E. (2022). Measuring Embedded Human-Like Biases in Face Recognition Models . Computer Sciences & Mathematics Forum, 3(1), 2. https://doi.org/10.3390/cmsf2022003002