Article

Cytoarchitectonic Analysis and 3D Maps of the Mesial Piriform Region in the Human Brain

1
Institute of Neuroscience and Medicine (INM-1), Research Centre Jülich, 52425 Jülich, Germany
2
Helmholtz AI, Forschungszentrum Jülich, 52425 Jülich, Germany
3
Institute for Computer Science, Faculty of Mathematics and Natural Sciences, Heinrich Heine University Düsseldorf, 40225 Düsseldorf, Germany
4
C. & O. Vogt Institute for Brain Research, Medical Faculty and University Hospital Düsseldorf, Heinrich Heine University Düsseldorf, 40225 Düsseldorf, Germany
*
Author to whom correspondence should be addressed.
Anatomia 2024, 3(2), 68-92; https://doi.org/10.3390/anatomia3020007
Submission received: 1 March 2024 / Revised: 25 March 2024 / Accepted: 26 March 2024 / Published: 7 April 2024
(This article belongs to the Special Issue Recent Progress in Human Hippocampus Histological Studies)

Abstract

:
The mesial piriform region plays a central role in olfaction. Its small size and complex geometry, however, make it a difficult target in functional neuroimaging studies, while histological maps often represent schematic drawings, which are not compatible with requirements for modern imaging. To bridge this gap, cytoarchitectonic analysis and mapping of the region was performed in serial histological sections over their full extent in 10 postmortem brains. The temporobasal areas PirTBd and PirTBv and temporal areas PirTu and PirTit were identified and analyzed. Probabilistic cytoarchitectonic maps of the piriform areas in MNI reference space and high-resolution maps of the amygdala-piriform region on the BigBrain model were calculated as part of the Julich-Brain. Differences in the cytoarchitectonic “texture” of the region were quantified based on the Gray Level Co-Occurrence Matrix. Results showed that allocortical areas were not consistently associated with the rostral Limen insulae, although it was often suggested as a landmark in neuroimaging protocols. PirTu was associated with the uncal tip. PirTit was the largest area, reaching to the temporal pole, with a “temporal” (caudal) and a “temporopolar” (rostral) part having complex neighborhood relationships. The probabilistic maps reflect interindividual variability; they are openly available via the digital EBRAINS platform to serve as an anatomical reference for studies related to olfaction.

1. Introduction

The piriform cortex is involved in olfaction—a special sense of smell perception. Olfaction can be related to pleasurable experiences as well as to timely recognition of harmful smells. Olfaction disorder is also a preclinical sign of Alzheimer’s and Parkinson’s diseases [1,2], and is found in many other neurological disorders [3]. The first stages of olfaction include input from the olfactory epithelium to the olfactory bulb, which in its turn transmits the olfactory information to the central olfactory system, or primary olfactory cortex. The piriform allocortex is the main target of the olfactory bulb projections. Other targets are the rostral parts of the superficial amygdala, as well as the temporal and temporopolar periallocortex [4,5]. Functionally, the piriform allocortex was involved in different aspects of olfactory perception [6,7], sniffing [8], and, along with the amygdala, in emotional responses to unpleasant odors [9], olfactory familiarity judgments [10], odor memory processing [11,12,13], and high efferent connectivity during passive smelling [14]. The superficial amygdala was associated with olfaction as shown by meta-analytic connectivity modelling and meta-data analysis of three main amygdaloid clusters [15]. Studies employing stereotactic electroencephalographical (SEEG) recording [16] as well as PET [17,18] showed activity in the deeper parts of the amygdala during the early olfactory attentional processes [16], as well as during emotional processing of olfactory stimuli [17,18]. A participation of the temporopolar cortex in interactions between olfactory and lexical processing has been shown in studies of patients with primary progressive aphasia [19]. The temporal periallocortex (associated with the rostral parahippocampal cortex) demonstrated volume reduction in idiopathic olfactory loss, along with the orbitofrontal cortex, anterior cingulate cortex, insular cortex, and the piriform cortex [20]. However, a more detailed and comprehensive understanding of the specific functions of the subdivision of the amygdala-piriform region is largely missing.
The piriform allocortex has a three-layered structure. It occupies both lips of the endorhinal sulcus, i.e., it is a part of the temporal lobe and the basal brain surface. The amygdala replaces the piriform cortex caudally and also spreads caudoventrally on the rostral ambient gyrus and the semilunar gyrus. The centromedial amygdala (except for the central nucleus) and superficial (cortex-like) amygdala reach the brain surface [21]. A caudal part of the temporal periallocortex is rostrally adjacent to the superficial amygdala, and further continues on the temporopolar surface [4].
The piriform allocortex has been examined in early histological studies, where one to four areas were identified [22,23,24]. Later, it was divided into the area praepiriformis temporalis and the area praepiriformis frontalis [25] which were incorporated into modern histological atlases as temporal area “PirT” and frontal area “PirF” [26]. This division has been adopted in functional [27,28,29,30] and neuropathological [31] studies.
An anterior-to-posterior differentiation of the piriform allocortex was reported in functional neuroimaging studies [32,33,34], including those examining olfaction in Alzheimer’s disease [35,36]. Such segregation originated from studies in rats, which showed anterior-to-posterior differences in cytoarchitecture, connectivity, and function [37,38,39]. A correspondence between the anterior piriform cortex in rodents and the frontal piriform area in macaques (as well as between the posterior cortex in rodents and temporal piriform cortex in the monkeys) was suggested based on similarities in histology [40]. However, MRI studies divided the piriform allocortex into anterior and posterior parts, using as a macroanatomical landmark the most rostral section with the Limen insulae (i.e., most anterior coronal slice where basal brain surface and temporal lobes meet), or a given y coordinate [41]. While earlier cytoarchitectonic studies in humans showed a more anterior extent of the temporal piriform area (or its correlate) than the frontal (anterior) area or its correlate [23,24,25], the question regarding the cytoarchitectonic assignment of the anterior area in humans is still under discussion.
Several modern histological atlases featuring the amygdala-piriform region provide 3D information but are largely based on 2D sections and/or are anisotropic (i.e. having high detailedness within the section and larger intervals between them). These provide partly different information regarding the extent, nomenclature, and subdivisions of the piriform allocortex and the related temporal and temporopolar periallocortex [26,42,43]. For example, while the atlas of Mai et al. (1997, 2016) shows a temporal and frontal (PirT and PirF) area [26,42], though with a different extent, the atlas of Ding et al. 2016 does not show any parcellation of the piriform allocortex [43]. An extension of the piriform allocortex (Pir) on the temporopolar gyrus in the atlas of Mai and colleagues [42] roughly matches the medial part of the periallocortical temporal insular area, area TI, of Ding et al. [44]. Methodical and conceptual differences may have contributed to such findings, in addition to variations in microstructure between brains.
In the current study, we aim at (i) identifying and mapping the allocortical (temporobasal piriform area (PirTBd and PirTBv)) and periallocortical (temporal piriform area (PirTit and PirTu)) of the mesial piriform region in serial histological sections of 10 postmortem brains, (ii) applying texture analysis to the images of the areas in order to statistically verify a distinction between their cytoarchitecture, and (iii) calculating probabilistic maps of the piriform areas in a standard reference space in order to complement the fine-grained probabilistic maps of the amygdala [21] of the Julich-Brain atlas as a tool to deeper understand structural–functional relationships in the human brain. Moreover, we used the BigBrain, a high-resolution template, composed of 7404 cell-body stained sections, which were 3D reconstructed at a spatial resolution of 20 μm isotropic [45] to create ultrahigh-resolution maps of the amygdala-piriform region. The maps represent tools to inform findings in neuroimaging studies, including highfield MR imaging, and provide constraints for modeling and simulation.

2. Materials and Methods

2.1. Postmortem Brains and Histology

Cytoarchitectonic mapping was performed in serial, cell-body stained [46] sections in a sample of 10 post-mortem brains (age range 37–79 years, Table 1). All brains came from the body donor program of the Anatomical Institute of the University of Düsseldorf. They were obtained according to legal and ethical regulations. The post-mortem delay did not exceed 24–36 h. The brains were processed as previously described [47]. In short, they were fixed in formalin or Bodian’s fixative and underwent MRI with a T1-weighted sequence (3-D FLASH sequence) with 1 mm resolution to provide undistorted references for subsequent 3D reconstruction. Brains were embedded in paraffin and serially cut (into 20 μm thick sections) with a large-scale microtome in the coronal plane starting from the occipital pole. Every 15th section was mounted on gelatine-coated slides and stained for cell bodies with a modified silver staining [46]. Sections were digitized with an in-plane resolution of 1 pixel/μm, using a high-throughput brightfield microscope, TissueScope™ LE120 (© Huron Digital Pathology, St. Jacobs, ON, Canada).

2.2. Cytoarchitectonic Mapping

The mesial piriform region was cytoarchitectonically identified and analyzed in every 15th section in both hemispheres (Table 1), at 1 μm resolution. Areas were identified along their rostro-caudal extent based on information in historical and more recent studies (see [48] for comparison between the earlier studies, [42,43]). Areas were labeled in images with 20 μm resolution using in-house software (online SectionTracer 3415) (Figure 1).

2.3. Texture Analysis

Texture analysis has been performed to characterize the cytoarchitecture of the areas based on analyses of the grayscale image. The 8bit images and masks of four areas (ROIs) were automatically generated from the annotations in the online SectionTracer; 1 μm images were loaded [47]. In total, 1135 ROIs from 10 postmortem brains were checked for histological artefacts (e.g., tissue tears), and those with the artefacts were excluded. Finally, 770 ROIs, including 222 ROIs of PirTBd, 173 ROIs of PirTBv, 224 ROIs of PirTit, and 80 ROIs of PirTu, were analyzed using texture analysis. As the first step, histograms for all ROIs were computed and then averaged; the mean histogram was used to adjust grayscale value of all original histograms. The Gray Level Co-occurrence Matrix (GLCM) approach [49] was adapted for examining the image texture [50]. GLCMs were based on the co-occurrence frequencies of the pixel intensity (0 to 255), calculated for all directly adjacent pixel pairs. Altogether 21 modified Haralick texture features were extracted (autocorrelation, clusterProminence, clusterShade, contrast, correlation, differenceAverage, differenceEntropy, differenceVariance, dissimilarity, energy, entropy, homogeneity, informationMeasureOfCorrelation1, informationMeasureOfCorrelation2, inverseDifference, maximalCorrelationCoefficient, maximumProbability, sumAverage, sumEntropy, sumOfSquaresVariance and SumVariance) from the GLCMs. The modified Haralick features are consistent across quantizations of different gray levels and show better outcomes compared to the classical Haralick texture features. In order to simplify the dataset represented by 21 features by keeping the degree of information, a Principal Component Analysis (PCA) was performed. The dataset was proved to be suitable for PCA by revealing a satisfactory sampling adequacy measured as 0.762 [51]) in the Kaiser–Meyer–Olkin (KMO) measure and Bartlett’s test of sphericity. PCA identified the most significant independent factors (IF), characterized by eigenvalues higher than 1, which were tested using the Kruskal–Wallis test under the null hypothesis that distribution of each of IF is the same across all four areas (p < 0.05). For the pairwise comparisons, significance values were adjusted by the Bonferroni correction for multiple tests.

2.4. Computation of Probabilistic Maps and Maximum Probability Map

The histological volumes of the postmortem brains and their areas were generated by a workflow using linear and non-linear registration algorithms [52]. For 3D reconstruction, the respective histological volume was registered to the MRI volume obtained prior to the cutting process to compensate for the deformations caused by histological processing. The high-resolution histological data were downscaled to adjust to the lower-resolution MRI dataset. The 3D reconstructed histological datasets were spatially normalized to two widely used reference spaces: (i) to the single-subject MNI “Colin 27” [53] and (ii) to the average ICBM2009c Nonlinear Asymmetric (MNI ICBM 152) template by using linear and non-linear transformations. The same affine transformations and nonlinear elastic registrations were applied for the reconstruction of the delineated areas as those used for the 3D reconstruction of the whole postmortem brains [54]. Every area of each brain was superimposed in the reference space to generate probabilistic, cytoarchitectonic maps [52], following the same method as applied for other cortical and subcortical areas, including the amygdala [21]. These maps provide the probability, with which a certain area was found at a particular position in space (an overlap from 0% to 100%). Probabilities represent a measure for intersubject variability of a given area in localization and extent. Maximum probability maps (MPM) were then calculated as a non-overlapping representation of all four areas of the mesial piriform region [55].

2.5. Volumetry

The volumes of each area were calculated using the contour lines from the online SectionTracer and Cavalier`s principle [56]. Individual shrinkage factors were computed for each brain as the ratio between its fresh volume and its histological volume [57] in order to compensate for shrinkage caused by histological processing. Normalized volumes of each area in each brain were calculated to compensate for differences in absolute volumes of the brains (volume area/total brain volume (%)) [58]. Normalized volumes were tested for interhemispheric (left vs. right) and sex (male vs. female) differences with pair-wise permutation tests [59]. For each permutation test, the difference between the average volumes for the respective groups (male/female; left/right hemisphere) was calculated. For each of these groups, under the null hypothesis of exchangeability (gender exchangeability/hemispheric exchangeability), we randomly re-assigned the volumes for the computation. Such computation reiterated 1,000,000 times (Monte-Carlo simulation). If the true gender/hemispheric difference was larger than 95% of the difference under random distribution (null hypothesis), it was estimated as significant (p < 0.05; Bonferroni corrected for multiple comparisons) [58].

2.6. Mapping and Reconstruction of the Piriform Region in the BigBrain

Cytoarchitectonic delineations in the BigBrain were performed using a web-based annotation tool (MicroDraw: The Institut Pasteur, Paris, France, https://github.com/r03ert0/microdraw, accessed on 27 March 2024) at 1 μm resolution in-plane, with a distance of sections between 60 to 360 μm. The four areas of the mesial piriform region were identified and delineated in 57 sections in the right and 42 sections in the left hemisphere. These delineations complemented those of 13 amygdala subdivisions (three main groups and the amygdalostriatal transition zone) and 6 related fiber bundles, performed in 57 sections in the right hemisphere and in 59 sections in the left hemisphere based on the previous criteria [21]. Based on the manual delineations, training and subsequent prediction of annotations in intermediate, unmapped sections were performed separately for each dataset on the supercomputer JURECA-DC at Jülich Supercomputing Centre [60]. As proposed in [61], Convolutional Neural Networks used a multi-scale U-Net architecture [62] for image segmentation based on each pair of consecutive sections with the manual mappings. The resulting stack of 2D mappings (predictions) was verified in MicroDraw, and sections of low quality were excluded and replaced by linear interpolations. Final annotations were non-linearly transformed to the sections of the 3D reconstructed BigBrain space at 20 μm isotropic resolution [63]. The resulting volume was smoothed using a 3D median filter with a size of 5 in each dimension, corresponding to a smoothing of 2 pixels (40 μm) in each direction. This step helped to resolve inconsistencies across sections resulting from errors of the deep learning method or the successive transformation. As a last step, connected components were identified and only components larger than 20% of the largest identified components were included in the final volume data, which removed remaining noise from the segmentations. The volume itself and coronal cross-sections through the volume are provided for each area. Surfaces were computed, and subdivisions were visualized using the Neuroglancer.

3. Results

The mesial piriform region includes two allocortical areas of the Piriform TemporoBasal area PirTB (PirTBd and PirTBv), and two periallocortical areas of the Piriform Temporal area PirT (PirTit and PirTu). The PirTB area was found on both the temporal lobe and the basal brain surface, while the PirT areas were associated with the temporal lobe and temporal pole. The latter location was associated with the most rostral part of the PirTit area (Figure 1 and Figure 2).
On the basal brain surface, the caudal PirTBd laterally bordered to a caudal extension of the retrobulbar region [64] (yet unmapped) which corresponds to the lateral olfactory area of Ding et al. [43]. This part of the retrobulbar region separates PirTBd from the olfactory tubercle in most sections. Overall, the piriform cortex extends more caudally than the olfactory tubercle (Figure 1). In its rostral part, PirTBd was adjacent to either PirTBv or piriform insular region (PirI) medially, as well as laterally (yet unmapped). In its caudal limit, PirTBd was dorsally adjacent to the medial nucleus (Figure 2a) in ten hemispheres (out of 20), while PirTBv was ventrally adjacent to the medial nucleus in three hemispheres. PirTBv was adjacent ventrally to PirTBd throughout most of the rostro-caudal extent. PirTBv was located dorsally to the amygdalopiriform transition area (APir) in caudal sections and to PirTit further rostrally (Figure 1 and Figure 2). PirTit had a medial border with PirTu in the caudal sections (Figure 2), while in the rostral sections its neighboring areas were the perirhinal cortex and the temporopolar-perirhinal area (TPrh) medially and temporopolar-piriform area (TPir) laterally (yet-unmapped areas). In seven hemispheres (out of 20), the PirTu area was ventrally adjacent to the amygdalopiriform transition area (APir) (Figure 2b). PirTu lay dorsomedially to the entorhinal cortex (Figure 1) and the perirhinal cortex.

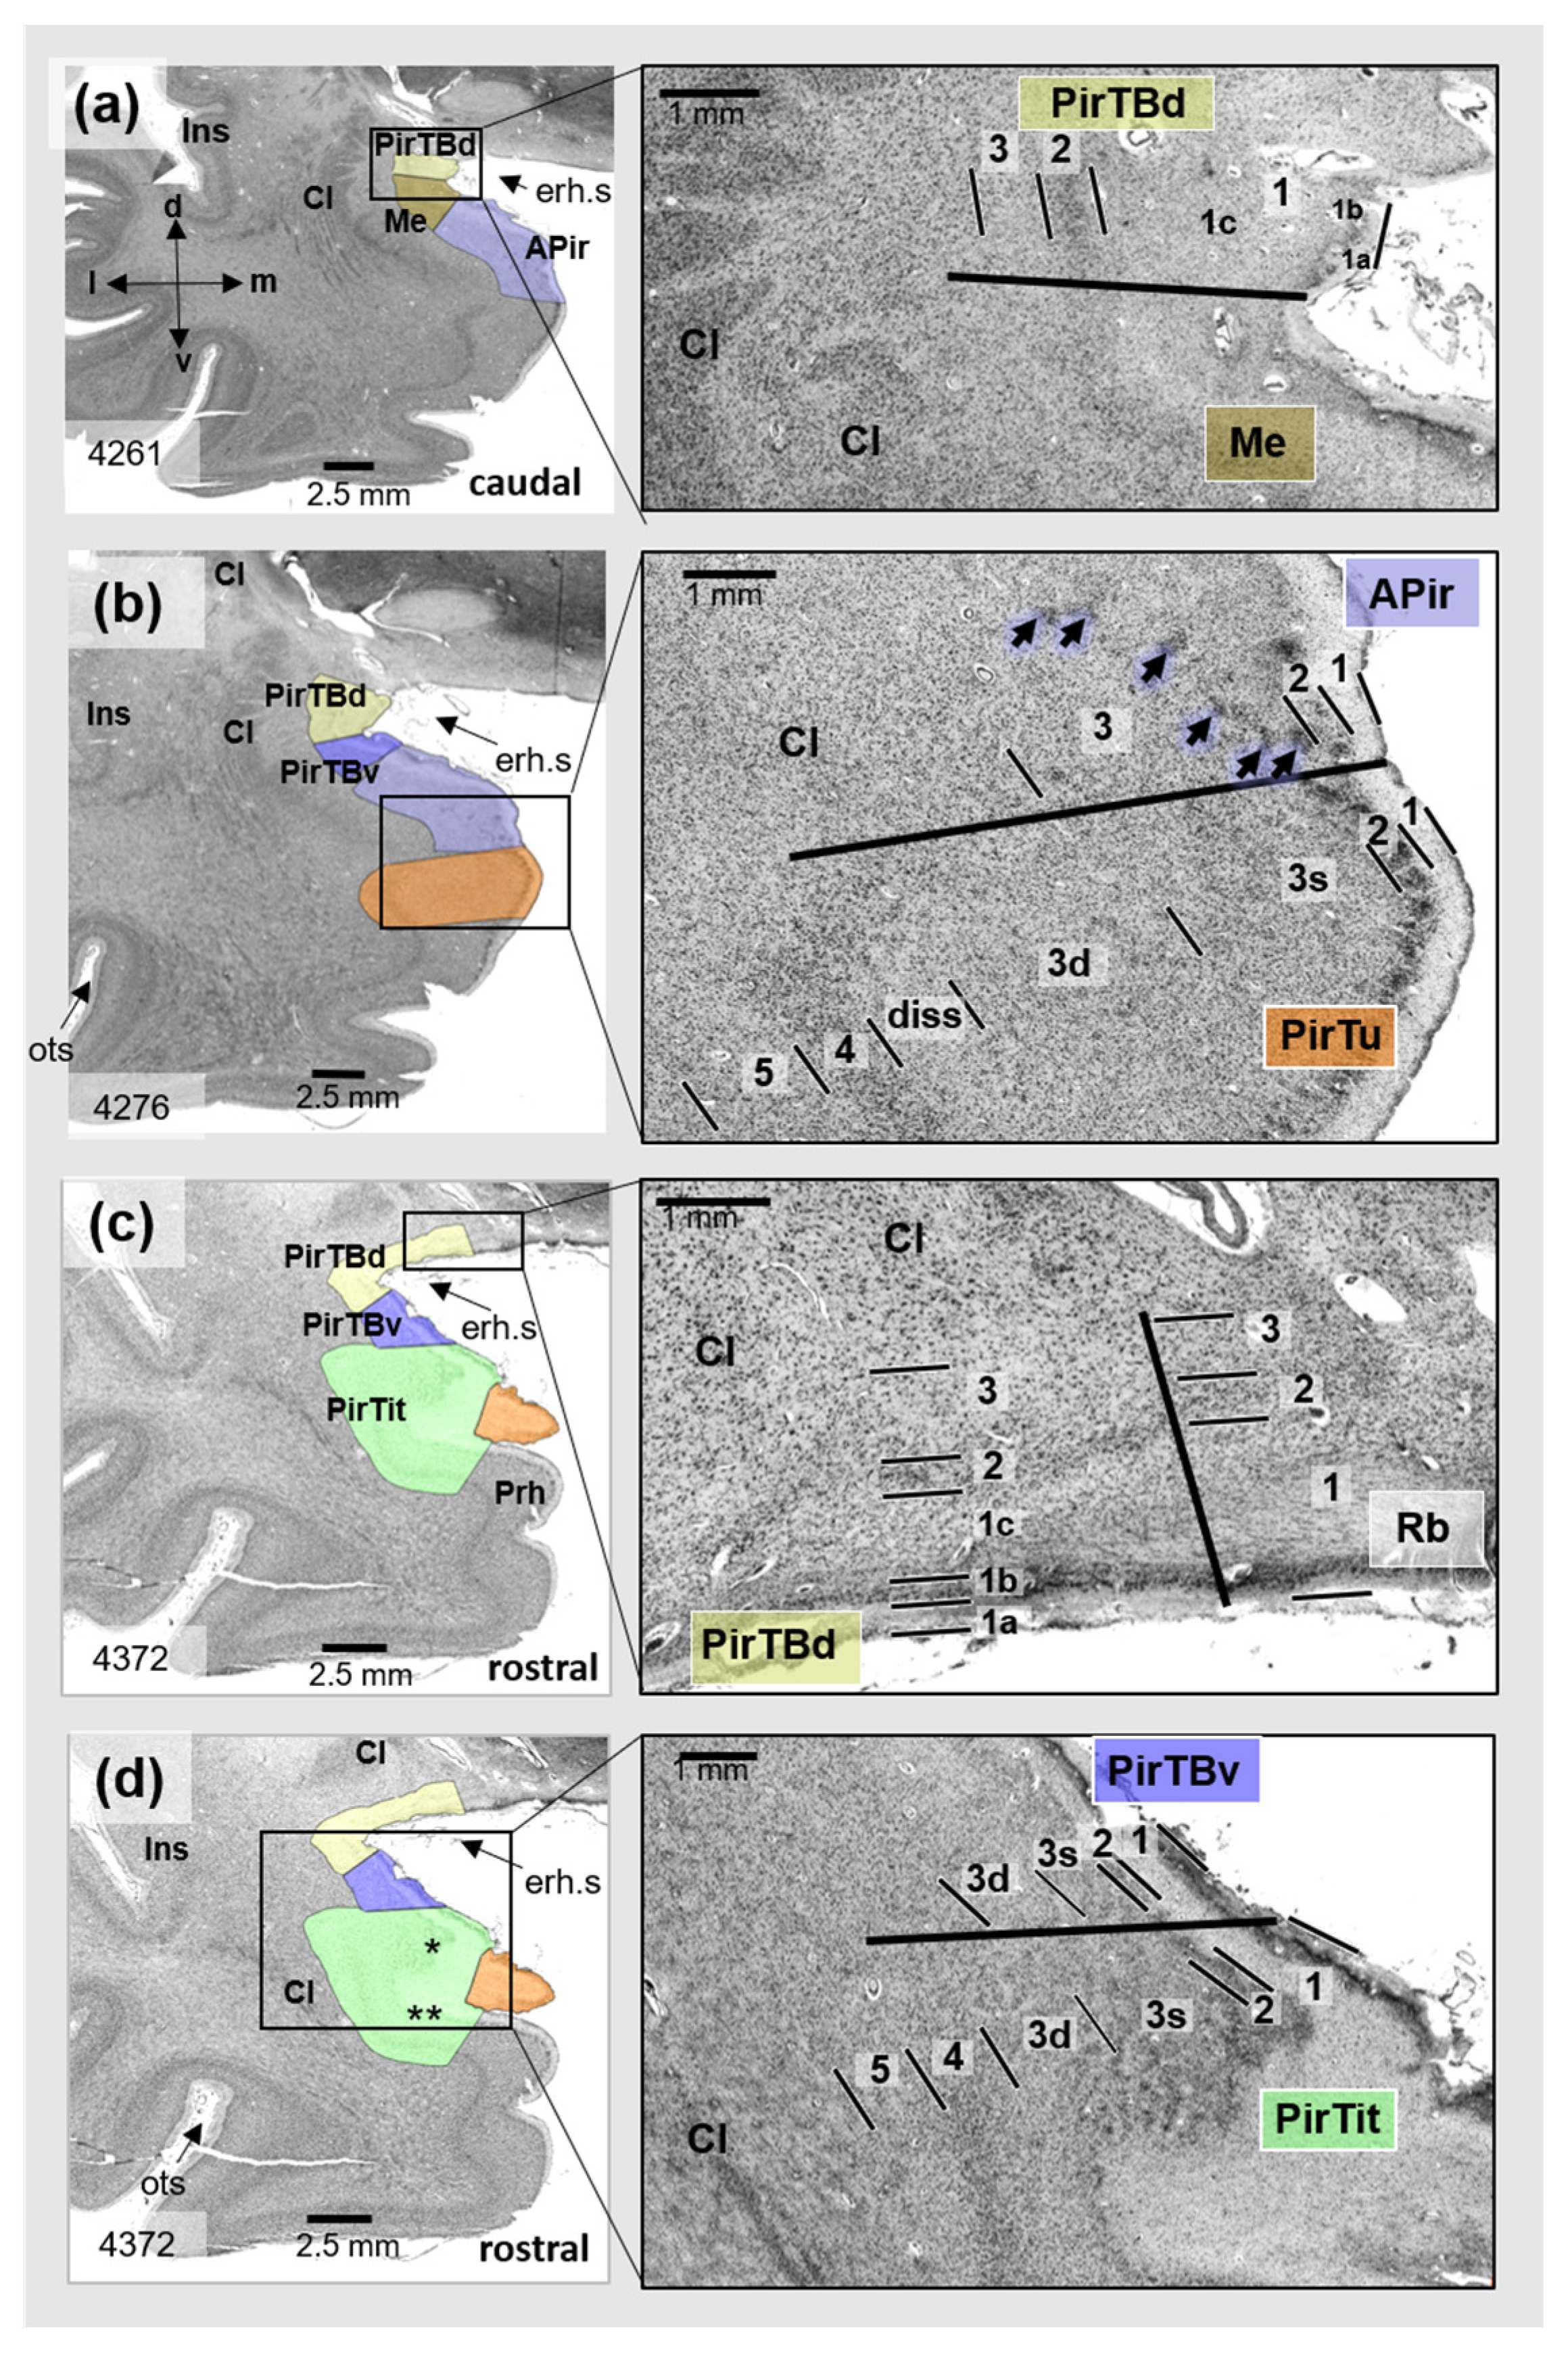
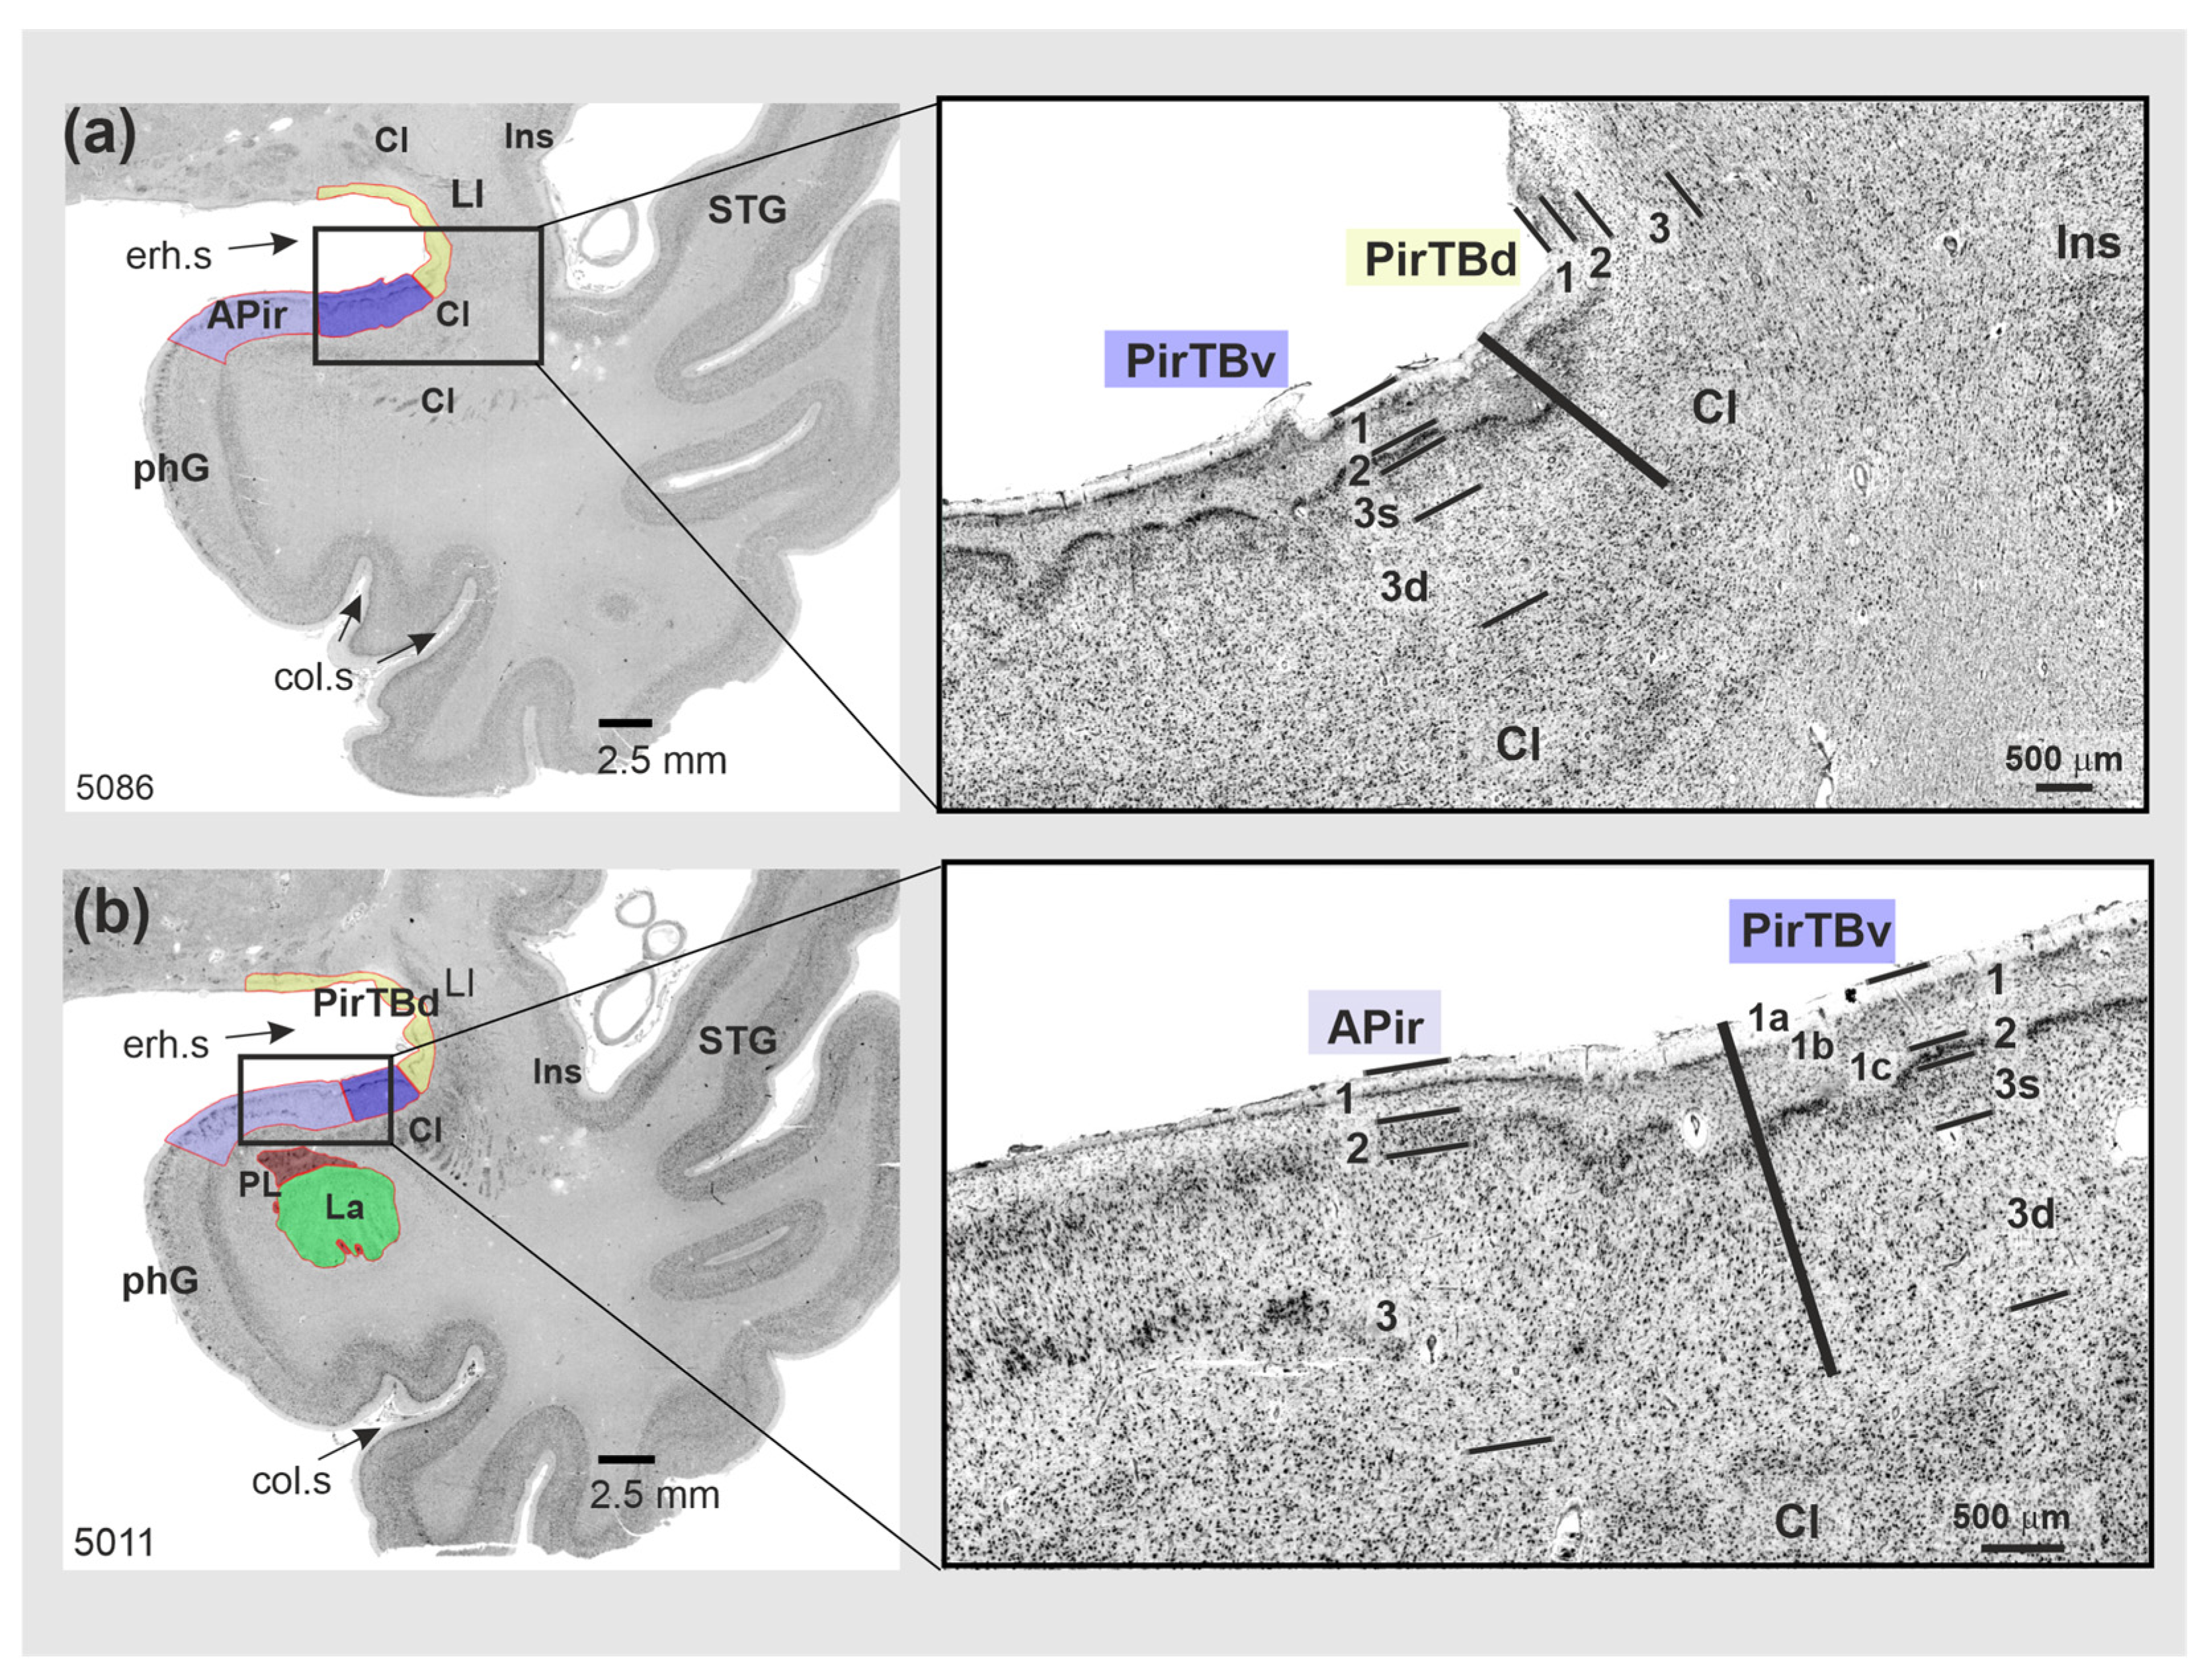
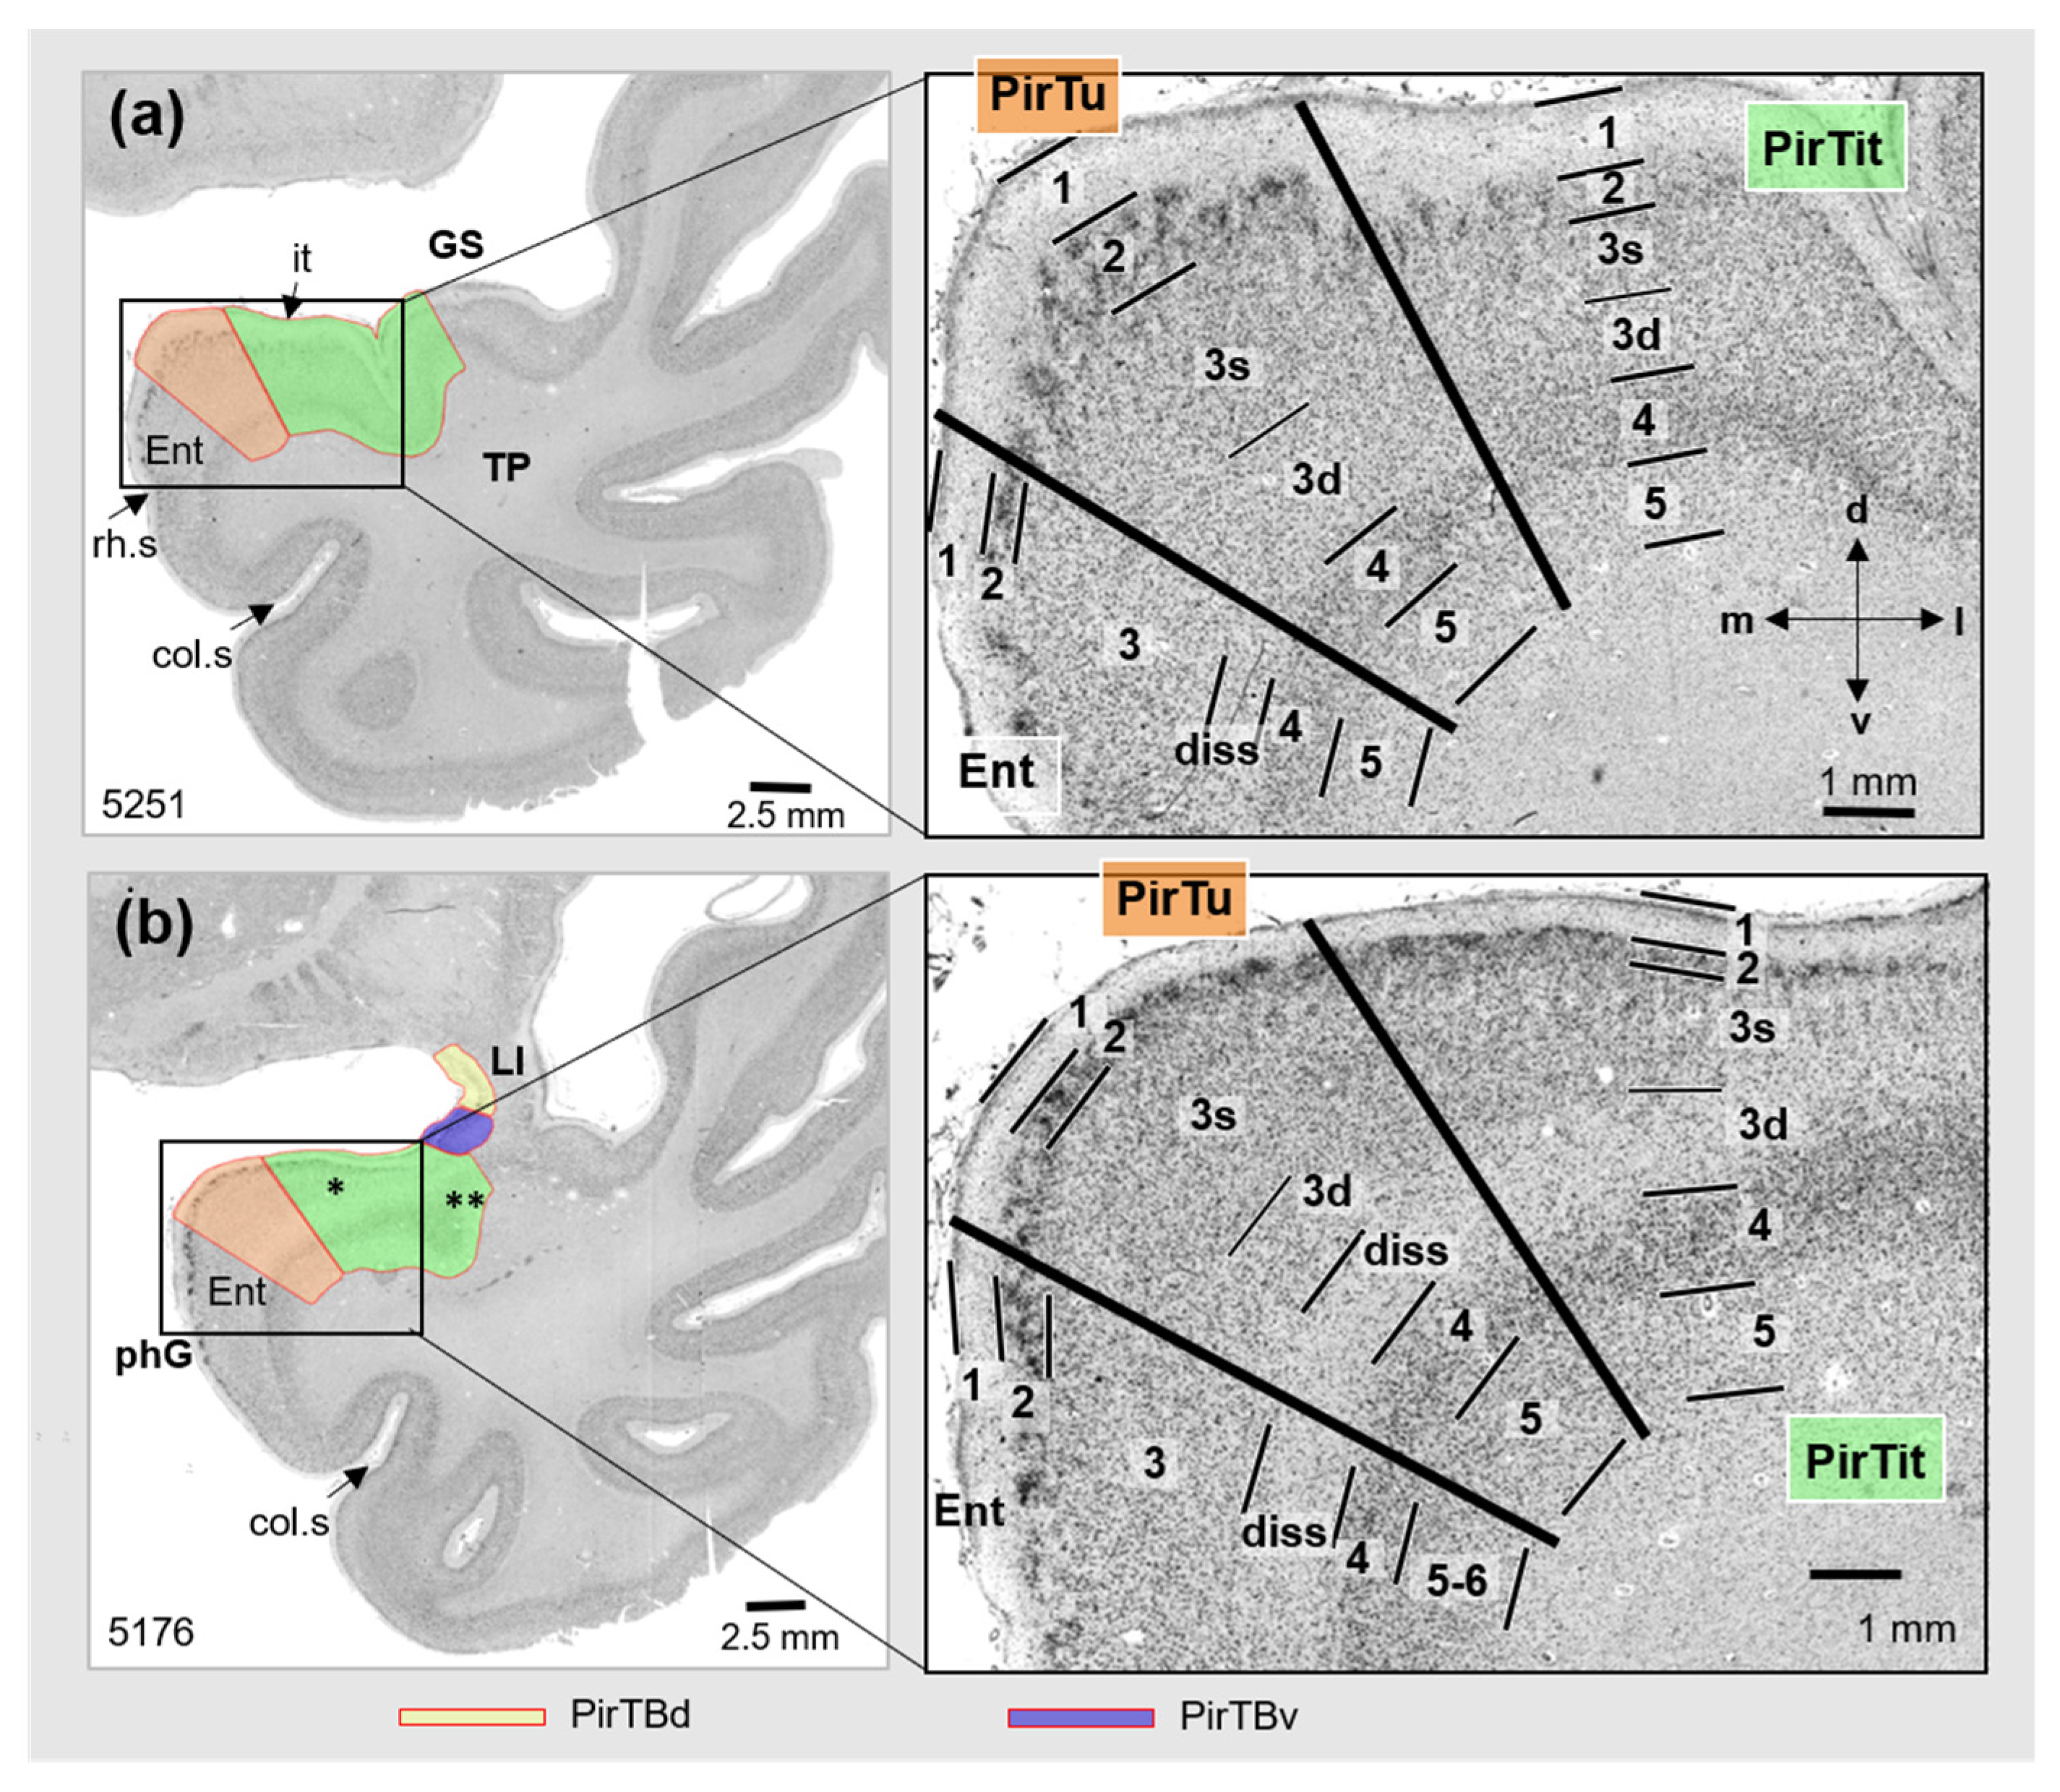
3.1. Cytoarchitecture of Piriform Temporobasal Areas (PirTBd and PirTBv)

PirTB is an allocortical region composed of two areas: PirTBd and PirTBv. They have three layers (L). L1 showed a non-myelinated outer sublayer (1a), a glia cell-rich intermediate sublayer (1b), and a myelinated inner sublayer (1c) (Figure 2a,c,d, Figure 3). The narrow L2 had small and densely packed cells. In L3, cells were larger and irregularly arranged, with a tendency toward grouping. PirTB consists of a dorsal (PirTBd) and a ventral (PirTBv) area. PirTBd had a thinner sublayer 1b and a thicker L2 with slightly larger and less densely packed cells, as compared to PirTBv. Only in the latter did L3 show a recognizable superficial sublayer 3s; L3 was wider than in PirTBd (Figure 3a). The deep L3 transits to the claustrum (Claustrum temporale reticulare of Brockhaus), which had a higher cell packing density.
The rostral PirTBd had a lower cell density in L2 and slightly larger cells than the caudal PirTBd (compare Figure 2a and Figure 3a). On the basal brain surface, PirTBd showed fewer cells and an increase in cell size (Figure 2c) as compared to PirTBd in the endorhinal sulcus. Its border with the medial nucleus of the amygdala (in 11 hemispheres, Figure 2a) was characterized by smaller and more densely packed cells in L2 and lower cell density in L3 in PirTBd. On the basal brain surface, PirTBd abutted the superficial part of the retrobulbar region, which showed thicker L1 and no clear separation between L2 and L3 (Figure 2b). PirTBv showed the border with the amygdalopiriform transition area (APir). At this border, PirTBv had a narrower L2 with higher cell packing density, specific sublayer 3s of small and densely packed cells, and otherwise lower cell packing density in L3 with more irregularly arranged cells than in APir (Figure 3b).

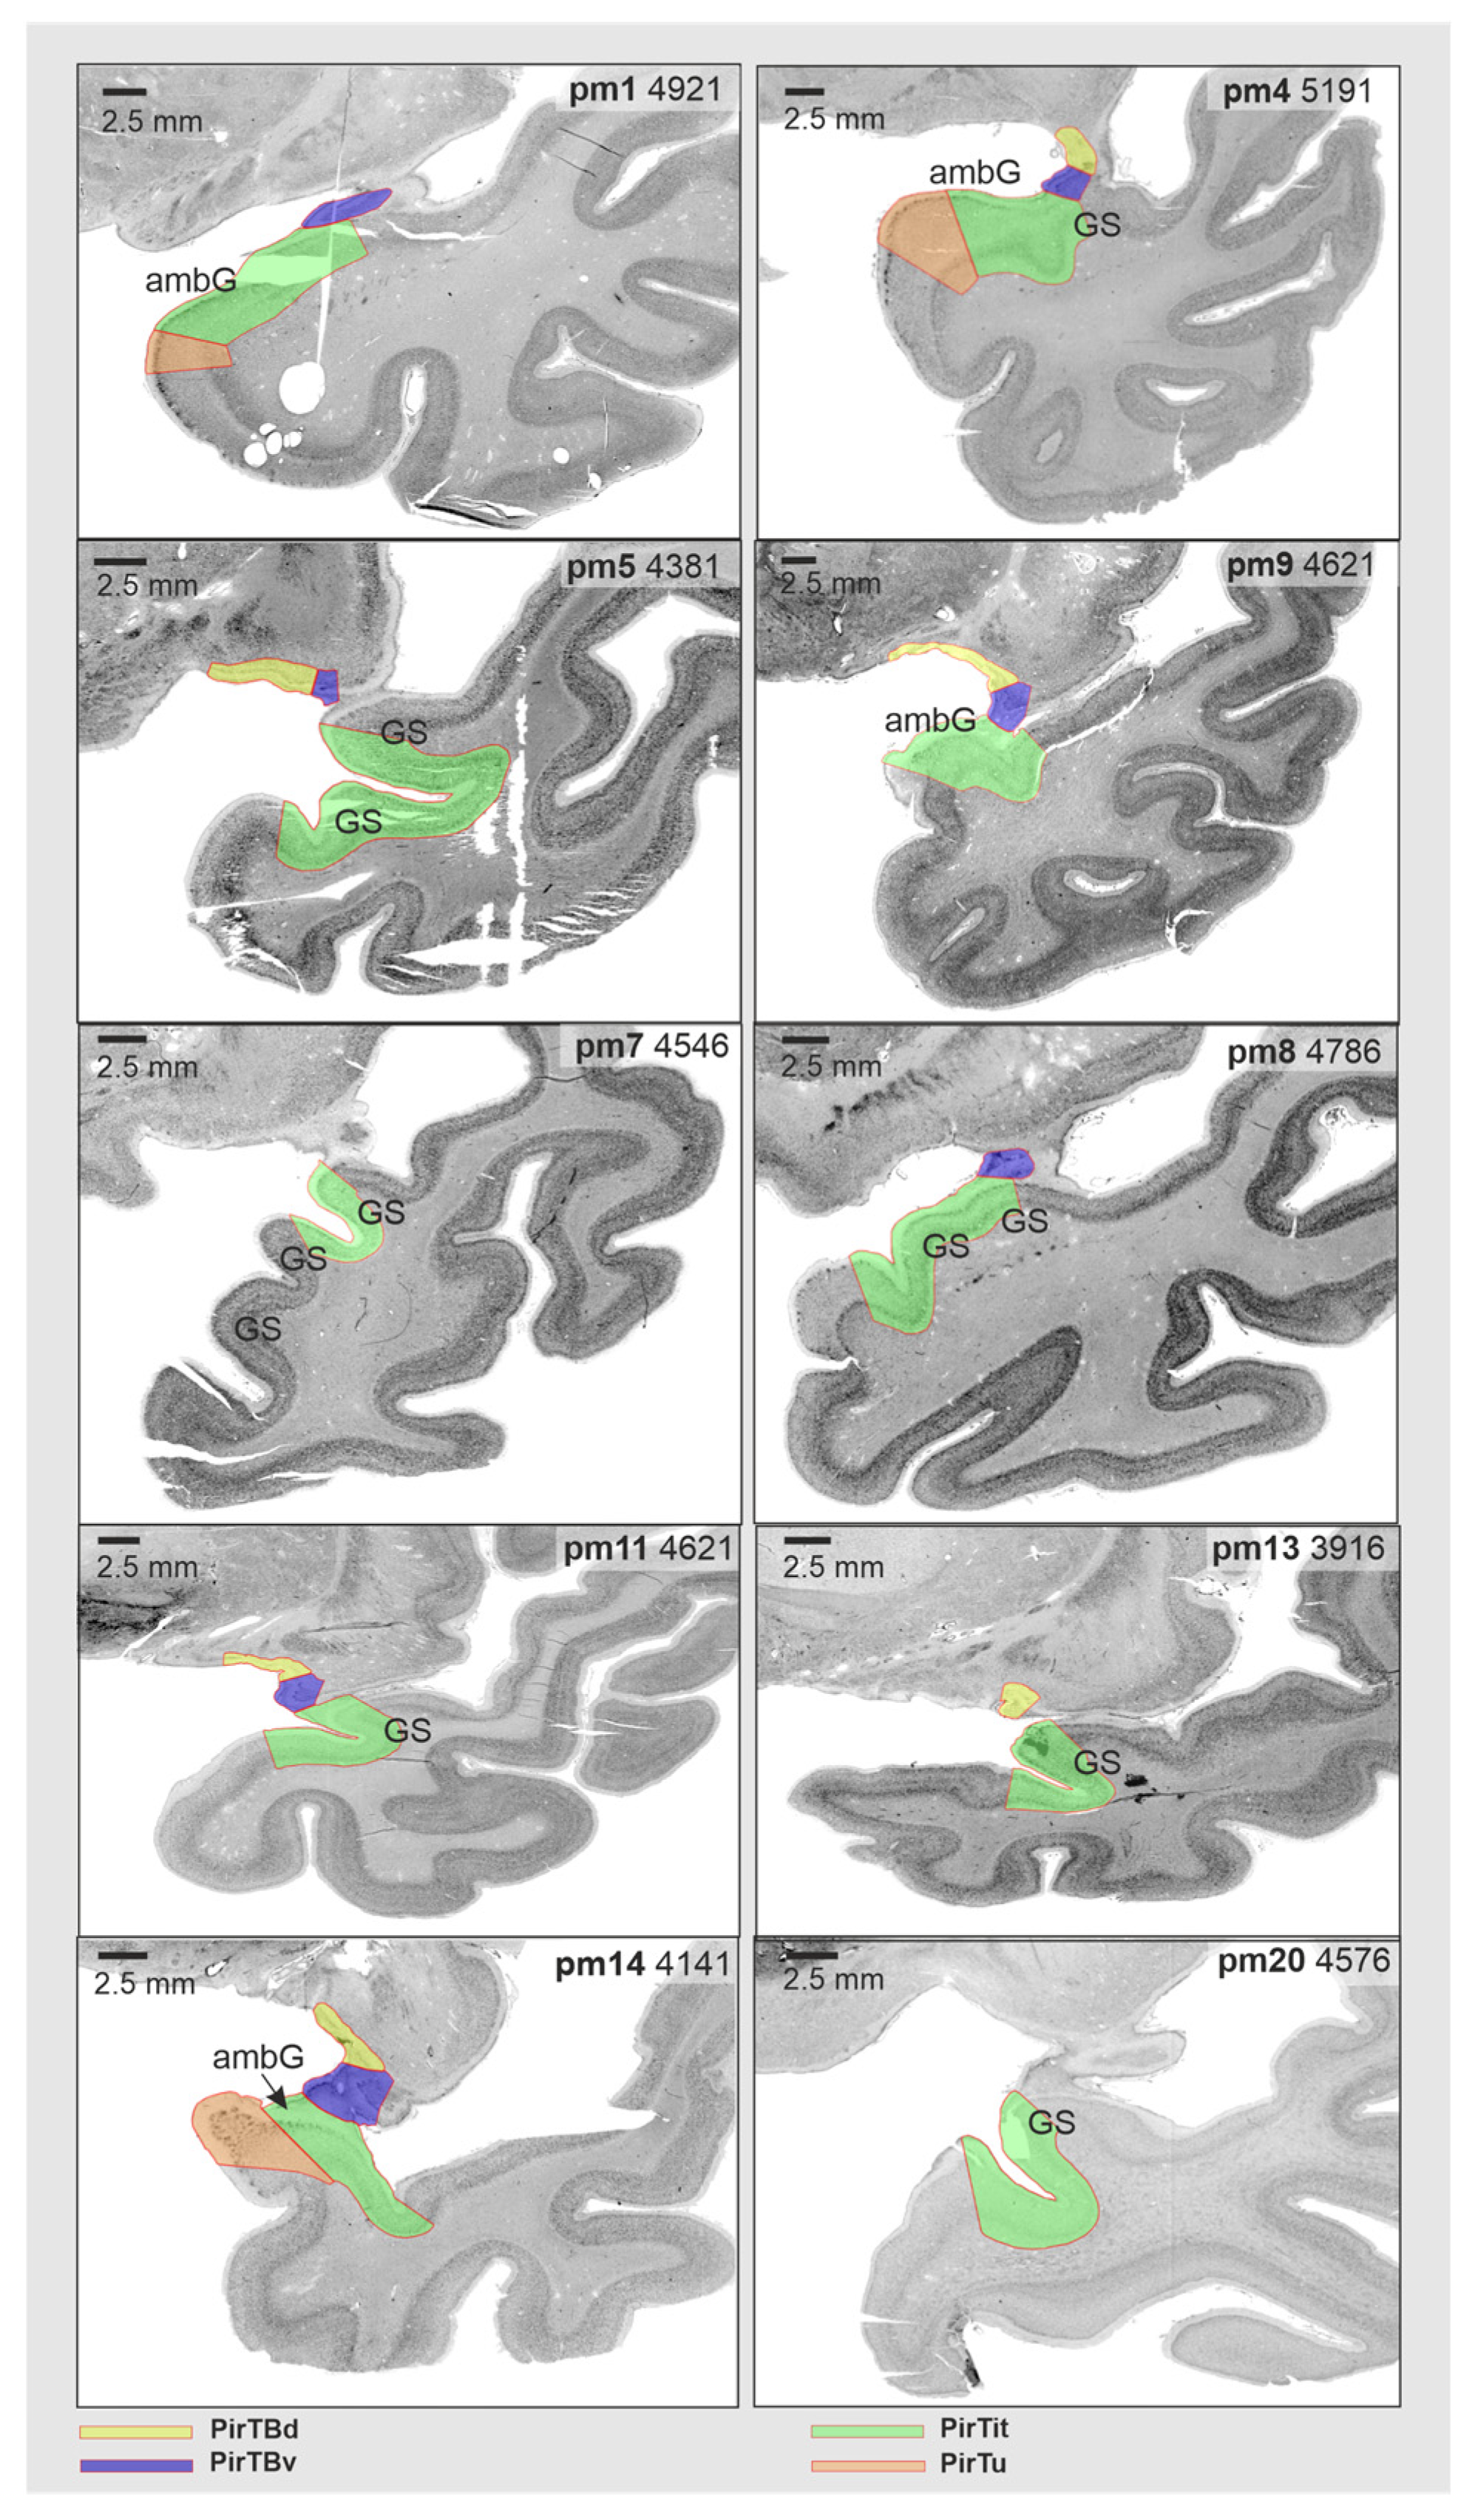
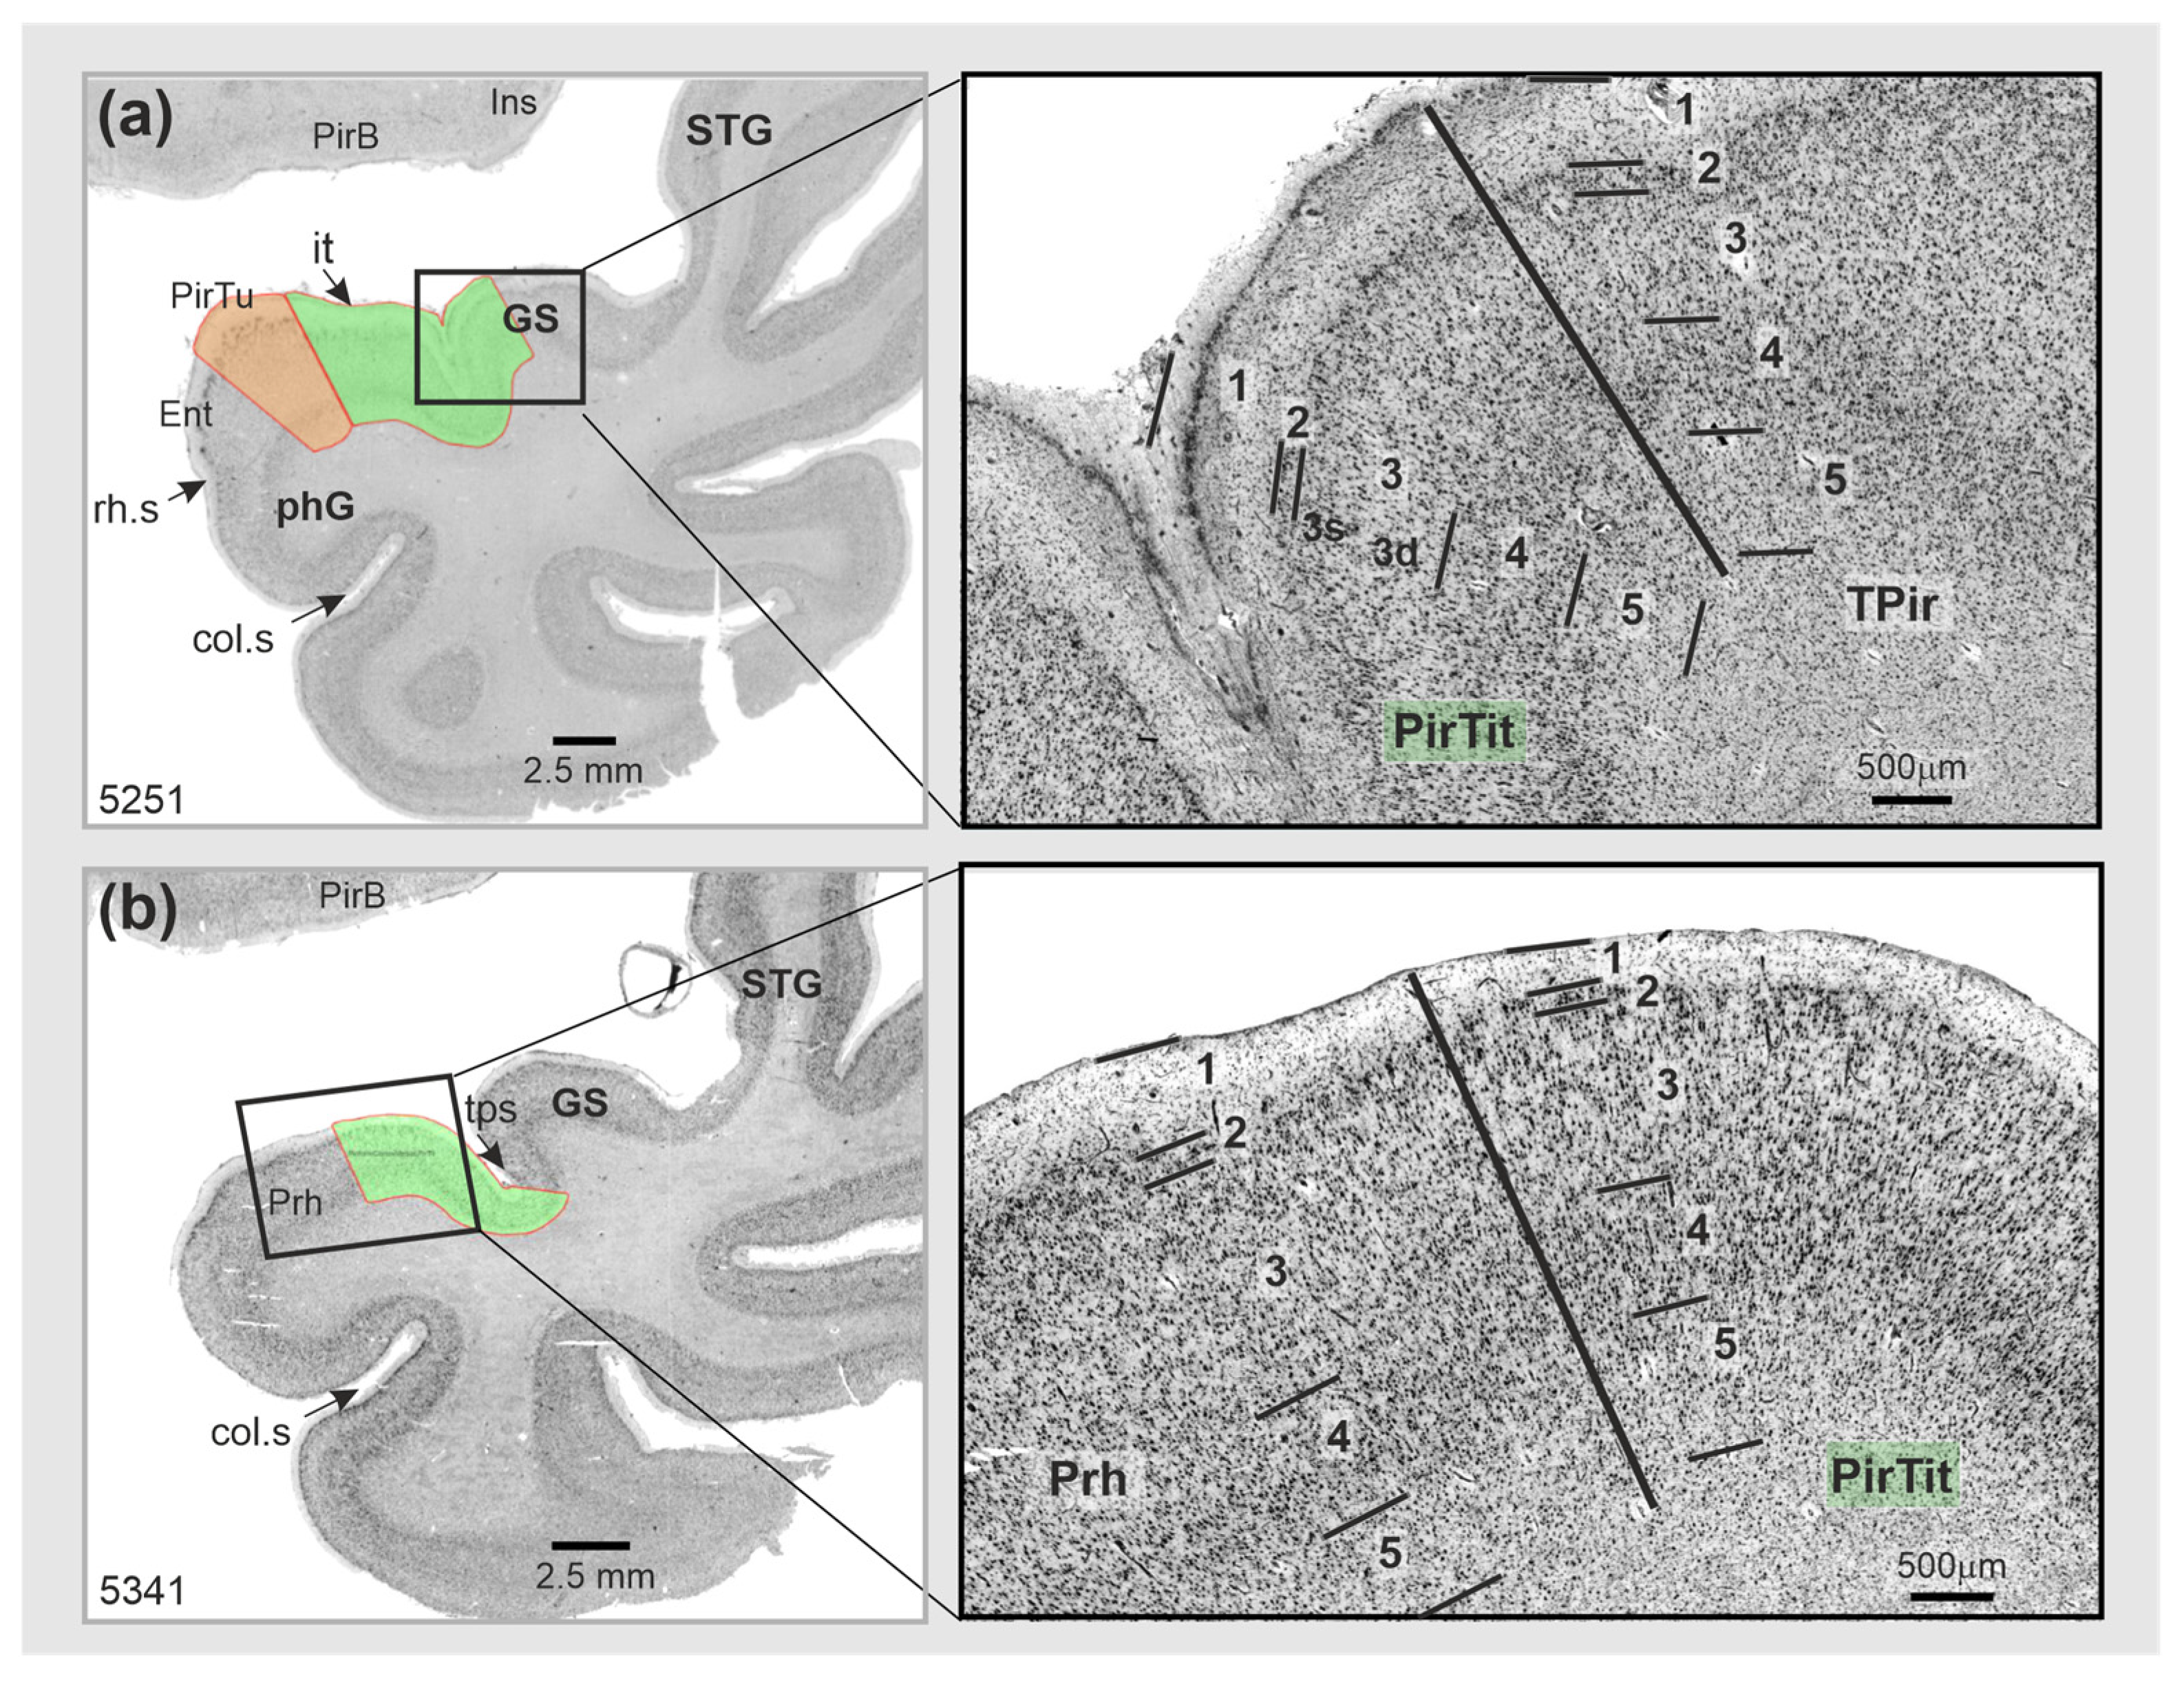
3.2. Piriform Temporal Areas (PirTit and PirTu)

PirT has two areas: PirTit (related to both temporal lobe and temporal pole) and PirTu (associated with the uncal tip of the temporal lobe). Both areas have five layers: L1 had a variable thickness rostrocaudally (Figure 4), L2 was discontinuous, L3 (especially deep sublayer 3d) and L5 showed an overall low cell density, and L4 had middle-sized and small cells, which were more densely packed than in L3d and L5 and were darkly stained. The arrangement of cells throughout PirT was mostly irregular; L5 revealed a gradual transition into the white matter.
PirTit was heterogeneous (Figure 4a,b) in the sense that the cytoarchitecture differed between the “temporal” (caudal) and “temporopolar” (more rostral) parts: the superficial layers (L2–L3s) of the temporal PirTit revealed a higher cell packing density, with occasional cell clustering (Figure 4b) than the temporopolar part (Figure 4a). The deep part of L3 (sublayer 3d) of the temporal PirTit was more cell-sparse than in the temporopolar part. The temporal part was gradually replaced by the temporopolar part rostrally in three hemispheres. The complex anatomy of the region and tangential cutting planes through the piriform region resulted in the appearance of the temporal and temporopolar part of PirTit at the same rostro-caudal level in other hemispheres; in seven hemispheres, the temporopolar part appeared ventrally to the temporal part, and also ventrally to PirTu (Figure 2d), while in 10 hemispheres, the temporopolar part gradually developed laterally to the temporal part (Figure 4b). At the medial border to PirTu, area PirTit showed a broader cortex, a broader L2, and more irregularly arranged cells in L2 and L3s than at its lateral border with the temporopolar periallocortex (TPir) (compare Figure 4a and Figure 5a). Moreover, area PirTit was characterized by larger and less densely packed cells, as compared to TPir. The rostrolateral and most rostral parts of PirTit had the most narrow L2 of the entire area (Figure 5). At this level, a thin sublayer 3s also had larger and less densely packed cells than medially and caudally.
The border of PirTit with PirTBv was characterized by a different layering (5 in PirTit vs. 3 in PirTBv). Moreover, PirTit showed irregularly arranged cells and a broader L2 than PirTBv (Figure 2d). Both the perirhinal cortex and the temporopolar-perirhinal area (TPrh) were medially adjacent to the rostral PirTit. The cell arrangement was more irregular in the perirhinal cortex (Figure 5b), but more regular in TPrh than in PirTit (Figure 1 for localization).
PirTu was small in the dorsoventral and the rostro-caudal extent but had a broad cortex. The small cells of L2 were accumulated into groups, which were irregularly arranged; they formed a few rows in the rostral PirTu. Sublayer L3s was broad, and composed of small, densely packed cells. Sublayer 3d (deep part of layer 3) of PirTu (Figure 4a) was partly replaced by the Lamina dissecantia in the caudal PirTu (Figure 4b).
In contrast to APir of the amygdala, PirTu had a different number of layers (5 in PirTu vs. 3 in APir). Moreover, cell clustering in L2 and a broad sublayer 3s of PirTu were not present in APir. The latter showed an ascending line of small cell clusters in L3 specific to its medial part, near the border (Figure 2b).
The border of the rostral PirTu with the entorhinal/perirhinal cortex was marked by a higher cell density and smaller cells in the superficial layers (L2, 3s) in PirTu. Moreover, these neighboring areas of PirTu showed fewer cell clusters in L2, i.e., no tendency toward their accumulation as in PirTu rostrally. The layering of PirTu was, overall, similar to that of the entorhinal cortex.
The cell clustering in L2 of PirTu marked the border with PirTit as well, as L2 in PirTit showed fewer cell clusters and lower cell density within the cluster (Figure 5a). Moreover, this border showed less densely packed cells in 3s, a less-wide cortex and an absence of Lamina dissecantia in PirTit (Figure 5). However, close to the border, sublayer 3d of PirTit reminded Lamina dissecantia of PirTu.

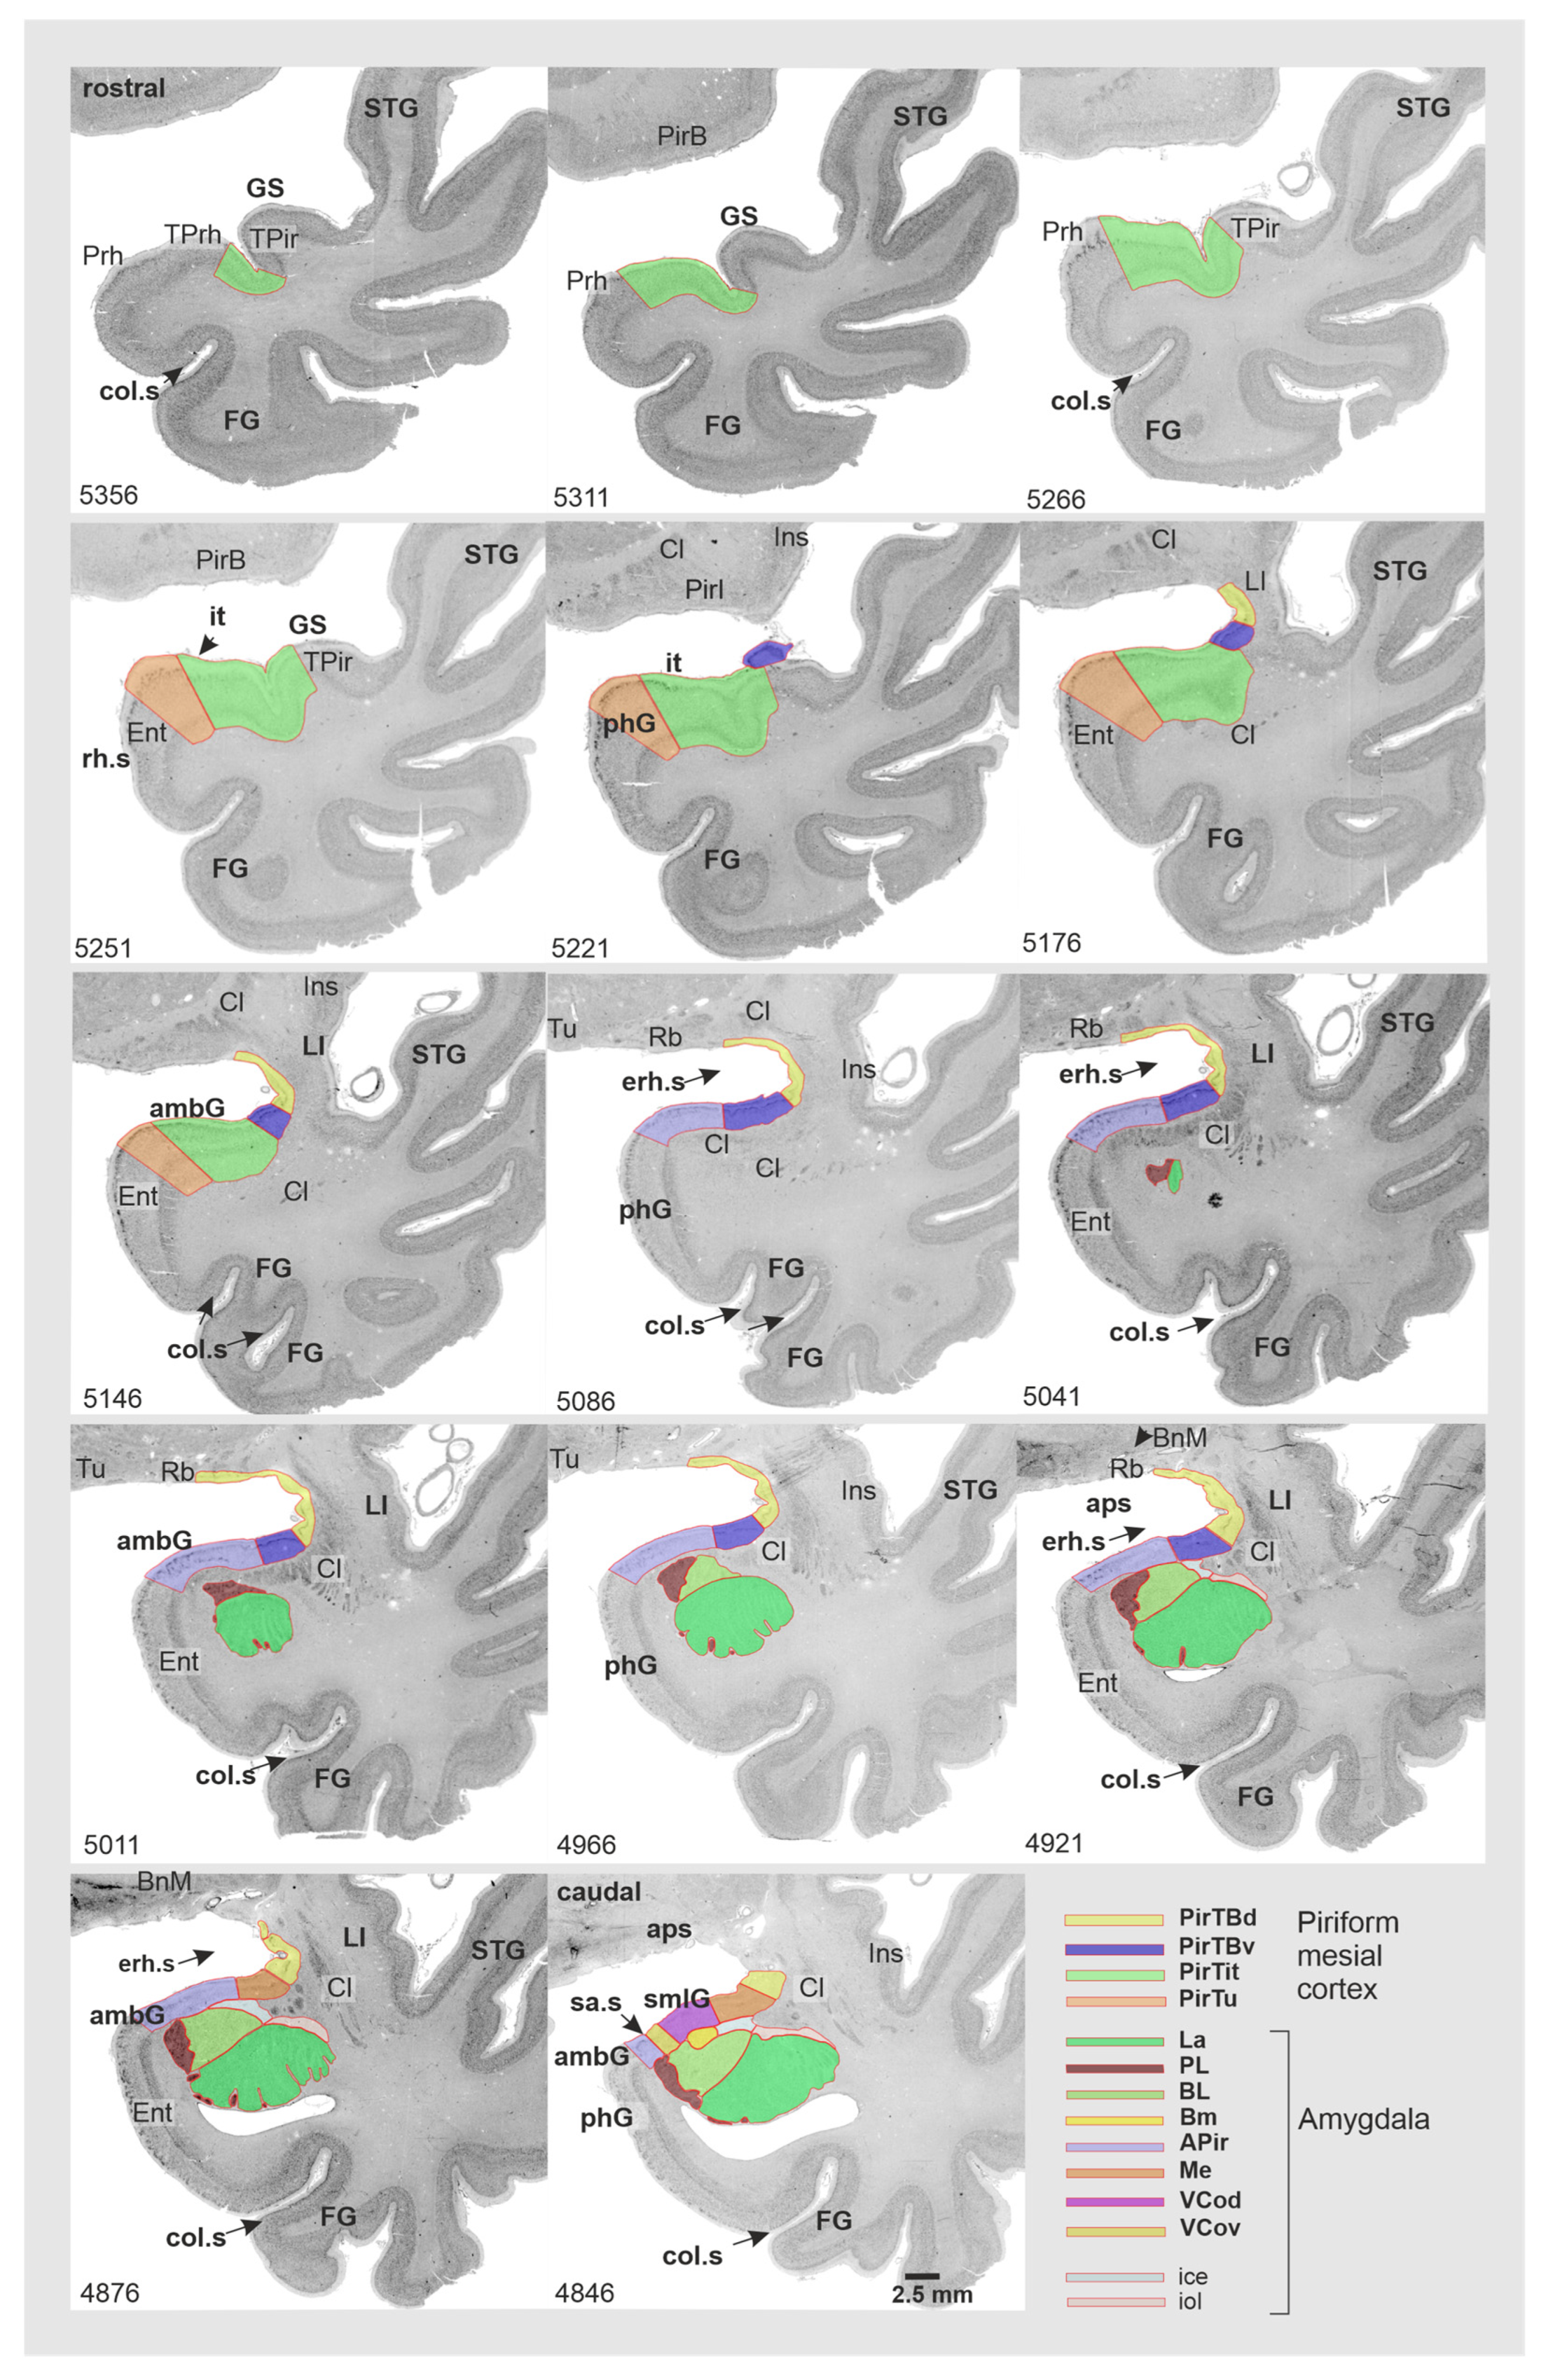
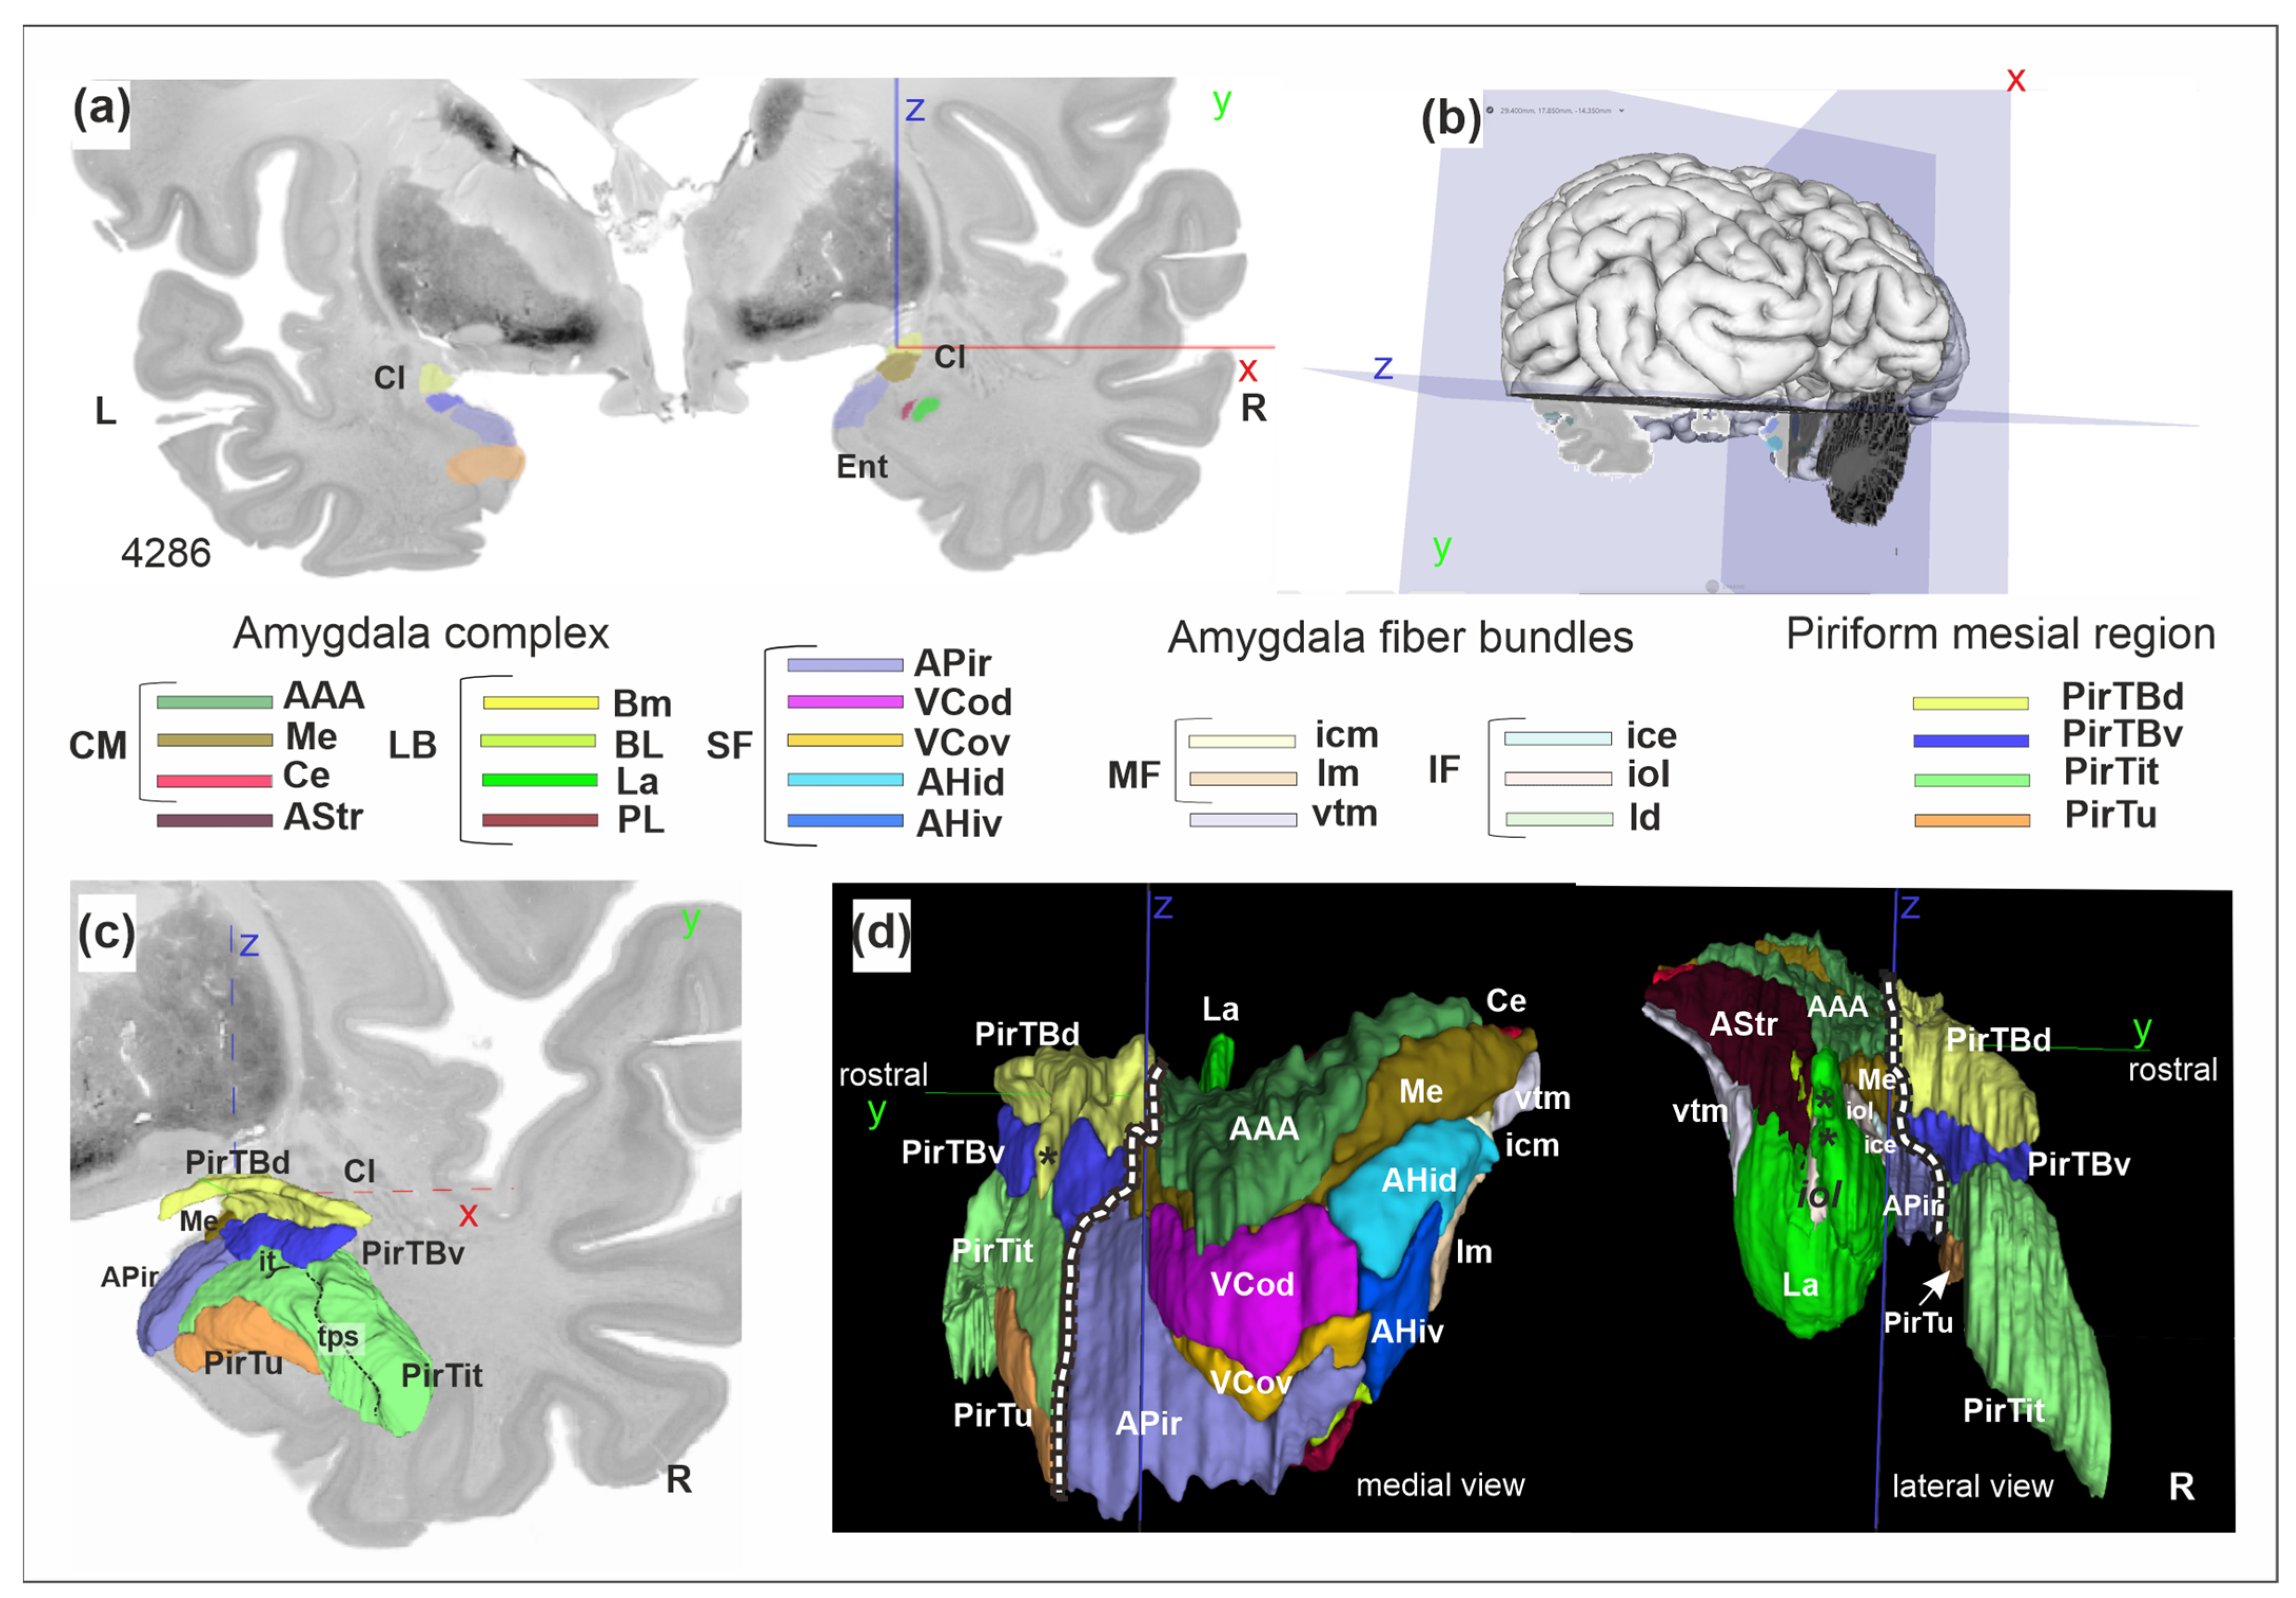
3.3. Relation to the Macroanatomical Landmarks

PirTB occupied both lips of the endorhinal sulcus (Figure 1 and Figure 2). Rostrally, it continued on the medial surface of the Limen insulae and on the basal brain surface. The rostral limit of PirTB was found on the basal brain surface in 13 hemispheres, or it was confined to the Limen insulae in the other 7 hemispheres. Rostrally, PirTB was represented by PirTBd in 12 hemispheres, by PirTBv in 4 hemispheres, and by both PirTB areas in another 4 hemispheres. The caudal limit of PirTB was represented by PirTBd in 11 hemispheres, by PirTBv in 3 hemispheres, and by both PirTB areas in another 6 hemispheres. In the caudal sections, PirTBd occupied the bottom of the endorhinal sulcus and laterally abuts the anterior perforated substance, while PirTBv was located on the temporal lobe surface. The PirTit area was located medioventrally to the Limen insulae, occupying either the dorsal temporopolar surface with the incipient Gyri of Schwalbe or the rostral ambient gyrus at this level (Figure 1 and Figure 6).
The rostral appearance of the Limen insulae has been an important macroanatomical landmark for the piriform allocortex in neuroimaging [64,65]. However, the current study revealed a more variable relationship of PirTBd and PirTBv in relation to the Limen insulae: only five right hemispheres and two left hemispheres showed both areas present at this level (Figure 6). Only PirTit (neither of the PirTB areas) was found in two right (Figure 6) and two left hemispheres. The other hemispheres showed either PirTBd or PirTBv at the level of the rostral Limen insulae. PirTBd and PirTBv extended beyond the rostral limit of the Limen insulae, in eight and six (out of 20) hemispheres, respectively. Thus, the rostral limit of the Limen insulae was not a reliable landmark for the rostral limit of the piriform allocortex, considering interindividual variability among the brains.
Table 2 summarizes the association of the piriform areas with the macroanatomical landmarks.

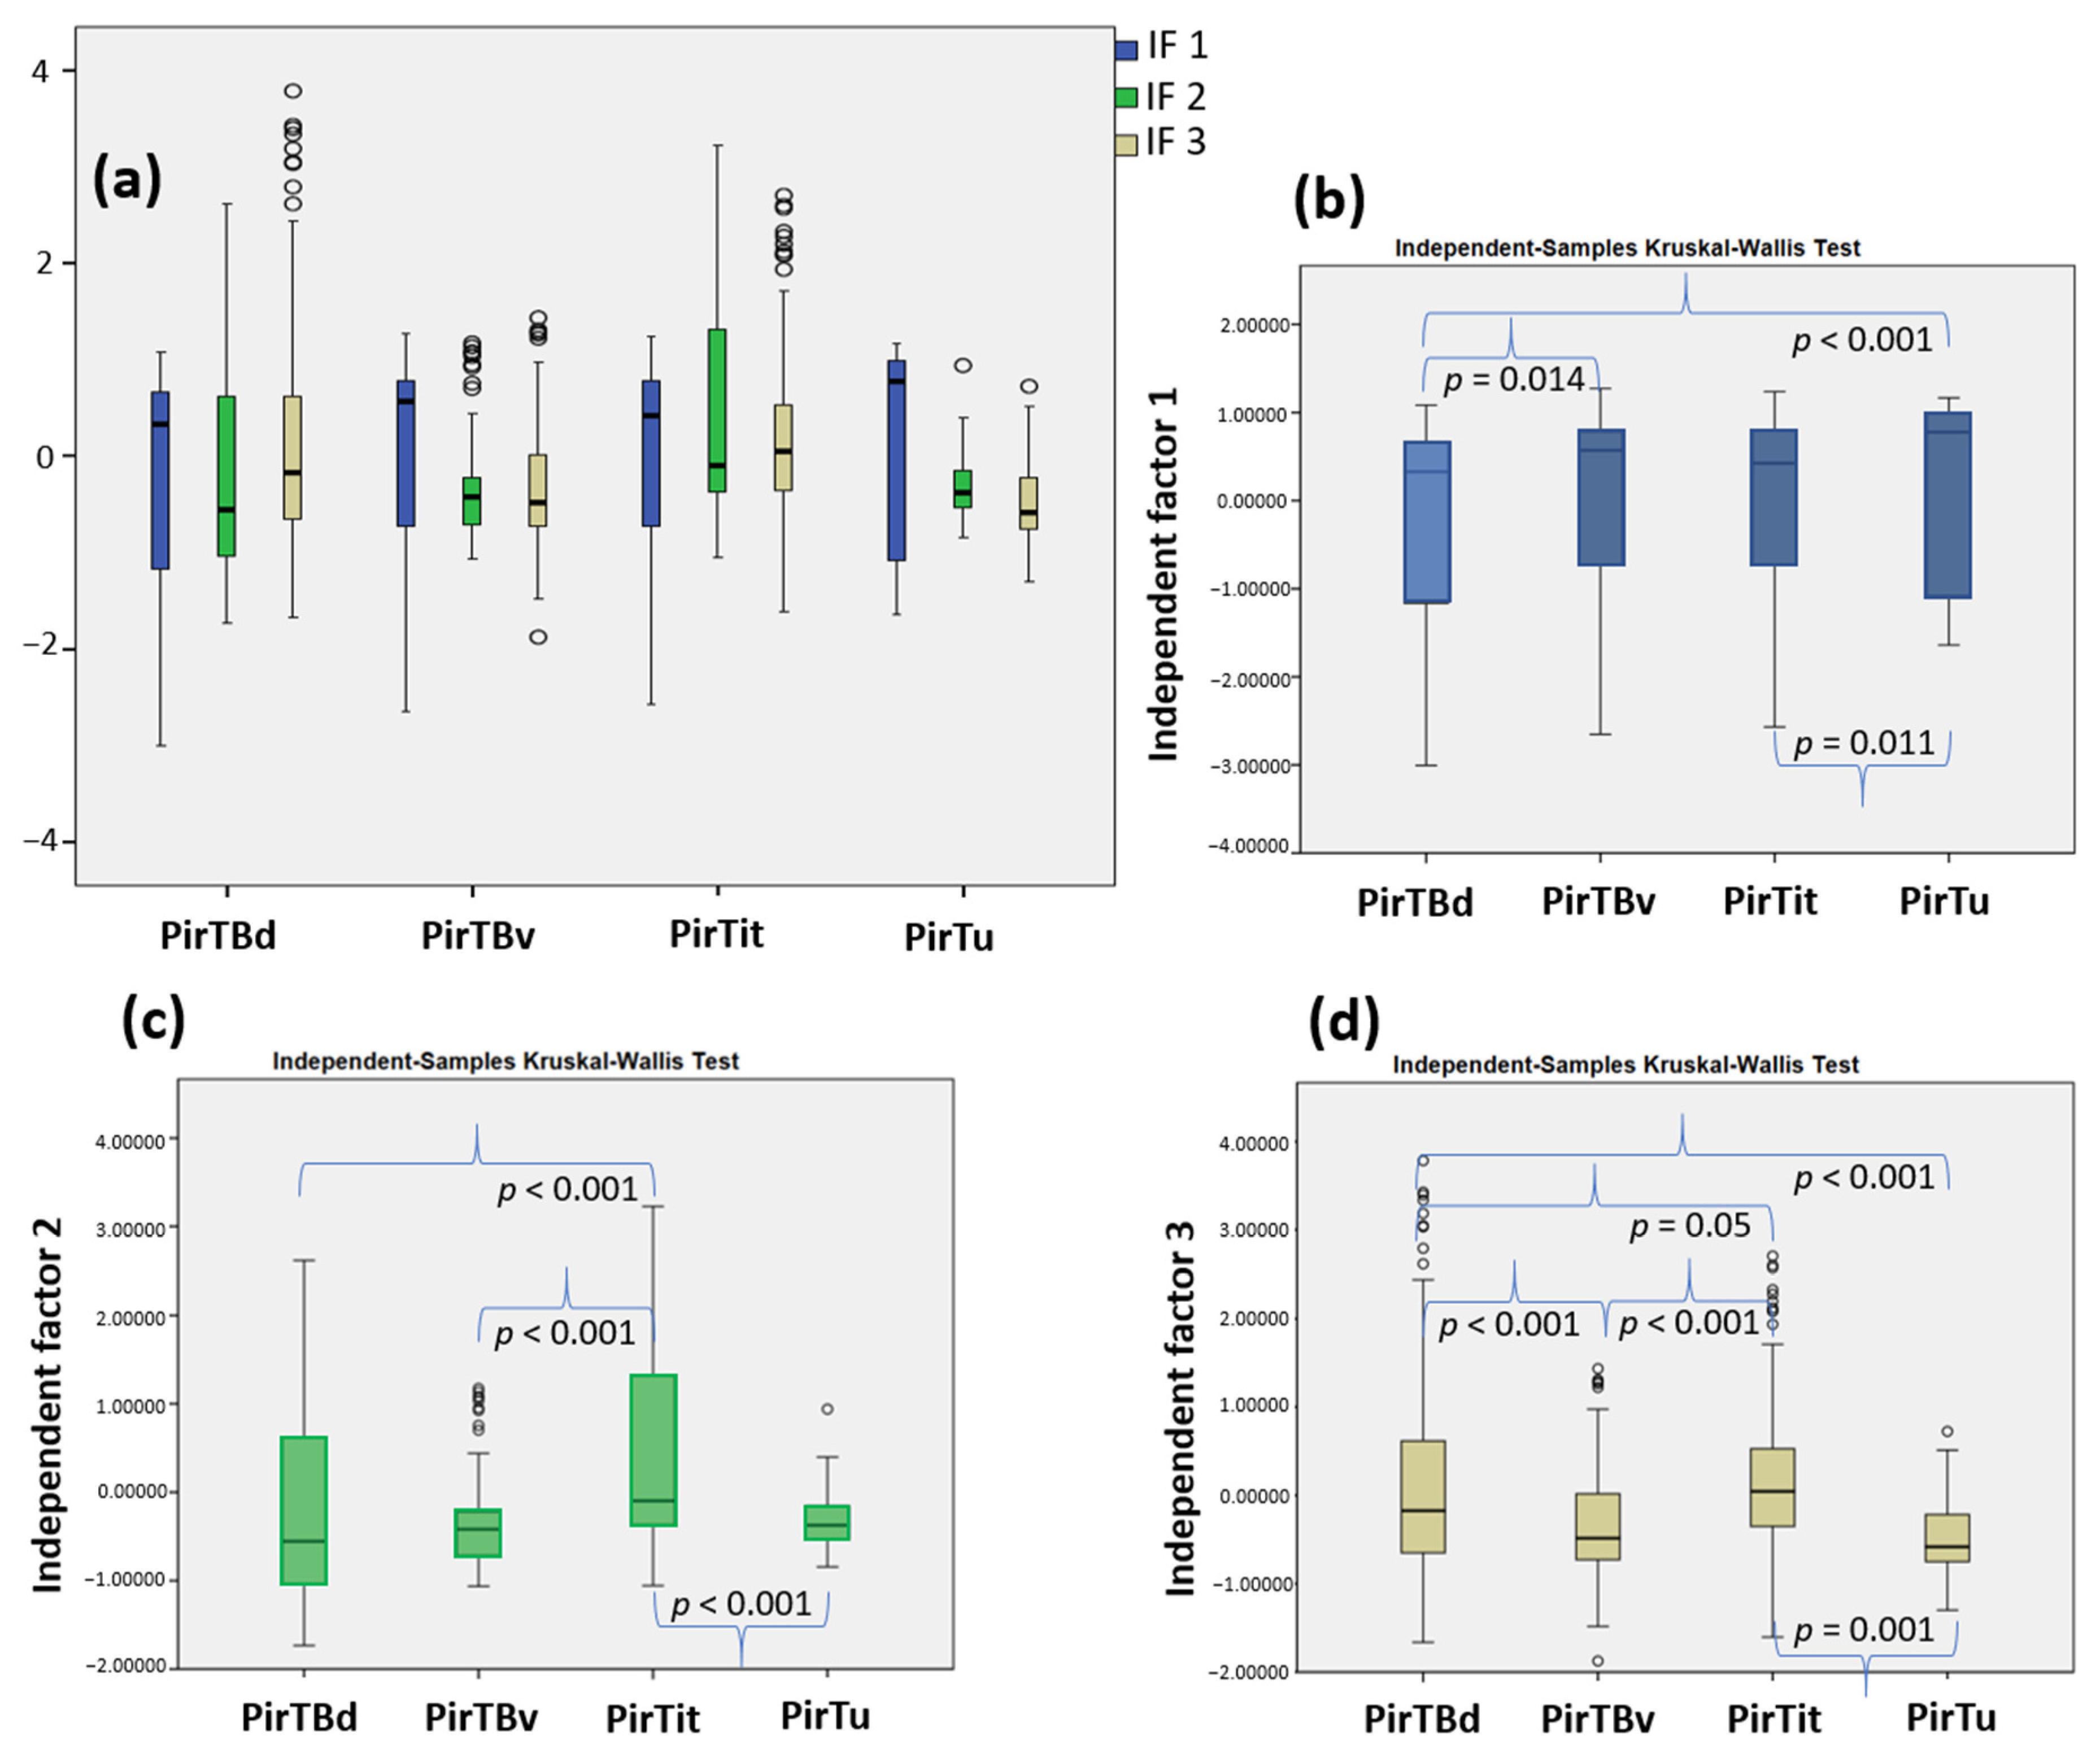
3.4. Texture Analysis

The “texture” of the areas in the high-resolution images was analyzed as an indicator of the cytoarchitecture using the Gray Level Co-occurrence Matrix (GLCM). This method quantifies the spatial relationships between adjacent pixel gray levels, offering a reproducible quantification that reflects the underlying cytoarchitecture of the brain areas studied. From this, GLCM 21 texture features were extracted, and their dimensionality was reduced using a Principal Component Analysis to three independent factors with eigenvalues larger than one.
These independent factors, IF1–IF3, characterize the piriform region with reduced dimensionality by keeping the information of the dataset. These three factors accounted for 90,65% of the total variance in the dataset. IF1 had the highest variance (54.44%), while IF3 explained the lowest variance (5.97%) (Table S1). Each area displayed a specific pattern of the different independent factors (Figure 7a), rejecting the null hypothesis in the Kruskal–Wallis test that distribution of the extracted independent factors is the same across all areas at a significance level of p < 0.05. Subsequent to this omnibus test, further pairwise post hoc tests, for each IF separately (Figure 7b–d), examined the distribution of the respective factor across all areas and rejected the null hypothesis that distribution of each IF was the same across all areas. The first factor (IF1) which greatly contributed to the variance of the dataset revealed distinctions across allocortical and periallocortical areas, i.e., PirTBd and PirTu (p < 0.001), between allocortical areas, i.e., PirTBd and PirTBv (p = 0.014), as well as between the periallocortical areas, PirTit and PirTu (p = 0.011). The second factor (IF2) revealed significant differences in distribution between PirTBd and PirTit (p < 0.001) and PirTBv and PirTit (p < 0.001), and similar to IF1, for the pair PirTit and PirTu (p < 0.001). The third factor demonstrated significant differences for all pairs, except for PirTu–PirTBv, for which the p value did not reach significance after Bonferroni correction for multiple tests.

3.5. Interindividual Variability in Volume

The periallocortical PirTit area was the largest in its volume, ranging from 215 mm3 in brain pm14 (left hemisphere) to 626 mm3 in brain pm7 (in the left hemisphere). The mean volume of PirTBv was slightly smaller than PirTBd (Table 3). In PirTBv, the volume ranged between 34 mm3 in brain pm13 in the right hemisphere, to 74 mm3 in brain pm4 in the left hemisphere, while in PirTBd the smallest volume was 32 mm3 in brain pm5 in the left hemisphere, and the maximal volume was 114 mm3 in brain pm4 in the right hemisphere. The volumes for each area were expressed in relation to the total brain volume (see Table 3). The permutation test indicated no significant interhemispheric difference in areas PirTBv, PirTit, and PirTu, while a rightward asymmetry was found for PirTBd (p < 0.05 not Bonferroni corrected for multiple tests). No significant difference was found between male and female brains, as well as for interaction between hemispheric and gender differences.

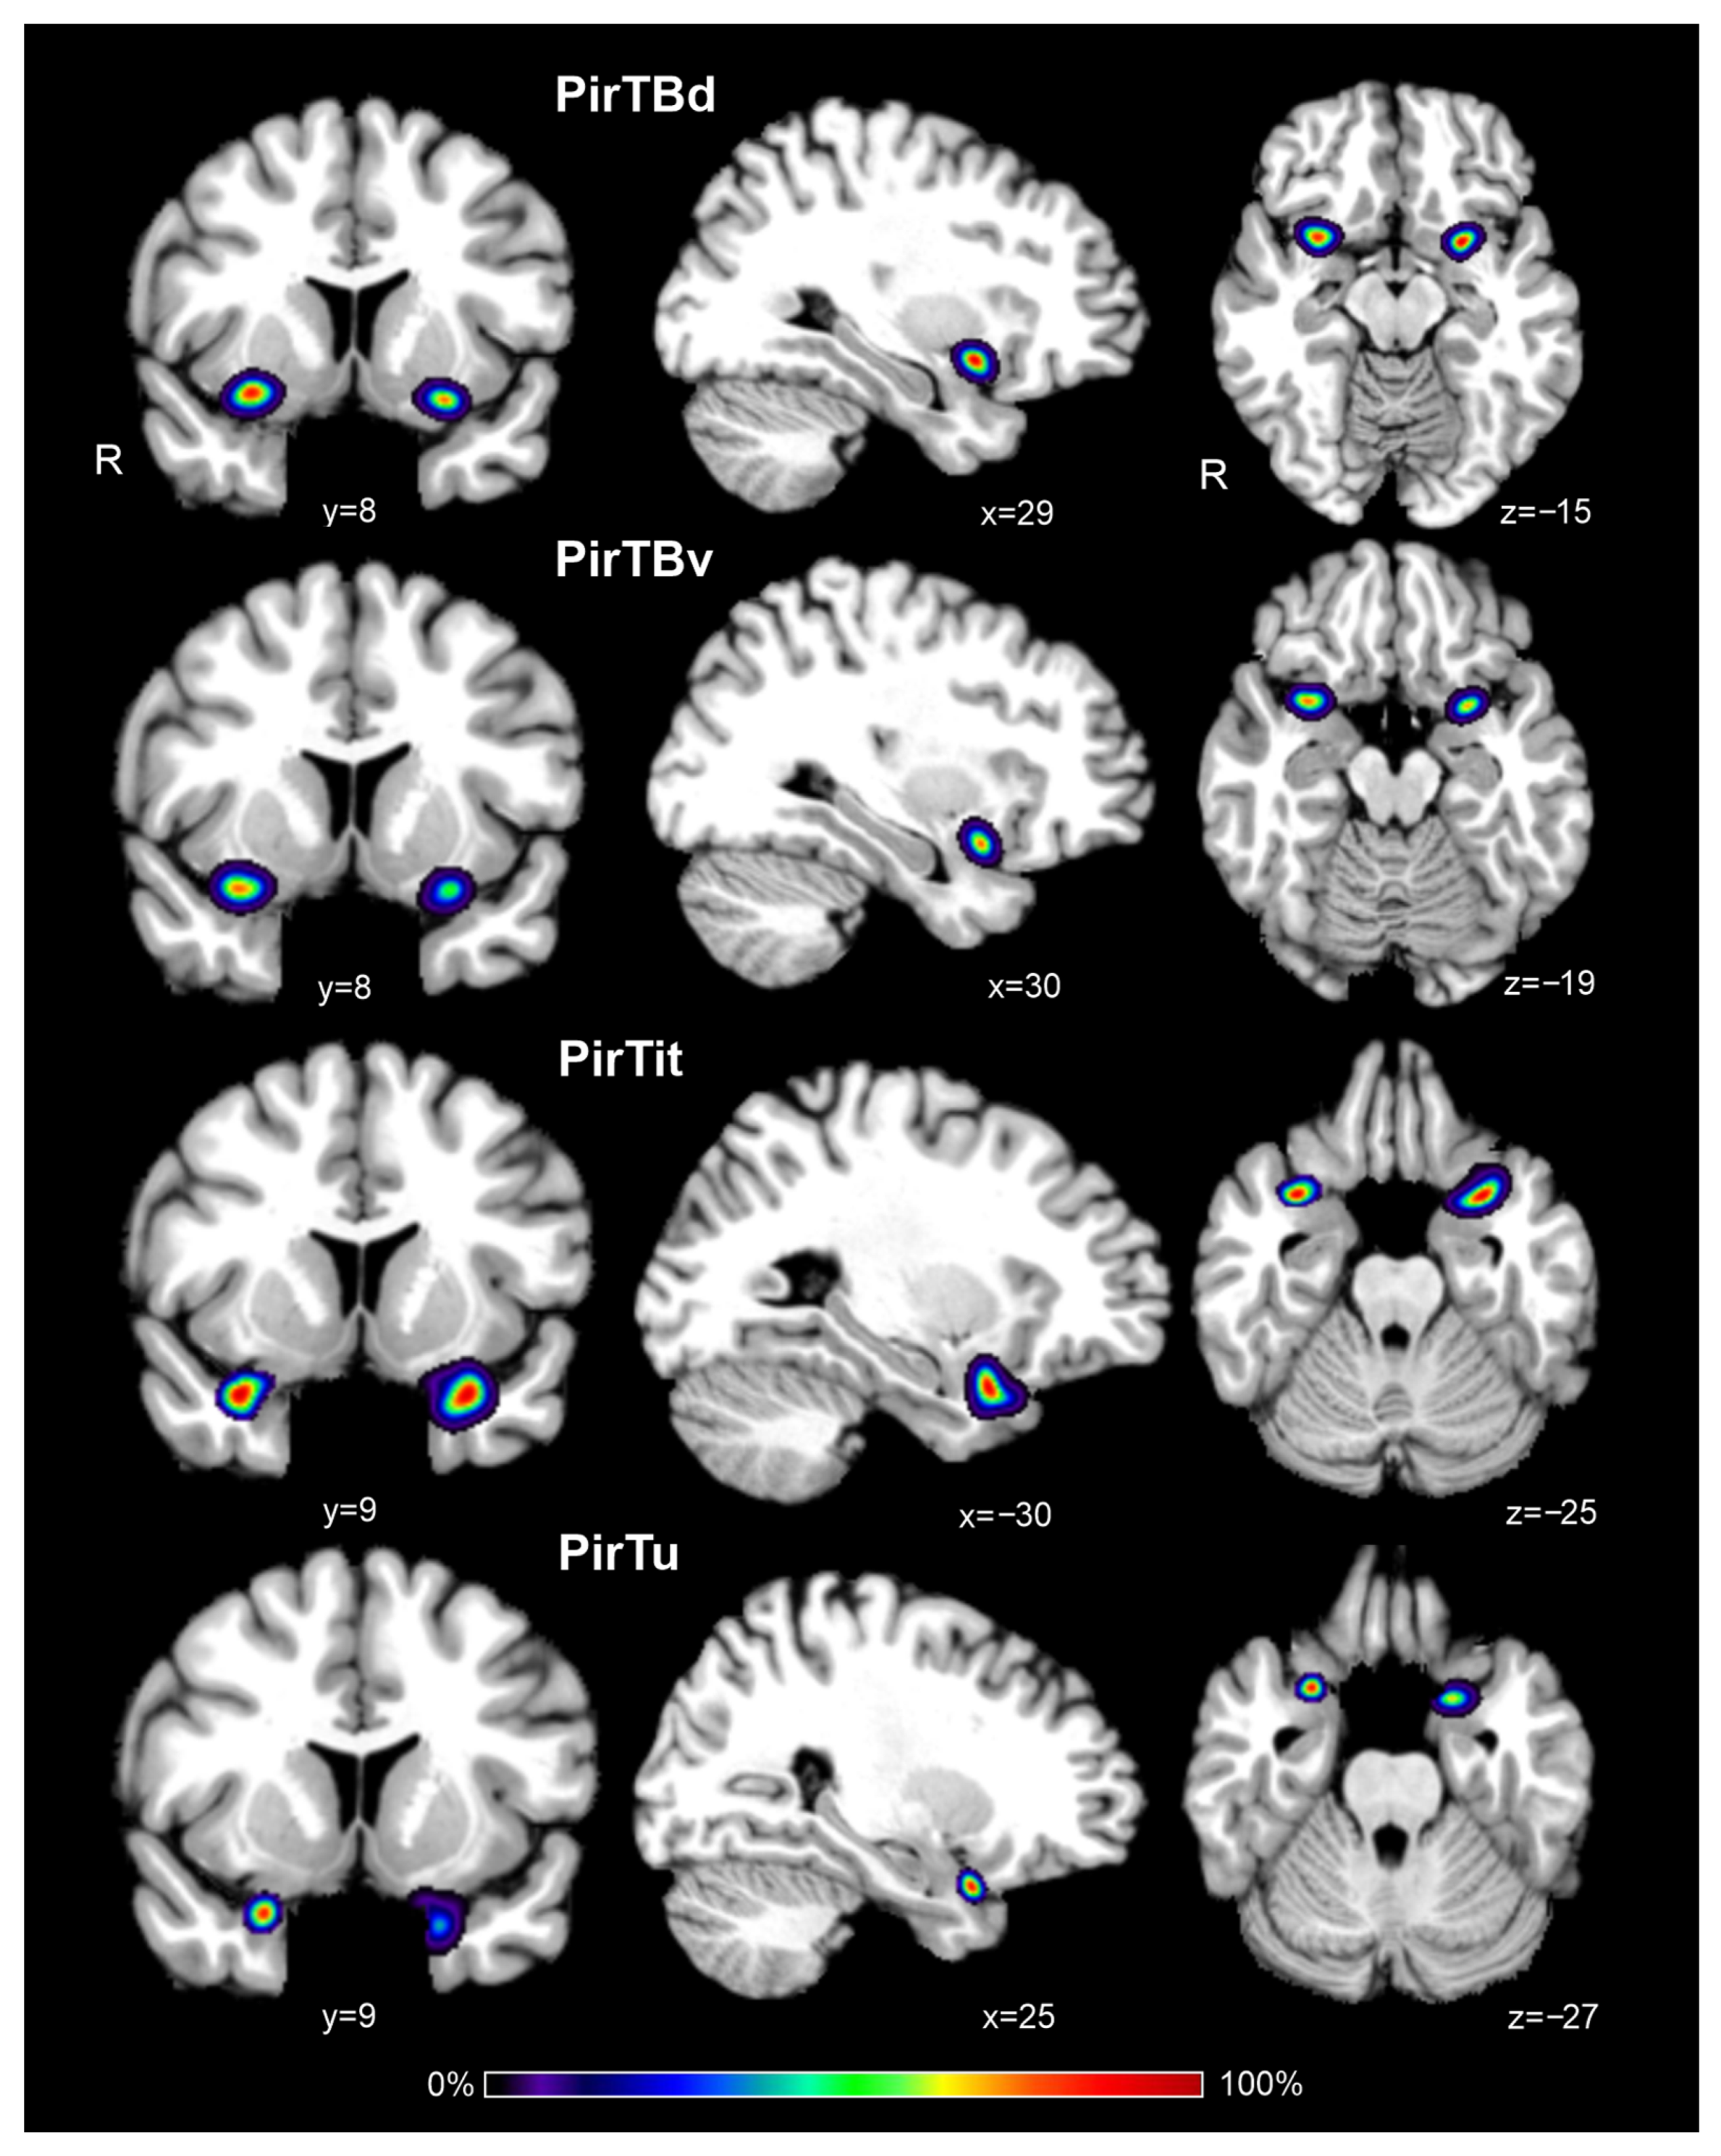
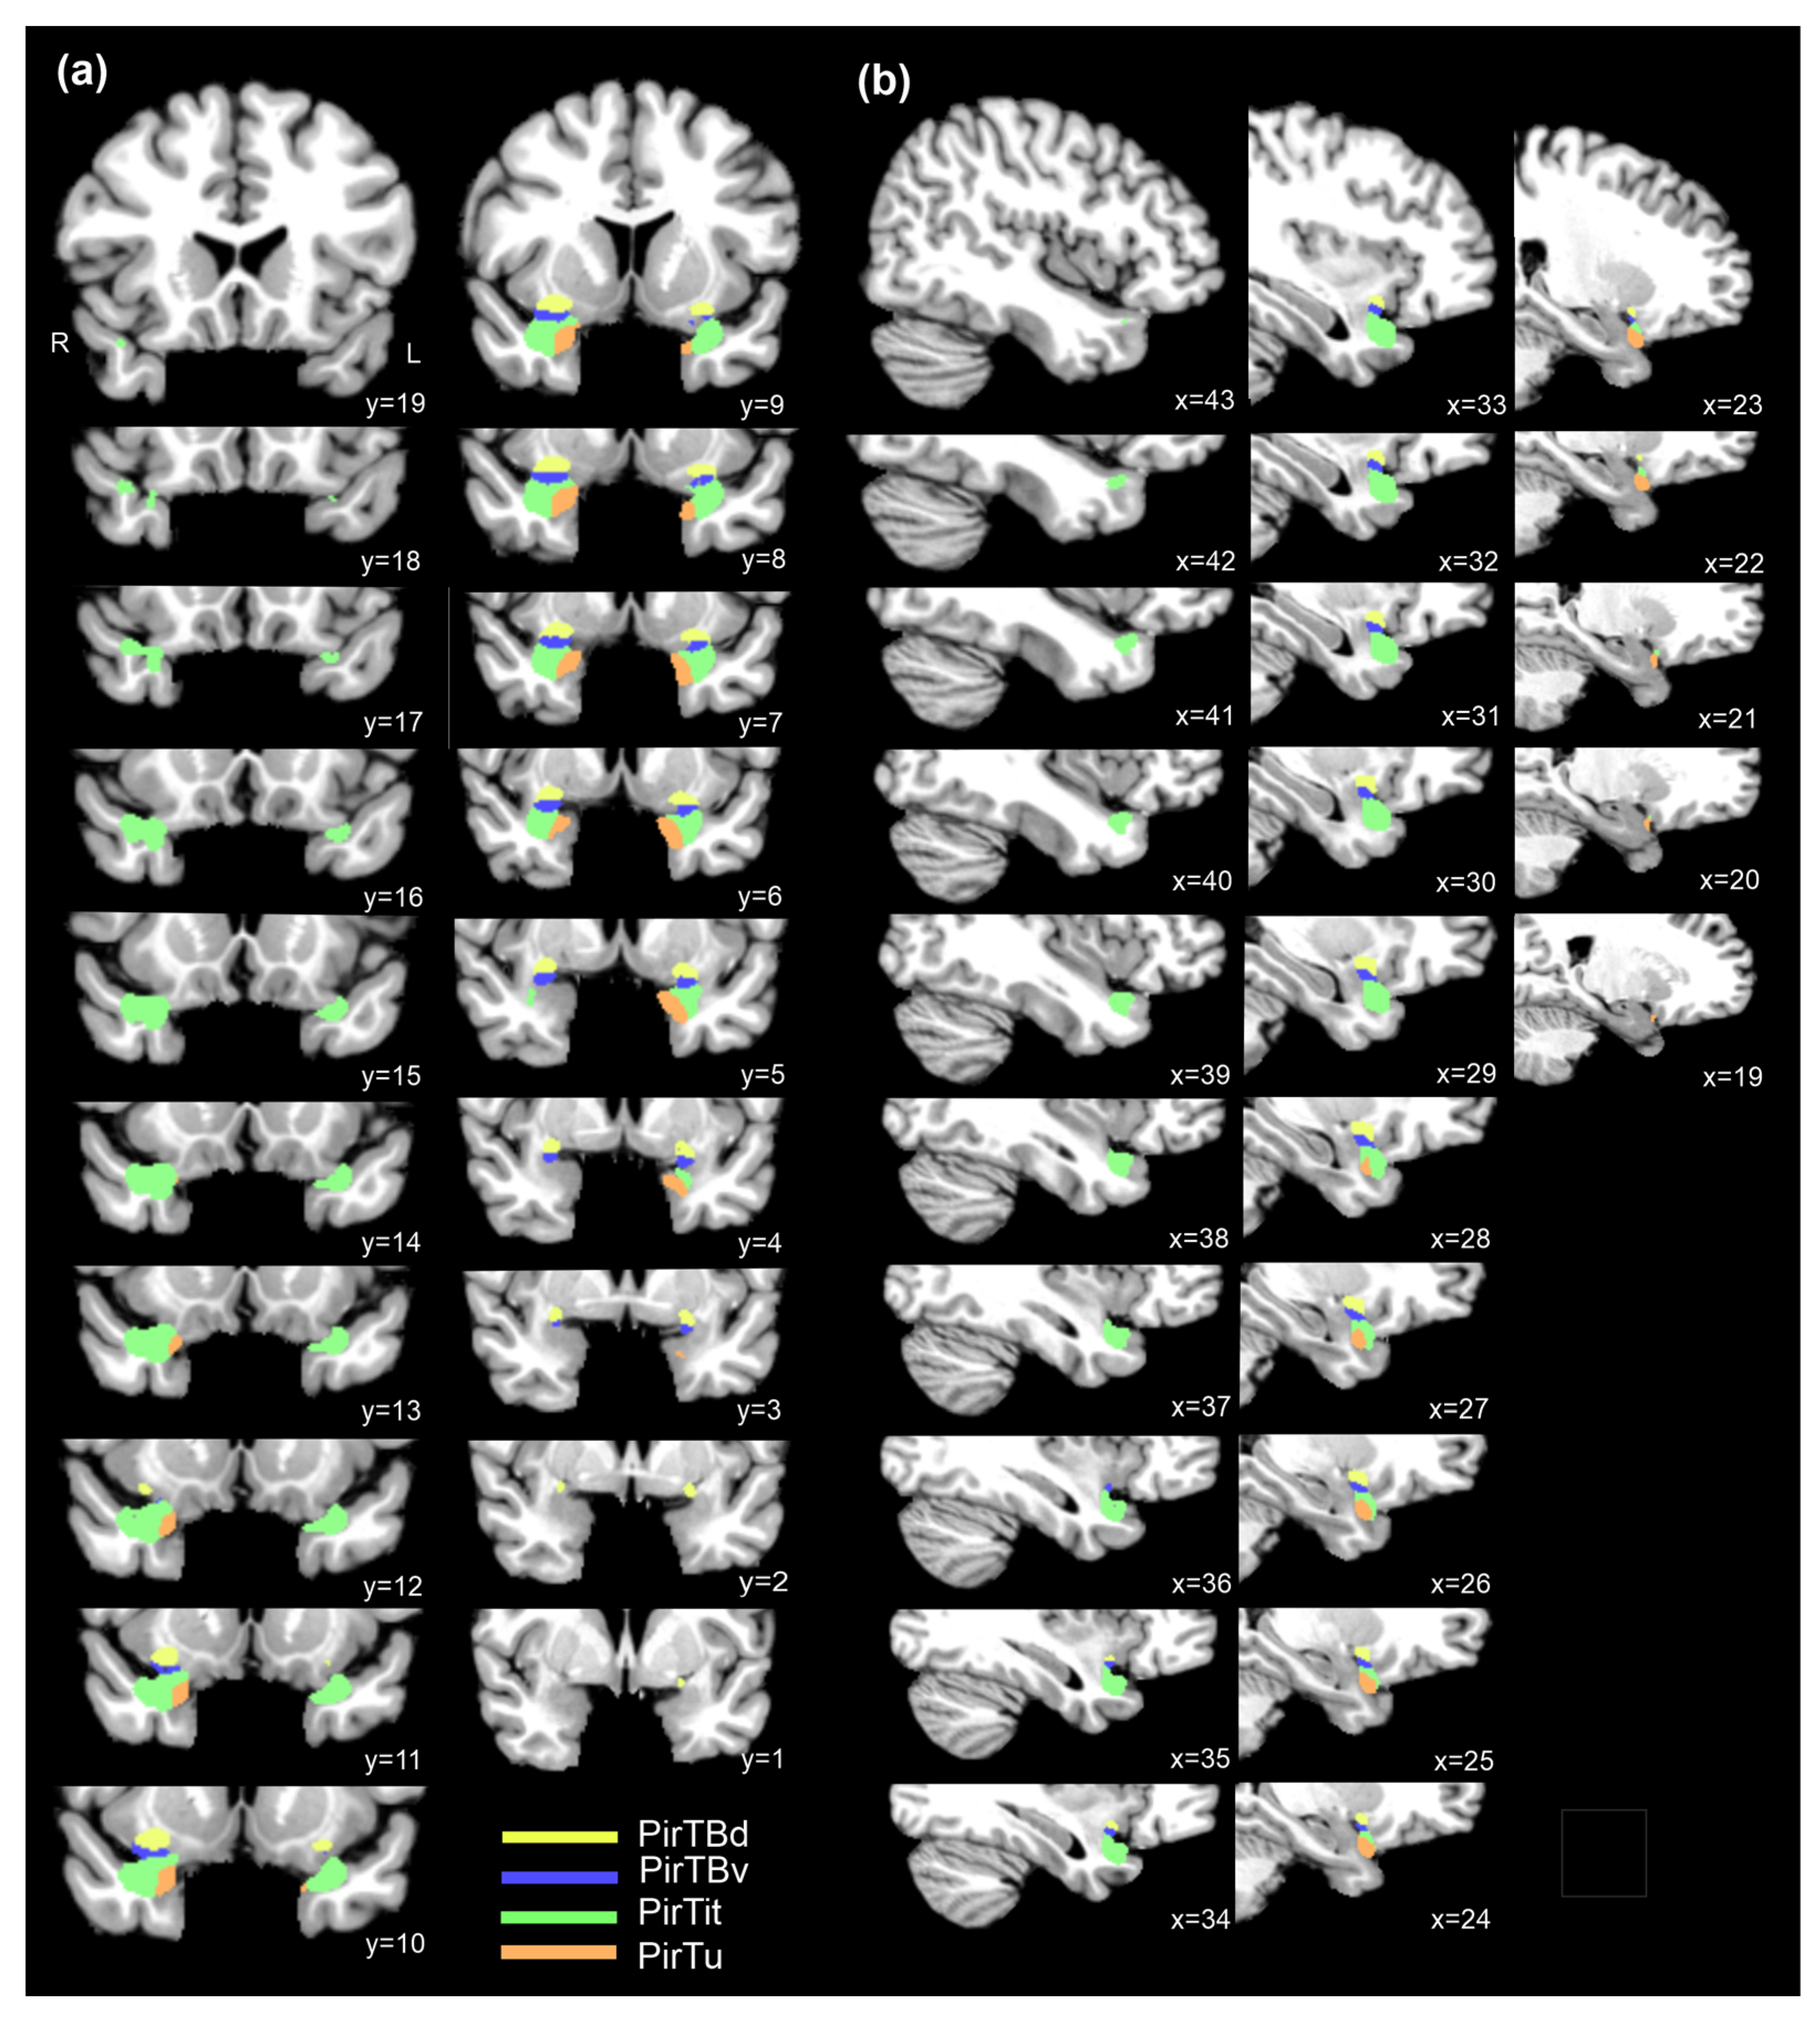
3.6. Interindividual Variability in Extent (Probabilistic Maps and Maximum Probability Maps)

Probabilistic maps of the piriform areas in their rostral and caudal extent revealed a higher degree of topographical variability than in their central position. The maps have a compact form (Figures S1–S4). PirTit had the center of mass at a more rostral position than the other areas, i.e., at the level of the temporal pole (just rostral to the disappearance of Limen insulae), which correspond to y = 9 (left hemisphere) and y = 10 (right hemisphere) in the Colin 27 template. The center of mass had a less-symmetric distribution for PirTu (y = 9 in the right hemisphere and y = 6 in the left hemisphere) and for PirTBv (y = 8 in the right hemisphere and y = 6 in the left hemisphere) (Figure 8). The centers of mass x- and z- coordinates are presented in the Table 4.
As the intersubject variability of the neighboring piriform areas leads to an overlap of the individual probability maps, we computed maximum probability map of the mesial piriform region (Figure 9), including each piriform area in a non-overlapping parcellation.

3.7. 3D Reconstruction in the BigBrain

In addition to the probabilistic maps of the piriform region and the amygdala [21], we generated ultrahigh-resolution maps with an isotropic resolution of 20 microns of the amygdala-piriform region in the BigBrain template to study the shape and neighborhood relationships of the areas. Starting from sparse mapping of the four areas of the mesial piriform region, as well as 13 subdivisions of the amygdala and six related fiber bundles, we reliably identified these areas in the unmapped sections in-between using Convolutional Neural Networks (Figure 10a,b). The amygdala part of the combined 3D map lies in the proximity of the hippocampus caudoventrally. The alveus of the hippocampus dorsally underlies the paralaminar nucleus and lateral nucleus of the caudal amygdala, while rostrally the white matter of the temporal lobe separates these structures from the entorhinal cortex (Figure 10a, right hemisphere). The claustrum dorsolaterally surrounds PirTB areas, medial nucleus of the amygdala and descends to flank the rostral amygdalopiriform transition area (Figure 10a,c). The claustrum also appears in vicinity of the rostral protrusions of the lateral nucleus (its dorsolateral part).
The 3D maps reveal the topographical relationships between the structures (Figures S5b,d, S6b and S7b), including neighboring fiber bundles (Figure 10d). PirTit and PirTu rostrally replace the amygdalopiriform transition area (APir) of the amygdala on the temporal brain surface, while PirTBv lies dorsally to both APir and PirTit. The dorsally located anterior amygdaloid area (AAA) abuts on PirTBd caudally. Both areas medially extend on the basal brain surface. The PirTit is shaped by the deep temporopolar sulcus in the right hemisphere (Figure 10c) but not in the left hemisphere. PirTBd shows a more pointed peak in the medial view (Figure S7) than AAA (Figure S5) in the right hemisphere (Figure 10d), as PirTBd extended along the basal brain surface in a limited number of sections in the central part of the area, while in the other sections it lies around the endorhinal sulcus. PirTit is the most rostral area (Figure 10c) and PirTBd is the most caudal area in the piriform region (Figure S7b). Left PirTit surrounds PirTu both dorsally and ventrally, while the right PirTu had only a dorsal border with PirTit.
The new map provides microscopic details regarding the shape of all subdivisions and related fiber bundles (Figures S5a,c, S6a and S7a). For example, the lateral nucleus reveals recesses in places of contact with granular parts of the paralaminar nucleus (Figure S5). APir has a complex shape which reflects inclusion of both the “posteromedial” and “anterolateral” part of de Olmos [66], so that the area caudally is related to the semiannular sulcus, while rostrally (i.e., after disappearance of the semilunar gyrus) extending laterally on the temporal lobe surface (see Figure 1 for the localization of APir in the other brain). In some cases, 3D surface maps reveal subtle step-like structures. These typically result from local inaccuracies in the 3D reconstruction of the BigBrain model when fusing the independently mapped 2D segmentations obtained from the deep learning workflow. The inaccuracies affect both the interpolation of missing sections and the overall quality of the reconstruction. This is particularly true in regard to the challenging transitions between areas, including “sudden” change in the structure size or extent in the manually delineated neighboring sections, e.g., for the right APir (Figure S6) between the small posteromedial and the more extensive anterolateral part.

4. Discussion

The current study provides an analysis and introduces stereotaxic maps of four areas, PirTBd, PirTBv, PirTu, and PirTit, of the mesial piriform region. The parcellations were verified by texture analysis. Cytoarchitectonic probabilistic maps in 3D space were proposed to support precise localization of findings from neuroimaging studies. The maps are part of the Julich-Brain atlas and are openly available on the EBRAINS platform (https://www.ebrains.eu/tools/human-brain-atlas, accessed on 27 March 2024). The probabilistic maps are available in two reference spaces, MNI Colin27 and MNI ICBM 152, to facilitate comparisons with in vivo imaging data. In addition, high-resolution (20 μm) whole-brain histological references of the amygdala-piriform region on the basis of the BigBrain were generated; they are publicly available on the EBRAINS platform as well. It is expected that these maps will inform studies about the role of the areas in different functions.
The piriform cortex and the hippocampus represent two hubs in the functional limbic system, with the allocortical core and the related periallocortical areas which represent a part of the so-called hippocampocentric and olfactocentric divisions [67], respectively. Probabilistic maps of both regions can be combined (as masks) to study networks related to the limbic system (e.g., by meta-analytic connectivity modelling).
The periallocortex gradually increases its structural complexity the farther it spreads from the allocortical core; in the hippocampal region, the presubiculum and parasubiculum closest to the allocortex have four layers, and a more distant entorhinal cortex is six-layered. The periallocortical PirTit represented a large area with inherent heterogeneity, being composed of a “temporal” (most allocortex-like) part, and a more distant “temporopolar” part.
The olfactory periallocortex of Filimonoff (1949), or his anterior transitional parts of the entorhinal region may reflect the correlative parts of the “temporal” PirTit (see Table 5): ventromedially located area entorhinalis transgrediens anterior periamygdalaris (eta0) and the adjacent area entorhinalis-praepiriformis (Pper), which reached, dorsally, the piriform allocortex. Both areas were characterized by an internal layer of large cells. The latter was described as having a narrow and compact external cellular layer and a cell-free layer (Lamina dissecans), while eta0 represented a rostral continuation of periamygdalar area. Further, rostrally, the entorhinalis transgrediens insularis (eti) [24] area, with its “light”, i.e., cell-sparse layer three, corresponded to “temporopolar” PirTit. Other studies associated PirTit with the periallocortical perirhinal cortex [42,68,69] (Table 5). The rostral limit of this area could not be precisely correlated with the earlier studies (e.g., of the area TI [44]), as, e.g., thicker sections (50 μm) and larger gaps between examined sections could not allow grasping of the border. In general, a large discrepancy in mappings of the piriform periallocortex is comparable to the other periallocortical regions (entorhinal and presubicular region, see comparisons in [65,70], composing hippocampocentric divisions [67]).
The results of the present study showing the interindividual variability in location of the piriform areas (e.g., in relation to the Limen insulae, the rostral and caudal limit of the piriform allocortex), indicate that the application of macroanatomical landmarks in the neuroimaging studies does not seem to be a reliable criterion to differentiate the anterior from the posterior piriform cortex [32,33,34]. The overall topography of PirTBd and PirTBv corresponds to that of the frontal (Pf) and temporal (Pt) piriform area of Stephan (1975), respectively (Table 4). In line with Stephan (1975) and other earlier histological studies [23,24,25], in four hemispheres, our PirTBv (correlate of the temporal piriform area) represented the most rostral limit of the piriform allocortex (PirTB). In 12 hemispheres, where PirTBd (a correlate of the frontal piriform area) extended more rostrally than the PirTBv, this difference in extent was negligible (only 0.3–1.2 mm) for MRI studies. As the functional studies relied on the atlas of Mai et al. (1997) [26], in which the frontal piriform area extended far, rostrally (where the later version of Mai et al. atlas (2016) [42] demonstrates the agranular insular cortex (OP_I)), the concept of the anterior-to-posterior differentiation within the piriform allocortex need to be re-evaluated using precise anatomical reference for the structural–functional comparison.
Macroanatomical landmarks have been proposed to identify the border of the piriform allocortex (i.e., olfactory tubercle, rostral limit of the Limen insulae). We could identify a medial border of PirTBd with the olfactory tubercle, as was depicted in the atlas of Mai et al. 2016 [42], though only in a limited number of sections. The current study revealed an interindividual variability of the piriform allocortex in relation to the rostral limit of the Limen insulae in contrast to protocols for mapping the PCA (piriform cortex and cortical amygdala) [69,73]. The absence of a clear landmark for the transition of the most caudal part of the Gyrus semiannularis (with AHi of the amygdala [21]) and the Gyrus uncinatus (with hippocampus, hippocampal-amygdaloid transition area (HATA)) [57,70] may lead to an overestimation of the PCA in the caudal part [69]. Moreover, they do not allow us to disentangle the piriform cortex and the amygdala, which are structurally and functionally different. Therefore, the maps of the amygdala and the piriform cortex offer a more precise localization and may inform the neuroimaging studies.
The volumes of the (peri)allocortical structures differ between the brains by factors two and three, which made the intersubject variability in volume comparable to that in the hippocampal region and is much lower than variability in the isocortex [57]. The allocortical piriform cortex had a very small volume, only slightly larger than the AHi of the superficial amygdala [21]. The periallocortical PirTit was comparable to the periallocortical presubiculum, whereas PirTu had slightly lower volume than the transsubiculum [70]. To our knowledge, this is the first volumetric data of the piriform region based on histological sections in such a sample. Stephan et al. (1981) reported the volume of Lobus piriformis (9032 mm3) measured in one individual [74], including the paleocortex (allocortex) of the anterior perforated substance with the olfactory tubercle, diagonal band, and the septum, as well as the amygdala. Therefore, no direct comparison is possible.
The probabilistic maps show a rather high overlap in the reference space that makes them an efficient tool in studying the structural correlates of olfactory processing in healthy subjects and patients. The maps of the piriform allocortex and amygdala can be relevant in studies of autism [75,76], Alzheimer’s disease [35,36,77,78] and Parkinson’s diseases [31,79,80,81,82], posttraumatic stress disorder [83], dysosmia [20,84,85,86], and epilepsy [13,41,87,88,89,90,91]. They can help to decipher a specific or shared role of the piriform periallocortex in aspects of olfactory processing, e.g., matching the odor with a suitable linguistic label [19]. Additionally, the probabilistic maps of the amygdala can help to re-examine the suggested functional roles of the so-called olfactory amygdala, as well as the involvement in olfactory functions of the remaining amygdala.
The high-resolution BigBrain maps of the amygdala-piriform region show the precise localization and extent of the areas in an individual brain. They are interoperable with any reference space used in the neuroimaging community, e.g., to MNI 152 and Colin 27 over siibra-explorer [92], and can serve as histological reference data for high-resolution MR imaging, as well as the basis for brain simulation and data integration, e.g., in epilepsy research, by targeting epileptogenic networks, including the piriform cortex [93] and amygdala [94].

5. Conclusions

The present study introduces openly available 3D maps of the human piriform allocortex and periallocortex. Along with the previously published maps of the amygdala [21] and the hippocampus [70], the new maps can be used as microstructural references for neuroimaging studies, e.g., on olfactory processing, for studying networks, or for informing modeling and simulation. The maps may also have clinical applications in the future, e.g., for neuroradiology.

Supplementary Materials

The following supporting information can be downloaded at: https://www.mdpi.com/article/10.3390/anatomia3020007/s1. Figure S1: Probabilistic map of PirTBd throughout its rostro-caudal extent in the MNI Colin 27 reference space; Figure S2: Probabilistic map of PirTBv its rostro-caudal extent in of the MNI Colin 27 reference space; Figure S3: Probabilistic map of PirTu throughout its rostro-caudal extent of the MNI Colin 27 reference space; Figure S4: Probabilistic map of PirTit throughout its rostro-caudal extent in of the MNI Colin 27 reference space; Figure S5: 3D reconstructions of the amygdala in the BigBrain in both hemispheres; Figure S6: 3D reconstructions of the amygdala in the BigBrain in both hemispheres; Figure S7: 3D reconstructions of the mesial piriform cortex in the BigBrain in both hemispheres; Table S1: The Initial Eigenvalues and Extraction Sums for first three factors (IF1-IF3) out of 21 at the initial point of analysis; Table S2: Relation of modified Haralick’s features to first three factors derived in PCA; Datasets: Probabilistic maps (datasets); Piriform cortex; Amygdala; BigBrain Datasets (mesial piriform region); BigBrain Datasets (amygdala).

Author Contributions

Conceptualization, K.A. and O.K.; methodology, S.B., H.M. and C.S.; software, H.M., S.B. and C.S.; validation, S.B., H.M. and K.A.; formal analysis, S.B. and C.S.; investigation, O.K.; resources, K.A. and T.D.; data curation, O.K. and K.A.; writing—original draft preparation, O.K.; writing—review and editing, K.A., C.S. and T.D.; visualization, H.M. and C.S.; supervision, K.A.; project administration, K.A.; funding acquisition, K.A. and T.D. All authors have read and agreed to the published version of the manuscript.

Funding

This research was funded by the European Union’s Horizon 2020 Research and Innovation Programme, grant agreement 945539 (HBP SGA3), by the European Union’s Horizon Europe Programme under the Specific Grant Agreement No. 101147319 (EBRAINS 2.0 Project), and by Helmholz Association’s Initiative and Networking Fund through the Helmholz International BigBrain Analytics and Learning Laboratory (HIBALL) under the Helmholz International Lab grant agreement InterLabs-0015.

Institutional Review Board Statement

The study was conducted in accordance with the Declaration of Helsinki and approved by the Institutional Review Board (or Ethics Committee) of Heinrich-Heine University of Düsseldorf (protocol code #4863, 5 November 2014).

Informed Consent Statement

Informed consent was obtained by the Anatomical Institute I of the University of Düsseldorf from all subjects who became body donors.

Data Availability Statement

The datasets generated in this study, as well as those supporting reported results (i.e., probability maps of the amygdala previously published), can be found on the EBRAINS online platform (for the names of the datasets and the respective links, see Supplementary Materials).

Conflicts of Interest

The authors declare no conflicts of interest.

References

  1. Marin, C.; Vilas, D.; Langdon, C.; Alobid, I.; López-Chacón, M.; Haehner, A.; Hummel, T.; Mullol, J. Olfactory Dysfunction in Neurodegenerative Diseases. Curr. Allergy Asthma Rep. 2018, 18, 42. [Google Scholar] [CrossRef] [PubMed]
  2. Ubeda-Bañon, I.; Saiz-Sanchez, D.; Flores-Cuadrado, A.; Rioja-Corroto, E.; Gonzalez-Rodriguez, M.; Villar-Conde, S.; Astillero-Lopez, V.; Cabello-de la Rosa, J.P.; Gallardo-Alcañiz, M.J.; Vaamonde-Gamo, J.; et al. The human olfactory system in two proteinopathies: Alzheimer’s and Parkinson’s diseases. Transl. Neurodegener. 2020, 9, 22. [Google Scholar] [CrossRef] [PubMed]
  3. Leon, M.; Woo, C.C. Olfactory loss is a predisposing factor for depression, while olfactory enrichment is an effective treatment for depression. Front. Neurosci. 2022, 16, 1013363. [Google Scholar] [CrossRef] [PubMed]
  4. Sakamoto, N.; Pearson, J.; Shinoda, K.; Alheid, G.F.; de Olmos, J.S.; Heimer, L. The human basal forebrain. Part I. an overview. In Handbook of Chemical Neuroanatomy; Bloom, F.E., Björklund, A., Hökfelt, T., Eds.; Volume 15: The Primate Nervous System, Part III; Elsevier: Amsterdam, The Netherlands, 1999; pp. 1–56. [Google Scholar]
  5. Noto, T.; Zhou, G.; Yang, Q.; Lane, G.; Zelano, C. Human Primary Olfactory Amygdala Subregions Form Distinct Functional Networks, Suggesting Distinct Olfactory Functions. Front. Syst. Neurosci. 2021, 15, 752320. [Google Scholar] [CrossRef]
  6. Gottfried, J.A. Central mechanisms of odour object perception. Nat. Rev. Neurosci. 2010, 11, 628–641. [Google Scholar] [CrossRef] [PubMed]
  7. Bensafi, M. The Role of the Piriform Cortex in Human Olfactory Perception: Insights from Functional Neuroimaging Studies. Chemosens. Percept. 2012, 5, 4–10. [Google Scholar] [CrossRef]
  8. Sobel, N.; Prabhakaran, V.; Desmond, J.E.; Glover, G.H.; Goode, R.L.; Sullivan, E.V.; Gabrieli, J.D. Sniffing and smelling: Separate subsystems in the human olfactory cortex. Nature 1998, 392, 282–286. [Google Scholar] [CrossRef]
  9. Royet, J.P.; Plailly, J.; Delon-Martin, C.; Kareken, D.A.; Segebarth, C. fMRI of emotional responses to odors: Influence of hedonic valence and judgment, handedness, and gender. Neuroimage 2003, 20, 713–728. [Google Scholar] [CrossRef]
  10. Plailly, J.; Bensafi, M.; Pachot-Clouard, M.; Delon-Martin, C.; Kareken, D.A.; Rouby, C.; Segebarth, C.; Royet, J.P. Involvement of right piriform cortex in olfactory familiarity judgments. Neuroimage 2005, 24, 1032–1041. [Google Scholar] [CrossRef]
  11. Dade, L.A.; Zatorre, R.J.; Jones-Gotman, M. Olfactory learning: Convergent findings from lesion and brain imaging studies in humans. Brain 2002, 125, 86–101. [Google Scholar] [CrossRef]
  12. Buchanan, T.W.; Tranel, D.; Adolphs, R. A specific role for the human amygdala in olfactory memory. Learn. Mem. 2003, 10, 319–325. [Google Scholar] [CrossRef] [PubMed]
  13. Hudry, J.; Perrin, F.; Ryvlin, P.; Mauguière, F.; Royet, J.P. Olfactory short-term memory and related amygdala recordings in patients with temporal lobe epilepsy. Brain 2003, 126, 1851–1863. [Google Scholar] [CrossRef] [PubMed]
  14. Nigri, A.; Ferraro, S.; D’Incerti, L.; Critchley, H.D.; Bruzzone, M.G.; Minati, L. Connectivity of the amygdala, piriform, and orbitofrontal cortex during olfactory stimulation: A functional MRI study. Neuroreport 2013, 24, 171–175. [Google Scholar] [CrossRef] [PubMed]
  15. Bzdok, D.; Laird, A.R.; Zilles, K.; Fox, P.T.; Eickhoff, S.B. An investigation of the structural, connectional, and functional subspecialization in the human amygdala. Hum. Brain Mapp. 2013, 34, 3247–3266. [Google Scholar] [CrossRef] [PubMed]
  16. Hudry, J.; Ryvlin, P.; Royet, J.P.; Mauguière, F. Odorants elicit evoked potentials in the human amygdala. Cereb. Cortex 2001, 11, 619–627. [Google Scholar] [CrossRef] [PubMed]
  17. Zald, D.H.; Pardo, J.V. Emotion, olfaction, and the human amygdala: Amygdala activation during aversive olfactory stimulation. Proc. Natl. Acad. Sci. USA 1997, 94, 4119–4124. [Google Scholar] [CrossRef] [PubMed]
  18. Anderson, A.K.; Christoff, K.; Stappen, I.; Panitz, D.; Ghahremani, D.G.; Glover, G.; Gabrieli, J.D.; Sobel, N. Dissociated neural representations of intensity and valence in human olfaction. Nat. Neurosci. 2003, 6, 196–202. [Google Scholar] [CrossRef]
  19. Olofsson, J.K.; Rogalski, E.; Harrison, T.; Mesulam, M.M.; Gottfried, J.A. A cortical pathway to olfactory naming: Evidence from primary progressive aphasia. Brain 2013, 136, 1245–1259. [Google Scholar] [CrossRef]
  20. Yao, L.; Pinto, J.M.; Yi, X.; Li, L.; Peng, P.; Wei, Y. Gray matter volume reduction of olfactory cortices in patients with idiopathic olfactory loss. Chem. Senses 2014, 39, 755–760. [Google Scholar] [CrossRef]
  21. Kedo, O.; Zilles, K.; Palomero-Gallagher, N.; Schleicher, A.; Mohlberg, H.; Bludau, S.; Amunts, K. Receptor-driven, multimodal mapping of the human amygdala. Brain Struct. Funct. 2018, 223, 1637–1666. [Google Scholar] [CrossRef]
  22. von Economo, C.F.; Koskinas, G.N. Die Cytoarchitektonik der Hirnrinde des Erwachsenen Menschen; Springer: Berlin/Heidelberg, Germany, 1925. [Google Scholar]
  23. Brockhaus, H. Die Cyto- und Myeloarchitektonik des Cortex claustralis und des Claustrum beim Menschen. J. Psychol. Neurol. 1940, 49, 249–348. [Google Scholar]
  24. Filimonoff, I.N. Paleocortex, allocortex and cortex intermedius. In Cytoarchitecture of the Human Cortex Cerebri; Sarkiov, S.A., Filimonoff, I.N., Preobrazhenskaya, N.S., Eds.; Medgiz: Moscow, Russia, 1949; pp. 402–433. (In Russian) [Google Scholar]
  25. Stephan, H. Regio praepiriformis. In Allocortex; Springer: Berlin/Heidelberg, Germany, 1975; pp. 427–464. [Google Scholar]
  26. Mai, J.K.; Assheuer, J.; Paxinos, G. Atlas of the Human Brain; Thieme: New York, NY, USA, 1997. [Google Scholar]
  27. Zelano, C.; Bensafi, M.; Porter, J.; Mainland, J.; Johnson, B.; Bremner, E.; Telles, C.; Khan, R.; Sobel, N. Attentional modulation in human primary olfactory cortex. Nat. Neurosci. 2005, 8, 114–120. [Google Scholar] [CrossRef] [PubMed]
  28. Porter, J.; Anand, T.; Johnson, B.; Khan, R.M.; Sobel, N. Brain mechanisms for extracting spatial information from smell. Neuron 2005, 47, 581–592. [Google Scholar] [CrossRef] [PubMed]
  29. Zelano, C.; Montag, J.; Johnson, B.; Khan, R.; Sobel, N. Dissociated representations of irritation and valence in human primary olfactory cortex. J. Neurophysiol. 2007, 97, 1969–1976. [Google Scholar] [CrossRef] [PubMed]
  30. Zelano, C.; Montag, J.; Khan, R.; Sobel, N. A specialized odor memory buffer in primary olfactory cortex. PLoS ONE 2009, 4, e4965. [Google Scholar] [CrossRef] [PubMed]
  31. Silveira-Moriyama, L.; Holton, J.L.; Kingsbury, A.; Ayling, H.; Petrie, A.; Sterlacci, W.; Poewe, W.; Maier, H.; Lees, A.J.; Revesz, T. Regional differences in the severity of Lewy body pathology across the olfactory cortex. Neurosci. Lett. 2009, 453, 77–80. [Google Scholar] [CrossRef] [PubMed]
  32. Gottfried, J.A.; Deichmann, R.; Winston, J.S.; Dolan, R.J. Functional heterogeneity in human olfactory cortex: An event-related functional magnetic resonance imaging study. J. Neurosci. 2002, 22, 10819–10828. [Google Scholar] [CrossRef] [PubMed]
  33. Gottfried, J.A.; Winston, J.S.; Dolan, R.J. Dissociable codes of odor quality and odorant structure in human piriform cortex. Neuron 2006, 49, 467–479. [Google Scholar] [CrossRef]
  34. Li, W.; Luxenberg, E.; Parrish, T.; Gottfried, J.A. Learning to smell the roses: Experience-dependent neural plasticity in human piriform and orbitofrontal cortices. Neuron 2006, 52, 1097–1108. [Google Scholar] [CrossRef]
  35. Kjelvik, G.; Evensmoen, H.R.; Hummel, T.; Engedal, K.; Selbæk, G.; Saltvedt, I.; Håberg, A.K. The Human Brain Representation of Odor Identification in Amnestic Mild Cognitive Impairment and Alzheimer’s Dementia of Mild Degree. Front. Neurol. 2020, 11, 607566. [Google Scholar] [CrossRef]
  36. Li, W.; Howard, J.D.; Gottfried, J.A. Disruption of odour quality coding in piriform cortex mediates olfactory deficits in Alzheimer’s disease. Brain 2010, 133, 2714–2726. [Google Scholar] [CrossRef] [PubMed]
  37. Löscher, W.; Ebert, U. The role of the piriform cortex in kindling. Prog. Neurobiol. 1996, 50, 427–481. [Google Scholar] [CrossRef] [PubMed]
  38. Haberly, L.B. Parallel-distributed processing in olfactory cortex: New insights from morphological and physiological analysis of neuronal circuitry. Chem. Senses 2001, 26, 551–576. [Google Scholar] [CrossRef] [PubMed]
  39. Litaudon, P.; Amat, C.; Bertrand, B.; Vigouroux, M.; Buonviso, N. Piriform cortex functional heterogeneity revealed by cellular responses to odours. Eur. J. Neurosci. 2003, 17, 2457–2461. [Google Scholar] [CrossRef] [PubMed]
  40. Carmichael, S.T.; Clugnet, M.C.; Price, J.L. Central olfactory connections in the macaque monkey. J. Comp. Neurol. 1994, 346, 403–434. [Google Scholar] [CrossRef] [PubMed]
  41. Vaughan, D.N.; Jackson, G.D. The piriform cortex and human focal epilepsy. Front. Neurol. 2014, 5, 259. [Google Scholar] [CrossRef] [PubMed]
  42. Mai, J.K.; Majtanik, M.; Paxinos, G. Atlas of the Human Brain, 4th ed.; Academic Press: Cantabrigian, MA, USA, 2016. [Google Scholar]
  43. Ding, S.L.; Royall, J.J.; Sunkin, S.M.; Ng, L.; Facer, B.A.; Lesnar, P.; Guillozet-Bongaarts, A.; McMurray, B.; Szafer, A.; Dolbeare, T.A.; et al. Comprehensive cellular-resolution atlas of the adult human brain. J. Comp. Neurol. 2016, 524, 3127–3481. [Google Scholar] [CrossRef]
  44. Ding, S.L.; Van Hoesen, G.W.; Cassell, M.D.; Poremba, A. Parcellation of human temporal polar cortex: A combined analysis of multiple cytoarchitectonic, chemoarchitectonic, and pathological markers. J. Comp. Neurol. 2009, 514, 595–623. [Google Scholar] [CrossRef] [PubMed]
  45. Amunts, K.; Lepage, C.; Borgeat, L.; Mohlberg, H.; Dickscheid, T.; Rousseau, M.É.; Bludau, S.; Bazin, P.L.; Lewis, L.B.; Oros-Peusquens, A.M.; et al. BigBrain: An ultrahigh-resolution 3D human brain model. Science 2013, 340, 1472–1475. [Google Scholar] [CrossRef]
  46. Merker, B. Silver staining of cell bodies by means of physical development. J. Neurosci. Methods 1983, 9, 235–241. [Google Scholar] [CrossRef]
  47. Amunts, K.; Mohlberg, H.; Bludau, S.; Zilles, K. Julich-Brain: A 3D probabilistic atlas of the human brain’s cytoarchitecture. Science 2020, 369, 988–992. [Google Scholar] [CrossRef] [PubMed]
  48. Stephan, H. Regio peripalaeocorticalis claustralis. In Allocortex; Springer: Berlin/Heidelberg, Germany, 1975; pp. 464–494. [Google Scholar]
  49. Haralick, R.M.; Shanmugam, K.; Dinstein, I. Textural Features for Image Classification. IEEE Trans. Syst. Man Cybern. 1973, 3, 610–621. [Google Scholar] [CrossRef]
  50. Löfstedt, T.; Brynolfsson, P.; Asklund, T.; Nyholm, T.; Garpebring, A. Gray-level invariant Haralick texture features. PLoS ONE 2019, 14, e0212110. [Google Scholar] [CrossRef]
  51. Kaiser, H.F. An index of factorial simplicity. Psychometrika 1974, 39, 31–36. [Google Scholar] [CrossRef]
  52. Mohlberg, H.; Eickhoff, S.B.; Schleicher, A.; Zilles, K.; Amunts, K. A new processing pipeline and release of cytoarchitectonic probabilistic maps. In Proceedings of the 18th Annual Meeting of the Organization for Human Brain Mapping, OHBM 18, Beijing, China, 10 June 2012. [Google Scholar]
  53. Collins, D.L.; Neelin, P.; Peters, T.M.; Evans, A.C. Automatic 3D Intersubject Registration of MR Volumetric Data in Standardized Talairach Space. J. Comput. Assist. Tomogr. 1994, 18, 192–205. [Google Scholar] [CrossRef]
  54. Hömke, L. A multigrid method for anisotropic PDE’s in elastic im age registration. Numer. Linear Algebra Appl. 2006, 13, 215–229. [Google Scholar] [CrossRef]
  55. Eickhoff, S.B.; Stephan, K.E.; Mohlberg, H.; Grefkes, C.; Fink, G.R.; Amunts, K.; Zilles, K. A new SPM toolbox for combining probabilistic cytoarchitectonic maps and functional imaging data. Neuroimage 2005, 25, 1325–1335. [Google Scholar] [CrossRef]
  56. Gundersen, H.J.; Bendtsen, T.F.; Korbo, L.; Marcussen, N.; Møller, A.; Nielsen, K.; Nyengaard, J.R.; Pakkenberg, B.; Sørensen, F.B.; Vesterby, A.; et al. Some new, simple and efficient stereological methods and their use in pathological research and diagnosis. Apmis 1988, 96, 379–394. [Google Scholar] [CrossRef]
  57. Amunts, K.; Kedo, O.; Kindler, M.; Pieperhoff, P.; Mohlberg, H.; Shah, N.J.; Habel, U.; Schneider, F.; Zilles, K. Cytoarchitectonic mapping of the human amygdala, hippocampal region and entorhinal cortex: Intersubject variability and probability maps. Anat. Embryol. 2005, 210, 343–352. [Google Scholar] [CrossRef]
  58. Bludau, S.; Eickhoff, S.B.; Mohlberg, H.; Caspers, S.; Laird, A.R.; Fox, P.T.; Schleicher, A.; Zilles, K.; Amunts, K. Cytoarchitecture, probability maps and functions of the human frontal pole. Neuroimage 2014, 93, 260–275. [Google Scholar] [CrossRef]
  59. Eickhoff, S.B.; Schleicher, A.; Scheperjans, F.; Palomero-Gallagher, N.; Zilles, K. Analysis of neurotransmitter receptor distribution patterns in the cerebral cortex. Neuroimage 2007, 34, 1317–1330. [Google Scholar] [CrossRef] [PubMed]
  60. Krause, D.; Thörnig, P. JURECA: Modular supercomputer at Jülich Supercomputing Centre. JLSRF 2018, 4, A132. [Google Scholar] [CrossRef]
  61. Schiffer, C.; Spitzer, H.; Kiwitz, K.; Unger, N.; Wagstyl, K.; Evans, A.C.; Harmeling, S.; Amunts, K.; Dickscheid, T. Convolutional neural networks for cytoarchitectonic brain mapping at large scale. Neuroimage 2021, 240, 118327. [Google Scholar] [CrossRef] [PubMed]
  62. Ronneberger, O.; Fischer, P.; Brox, T. U-net: Convolutional Networks for Biomedical Image Segmentation. In Proceedings of the International Conference on Medical Image Computing and Computer-Assisted Intervention, Munich, Germany, 5–9 October 2015; pp. 234–241. [Google Scholar] [CrossRef]
  63. Omidyeganeh, M.; Lepage, C.; Wagstyl, K.; Spitzer, H.; Dickscheid, T.; Amunts, K.; Evans, A. Non-linear registration of 1 μm histology sections into 3D 20 μm BigBrain space. In Proceedings of the 26th Annual Meeting of the Organization for Human Brain Mapping, Montreal, QC, Canada, 26–30 June 2020. [Google Scholar]
  64. Stephan, H. Regio retrobulbaris. In Allocortex; Springer: Berlin/Heidelberg, Germany, 1975; pp. 289–309. [Google Scholar]
  65. Behuet, S.; Bludau, S.; Kedo, O.; Schiffer, C.; Dickscheid, T.; Brandstetter, A.; Massicotte, P.; Omidyeganeh, M.; Evans, A.; Amunts, K. A High-Resolution Model of the Human Entorhinal Cortex in the ‘BigBrain’—Use Case for Machine Learning and 3D Analyses. In Brain-Inspired Computing, Proceedings of the 4th International Workshop, BrainComp 2019, Cetraro, Italy, 15–19 July 2019; Springer: Cham, Switzerland, 2019; pp. 3–21. Available online: https://doi.org/10.1007/978-3-030-82427-3_1 (accessed on 24 March 2024).
  66. de Olmos, J.S. Amygdala. In The Human Nervous System, 2nd ed.; Paxinos, G., Mai, J.K., Eds.; Elsevier: Amsterdam, The Netherlands, 2004; pp. 739–868. [Google Scholar]
  67. Catani, M.; Dell’acqua, F.; Thiebaut de Schotten, M. A revised limbic system model for memory, emotion and behaviour. Neurosci. Biobehav. Rev. 2013, 37, 1724–1737. [Google Scholar] [CrossRef]
  68. Insausti, R.; Juottonen, K.; Soininen, H.; Insausti, A.M.; Partanen, K.; Vainio, P.; Laakso, M.P.; Pitkänen, A. MR volumetric analysis of the human entorhinal, perirhinal, and temporopolar cortices. AJNR Am. J. Neuroradiol. 1998, 19, 659–671. [Google Scholar]
  69. Gonçalves Pereira, P.M.; Insausti, R.; Artacho-Pérula, E.; Salmenperä, T.; Kälviäinen, R.; Pitkänen, A. MR volumetric analysis of the piriform cortex and cortical amygdala in drug-refractory temporal lobe epilepsy. AJNR Am. J. Neuroradiol. 2005, 26, 319–332. [Google Scholar] [PubMed]
  70. Palomero-Gallagher, N.; Kedo, O.; Mohlberg, H.; Zilles, K.; Amunts, K. Multimodal mapping and analysis of the cyto- and receptorarchitecture of the human hippocampus. Brain Struct. Funct. 2020, 225, 881–907. [Google Scholar] [CrossRef] [PubMed]
  71. Brodmann, K. Vergleichende Lokalisationslehre der Großhirnrinde. 1909. Available online: https://wellcomecollection.org/works/vrnkkxtj/items?canvas=2 (accessed on 24 March 2024).
  72. Heimer, L.; De Olmos, J.S.; Alheid, G.F.; Pearson, J.; Sakamoto, N.; Shinoda, K.; Marksteiner, J.; Switzer Iii, R.C. The human basal forebrain. Part II. In Handbook of Chemical Neuroanatomy; Elsevier: Amsterdam, The Netherlands, 1999; Volume 15, pp. 57–226. [Google Scholar]
  73. Iqbal, S.; Leon-Rojas, J.E.; Galovic, M.; Vos, S.B.; Hammers, A.; de Tisi, J.; Koepp, M.J.; Duncan, J.S. Volumetric analysis of the piriform cortex in temporal lobe epilepsy. Epilepsy Res. 2022, 185, 106971. [Google Scholar] [CrossRef]
  74. Stephan, H.; Frahm, H.; Baron, G. New and revised data on volumes of brain structures in insectivores and primates. Folia Primatol. 1981, 35, 1–29. [Google Scholar] [CrossRef]
  75. Koehler, L.; Fournel, A.; Albertowski, K.; Roessner, V.; Gerber, J.; Hummel, C.; Hummel, T.; Bensafi, M. Impaired Odor Perception in Autism Spectrum Disorder Is Associated with Decreased Activity in Olfactory Cortex. Chem. Senses 2018, 43, 627–634. [Google Scholar] [CrossRef]
  76. Menassa, D.A.; Sloan, C.; Chance, S.A. Primary olfactory cortex in autism and epilepsy: Increased glial cells in autism. Brain Pathol. 2017, 27, 437–448. [Google Scholar] [CrossRef] [PubMed]
  77. Vasavada, M.M.; Wang, J.; Eslinger, P.J.; Gill, D.J.; Sun, X.; Karunanayaka, P.; Yang, Q.X. Olfactory cortex degeneration in Alzheimer’s disease and mild cognitive impairment. J. Alzheimers Dis. 2015, 45, 947–958. [Google Scholar] [CrossRef] [PubMed]
  78. Saiz-Sanchez, D.; De la Rosa-Prieto, C.; Ubeda-Banon, I.; Martinez-Marcos, A. Interneurons, tau and amyloid-β in the piriform cortex in Alzheimer’s disease. Brain Struct. Funct. 2015, 220, 2011–2025. [Google Scholar] [CrossRef] [PubMed]
  79. Wattendorf, E.; Welge-Lüssen, A.; Fiedler, K.; Bilecen, D.; Wolfensberger, M.; Fuhr, P.; Hummel, T.; Westermann, B. Olfactory impairment predicts brain atrophy in Parkinson’s disease. J. Neurosci. 2009, 29, 15410–15413. [Google Scholar] [CrossRef] [PubMed]
  80. Hubbard, P.S.; Esiri, M.M.; Reading, M.; McShane, R.; Nagy, Z. Alpha-synuclein pathology in the olfactory pathways of dementia patients. J. Anat. 2007, 211, 117–124. [Google Scholar] [CrossRef] [PubMed]
  81. Takeda, A.; Baba, T.; Kikuchi, A.; Hasegawa, T.; Sugeno, N.; Konno, M.; Miura, E.; Mori, E. Olfactory dysfunction and dementia in Parkinson’s disease. J. Parkinsons Dis. 2014, 4, 181–187. [Google Scholar] [CrossRef]
  82. Harding, A.J.; Stimson, E.; Henderson, J.M.; Halliday, G.M. Clinical correlates of selective pathology in the amygdala of patients with Parkinson’s disease. Brain 2002, 125, 2431–2445. [Google Scholar] [CrossRef]
  83. Cortese, B.M.; McConnell, P.A.; Froeliger, B.; Leslie, K.; Uhde, T.W. Burning odor-elicited anxiety in OEF/OIF combat veterans: Inverse relationship to gray matter volume in olfactory cortex. J. Psychiatr. Res. 2015, 70, 58–66. [Google Scholar] [CrossRef] [PubMed]
  84. Bitter, T.; Gudziol, H.; Burmeister, H.P.; Mentzel, H.J.; Guntinas-Lichius, O.; Gaser, C. Anosmia leads to a loss of gray matter in cortical brain areas. Chem. Senses 2010, 35, 407–415. [Google Scholar] [CrossRef]
  85. Bitter, T.; Brüderle, J.; Gudziol, H.; Burmeister, H.P.; Gaser, C.; Guntinas-Lichius, O. Gray and white matter reduction in hyposmic subjects—A voxel-based morphometry study. Brain Res. 2010, 1347, 42–47. [Google Scholar] [CrossRef]
  86. Esposito, F.; Cirillo, M.; De Micco, R.; Caiazzo, G.; Siciliano, M.; Russo, A.G.; Monari, C.; Coppola, N.; Tedeschi, G.; Tessitore, A. Olfactory loss and brain connectivity after COVID-19. Hum. Brain Mapp. 2022, 43, 1548–1560. [Google Scholar] [CrossRef] [PubMed]
  87. Aroniadou-Anderjaska, V.; Fritsch, B.; Qashu, F.; Braga, M.F. Pathology and pathophysiology of the amygdala in epileptogenesis and epilepsy. Epilepsy Res. 2008, 78, 102–116. [Google Scholar] [CrossRef] [PubMed]
  88. Chee, K.; Razmara, A.; Geller, A.S.; Harris, W.B.; Restrepo, D.; Thompson, J.A.; Kramer, D.R. The role of the piriform cortex in temporal lobe epilepsy: A current literature review. Front. Neurol. 2022, 13, 1042887. [Google Scholar] [CrossRef] [PubMed]
  89. Makhalova, J.; Le Troter, A.; Aubert-Conil, S.; Giusiano, B.; McGonigal, A.; Trebuchon, A.; Carron, R.; Medina Villalon, S.; Bénar, C.G.; Ranjeva, J.P.; et al. Epileptogenic networks in drug-resistant epilepsy with amygdala enlargement: Assessment with stereo-EEG and 7 T MRI. Clin. Neurophysiol. 2022, 133, 94–103. [Google Scholar] [CrossRef] [PubMed]
  90. Ciumas, C.; Lindström, P.; Aoun, B.; Savic, I. Imaging of odor perception delineates functional disintegration of the limbic circuits in mesial temporal lobe epilepsy. Neuroimage 2008, 39, 578–592. [Google Scholar] [CrossRef] [PubMed]
  91. Galovic, M.; Baudracco, I.; Wright-Goff, E.; Pillajo, G.; Nachev, P.; Wandschneider, B.; Woermann, F.; Thompson, P.; Baxendale, S.; McEvoy, A.W.; et al. Association of Piriform Cortex Resection With Surgical Outcomes in Patients With Temporal Lobe Epilepsy. JAMA Neurol. 2019, 76, 690–700. [Google Scholar] [CrossRef] [PubMed]
  92. Gui, X.; Gogshelidze, D.; Chervakov, P.; Amunts, K.; Dickscheid, T. Siibra-Explorer—Interactive Web Viewer for Multilevel Brain Atlases (v2.10.1); Zenodo: Geneva, Switzerland, 2023. [Google Scholar] [CrossRef]
  93. Young, J.C.; Vaughan, D.N.; Paolini, A.G.; Jackson, G.D. Electrical stimulation of the piriform cortex for the treatment of epilepsy: A review of the supporting evidence. Epilepsy Behav. 2018, 88, 152–161. [Google Scholar] [CrossRef]
  94. Cota, V.R.; Drabowski, B.M.; de Oliveira, J.C.; Moraes, M.F. The epileptic amygdala: Toward the development of a neural prosthesis by temporally coded electrical stimulation. J. Neurosci. Res. 2016, 94, 463–485. [Google Scholar] [CrossRef]
Figure 1. Selected sequence of coronal sections in the right hemisphere of the brain pm4 revealing the full rostro-caudal extent of the mesial piriform region and the neighboring amygdala. Abbreviations: PirTBd—piriform temporobasal area, dorsal part, PirTBv—piriform temporobasal area, ventral part, PirTit—piriform temporal area (Incisura temporalis), PirTu—piriform temporal area (uncus). Amygdala: La—lateral nucleus, PL—paralaminar nucleus, BL—basolateral nucleus; APir—amygdalopiriform transition area, Me—medial nucleus, VCod—ventral cortical nucleus, dorsal part, VCov—ventral cortical nucleus, ventral part; fiber bundles: ice—intermediate central fiber masses, iol—intermediate orolateral fiber masses. Macroanatomical landmarks: ambG—ambient gyrus, aps—anterior perforated substance, erh.s—endorhinal sulcus, col.s—collateral sulcus, FG—fusiform gyrus, GS—Gyrus of Schwalbe, it—Incisura temporalis, LI—Limen insulae, phG—parahippocampal gyrus, sa.s—semiannular sulcus, smlG—semilunar gyrus, STG—superior temporal gyrus. Neighboring structures: BnM— basal nucleus of Meynert, Cl— claustrum, Ent— entorhinal cortex, Ins— insula, Tu— olfactory tubercle, PirB—piriform basal area, PirI—piriform insular area, TPrh—temporopolar-perirhinal area (periallocortex), TPir—temporopolar-piriform transition area (periallocortex), Prh—perirhinal cortex (Brodmann area 35, 36), Rb—retrobulbar region.
Anatomia 03 00007 g001
Figure 2. Cytoarchitecture of the mesial piriform region (right) based on the three respective sections (left) of the left hemisphere of the BigBrain. Right column: magnified view from the region in the rectangle shown in the left column. PirTBd—piriform temporobasal area, dorsal part (yellow), PirTBv—piriform temporobasal area, dorsal part (violet), PirTit—piriform temporal area (Incisura temporalis) (light green), PirTu—piriform temporal area (uncus) (orange color). (a) The border between PirTBd and the ventrally adjacent medial nucleus of the amygdala in a caudal section of the right hemisphere; (b) the border between the cortex-like amygdalopiriform transition area (APir) of the amygdala and periallocortical PirTu; (c) the border between PirTBd and the caudal retrobulbar region; (d) the border between the allocortical PirTBv and periallocortical PirTit. Note the difference between the “temporal” and “temporopolar” parts of PirTit (marked by one asterisk and two asterisks, respectively). Abbreviations: Cl—claustrum, d—dorsal, erh.s—endorhinal sulcus, Ins—insula, m—medial, Me—medial nucleus (light brown), l—lateral, ots—occipitotemporal sulcus, PL—paralaminar nucleus, Prh—perirhinal cortex, Rb—retrobulbar region, v—ventral. Note that designation of “rostral” and “caudal” relates only to the sections presented. Allocortical layers of PirTBd and PirTBv: 1—Stratum moleculare, 2—Stratum densocellulare, 3—Stratum multiforme [25]; 1a–1c—sublayers of layer 1; 3s—superficial sublayer of layer 3, 3d— deep sublayer of the layer 3. Layers 1-5—periallocortical layers of PirTit and PirTu, diss—Lamina dissecantia. Note that periallocortical layer 4 does not correspond to the isocortical layer 4, composed of small, granular cells.
Anatomia 03 00007 g002
Figure 3. Cytoarchitecture of the temporobasal piriform areas (PirTBd and PirTBv) in a rostral (5086) to caudal (5011) section of one of 10 postmortem brains (pm 4). Right column: magnified view from the region in the rectangle shown in the left column. (a) The PirTBd/PirTBv border; (b) the border between PirTBv and amygdalopiriform transition area (APir (lilac color)). Abbreviations: Cl—claustrum, col.s—collateral sulcus, GS—Gyrus of Schwalbe, Ins—insula, La—lateral nucleus of the amygdala, LI—Limen insulae, phG—parahippocampal gyrus, PirTBd—piriform temporobasal area, dorsal part (yellow), PirTBv—piriform temporobasal area, dorsal part (violet), PL—paralaminar nucleus of the amygdala, erh.s—endorhinal sulcus, STG—superior temporal gyrus. Note the rather irregulate formation of the layers, in contrast to the isocortex of the temporal lobe. Layers 1–3—allocortical layers of PirTBd and PirTBv; 1a–1c—sublayers of the layer 1, 3s—superficial sublayer of layer 3, 3d—deep sublayer of the layer 3.
Anatomia 03 00007 g003
Figure 4. Cytoarchitecture of PirTu and PirTit (pm 4) (right) at two levels (left): (a) more rostral and (b) more caudal. Note differences in architectures of both areas along their rostro-caudal extent. In 5176, two asterisks mark appearance of the temporopolar part laterally to the temporal part (one asterisk). Abbreviations: col.s—collateral sulcus, d—dorsal, diss—Lamina dissecantia, Ent—entorhinal cortex, GS—Gyrus of Schwalbe, it—Incisura temporalis, l—lateral, LI—Limen insulae, m—medial, phG—parahippocampal gyrus, rh.s—rhinal sulcus, v—ventral. PirTBd—piriform temporobasal area, dorsal part (yellow), PirTBv—piriform temporobasal area, dorsal part (violet), PirTit—piriform temporal area (Incisura temporalis) (green), PirTu—piriform temporal area (uncus) (orange color). Layers 1–5—periallocortical layers of PirTit and PirTu, 3s (superficial) and 3d (deep)—sublayers of the layer 3, diss—Lamina dissecatia. Layers of the entorhinal cortex [65]: 1—layer 1 (Stratum moleculare), 2—layer 2 (Stratum stellare), 3—layer 3 (Stratum pyramidale), diss— Substratum dissecantia, 4—layer 4 (Stratum magnocellulare), 5–6—layers 5 and 6 (Stratum parvocellulare and Stratum multiforme).
Anatomia 03 00007 g004
Figure 5. Cytoarchitectonic borders of PirTit: (a) with temporopolar periallocortex TPir (magnified view from section 5251); (b) with the rostral part of the perirhinal cortex (magnified view from section 5341). Abbreviations: col.s—collateral sulcus, Ent—entorhinal cortex, GS—Gyrus of Schwalbe, Ins—insula, it—Incisura temporalis, LI—Limen insulae, phG—parahippocampal gyrus, Prh—perirhinal cortex, PirB—piriform basal area, PirTit—piriform temporal area (Incisura temporalis) (green color), PirTu—piriform temporal area (uncus) (orange color), rh.s—rhinal sulcus, STG—superior temporal gyrus, TPir—temporopolar-perirhinal area, tps—temporopolar sulcus. Layers 1–5—layers of the periallocortical PirTit and neighboring areas, 3s (superficial) and 3d (deep)—sublayers of the layer 3.
Anatomia 03 00007 g005
Figure 6. Micro- and macroanatomical intersubject variability of the mesial piriform cortex in representative sections of the right hemisphere at the level of Limen insulae. Note that protocols for the structural neuroimaging use this level to identify the limits of the piriform allocortex (which corresponds to PirTBd and PirTBv of the present study), delineating it as U-shaped structure. Note that in some hemispheres, both PirTBd and PirTBv were found on the basal brain surface at this level, with PirTBv appearing ventrolaterally to PirTBd (i.e., pm5, pm9). Abbreviation: ambG—ambient gyrus, GS—Gyri of Schwalbe, PirTBd—piriform temporobasal area, dorsal part, PirTBv—piriform temporobasal area, ventral part, PirTit—piriform temporal area (Incisura temporalis), PirTu—piriform temporal area (uncus).
Anatomia 03 00007 g006
Figure 7. Texture analysis of the piriform region: (a) the boxplot of the three independent factor scores extracted in PCA; (b) pairwise analysis for independent factor 1; (c) for IF2; (d) for IF3. In (a), note a distinction between the four piriform areas, each of which reveals a specific pattern of IF1–IF3. Data points with more than 1.5 times and less than 3 times the interquartile range are shown by the open circles in the plot. The corrected p values are indicated.
Anatomia 03 00007 g007
Figure 8. Probability maps of four mesial piriform areas in coronal (y), sagittal (x), and horizontal (z) sections of the MNI Colin 27 reference space. Color bar reflects a probability of the area related to a particular voxel of the section. R—right hemisphere.
Anatomia 03 00007 g008
Figure 9. Maximum probability maps of four mesial piriform areas over their rostro-caudal extent: (a) coronal sections; (b) sagittal sections of the right hemisphere of the of the MNI Colin 27 reference space. R—right hemisphere.
Anatomia 03 00007 g009
Figure 10. A 3D reconstruction of the amygdala-piriform region in the BigBrain: (a) cytoarchitectonic section with predictions from the Convolutional Neural Networks; (b) the level of section in (a); (c) view to the 3D reconstruction of the mesial piriform region at the same coronal level (y) as in (a), a rostral view; (d) rostro-caudal extent of the region (two views). Dashed lines separate the piriform region from the amygdala. The “pointed peak” of PirTBd in the medial view is marked by the asterisk (d). Asterisks in the lateral view indicate the dorsolateral extensions of the lateral nucleus (La), separated from the main body by the iol fibers. Note that the medial side of the structures is smoother than the lateral side, where the structures border the white matter and show more divergence between the manually mapped sections. Stereotaxic x (red), y (green), and z (blue) coordinate. Abbreviations: Cl—claustrum, Ent—entorhinal cortex, it—Incisura temporalis, tps—temporopolar sulcus. R—right hemisphere. Amygdala [21], centromedial group (CM): AAA—anterior amygdaloid area, Me—medial nucleus, Ce—central nucleus. AStr—amygdalostriatal transition zone. Amygdala, laterobasal group (LB): Bm—basomedial nucleus, BL—basolateral nucleus, La—lateral nucleus, PL—paralaminar nucleus. Amygdala, superficial group (SF): APir—amygdalopiriform transition area, VCod—ventral cortical nucleus, dorsal part, VCov—ventral cortical nucleus, ventral part, AHid—amygdalohippocampal transition area, dorsal part, AHiv—amygdalohippocampal transition area, ventral part. Fiber bundles, internal, medial fiber masses (MF): icm—intermediate caudomedial fiber masses, lm—Lamella medialis. Internal, intermediate fiber masses (IF): ice—intermediate central fiber masses, iol—intermediate orolateral fiber masses, ld—Lamella dorsalis. External fiber masses: vtm—ventromedial tract of Stria terminalis.
Anatomia 03 00007 g010
Table 1. Sample of the postmortem brains used in the present study.
CaseBrainCause of DeathGenderWeight 1,
Grams
Age at Death,
Years
1pm 1Carcinoma of the bladderfemale135079
2pm 4Toxic glomerulonephritismale 134975
3pm 5Cardiorespiratory insufficiencyfemale114259
4pm 7Right heart failuremale143737
5pm 8Renal failurefemale121672
6pm 9Cardiorespiratory insufficiencyfemale 111079
7pm 11Cardiac infarctionmale138174
8pm 13Drowningmale 123439
9pm 14Cardiorespiratory insufficiencyfemale111386
10pm 20 *Cardiorespiratory insufficiencymale139265
1 Fresh brain weight; * This brain represents the BigBrain.
Table 2. Topographical relationship of the areas to the macroanatomical landmarks.
ClassificationAreaLocalization
In SectionsIn Relation to the Landmarks
AllocortexPirTBdcaudalwithin the Sulcus endorhinalis
rostralmedial side of the Limen insulae or basal brain
surface
PirTBvcaudaldorsomedial surface of temporal lobe
rostralmedial side of the Limen insulae or basal brain surface
PeriallocortexPirTitcaudal limiton the rostral ambient gyrus
middleIncisura temporalis, incipient gyri of Schwalbe
rostralTemporal pole: dorsomedial surface, gyri of Schwalbe, temporopolar sulcus
rostral limitFundus and/medial bank of the temporopolar sulcus
PirTuFull extentUncal apex
Table 3. Mean volumes of the mesial piriform cortex areas after the shrinkage correction with standard deviation (±SD).
Mean Volume (±SD), mm3PirTBdPirTBvPirTitPirTu
Female (left and right)50.25 ± 9.7148.14 ± 8.46319.78 ± 96.5392.15 ± 28.80
Male (left and right)66.14 ± 23.1261.43 ± 17.00393.94 ± 99.0287.01 ± 29.51
Left (male and female)54.85 ± 18.3052.28 ± 12.57338.77 ± 63.7995.75 ± 29.25
Right (male and female)61.54 ± 20.2357.29 ± 16.94374.95 ± 131.8483.41 ± 27.84
Volume per Hemisphere/Entire Brain Volume (±SD), % per HemispherePirTBdPirTBvPirTitPirTu
Female (left and right)4.41 ± 1.014.20 ± 0.7627.96 ± 8.667.94 ± 2.12
Male (left and right)5.00 ± 1.724.65 ± 1.2329.83 ± 6.656.61 ± 2.23
Left (male and female)4.43 ± 1.334.22 ± 0.7827.50 ± 4.417.80 ± 2.38
Right (male and female)4.98 ± 1.494.63 ± 1.2230.29 ± 9.876.75 ± 2.03
Table 4. Center of mass coordinates of the probabilistic maps in two reference spaces.
CoordinatesHPirTBd PirTBvPirTitPirTu
xyzxyzxyzxyz
Colin 27L−266−15−276−19−299−27−226−29
MNI ICBM 152L−275−15−285−19−318−28−245−30
Colin 27R307−14318−183310−26269−27
MNI ICBM 152R287−15287−19309−27248−28
H—hemisphere, R—right, L—left.
Table 5. Comparison of the nomenclature of the present study with that of the previous studies.
AreasBr [71]vEK [22]Brh [23]F [24]St [25]I [68]S [4]
H [72]
D [43]M [42]
PirTBPirTBd51TKprpd,
prpi
Pp2b,
Pp2a
Pf--PirFPirPirF
PirTBv prpvPp1 (p)Pt--PirT PirT
PirTPirTu Part of prAeta1,
eta0 (p)
--PRh
(35+ 36)
TPpall
(p)
LEC (EO)
(vp)
PRC35
PirTit part of TImtmPper LEC (EO)
(dp), TI (mp)
PirT
partly mtieti TPCl (p)
eta0 (p)e
Br [71]—Brodmann (1909), vEK [22]—von Economo and Koskinas (1925), Brh [23]—Brockhaus (1940), F [24]—Filimonoff (1949), St [25]—Stephan (1975), I [68]—Insausti et al. (1998), S [4]—Sakamoto et al. (1999), H [72]—Heimer et al. (1999), D [43]—Ding et al. (2016), M [42]—Mai et al (2016). e—entorhinal cortex; EO olfactory subfield of the entorhinal cortex; eta0—area entorhinalis transgrediens anterior periamygdalaris; eta1—area entorhinalis transgrediens anterior I; eti—area entorhinalis transgrediens insularis; LEC—lateral entorhinal cortex; mtm—area mesocorticalis temporalis medialis; mti—area mesocorticalis temporalis intermedia; p—part of the area; dp—dorsal part of the area; mp—medial part of the area; vp—ventral part of the area; Pf—area praepiriformis temporalis; Pt—area praepiriformis frontalis; Pir—piriform cortex; PirF—piriform cortex, frontal part; PirT—piriform cortex, temporal part; Pp—praepiriform region (subdivisions Pp1, Pp2a, Pp2b); Pper—area entorhinalis-praepiriformis; prA—Subregio praeamygdalea; PRh and PRC—perirhinal cortex; prp—Subregio praepiriformis; TI—area piriformis temporalis; TPCl—lateral temporopolar cortex; TPpall—temporopolar periallocortex.
Disclaimer/Publisher’s Note: The statements, opinions and data contained in all publications are solely those of the individual author(s) and contributor(s) and not of MDPI and/or the editor(s). MDPI and/or the editor(s) disclaim responsibility for any injury to people or property resulting from any ideas, methods, instructions or products referred to in the content.

