Article

Morphological and Immunohistochemical Characterization of Bone Structure and Cell–Cell Communication in a Rat Osteoporosis Model

1
Clinic of Small Animals, c/o Institute of Veterinary Anatomy, Histology and Embryology, Justus-Liebig-University of Giessen, 35392 Giessen, Germany
2
Anatomy and Embryology Department, Faculty of Veterinary Medicine, University of Mansoura, Mansoura 35516, Egypt
3
Institute of Veterinary Anatomy, Histology and Embryology, Justus-Liebig-University of Giessen, 35392 Giessen, Germany
4
Experimental Trauma Surgery, Justus-Liebig-University of Giessen, 35394 Giessen, Germany
5
University Medical Center, Justus-Liebig-University of Giessen, 35392 Giessen, Germany
*
Author to whom correspondence should be addressed.
These authors contributed equally to this work.
Anatomia 2024, 3(2), 93-109; https://doi.org/10.3390/anatomia3020008
Submission received: 23 January 2024 / Revised: 18 March 2024 / Accepted: 3 April 2024 / Published: 10 April 2024

Abstract

:
Bone remodeling is essential for maintaining bone health. The imbalance between bone formation and bone resorption leads to bone diseases such as osteoporosis. Connexin43 (Cx43) is a gap junction molecule that plays an important role in bone homeostasis. The present study investigates the morphological characteristics of bone trabeculae and the distribution of Cx43 in bone cells using osteoporotic rat models to explore the relationship between osteoporosis and bone remodeling. Female Sprague–Dawley rats were divided into three groups: sham, ovarectomy with food deprivation (OVX+diet), and ovarectomy with steroid administration (OVX+steroid) for 3 and 12 months to induce osteoporosis. The lumbar vertebrae were processed for histomorphometric and immunohistochemical evaluation of the trabeculae and the distribution of Cx43 in bone cells. The data showed a significant reduction in trabecular bone in both osteoporotic groups. After 12 months, the OVX+diet treatment resulted in reduced mineralization and an increase in unmineralized bone. The percentage of alkaline phosphatase-positive areas in the OVX+diet vertebrae was lower at 12 months compared to the sham group. A significant increase in tartrate-resistant acid phosphatase (TRAP) positive osteoclasts was observed in the OVX+diet group. Both osteoporotic groups showed a decrease in Cx43-positive osteoblasts areas. An increase in the number of osteoclasts positive for Cx43 was detected in the OVX+diet group. The changes in Cx43 distribution in bone cells, together with trabecular mineralization, suggest that Cx43 may play a role in the progression of osteoporosis and could be a valuable target to improve bone remodeling.

1. Introduction

Bone remodeling, a well-regulated process, represents the relationship between bone formation and resorption and reflects the dynamics of bone tissue under physiological and pathophysiological conditions [1,2,3]. Osteoporosis is a multifactorial disease characterized by a reduction in bone mineral density, leading to fragility and fractures [4,5], and it has a negative impact on public health and quality of life [6]. Osteoporosis is a disease that affects bone remodeling and is one of the most common bone diseases with a high clinical and economic burden. This osteoporotic phenotype is the result of an imbalance between bone-forming cells (osteoblasts) and bone-resorbing cells (osteoclasts). The communication between these bone cells is of great importance for the bone remodeling process and is mediated via gap junctions [7].
Connexins are transmembrane proteins used as structural components of gap junctions and hemichannels. In humans, 21 members of the connexin family are identified, and they are involved in cell–cell communication and intracellular–extracellular exchange via gap junctions and hemichannels, respectively [8,9]. Connexin 43 (Cx43) is the most abundant gap junctional protein in bone cells, including osteoblasts and osteoclasts, and, therefore, a key player in the function as well as the development of these cells [2,8,10,11,12]. For physiological bone remodeling and skeletal homeostasis, Cx43 plays an important role in the proliferation, differentiation, and survival of bone cells [2,8,9,10]. During osteogenic differentiation of human mesenchymal stem cells (hMSCs), gene expression of Cx43 was increased in comparison to undifferentiated cells [13]. Interestingly, however, Cx43 gene expression depends on the calcium content of the cultivation medium and relatively increases with the extracellular calcium concentration [14].
Inhibition of Cx43 results in a reduced osteoblast differentiation potential, as indicated by the reduction in osteoblast-specific gene expression and decreased mineralization capacity [1,8,10,15]. In the cortical bone of Cx43-deficient mice, the expression of the osteoblastic genes, including osterix (Osx) and collagen I (Col1A1), was reduced, suggesting the importance of Cx43 for bone formation [16]. Along the line, the Cx43 deletion in mice embryos reduced osteoblast differentiation and delayed ossification [15], whereas Cx43 knockout on osteoblasts reveals a thinner cortical bone with an increased porosity and disorganized collagen fibers [16]. Concomitantly, gap junctions mediate signals involved in the bone resorption process [17], and Cx43 seems to play a major role in osteoclast performance. Studies have revealed that the expression of Cx43 was strongly upregulated at the beginning of osteoclastogenesis [18,19,20]. In addition, a large group of evidence has reported that Cx43 plays an important role in the fusion and clustering of monocyte-like precursor cells into osteoclasts [2,16,21]. Accordingly, the inhibition of Cx43 results in reduced precursor fusion and decreased resorption activity of osteoclasts [8]. In cell culture, the inhibition of Cx43 leads to direct negative effects of osteoclasts with reduced formation, fusion, and resorption [1]. In contrast, in vivo deletion of Cx43 in mouse models results in an increased osteoclast number and increased resorption activity [1,16]. These different results could be explained by either an indirect effect or communication with other bone cells in vivo [1], highlighting the importance of Cx43 in bone remodeling.
Bone remodeling in the course of osteoporosis can be studied in various animal models, especially in the ovariectomized rat (OVX rat) [22,23]. The presented study analyzed the relationship between osteoporosis status and bone remodeling with special regard to Cx43. The models used in this study, including a combination of OVX with either a multiple-deficient diet or glucocorticoid therapy, were previously described in detail [24,25,26,27,28,29]. In the present study, an in vivo histomorphometric evaluation of the trabecular components, including osteoid and mineralization following 3 and 12 months post-osteoporosis induction with special regard to the distribution pattern of Cx43 in bone-forming and -resorbing cells of the osteoporotic rat.

2. Materials and Methods

2.1. Animals

The study was performed according to the institutional regulations and German animal protection laws. All experiments were approved by the ethical commission of the local government institution (permission number: 89/2009).
The rat models currently in use were part of the subproject T1 of the collaboration research center Transregio 79 (materials for regeneration of systemically altered bone) as previously described [24,25,26,27,28,29]. Female Sprague–Dawley rats, eight weeks old, were divided into three experimental groups: sham-operated (control), ovariectomy with diet deficiency (OVX+diet), and ovariectomy with steroid administration (OVX+steroid). The surgical operations were performed when the rats were 14 weeks old. Two weeks later, the rats were either fed on a specific diet or given steroids. The OVX+diet group was fed a diet deficient in calcium, phosphorus, vitamin C, and vitamin D2/D3 (Altromin C1034, Altromin Spezialfutter GmbH, Lage, Germany) for 3 and 12 months. In the OVX+steroid group, rats were administered a glucocorticoid via intramuscular injection (0.3 mg/kg body weight dexamethasone-21-isonicotinate, Voren-Depot, Boehringer Ingelheim, Germany) every two weeks. The rats were euthanized after treatment periods of 3 and 12 months (n = 6 for each time point and each group, in total n = 36 animals).

2.2. Tissue Collection

The L4 vertebrae were dissected and fixed in 4% paraformaldehyde (PFA, Carl Roth, Karlsruhe, Germany) in sodium phosphate buffer with a pH of 7.2 for 24 h. Then, the specimens were cut in half and kept in 4% PFA for an additional 48 h. One half was embedded in Technovit 9100, while the other half was processed for paraffin embedding.

2.3. Undecalcified Technovit 9100 Embedding

The PFA-fixed specimens were dehydrated using a gradual increase in ethanol concentrations followed by a 24 h incubation in 99.8% p.a. xylol (Carl Roth, Karlsruhe, Germany). A three-step pre-infiltration with Technovit 9100 (Heraeus Kulzer, Wehrheim, Germany) was conducted and modified according to the manufacturer’s protocol. During pre-infiltration 1 (xylol/Technovit® 9100 (stab.) (1:1), a vacuum of 200 mbar was applied several times for 10 min each. The evacuation procedure was repeated during pre-infiltration 2 (Technovit® 9100 Basic (stab.) + Hardener 1; 72 h at room temperature) and pre-infiltration 3 (Technovit® 9100 (destab.) + Hardener 1 at 4 °C). To perform the infiltration, Technovit® 9100 (destab.) + Hardener 1 were mixed with PMMA powder (Polymethylmetacrylat, EXAKT Apparatebau, Norderstedt, Germany) at 4 °C, and the specimens were incubated for five days. The thin-section manufacturing was prepared following the procedure described by [30].

2.4. Masson–Goldner Trichrome Staining

The thin sections embedded in undecalcified Technovit 9100 (n = 2 per animal) were stained using a modified Masson–Goldner trichrome staining method. Specifically, the sections were incubated with Goldner solution 1 (Ponceau de Xylidine and acid fuchsin) for 5 min, followed by Goldner solution 2 (Carl Roth GmbH, Karlsruhe, Germany) for 3 min, and finally Goldner solution 3 for 2 min. Washing steps with 1% acetic acid were carried out between each dyeing step. The thin sections were processed through a series of ascending alcohol concentrations and then were subsequently embedded with Roti®-Histokit (Carl Roth GmbH, Karlsruhe, Germany).

2.5. Decalcification and Paraffin Embedding

One-half of L4 from all animals was decalcified using ethylene diamine tetra-acetic acid (EDTA, Sigma-Aldrich, Steinheim, Germany, pH = 7.4) for three weeks with a change in EDTA twice a week. After decalcification, the specimens were washed under running water and then incubated with PBS for 48 h afterward. The embedding was conducted with paraffin (Paraplast®, Sherwood Medical, St. Louis, MO, USA) using an embedding machine (Leica EG 1150c, Leica, Wetzlar, Germany). Thin 5 μm paraffin sections were obtained using a rotation microscope (LEICA RM 2155, LEICA Instruments GmbH, Nussloch, Germany) and a microtome (Leica 819, Leica instruments GmbH, Nussloch, Germany).

2.6. Hematoxylin–Eosin (HE) Staining of the Paraffin Sections

The paraffin sections were incubated in xylol for 10 min and then were processed through descending alcohol series for the removal of paraffin. Using Hämalaun (Mayer’s Hämalaunlösung, 9249, Merck, Darmstadt, Germany) for 5 min and 30 s 1% eosin (Certistain®, Eosin G, Merck, Darmstadt), the staining was performed, and the sections were covered with Entellan® (Merck, Darmstadt, Germany). The staining was photographed with Axiophot (Carl Zeiss Micro Imaging, Goettingen, Germany) in combination with DFC 320 (Leica Microsystems, Bensheim, Germany).

2.7. Picrosirrus Red (PSR) Collagen Staining

The paraffin sections were cleared twice in xylol for 10 min, then were dehydrated with descending alcohol concentrations for three min each. Sections were washed in distilled water for 3 min, then incubated with PSR (ScyTek Laboratories, Inc., Logan, UT, USA) for 60 min. The sections were washed twice in 0.5% acetic acid for 10 sec each. The sections were dehydrated twice in 96% alcohol for 3 min, then cleared in xylol for 3 min. The staining was performed, and the sections were covered with Entellan® (Merck, Darmstadt, Germany). The staining was photographed using Axiophot (Carl Zeiss Micro Imaging, Goettingen, Germany) in combination with DFC 320 (Leica Microsystems, Bensheim, Germany). To differentiate collagen I (red) and collagen III (green) in polarized images, we used a Leica DM2500 microscope operated with LAS X software version 3.7.4.23463 (Leica MicrosystemVertrieb GmbH, Wetzlar, Germany).

2.8. ALP Staining

Alkaline phosphatase (ALP) staining of paraffin sections was performed to visualize the osteoblast activity (n = 2 sections per animal). The sections were deparaffinized in xylol, rehydrated twice with 100% ethanol for 5 min, and then processed in descending alcohol concentrations for 5 min, followed by washing in distilled water. After marking the sections with a waterproof pen, they were incubated in 0.1M Tris/HCL buffer (pH 9.4) for 10 min. Sections were stained by incubating them with BCIP (5-bromo-4-chloro-3-indolyl-phosphate) and NBT (nitro blue tetrazolium, Calbiochem 203790, Merck Milipore, Darmstadt, Germany) at 37 °C for 2 h. After being washed twice in distilled water for 5 min, the sections were mounted with a glass coverslip using Kaiser’s glycerol gelatin (Carl Roth, Karlsruhe, Germany).

2.9. TRAP Enzymatic Staining

Tartrate-resistant acid phosphatase (TRAP) enzymatic staining (n = 2 per animal) was conducted for the detection of osteoclast activity. Paraffin sections were deparaffinized as already described in Section 2.7 and then were incubated in 0.1 M sodium acetate (Merck, Darmstadt, Germany) at room temperature for 10 min. The following TRAP staining solution was prepared by dissolving 35 mg Naphthol-AS-TR-phosphate (Sigma-Aldrich, Steinheim, Germany) in 125 μL disodium salt (DMF, (Sigma-Aldrich, Steinheim, Germany) plus 35 mg Fast Red TR salt (Sigma-Aldrich, Cat-Nr. N6125-100MG, Steinheim, Germany) in 12.5 mL of 0.1 M acetate buffer (pH 5.2) (Sigma-Aldrich, Steinheim, Germany) and 57.5 mg Na tartrate (Sigma-Aldrich, Steinheim, Germany) in 12.5 mL of 0.1 M acetate buffer (pH 5.2). The solution was filtered, and the sections were incubated at 37 °C for 1 h. Afterward, the sections were rinsed in distilled water, then were counterstained with hematoxylin for 5 s using (Shandon instant hematoxylin kit, Cat.-Nr. 6765015, Thermo Fisher scientific, Schwerte, Germany). The slides were washed in running tap water for 5 min, followed by mounting with Kaiser’s glycerol gelatin (Carl Roth, Karlsruhe, Germany).

2.10. Connexin 43 Immunohistochemistry

L4 paraffin sections for Cx43 immunohistochemistry (n = 2 per animal) were deparaffinized and then washed in distilled water for 5 min. The sections were circled with a waterproof marker pen, and then the endogenous peroxidase was blocked in 3% hydrogen 210 peroxide (H2O2, Carl Roth, Karlsruhe, Germany) in TBS (Tris-buffered saline, Sigma-Aldrich, Steinheim, Germany) for 5 min. The sections were washed twice in TBS, each for five min, and were incubated with a mouse monoclonal primary antibody targeting the Connexin 43 (Invitrogen Cat.-Nr. 13-8300, Thermo Fisher Scientific, Schwerte, Germany). The sections were then incubated with primary antibody diluted 1:50 in a humidified chamber overnight at 4 °C. The slides were washed in TBS three times for 5 min. The primary antibody was detected using anti-mouse HRP (Horseradish peroxidase conjugate, DCS, Hamburg, Germany) for 20 min at room temperature, followed by washing twice in TBS and distilled water for 5 min. The staining was developed by incubation with DAB-2 components/chromogen-kit (DCS, Hamburg, Germany) for 15 min, followed by washing four times in distilled water for 5 min. Sections in parallel were incubated without primary antibodies and served as negative controls. Hematoxylin was used as nuclear counterstaining (Shandon instant hematoxylin kit, Cat.-Nr. 6765015, Thermo Fisher scientific, Schwerte, Germany), followed by a washing step in tap water for 5 min and mounting with Eukitt mounting medium (Sigma, Taufkirchen, Germany).

2.11. Imaging and Figure Reconstruction

All staining carried out from Masson–Goldner trichrome staining at undecalcified Technovit 9100 sections, as well as ALP, TRAP, and Cx43 staining of decalcified paraffin sections), were micro-photographed using a light microscope (Axiophot, Carl Zeiss Micro Imaging, Goettingen, Germany) provided with digital camera DFC 320 (Leica microsystems, Bensheim, Germany). For each section, the vertebral body was photographed in 8–10 individual images at 5× objective. The images were reconstructed in one image for the morphometric evaluation using the photomerge tool of the Adobe Photoshop software CS6 Extended version 13.0 ×64.

2.12. Histomorphometric Analyses

For all histomorphometric analyses, the total surface area of the vertebral body was selected as the region of interest (ROI). The analyses were performed with Photoshop software (Adobe Photoshop software CS6 Extended). By means of Masson–Goldner staining, the trabecula surface area within the ROI (indicated in %) was measured. Furthermore, the mineralized fraction of the trabecula (green colored with Masson–Goldner) and the unmineralized osteoid fraction (red colored) were quantified and indicated in percentage per trabecula area. Quantification of the ALP staining in osteoblasts and the corresponding osteoblastic Cx43 signals of the vertebral bodies was performed by marking the positively stained areas. The measured positive areas were divided by the total area of the whole vertebral body (ROI). The percentage of ALP- and Cx43-positive areas from the total area of the vertebral body was calculated. The TRAP staining of osteoclasts, as well as the Cx43-positive osteoclasts, were analyzed via a manual counting of the cells (number, n) per total area of the vertebral body (ROI). Osteoclasts were recognized as multinucleated cells. The cells containing a minimum of three nuclei were counted. Collagen density was quantified in ten random microscopic fields (n = 6 per group) for all experimental groups using ImageJ 1.53a software (Wayne Rasband, National Institutes of Health, USA).

2.13. Statistical Analysis

The data collected to evaluate the effect of treatment (sham vs. OVX+diet vs. OVX+steroid) at different time points (3 months vs. 12 months) were analyzed using a two-way ANOVA. Specifically, the percentage of trabecular area per ROI, mineralized area per trabecular area, osteoid per trabecular area, ALP-positive area per ROI, and Cx43-positive osteoblast area per ROI (%) were analyzed. The number of TRAP-positive osteoclasts per ROI and Cx43-positive osteoclasts per ROI (n) were determined for all 36 animals. To quantify collagen density in the trabecular bone for all experimental groups at 3 months and 12 months, we conducted a two-way ANOVA. The statistical analyses were performed using Graph Pad Prism (version 6.07, Graph Pad Software Inc.). The data are presented as mean ± SD, and p ≤ 0.05 was considered to be statistically significantly different.

3. Results

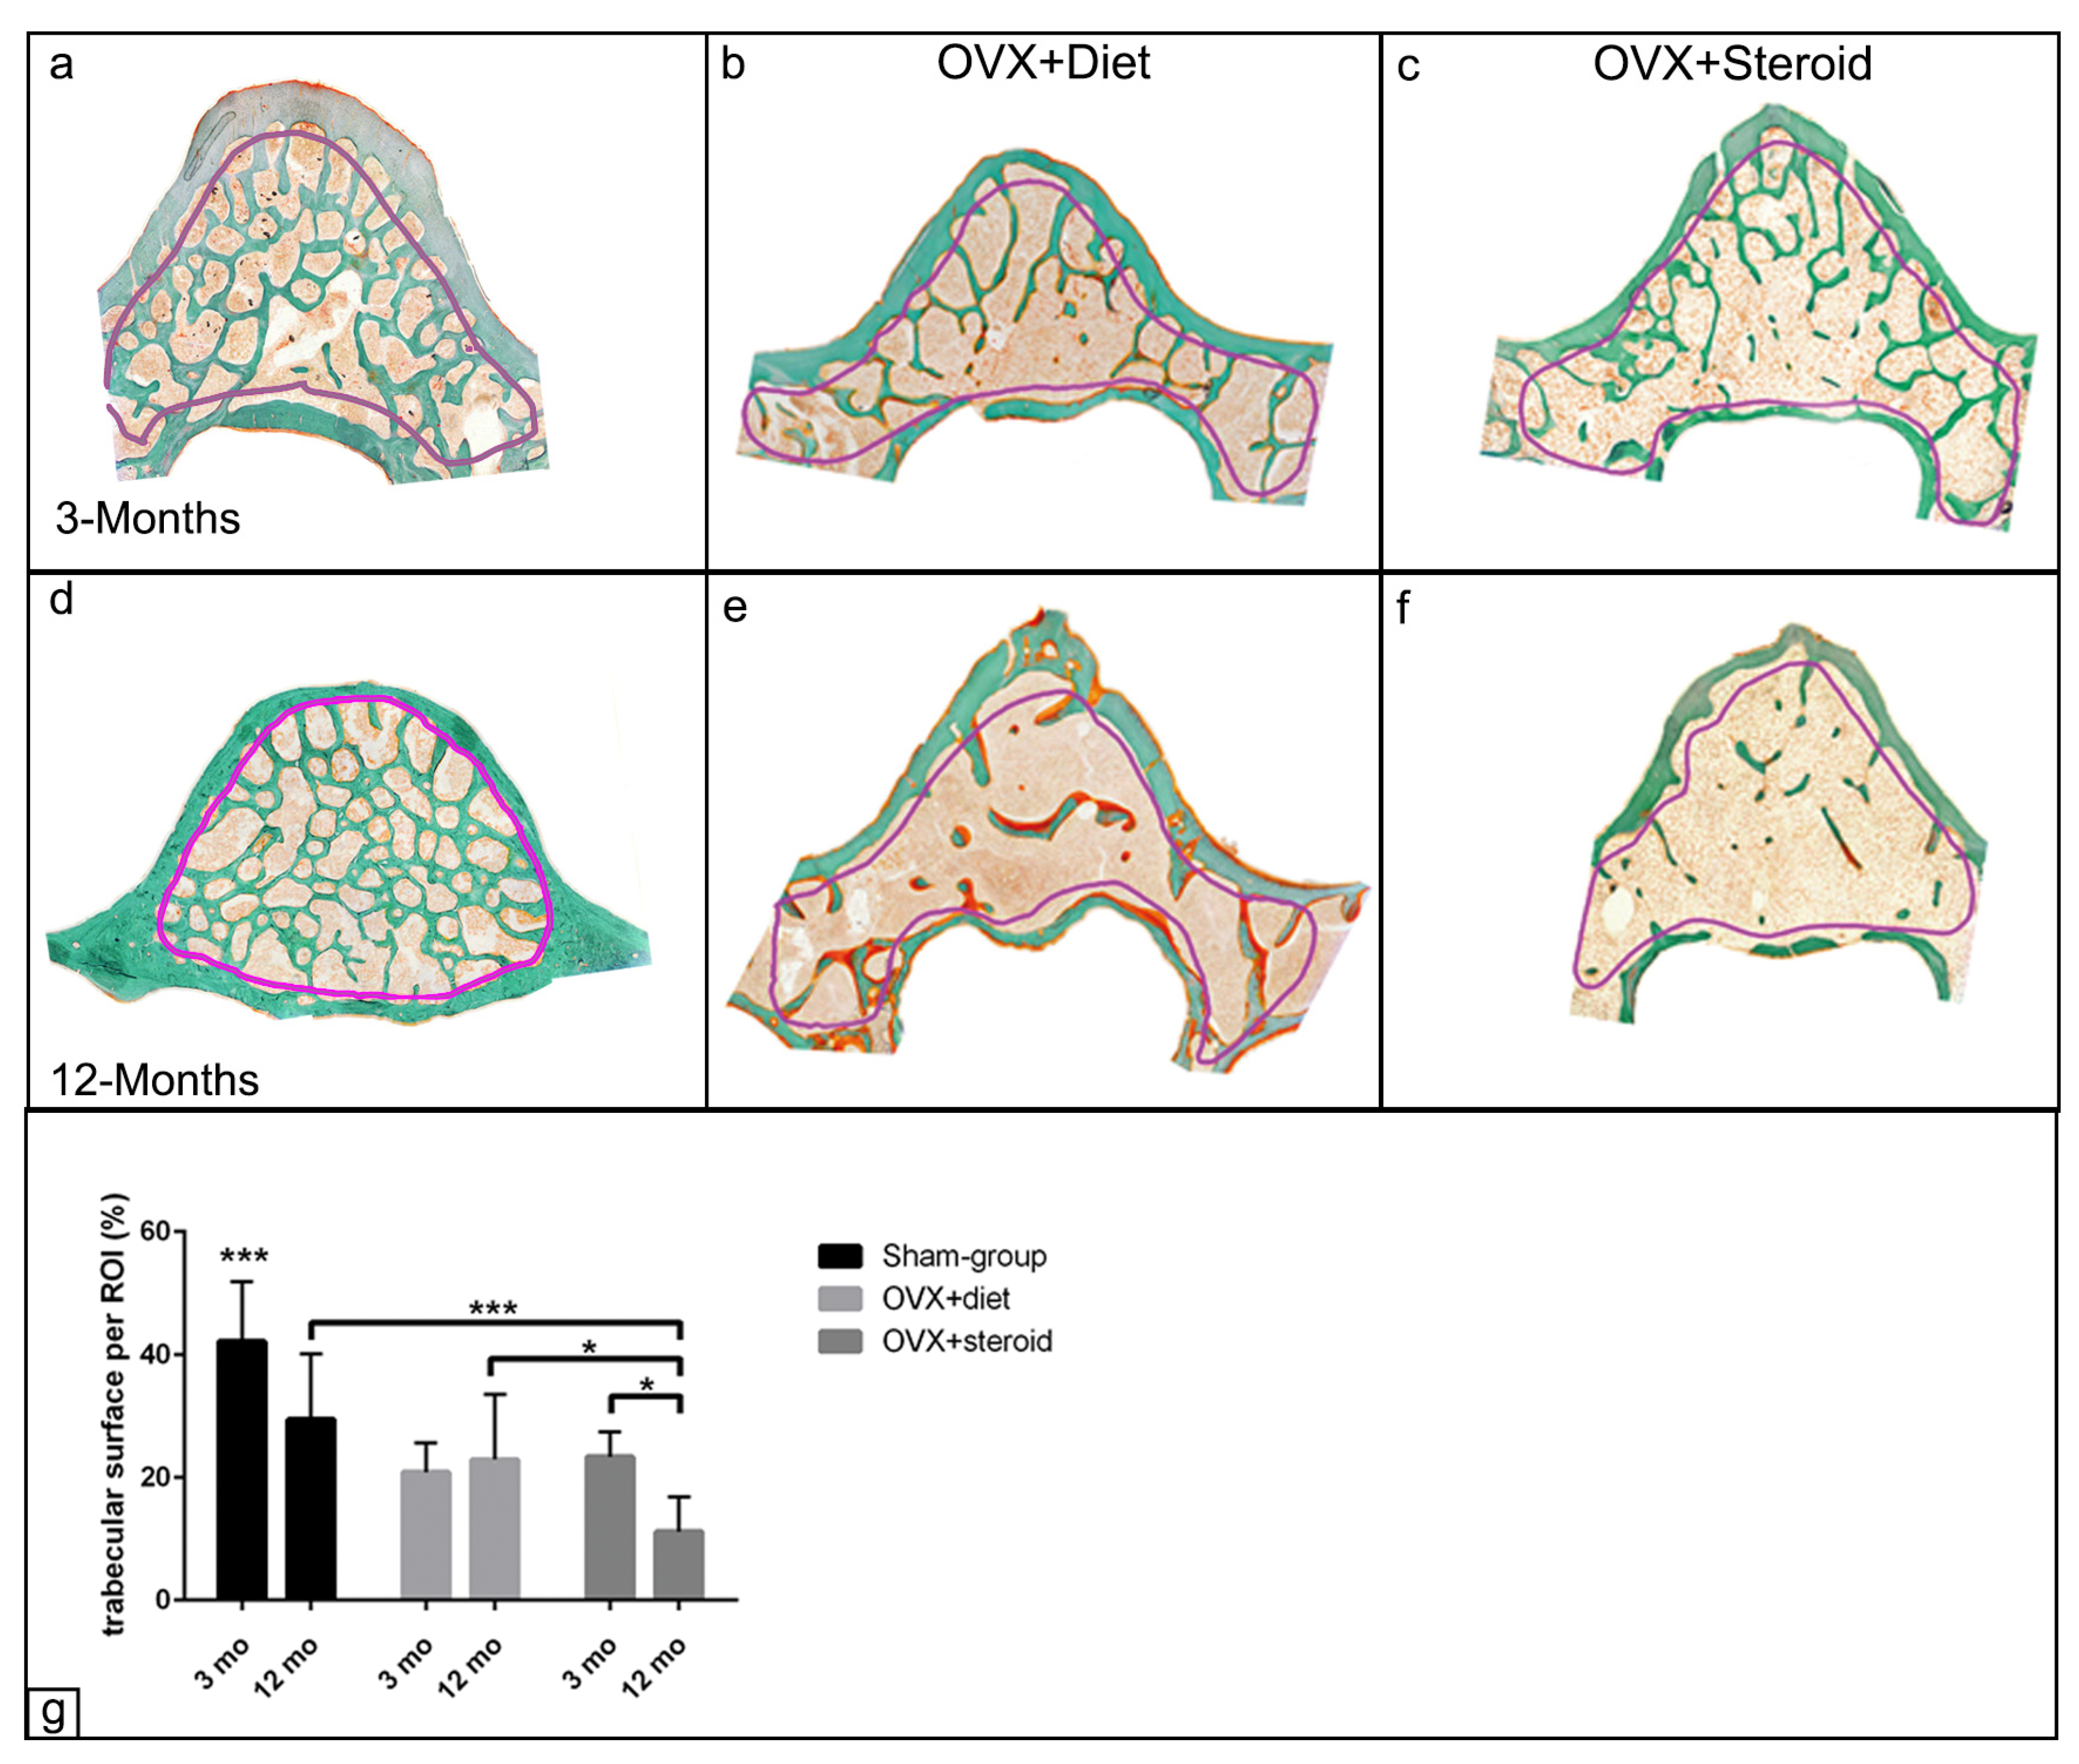
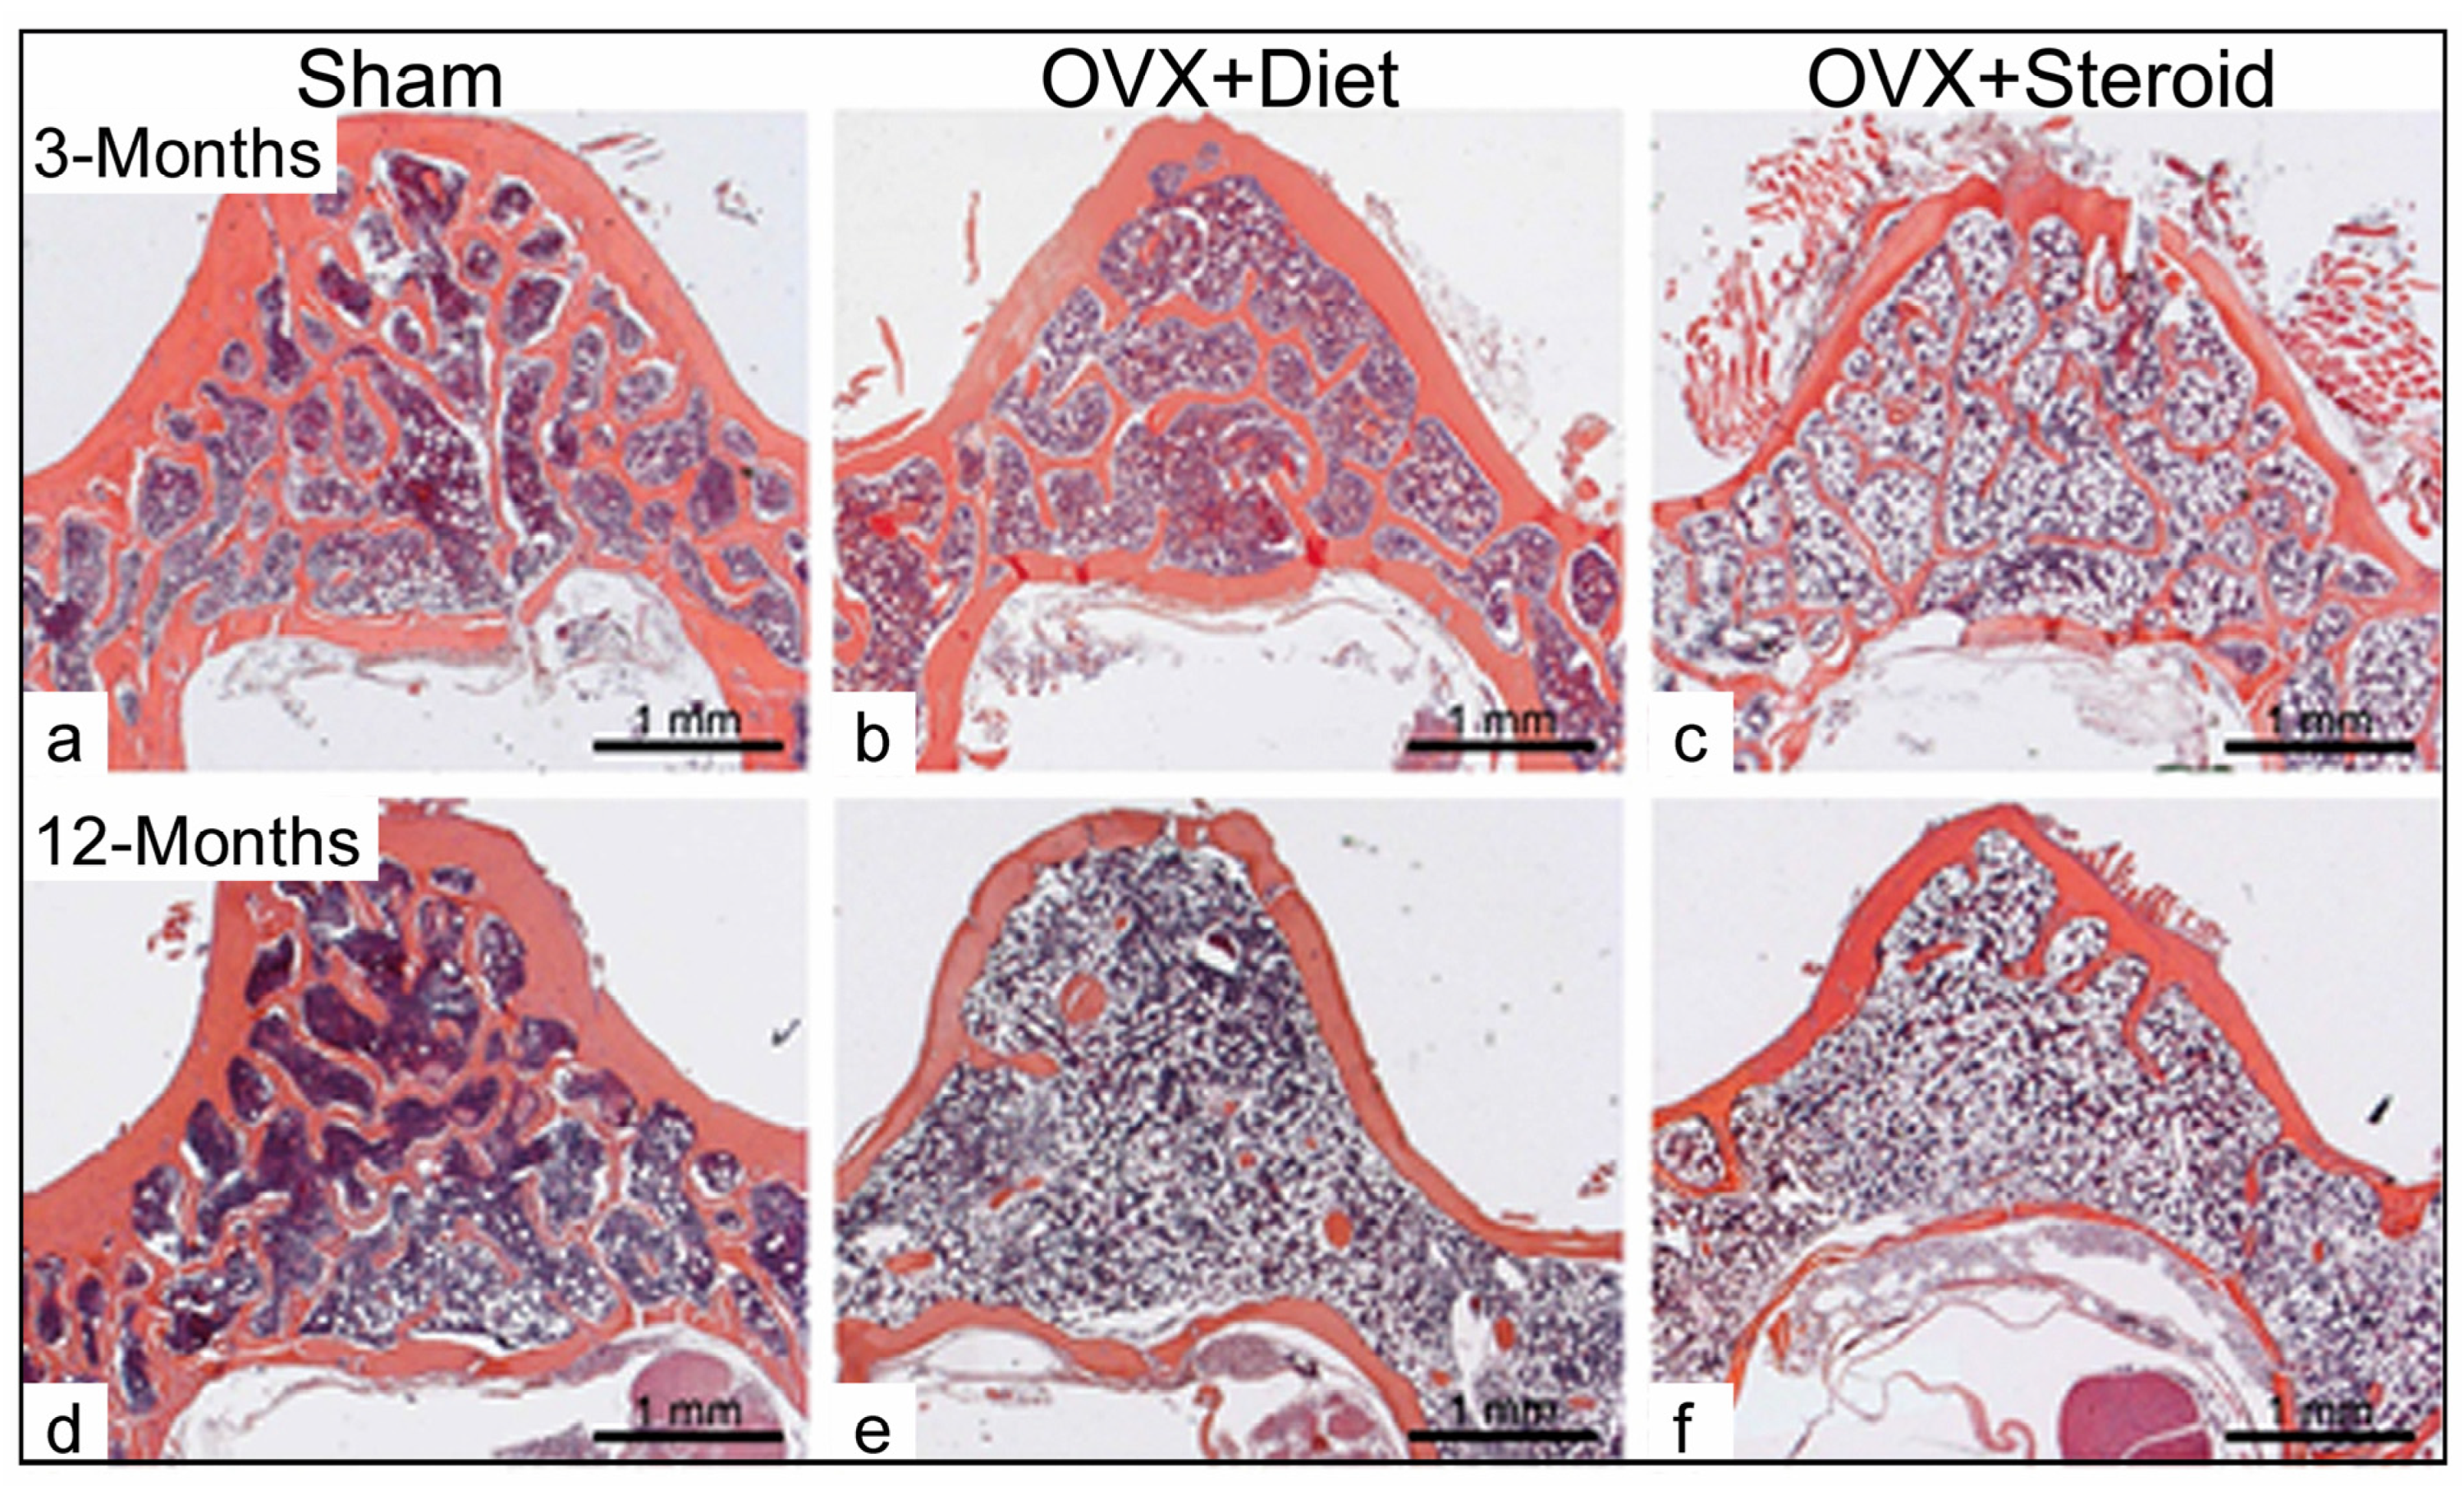
3.1. Alterations in Bone Architecture in the Osteoporotic Rat

The histologic profile of the L4 in the sham group demonstrated preserved trabecular structure over time, as shown by hematoxylin–eosin staining. The trabeculae were formed of a thick, continuous structure, even with a connection to the corticalis at both time points (Figure 1a,d). In contrast, the vertebrae of the two experimental groups (OVX+diet and OVX+steroid) exhibited clear morphological alterations of the trabeculae. At 3 months, the OVX+diet vertebrae showed fewer and thinner trabeculae, along with an abundance of adipocytes in the bone marrow, compared to the sham group. After 12 months, the trabecular structure was severely disrupted, and an incomplete trabecular network was observed, with the marrow cavity loaded with adipocytes (Figure 1b,e). The OVX+steroid group exhibited similar morphological changes with a thin trabecular network at 3 months. At 12 months, these observations were more prominent at 12 months in terms of an increase in short truncated trabeculae, some of which were completely lost in certain areas, together with a marked replacement of the medullary space with adipocytes (Figure 1c,f). To evaluate the collagen contents of the trabeculae for both experimental groups, picrosirrus red (PSR) staining was carried out. The results showed a significant reduction in the collagen staining intensity for both the OVX+diet and OVX+steroid groups compared to the sham group at both 3- and 12-month time points (Supplementary Figure S1b–f). The polarized microscope revealed a higher amount of collagen type III in the OVX+diet group after 3 months compared to both the sham and OVX+steroid groups (Supplementary Figure S1g–l). To assess the morphologic observations, the density of collagen content was quantified. Data analysis showed a significant reduction in the collagen contents of the bone trabeculae in the OVX+diet (p < 0.01)- and OVX+steroid (p < 0.001)-treated groups compared to the sham group at 3 months and 12 months. Additionally, there was a significant decrease in collagen content in the OVX+steroid group (p < 0.001) compared to the OVX+diet group after 3 months. A reduction in collagen content was also observed in all experimental groups, including the sham group (p < 0.001), when comparing 3 months to 12 months of treatment (Supplementary Figure S1m).
The change in the trabecular structure of the osteoporotic groups was even more evident after Masson–Goldner staining was carried out. A significant reduction in trabecular lamellae was observed between 3 and 12 months in the OVX+diet and OVX+steroid groups (Figure 2a–d). Furthermore, histomorphometry revealed that the trabecular area represented 42% of the ROI in the 3-month sham group. The OVX-diet and OVX-steroid groups exhibited a reduction of up to 50% in trabecular bone per ROI (p < 0.001) at 3 months compared to the sham group (Figure 2e). At 12 months, the OVX+steroid group showed a reduction in trabecular area (p < 0.001) compared to the sham group. There was no significant change in the trabecular area observed in the OVX+diet group when comparing 3 and 12 months. In contrast, a massive reduction in trabecular area in the OVX+steroid group at the 12 months was observed (p < 0.001 and p < 0.05) compared to both the sham group and the OVX+diet group at the same time point, respectively. Furthermore, the OVX+steroid group showed a time-dependent reduction in trabecular area (p < 0.05) when comparing the 3-month with 12-month measurements (Figure 2e).

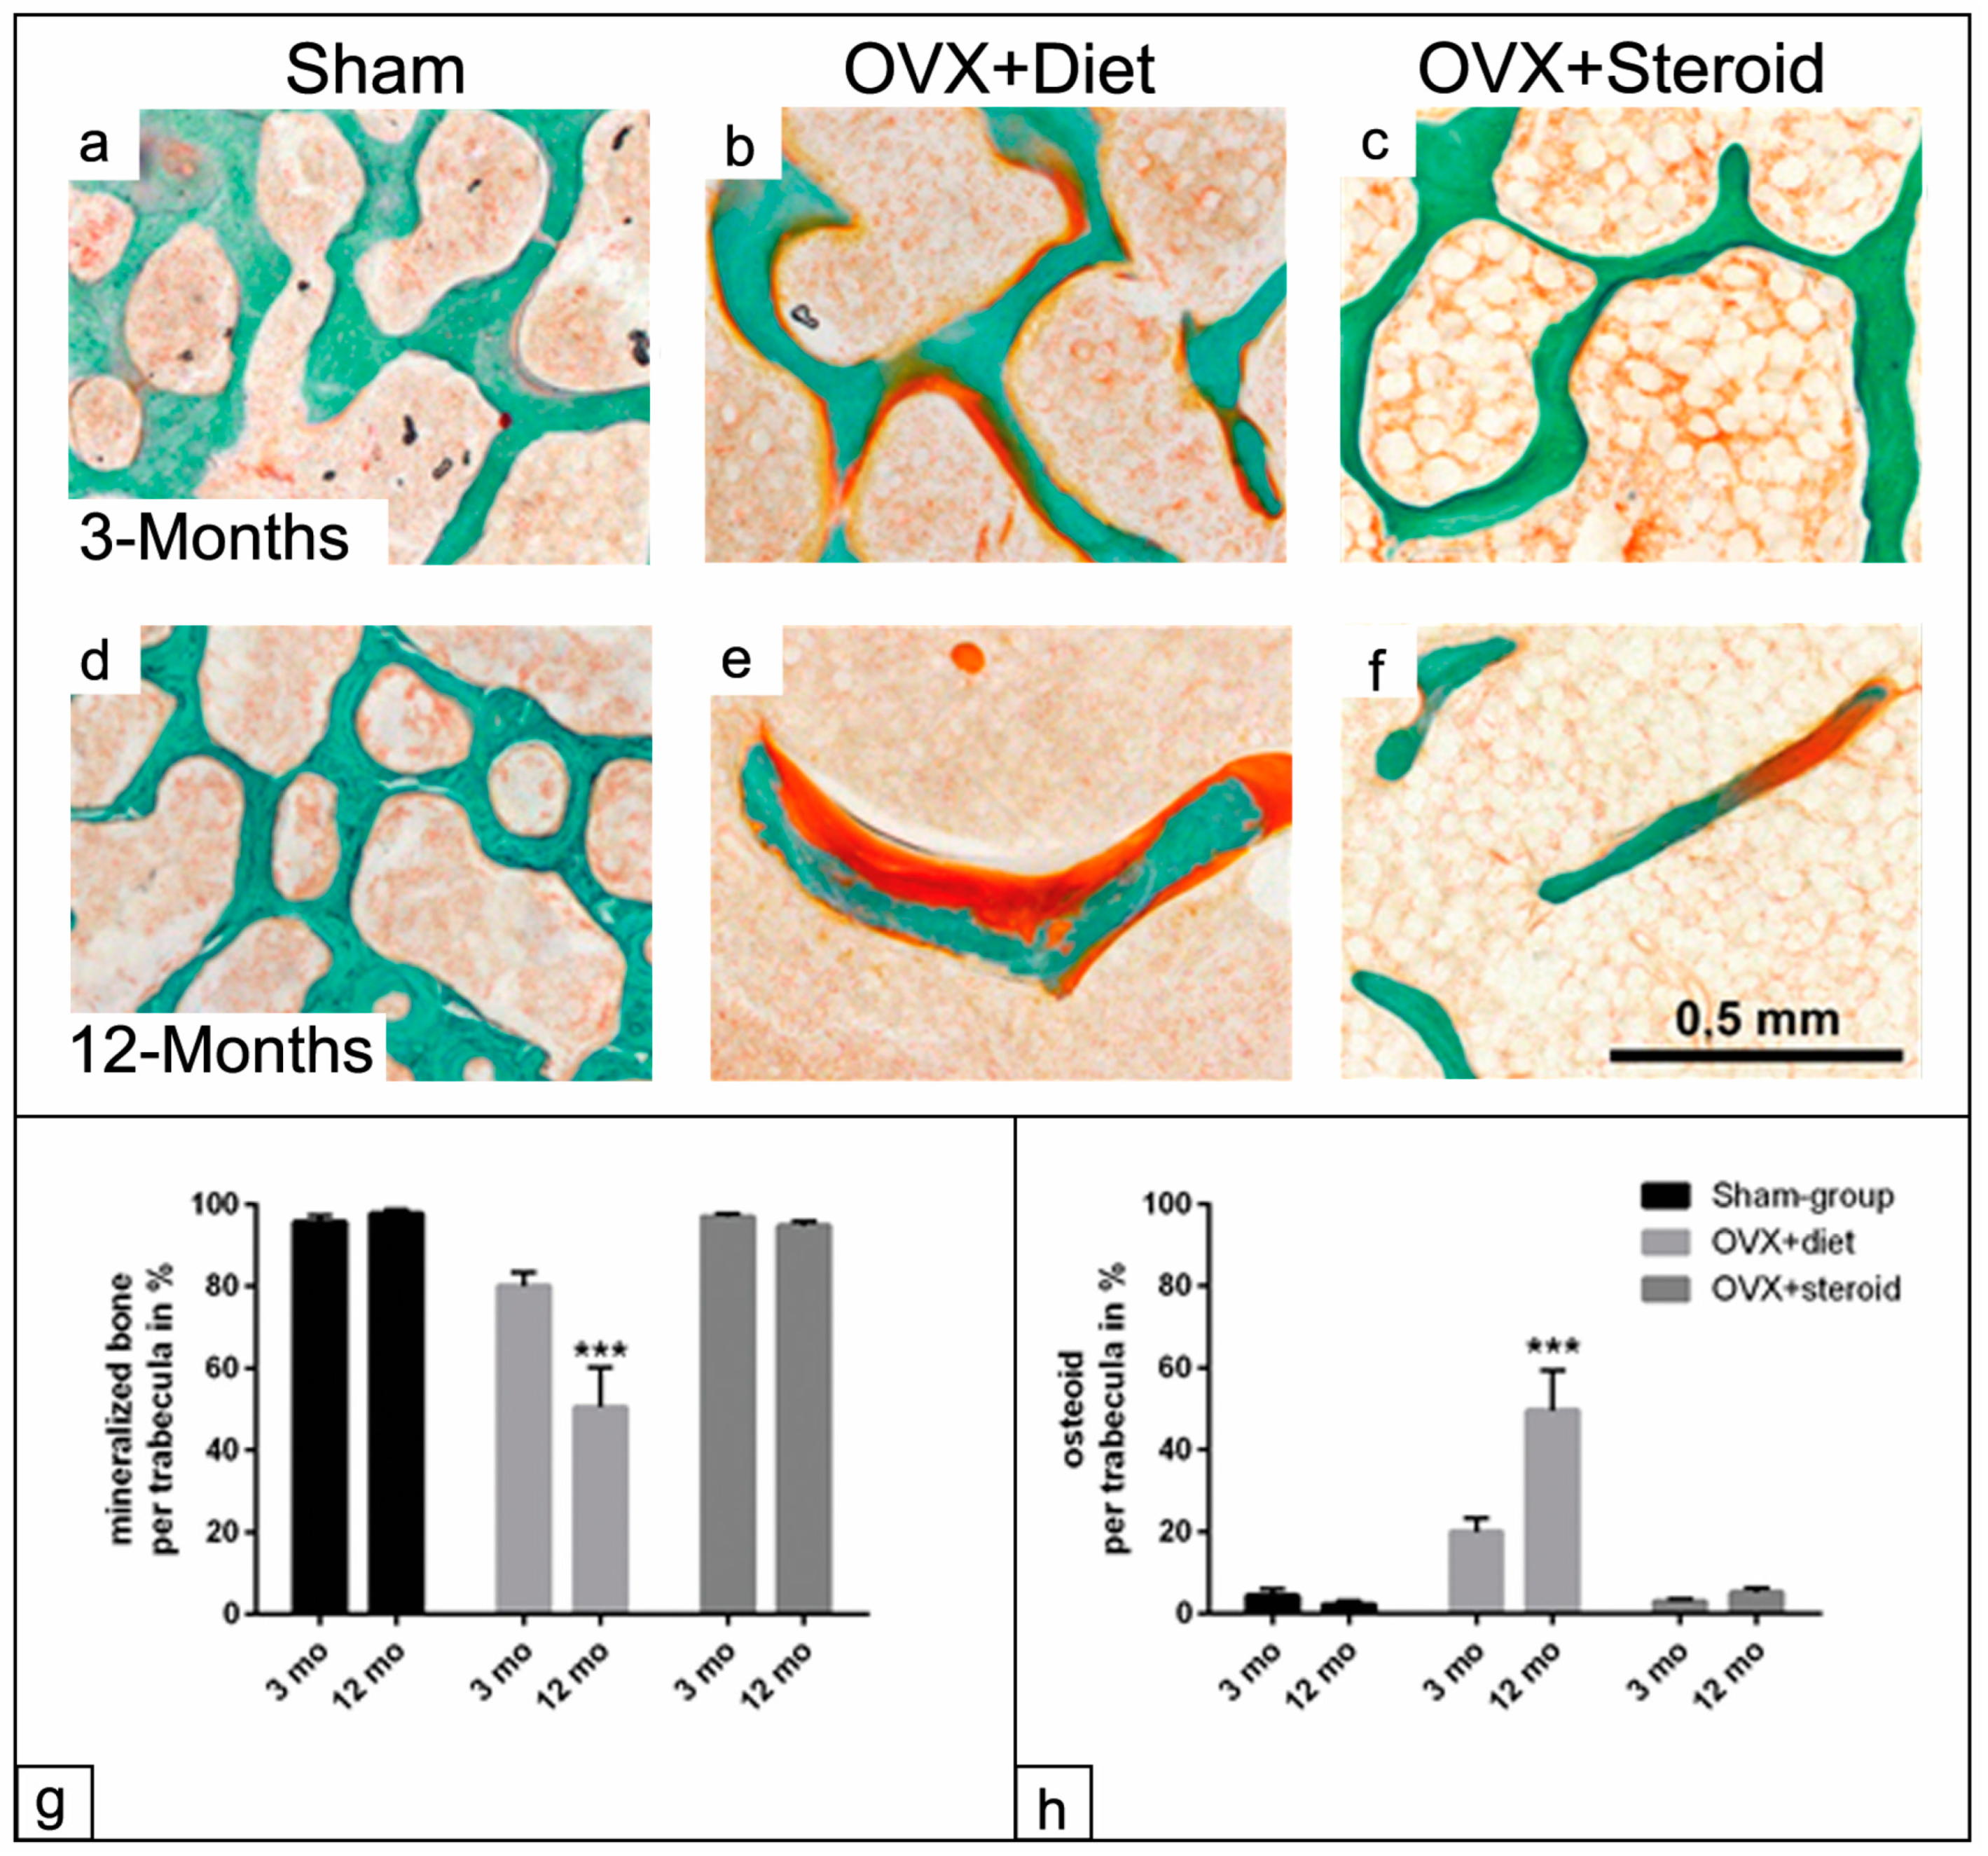
3.2. Mineralization Capacity of the Trabecular Surface in the Osteoporotic Rat

The mineralization capacity of all groups was analyzed using histomorphometry. The histological profile, as shown by Masson–Goldner staining, revealed complete mineralized trabecular contents in the sham group at both 3- and 12-month time points (Figure 3a,d). In comparison to the sham group, the OVX+steroid group exhibited thin mineralized trabeculae at 3 months and less mineralized disconnected trabeculae at 12 months (Figure 3c,f). In the OVX+diet group, focal areas of unmineralized trabeculae (osteoid) were observed at 3 months and became more apparent after 12 months in the same group (Figure 3b,e). Morphometric measurements revealed a reduction of approximately 20% in the mineralized contents of the trabecular surface area in the animals of the OVX+diet group after 3 months. At 12 months, the OVX+diet group exhibited a 50% reduction in the mineralized contents (p < 0.001) compared to the sham and OVX+steroid groups (Figure 3g). The analysis showed a significant increase in the percentage of osteoid components in the trabeculae of the OVX+diet group at 3 and 12 months (p < 0.001) compared to the other experimental groups (Figure 3h).

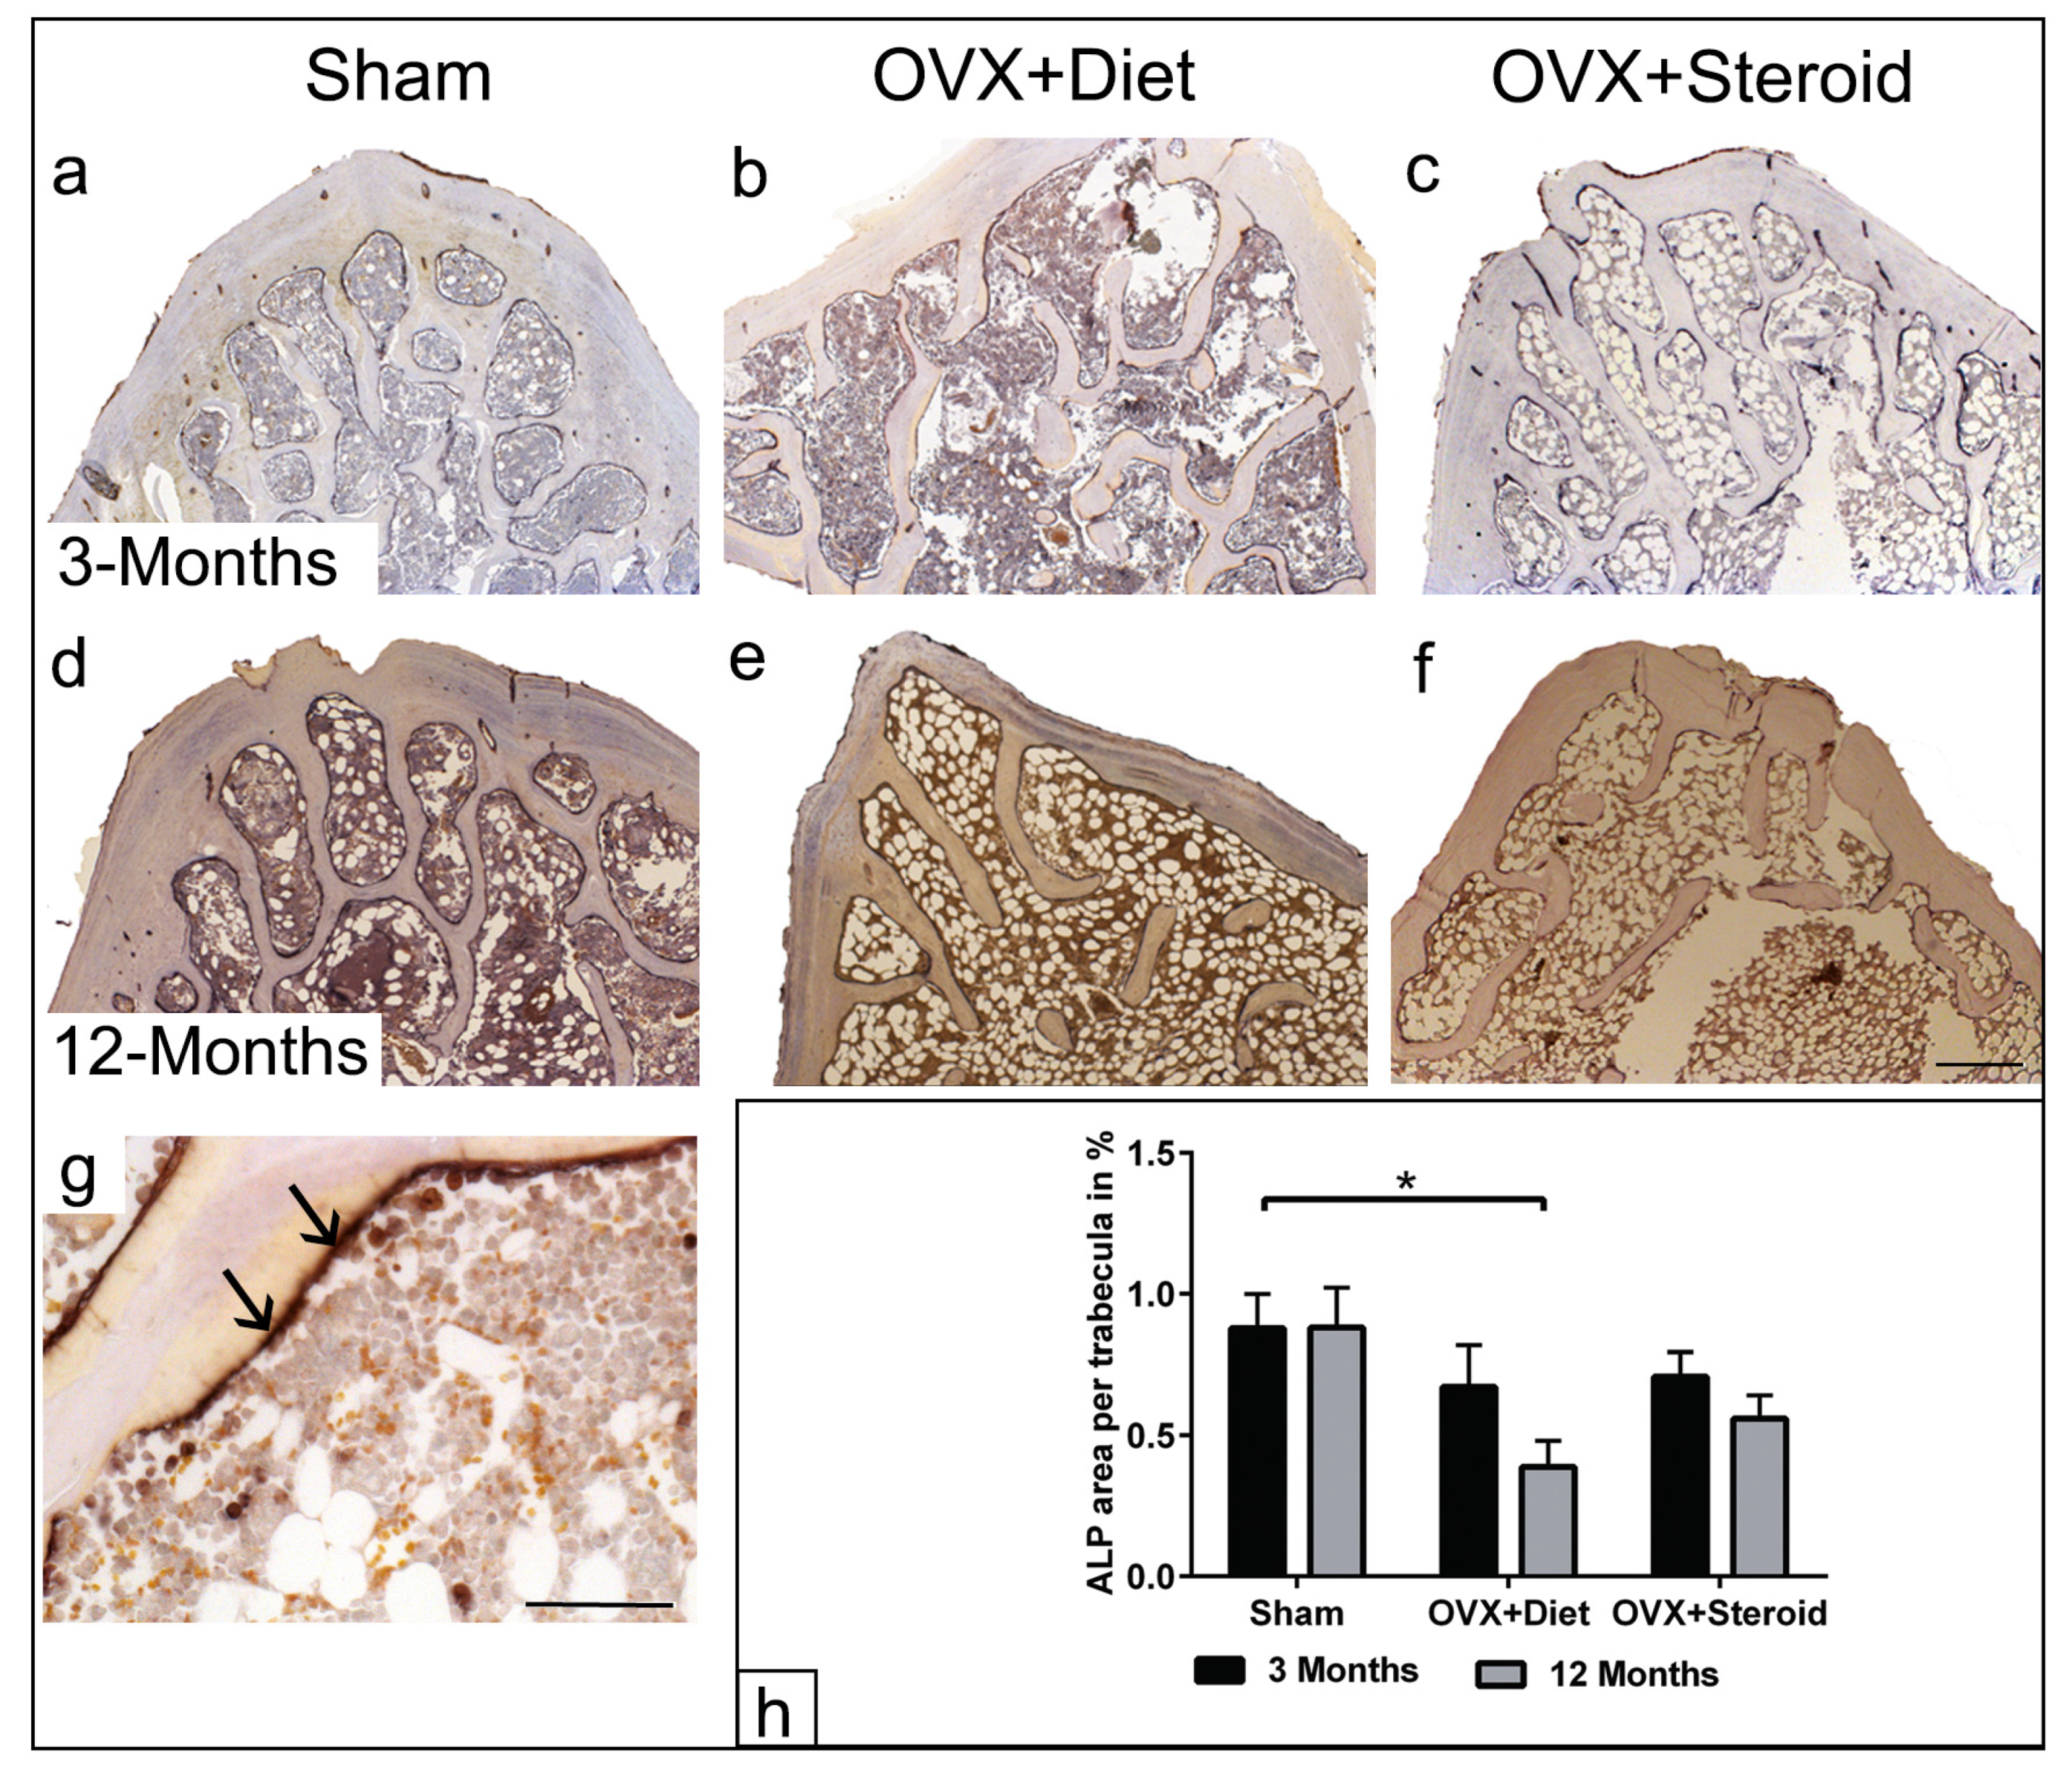
3.3. ALP Enzyme Histochemistry of Osteoblasts

The study examined the alkaline phosphatase (ALP) activity of osteoblasts as an indicator of their bone formation capacity. In the sham group, intense positive ALP staining was detected in the entire osteoblast area on the trabecular surface at 3 and 12 months (Figure 4a,d). ALP-positive staining was detected in the OVX+diet and OVX+steroid groups; however, the distribution pattern was significantly less pronounced compared to the sham group at 3 and 12 months. The ALP-positive staining showed disconnected stripes-like focal dots scattered along the surfaces of the trabecular bone (Figure 4b,c,e,f). Upon analysis of the positively stained area indicating ALP activity in relation to the trabecular surface (Figure 4g), the data revealed that approximately 0.9% of the trabecular surface was covered with positive ALP staining at 3 and 12 months in the sham group (Figure 4a,d). After 3 months, the staining was markedly reduced in both the OVX+diet and the OVX+steroid groups to 0.67% and 0.7%, respectively. After 12 months, the percentage of ALP-positive area decreased significantly up to 0.4% in the OVX+diet vertebrae (p < 0.001) compared to the sham group (Figure 4h). Although there were lower ALP activities in the OVX+steroid group, no statistical significance could be detected compared to the sham group.

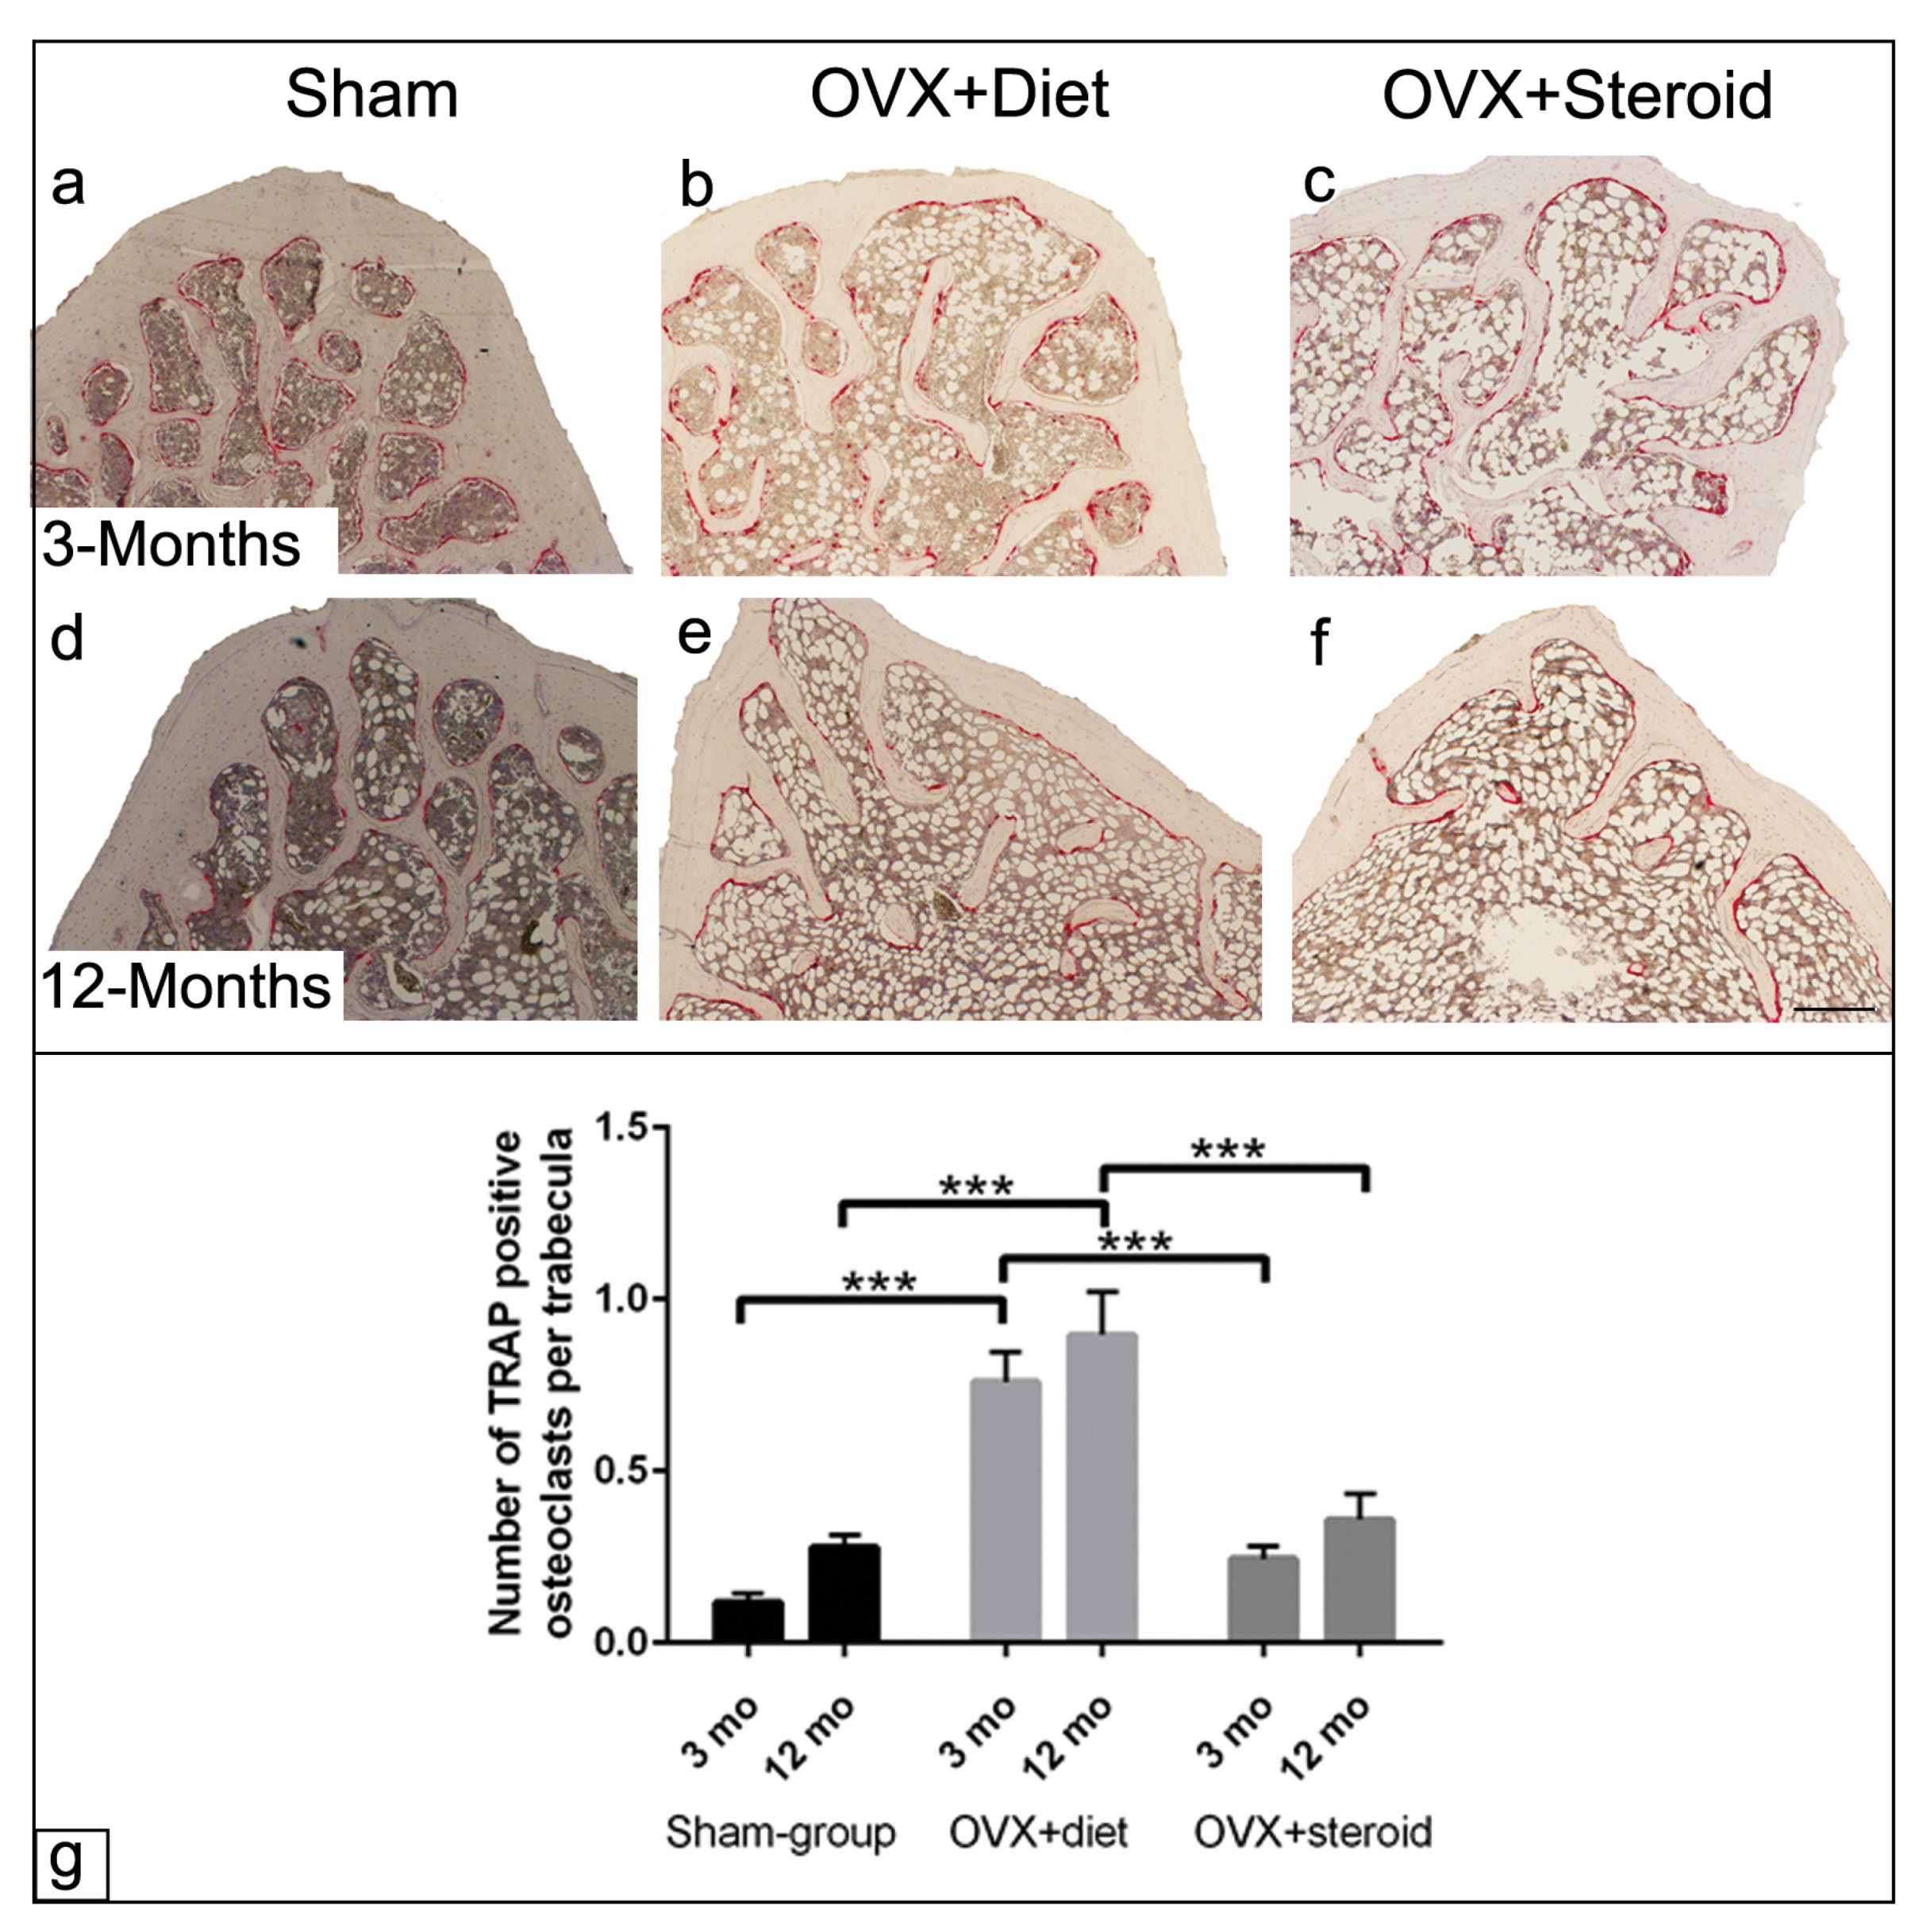
3.4. TRAP Activity of Osteoclasts by Enzyme Histochemistry

Multinucleated TRAP-positive osteoclasts were identified along the trabecular surfaces. Positive cells with more than three nuclei were considered TRAP-positive osteoclasts. The enzyme histochemical staining showed less TRAP staining in the sham group at 3 and 12 months (Figure 5a,d). In contrast, the OVX+diet and OVX+steroid groups showed more intensive TRAP-positive staining at 3 and 12 months, indicating the presence and distribution of osteoclasts (Figure 5b,c,e,f). The number of TRAP-positive osteoclasts at the bone surface was significantly higher in the OVX+diet group (p < 0.001) compared to the sham and OVX+steroid groups at both time points (Figure 5g). No significant differences were found between the sham group and OVX+steroid groups at both time points (Figure 5g).

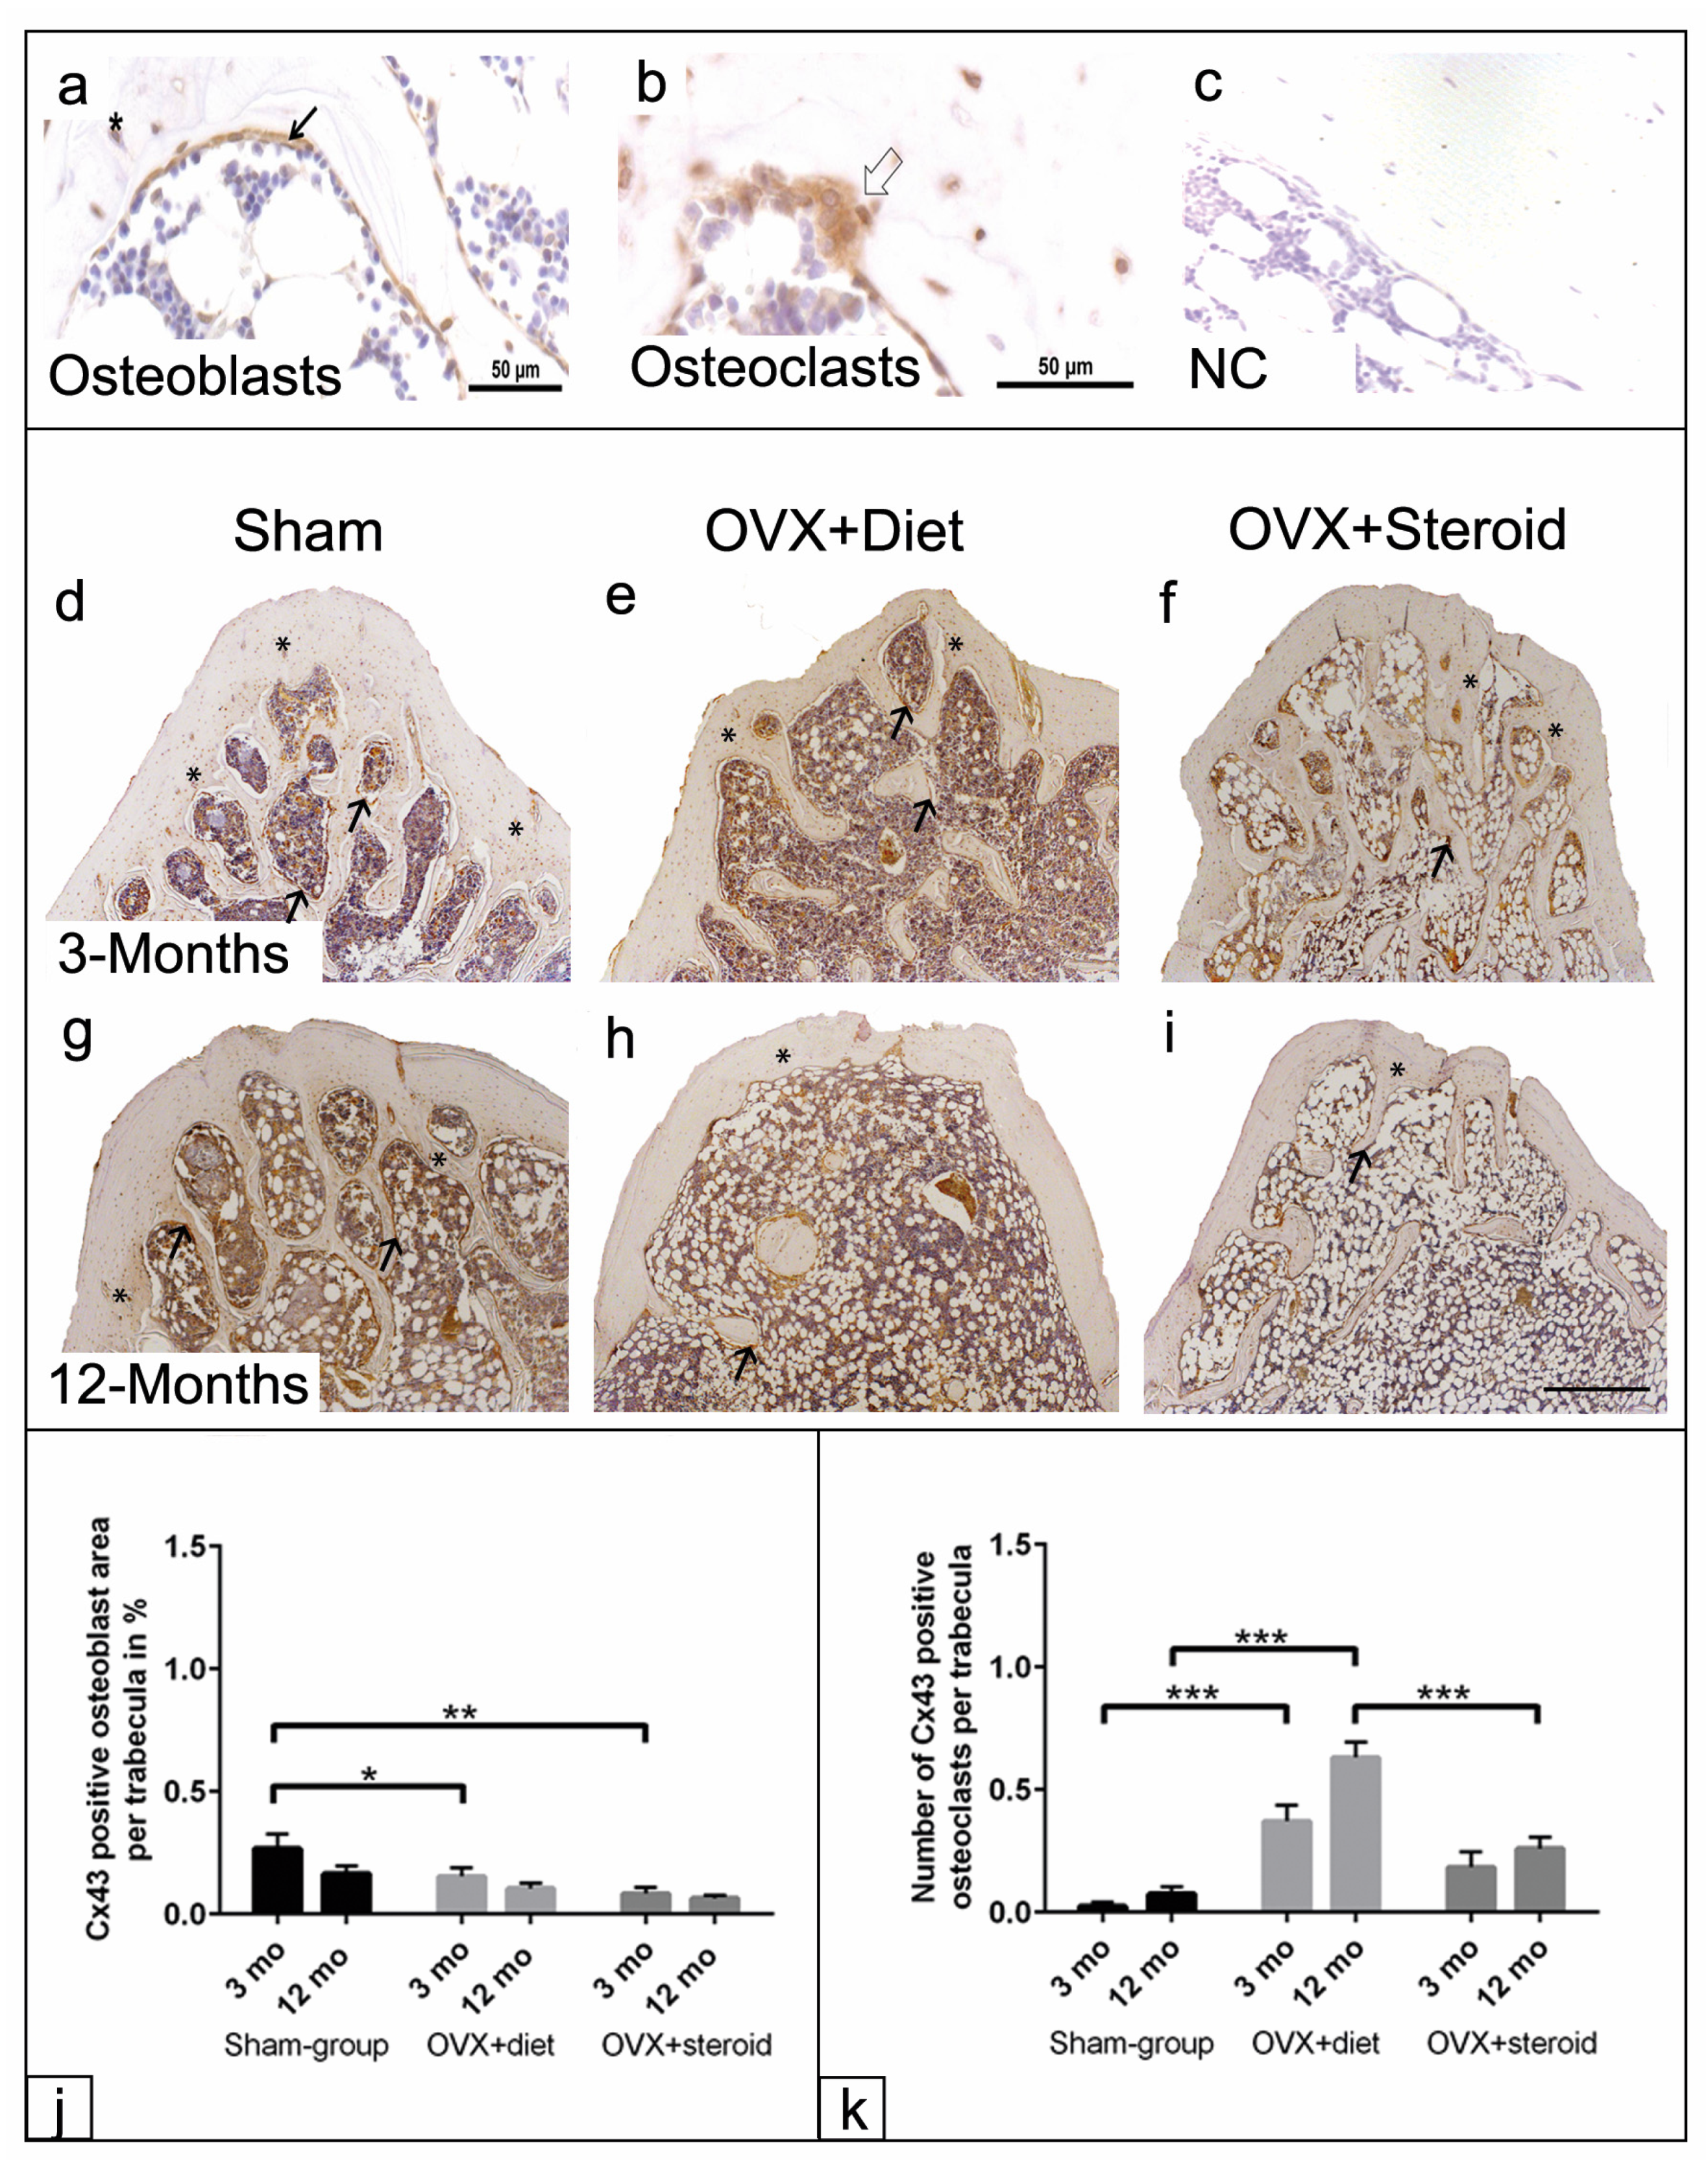
3.5. Cx43 Immunohistochemistry of Osteoblasts and Osteoclasts

Immunohistochemistry was used to determine the distribution of Cx43 in osteoblasts and osteoclasts (Figure 6a–c). Cx43 staining was observed in the cytoplasm of osteoblasts that covered the trabecular surface (Figure 6a). In osteoclasts, both cytoplasmic and membrane-bound Cx43 staining were detected (Figure 6b). The histological observation showed a significant increase in Cx43-positive signals in osteoblasts of the sham group (Figure 6d,g). In contrast, a marked reduction in Cx43 signals was observed in both experimental groups (Figure 6e,f,h,i). To confirm our histological observations, the percentage of Cx43-positive osteoblast area per trabecular surface was measured. The data analysis revealed an increase in the distribution of Cx43-positive osteoblasts area in the sham groups at 3 months (p < 0.05 and p < 0.01) compared to the OVX+diet and OVX+steroid groups, respectively. Although it was not significant, it is worth mentioning that the Cx43-positive osteoblasts area was reduced in all groups at 12 months compared to 3 months post-treatment (Figure 6j). Additionally, the number of osteoclasts positive for Cx43 was increased in the OVX+diet group at both time points (p < 0.001 and p < 0.001) compared to the sham group. When comparing the two treated groups, an increase in the number of Cx43-positive osteoclasts was only detected in the OVX+diet group at 12 months (p < 0.001) compared to the OVX+steroid group (Figure 6k).

4. Discussion

Selecting appropriate animal models for osteoporosis offers beneficial outcomes for understanding the disease´s mechanism, assessing biomaterials, and investigating fracture implants [24,25,26,27]. The present data demonstrate a reduction in trabecular composition in both experimental groups (OVX+diet and OVX+steroid), including various degrees of reduced mineralization and increases in unmineralized bone (osteoid). Furthermore, both osteoporosis induction approaches reduced the area of ALP activity per trabecula that was combined with decreased Cx43 signal in osteoblasts as well as increases in the number of Cx43-positive osteoclasts compared to the sham group. These data revealed that the alterations in Cx43 distribution among bone cells, coupled with changes in trabecular structure, suggest that Cx43 may contribute to the progression of osteoporosis and could serve as a valuable target for understanding the disease mechanism and enhancing bone remodeling.
The study data show that the trabecular surface area was significantly reduced in both experimental groups, similar to the condition of osteoporosis. Previous reports have concluded that osteoporosis leads to weaker bone strength [31] and a higher risk of fractures [32,33]. The present study revealed time-dependent differences in trabecular surface area between 3-month and 12-month groups. The sham group had a higher trabecular surface area initially but experienced a decrease from 3 to 12 months. Both groups induced with osteoporosis showed a significantly reduced trabecular surface area compared to the sham group. Furthermore, both the OVX+diet group and the OVX+steroid group exhibited a reduction in collagen density, in addition to trabecular loss, when compared to the sham group. This confirms other studies that demonstrated a decrease in trabecular area in the OVX+diet group in other vertebrae over this period [24]. Interestingly, an increase in trabecular area in the 3-month OVX+diet group was detected in the longitudinal bone of the femur and tibia [25]. The differences in results may be related to the different bones analyzed. A study found that physiological trabecular bone remodeling in rats results in decreased longitudinal bone growth, which begins 3–6 months later in longitudinal bones compared to vertebral bones [23]. The OVX+steroid group showed the most significant decrease in the trabecular area for up to 12 months compared to all other groups and time points. This reduction in the context of glucocorticoid-induced osteoporosis was also demonstrated with other parameters in the femur of rats [27]. By means of the µCT analysis, a reduction in the relative bone volume (%) in the femur of the rats with glucocorticoid-induced osteoporosis was previously reported [27]. In agreement with the present results, it has been found that corticosteroids alter bone metabolism, resulting in decreased bone formation and increased bone loss, similar to that observed in osteoporotic patients [34].
The evaluation of mineralization capacity and osteoid content showed that OVX+steroid group values are within the range of the sham group for both parameters. The data suggest enhanced bone loss in the OVX+steroid group rather than bone demineralization. A similar study has reported increased bone resorption with corticosteroid treatment in osteoporotic patients [34]. However, the OVX+diet group has a significantly reduced mineralization capacity, resulting in a significantly increased osteoid content. The presented results demonstrate distinct alterations in bone status, particularly in the OVX+diet group, similar to that observed in osteoporosis. These alterations include loss of trabecular surface, reduction in collagen content, and low mineralization capacity. In agreement with our results, it was concluded that such observed alterations in the OVX+diet group result from impaired bone remodeling, which is characterized by increased bone resorption and reduced bone formation [35]. In addition, the increased osteoid contents in OVX+diet have also been confirmed for other vertebrae [24] and femur of rats [26]. In the same line, the absence of estrogen as shown in the postmenopausal osteoporosis, combined with a deficiency in nutritional supplements for calcium, phosphorus, and vitamin D, enhances the process of bone demineralization in the OVX+diet condition. Previous studies revealed that estrogen deficiency enhanced bone fragility and reduced bone mineral density in OVX rats [36,37]. Moreover, the bone morphometric analysis exhibited a reduction in the trabecular number, thickness, and connectivity in OVX rats [38]. The data recommend that the OVX+diet rat model shows a clinical form similar to that observed in osteoporosis patients.
It is well established that gap junctions mediate the communication between the bone cells, specifically osteoclasts and osteoblasts, and Cx43 is the primary structural protein of gap junctions in bone [2,10,39]. A significant body of evidence has demonstrated the crucial role of Cx43 in maintaining healthy bone cells [39,40,41]. The purpose of this investigation is to evaluate the distribution pattern of Cx43 in the bone cells of osteoporotic rat models and to determine whether osteoporosis induction has a significant impact on Cx43 distribution. In the present study, the treatment of rats resulted in clear changes in Cx43 detection. After 12 months, a significant reduction in Cx43-positive osteoblasts was detected in both the OVX+diet and OVX+steroid groups. A moderate reduction was already demonstrated at an early stage of 3 months compared to the sham group. In addition, the reduced mineralization capacity in the OVX+diet was combined with the reduction in Cx43-positive areas and lower ALP activity. The data suggest that the reduction in Cx43 distribution results in failure of intercellular communication, low ALP activity, and impairment of the bone formation capacity. Consistent with this reduced osteoblast activity, the trabecular area was reduced in the OVX groups. In agreement with our data, similar studies revealed that the absence of Cx43 in osteoblasts reduces cortical bone thickness and density due to impairment of intercellular communication [42,43]. Furthermore, the lack of Cx43 results in reduced expression of osteoblastic markers, including osteocalcin and bone sialoprotein in osteoblastic cells [40,44,45]. The data demonstrated that osteoporosis induction altered Cx43 distribution in osteoblasts, which may affect intercellular signaling, leading to a reduction in ALP activity, cell survival, and functional properties of the osteoblasts. The data are inconsistent with previous reports that concluded that Cx43 maintains cellular communication, proliferation, and effective bone remodeling [1,16,46]. In agreement with our data, it was found that deletion of Cx43 in mice delays bone ossification, impairs osteoblast differentiation [15], and reduces bone density due to impairment of intercellular communication in osteoblasts [42,43,47]. A similar study has shown that altering the expression of both Cx43 and Cx45 in osteoblastic cells disrupts intercellular communication and modifies the transcriptional activity of osteoblast-specific promoters [40]. In addition, Cx43 dysfunction leads to bone alterations at the molecular level [48], which results in an imbalance between bone formation and bone resorption [1,42], leading to an inhibition of mineralization [46].
The data indicate changes in Cx43 distribution in osteoblasts in osteoporotic rats, as shown in the OVX+diet group with nutritional deficiencies of essential elements, including calcium, phosphorus, and vitamin D, which could result in loss of the trabecular bone, reduction in bone mineralization, and low collagen contents. Consistent with our hypothesis, it was found that Cx43 is essential for mediating the effect of parathyroid hormone on osteoblasts to maintain their survival [8]. In contrast, the deletion of Cx43 in osteoblasts hinders osteoblast differentiation and delays ossification [15].
The results indicate that the OVX+steroid group exhibited a greater reduction in Cx43 distribution compared to the OVX+diet group, which explains the enhanced bone resorption, trabecular loss, and less collagen content, as shown in the present data. This is consistent with the suppressive effects of glucocorticoids on osteoblastogenesis, resulting in reduced bone formation due to inhibition of the Akt/mammalian target of the rapamycin (mTOR) pathway, which interferes with Cx43 expression [49]. Furthermore, the administration of dexamethasone impairs communication among osteocytes, leading to the degradation of Cx43 and subsequent bone loss [50]. It can be assumed that the administration of glucocorticoids impairs Cx43 distribution in the osteoblasts of OVX+steroid rats, possibly by modifying the expression of the glucocorticoid receptor [49]. This resulted in decreased osteoblast viability and survival. In the same line, it was found that the administration of glucocorticoids in vitro causes rapid and significant suppression of osteoblastogenesis [51,52]. According to this, it might be assumed that the induction of osteoporosis by steroids in combination with ovariectomy strongly interferes with the formation of Cx43-based channels. This leads to the suppression of osteoblast differentiation and even survival.
Concomitant to the reduction in Cx43 in osteoblasts, the number of Cx43-positive osteoclasts significantly increased, particularly in the OVX+diet group at both time points compared to the sham group. A previous report from our group revealed that Cx43 plays a critical role in the migration and fusion of osteoclast progenitors during osteoclastogenesis [18]. Accordingly, it can be assumed that the significant increase in Cx43 was required to trigger osteoclast differentiation. Such stimulated osteoclastogenesis, as the data showed in the OVX+diet group, was combined with a reduced trabecular area, less collagen content, and impaired mineralization capacity; on the other hand, there was an increase in osteoid area and collagen III. These data outcomes and interpretations are consistent with the results of other bones, including the femur and tibia of osteoporosis-induced rats [25,26,27]. The data presented here showed a significant increase in Cx43-positive osteoclasts at 3 and 12 months in the OVX+diet group. It is possible that the increase in Cx43 expression was related to estrogen deficiency observed in the OVX+diet group and may be necessary for osteoclast differentiation. It is a well-established fact that the presence of estrogen inhibits osteoclastogenesis. After ovariectomy, the number of tartrate-resistant acid phosphatase (TRAP)-positive osteoclasts increases, causing pronounced bone turnover [53,54]. In accordance with our interpretation, it has been reported that the expression patterns of Cx43 and TRAP are correlated pathways that not only maintain intercellular communication but also orchestrate anabolic and catabolic actions of bone cells for efficient bone function [12]. During the course of osteoporosis induction, upregulation of osteoclast-specific markers, including receptor activator of nuclear factor kappa-B ligand (RANKL), matrix metalloproteinase-9 (MMP-9), and cathepsin, have been detected in the rat models currently in use [25,26,55]. This is indicative of enhanced bone turnover and remodeling activities.

5. Conclusions

The study reports the importance of Cx43 for bone homeostasis. The data revealed a reduction in Cx43 distribution in osteoblasts, particularly for the OVX+diet group. The alteration in Cx43 expression was combined with low ALP activity, which causes significant histomorphometric alterations in the trabecular components, less collagen density, and impaired mineralization capacity for both osteoporotic models for up to 12 months. The data revealed a combined increase in Cx43-positive osteoclasts together with increases in the number of TRAP-positive osteoclasts compared to the sham control, suggesting that Cx43 plays a role in enhanced osteoclastogenesis, as shown in osteoporotic patients. The data suggest that the OVX+diet rat is a more suitable model for investigating osteoporosis, similar to that observed in osteoporosis patients. Overall, alterations in Cx43 distribution among bone cells, coupled with changes in trabecular structure, suggest that Cx43 may contribute to the progression of osteoporosis and could serve as a beneficial target for enhancing bone remodeling.

Supplementary Materials

The following supporting information can be downloaded at: https://www.mdpi.com/article/10.3390/anatomia3020008/s1, Figure S1: Evaluation of the collagen content in the trabeculae of the lumber vertebrae of sham, OVX+diet, and OVX+steroid rats at 3 and 12 months after osteoporosis induction.

Author Contributions

Conceptualization, S.A., C.H., R.S. and S.W.; methodology, A.E. and S.S.; software, A.E., K.G. and S.S.; validation, S.W., C.H., S.A., R.S. and M.I.E.; formal analysis, K.G., A.E., S.S. and M.I.E.; investigation, A.E. and S.S.; resources, K.G. and A.E.; data curation, A.E., S.S. and K.G.; writing—original draft preparation, K.G. and A.E.; writing—review and editing, C.H., R.S., S.W., S.A. and M.I.E.; visualization, S.W. and S.A.; supervision, S.W. and R.S.; project administration, C.H., S.W. and S.A.; funding acquisition, S.W. and S.A. All authors have read and agreed to the published version of the manuscript.

Funding

This research was funded by the German Research Foundation (DFG), project number: 107540325 (Collaborative Research Center Transregio 79 (materials for tissue regeneration in systemically altered bone, subproject T1, B4, B5)), the Egyptian Ministry of Higher Education, and the Deutscher Akademischer Austauschdienst (DAAD).

Institutional Review Board Statement

The study was conducted in accordance with the Justus-Liebig-University of Giessen institutional ethics committee and approved by the ethical commission of the local government institution (permission number: 89/2009) under the subproject T1 of the collaboration research center Transregio 79 (materials for regeneration of systemically altered bone).

Informed Consent Statement

Not applicable.

Data Availability Statement

Raw data are available from the corresponding author upon reasonable request. Data are unavailable due to privacy.

Acknowledgments

Special thanks is given to Anne Hild for technical support.

Conflicts of Interest

The authors declare no conflicts of interest. The funders had no role in the design of the study; in the collection, analyses, or interpretation of data; in the writing of the manuscript; or in the decision to publish the results.

References

  1. Zappitelli, T.; Aubin, J.E. The “connexin” between bone cells and skeletal functions. J. Cell. Biochem. 2014, 115, 1646–1658. [Google Scholar] [CrossRef] [PubMed]
  2. Stains, J.P.; Civitelli, R. Gap junctions in skeletal development and function. Biochim. Biophys. Acta 2005, 1719, 69–81. [Google Scholar] [CrossRef] [PubMed]
  3. Grabowski, P. Physiology of Bone. Endocr. Dev. 2015, 28, 33–55. [Google Scholar] [CrossRef]
  4. Brandi, M.L. Microarchitecture, the key to bone quality. Rheumatology 2009, 48 (Suppl. S4), iv3–iv8. [Google Scholar] [CrossRef] [PubMed]
  5. Bonucci, E.; Ballanti, P. Osteoporosis-bone remodeling and animal models. Toxicol. Pathol. 2014, 42, 957–969. [Google Scholar] [CrossRef] [PubMed]
  6. Johnell, O.; Kanis, J.A. An estimate of the worldwide prevalence and disability associated with osteoporotic fractures. Osteoporos. Int. 2006, 17, 1726–1733. [Google Scholar] [CrossRef]
  7. Sanches, D.S.; Pires, C.G.; Fukumasu, H.; Cogliati, B.; Matsuzaki, P.; Chaible, L.M.; Torres, L.N.; Ferrigno, C.R.A.; Dagli, M.L.Z. Expression of connexins in normal and neoplastic canine bone tissue. Vet. Pathol. 2009, 46, 846–859. [Google Scholar] [CrossRef] [PubMed]
  8. Plotkin, L.I. Connexin 43 and bone: Not just a gap junction protein. Actual. Osteol. 2011, 7, 79–90. [Google Scholar]
  9. Hu, Z.; Riquelme, M.A.; Gu, S.; Jiang, J.X. Regulation of Connexin Gap Junctions and Hemichannels by Calcium and Calcium Binding Protein Calmodulin. Int. J. Mol. Sci. 2020, 21, 8194. [Google Scholar] [CrossRef]
  10. Plotkin, L.I. Connexin 43 hemichannels and intracellular signaling in bone cells. Front. Physiol. 2014, 5, 131. [Google Scholar] [CrossRef]
  11. Riquelme, M.A.; Cardenas, E.R.; Xu, H.; Jiang, J.X. The Role of Connexin Channels in the Response of Mechanical Loading and Unloading of Bone. Int. J. Mol. Sci. 2020, 21, 1146. [Google Scholar] [CrossRef] [PubMed]
  12. Buo, A.M.; Stains, J.P. Gap junctional regulation of signal transduction in bone cells. FEBS Lett. 2014, 588, 1315–1321. [Google Scholar] [CrossRef]
  13. Wagner, A.-S.; Glenske, K.; Wolf, V.; Fietz, D.; Mazurek, S.; Hanke, T.; Moritz, A.; Arnhold, S.; Wenisch, S. Osteogenic differentiation capacity of human mesenchymal stromal cells in response to extracellular calcium with special regard to connexin 43. Ann. Anat. 2017, 209, 18–24. [Google Scholar] [CrossRef] [PubMed]
  14. Wagner, A.-S.; Glenske, K.; Henß, A.; Kruppke, B.; Rößler, S.; Hanke, T.; Moritz, A.; Rohnke, M.; Kressin, M.; Arnhold, S.; et al. Cell behavior of human mesenchymal stromal cells in response to silica/collagen based xerogels and calcium deficient culture conditions. Biomed. Mater. 2017, 12, 45003. [Google Scholar] [CrossRef]
  15. Lecanda, F.; Warlow, P.M.; Sheikh, S.; Furlan, F.; Steinberg, T.H.; Civitelli, R. Connexin 43 deficiency causes delayed ossification, craniofacial abnormalities, and osteoblast dysfunction. J. Cell Biol. 2000, 151, 931–944. [Google Scholar] [CrossRef] [PubMed]
  16. Watkins, M.; Grimston, S.K.; Norris, J.Y.; Guillotin, B.; Shaw, A.; Beniash, E.; Civitelli, R. Osteoblast connexin43 modulates skeletal architecture by regulating both arms of bone remodeling. Mol. Biol. Cell 2011, 22, 1240–1251. [Google Scholar] [CrossRef] [PubMed]
  17. Matemba, S.F.; Lie, A.; Ransjö, M. Regulation of osteoclastogenesis by gap junction communication. J. Cell. Biochem. 2006, 99, 528–537. [Google Scholar] [CrossRef]
  18. Glenske, K.; Wagner, A.-S.; Hanke, T.; Cavalcanti-Adam, E.A.; Heinemann, S.; Heinemann, C.; Kruppke, B.; Arnhold, S.; Moritz, A.; Schwab, E.H.; et al. Bioactivity of xerogels as modulators of osteoclastogenesis mediated by connexin 43. Biomaterials 2014, 35, 1487–1495. [Google Scholar] [CrossRef]
  19. Wenisch, S.; Cavalcanti-Adam, E.A.; Tryankowski, E.; Raabe, O.; Kilian, O.; Heiss, C.; Alt, V.; Arnhold, S.; Schnettler, R. Light- and transmission-electron-microscopic investigations on distribution of CD44, connexin 43 and actin cytoskeleton during the foreign body reaction to a nanoparticular hydroxyapatite in mini-pigs. Acta biomaterialia 2012, 8, 2807–2814. [Google Scholar] [CrossRef]
  20. Herde, K.; Hartmann, S.; Brehm, R.; Kilian, O.; Heiss, C.; Hild, A.; Alt, V.; Bergmann, M.; Schnettler, R.; Wenisch, S. Connexin 43 expression of foreign body giant cells after implantation of nanoparticulate hydroxyapatite. Biomaterials 2007, 28, 4912–4921. [Google Scholar] [CrossRef]
  21. Batra, N.; Kar, R.; Jiang, J.X. Gap junctions and hemichannels in signal transmission, function and development of bone. Biochim. Biophys. Acta 2012, 1818, 1909–1918. [Google Scholar] [CrossRef] [PubMed]
  22. Lelovas, P.P.; Xanthos, T.T.; Thoma, S.E.; Lyritis, G.P.; Dontas, I.A. The laboratory rat as an animal model for osteoporosis research. Comp. Med. 2008, 58, 424–430. [Google Scholar]
  23. Yousefzadeh, N.; Kashfi, K.; Jeddi, S.; Ghasemi, A. Ovariectomized rat model of osteoporosis: A practical guide. EXCLI J. 2020, 19, 89–107. [Google Scholar] [CrossRef] [PubMed]
  24. El Khassawna, T.; Böcker, W.; Brodsky, K.; Weisweiler, D.; Govindarajan, P.; Kampschulte, M.; Thormann, U.; Henss, A.; Rohnke, M.; Bauer, N.; et al. Impaired extracellular matrix structure resulting from malnutrition in ovariectomized mature rats. Histochem. Cell Biol. 2015, 144, 491–507. [Google Scholar] [CrossRef] [PubMed]
  25. El Khassawna, T.; Böcker, W.; Govindarajan, P.; Schliefke, N.; Hürter, B.; Kampschulte, M.; Schlewitz, G.; Alt, V.; Lips, K.S.; Faulenbach, M.; et al. Effects of multi-deficiencies-diet on bone parameters of peripheral bone in ovariectomized mature rat. PLoS ONE 2013, 8, e71665. [Google Scholar] [CrossRef] [PubMed]
  26. Govindarajan, P.; Böcker, W.; El Khassawna, T.; Kampschulte, M.; Schlewitz, G.; Huerter, B.; Sommer, U.; Dürselen, L.; Ignatius, A.; Bauer, N.; et al. Bone matrix, cellularity, and structural changes in a rat model with high-turnover osteoporosis induced by combined ovariectomy and a multiple-deficient diet. Am. J. Pathol. 2014, 184, 765–777. [Google Scholar] [CrossRef] [PubMed]
  27. Govindarajan, P.; Khassawna, T.; Kampschulte, M.; Böcker, W.; Huerter, B.; Dürselen, L.; Faulenbach, M.; Heiss, C. Implications of combined ovariectomy and glucocorticoid (dexamethasone) treatment on mineral, microarchitectural, biomechanical and matrix properties of rat bone. Int. J. Exp. Pathol. 2013, 94, 387–398. [Google Scholar] [CrossRef] [PubMed]
  28. Goergen, J.; Wenisch, S.; Raabe, O.; Moritz, A.; Schlewitz, G.; Schnettler, R.; Hempel, U.; Heiss, C.; Arnhold, S. Characterization of Bone-Marrow-Derived Stem Cells in Osteoporotic Models of the Rat. ISRN Stem Cells 2013, 2013, 262451. [Google Scholar] [CrossRef]
  29. Heiss, C.; Govindarajan, P.; Schlewitz, G.; Hemdan, N.Y.A.; Schliefke, N.; Alt, V.; Thormann, U.; Lips, K.S.; Wenisch, S.; Langheinrich, A.C.; et al. Induction of osteoporosis with its influence on osteoporotic determinants and their interrelationships in rats by DEXA. Med. Sci. Monit. 2012, 18, BR199–BR207. [Google Scholar] [CrossRef]
  30. Donath, K.; Breuner, G. A method for the study of undecalcified bones and teeth with attached soft tissues. The Säge-Schliff (sawing and grinding) technique. J. Oral Pathol. 1982, 11, 318–326. [Google Scholar] [CrossRef]
  31. Schwartz, A.V. Marrow fat and bone: Review of clinical findings. Front. Endocrinol. 2015, 6, 40. [Google Scholar] [CrossRef]
  32. Curtis, E.M.; Dennison, E.M.; Cooper, C.; Harvey, N.C. Osteoporosis in 2022: Care gaps to screening and personalised medicine. Best Pract. Res. Clin. Rheumatol. 2022, 36, 101754. [Google Scholar] [CrossRef] [PubMed]
  33. Gkastaris, K.; Goulis, D.G.; Potoupnis, M.; Anastasilakis, A.D.; Kapetanos, G. Obesity, osteoporosis and bone metabolism. J. Musculoskelet. Neuronal Interact. 2020, 20, 372–381. [Google Scholar] [PubMed]
  34. Egermann, M.; Goldhahn, J.; Schneider, E. Animal models for fracture treatment in osteoporosis. Osteoporos. Int. 2005, 16 (Suppl. S2), S129–S138. [Google Scholar] [CrossRef]
  35. Abdelfattah Abulfadle, K.; Refaat Abdelkader Atia, R.; Osama Mohammed, H.; Saad Ramadan, R.; Mohammed, N.A. The potential anti-osteoporotic effect of exercise-induced increased preptin level in ovariectomized rats. Anat. Sci. Int. 2023, 98, 22–35. [Google Scholar] [CrossRef] [PubMed]
  36. Kalu, D.N. The ovariectomized rat model of postmenopausal bone loss. Bone Miner. 1991, 15, 175–191. [Google Scholar] [CrossRef] [PubMed]
  37. Takano-Yamamoto, T.; Rodan, G.A. Direct effects of 17 beta-estradiol on trabecular bone in ovariectomized rats. Proc. Natl. Acad. Sci. USA 1990, 87, 2172–2176. [Google Scholar] [CrossRef] [PubMed]
  38. Wronski, T.J.; Lowry, P.L.; Walsh, C.C.; Ignaszewski, L.A. Skeletal alterations in ovariectomized rats. Calcif. Tissue Int. 1985, 37, 324–328. [Google Scholar] [CrossRef] [PubMed]
  39. Green, C.R.; Bowles, L.; Crawley, A.; Tickle, C. Expression of the connexin43 gap junctional protein in tissues at the tip of the chick limb bud is related to the epithelial-mesenchymal interactions that mediate morphogenesis. Dev. Biol. 1994, 161, 12–21. [Google Scholar] [CrossRef] [PubMed]
  40. Lecanda, F.; Towler, D.A.; Ziambaras, K.; Cheng, S.L.; Koval, M.; Steinberg, T.H.; Civitelli, R. Gap junctional communication modulates gene expression in osteoblastic cells. Mol. Biol. Cell 1998, 9, 2249–2258. [Google Scholar] [CrossRef]
  41. Schiller, P.C.; D’Ippolito, G.; Balkan, W.; Roos, B.A.; Howard, G.A. Gap-junctional communication is required for the maturation process of osteoblastic cells in culture. Bone 2001, 28, 362–369. [Google Scholar] [CrossRef] [PubMed]
  42. Loiselle, A.E.; Jiang, J.X.; Donahue, H.J. Gap junction and hemichannel functions in osteocytes. Bone 2013, 54, 205–212. [Google Scholar] [CrossRef] [PubMed]
  43. Shen, H.; Grimston, S.; Civitelli, R.; Thomopoulos, S. Deletion of connexin43 in osteoblasts/osteocytes leads to impaired muscle formation in mice. J. Bone Miner. Res. 2015, 30, 596–605. [Google Scholar] [CrossRef] [PubMed]
  44. Gramsch, B.; Gabriel, H.D.; Wiemann, M.; Grümmer, R.; Winterhager, E.; Bingmann, D.; Schirrmacher, K. Enhancement of connexin 43 expression increases proliferation and differentiation of an osteoblast-like cell line. Exp. Cell Res. 2001, 264, 397–407. [Google Scholar] [CrossRef] [PubMed]
  45. Li, Z.; Zhou, Z.; Saunders, M.M.; Donahue, H.J. Modulation of connexin43 alters expression of osteoblastic differentiation markers. Am. J. Physiol. Cell Physiol. 2006, 290, C1248-55. [Google Scholar] [CrossRef] [PubMed]
  46. Zhang, Y.; Paul, E.M.; Sathyendra, V.; Davison, A.; Sharkey, N.; Bronson, S.; Srinivasan, S.; Gross, T.S.; Donahue, H.J. Enhanced osteoclastic resorption and responsiveness to mechanical load in gap junction deficient bone. PLoS ONE 2011, 6, e23516. [Google Scholar] [CrossRef] [PubMed]
  47. Bivi, N.; Condon, K.W.; Allen, M.R.; Farlow, N.; Passeri, G.; Brun, L.R.; Rhee, Y.; Bellido, T.; Plotkin, L.I. Cell autonomous requirement of connexin 43 for osteocyte survival: Consequences for endocortical resorption and periosteal bone formation. J. Bone Miner. Res. 2012, 27, 374–389. [Google Scholar] [CrossRef] [PubMed]
  48. Plotkin, L.I.; Speacht, T.L.; Donahue, H.J. Cx43 and mechanotransduction in bone. Curr. Osteoporos. Rep. 2015, 13, 67–72. [Google Scholar] [CrossRef] [PubMed]
  49. Shen, C.; Kim, M.R.; Noh, J.M.; Kim, S.J.; Ka, S.-O.; Kim, J.H.; Park, B.-H.; Park, J.H. Glucocorticoid Suppresses Connexin 43 Expression by Inhibiting the Akt/mTOR Signaling Pathway in Osteoblasts. Calcif. Tissue Int. 2016, 99, 88–97. [Google Scholar] [CrossRef]
  50. Gao, J.; Cheng, T.S.; Qin, A.; Pavlos, N.J.; Wang, T.; Song, K.; Wang, Y.; Chen, L.; Zhou, L.; Jiang, Q.; et al. Glucocorticoid impairs cell-cell communication by autophagy-mediated degradation of connexin 43 in osteocytes. Oncotarget 2016, 7, 26966–26978. [Google Scholar] [CrossRef]
  51. Weinstein, R.S.; Jilka, R.L.; Parfitt, A.M.; Manolagas, S.C. Inhibition of osteoblastogenesis and promotion of apoptosis of osteoblasts and osteocytes by glucocorticoids. Potential mechanisms of their deleterious effects on bone. J. Clin. Investig. 1998, 102, 274–282. [Google Scholar] [CrossRef] [PubMed]
  52. Henneicke, H.; Gasparini, S.J.; Brennan-Speranza, T.C.; Zhou, H.; Seibel, M.J. Glucocorticoids and bone: Local effects and systemic implications. Trends Endocrinol. Metab. 2014, 25, 197–211. [Google Scholar] [CrossRef] [PubMed]
  53. Hughes, D.E.; Dai, A.; Tiffee, J.C.; Li, H.H.; Mundy, G.R.; Boyce, B.F. Estrogen promotes apoptosis of murine osteoclasts mediated by TGF-beta. Nat. Med. 1996, 2, 1132–1136. [Google Scholar] [CrossRef] [PubMed]
  54. Angel, N.Z.; Walsh, N.; Forwood, M.R.; Ostrowski, M.C.; Cassady, A.I.; Hume, D.A. Transgenic mice overexpressing tartrate-resistant acid phosphatase exhibit an increased rate of bone turnover. J. Bone Miner. Res. 2000, 15, 103–110. [Google Scholar] [CrossRef]
  55. Goodenough, D.A.; Paul, D.L. Beyond the gap: Functions of unpaired connexon channels. Nat. Rev. Mol. Cell Biol. 2003, 4, 285–294. [Google Scholar] [CrossRef]
Figure 1. (af) Micrographs show the morphological architecture of rat lumbar 4 (L4) vertebral bodies of sham (a,d), OVX+diet (b,e), and OVX+steroid (c,f) after 3 and 12 months post-osteoporosis induction (n = 6 per time point). Non-calcified L4 bodies were processed for paraffin embedding, and 10 μm sections were stained with hematoxylin–eosin staining (HE). Exemplary micrographs of all groups are shown. Note the marked reduction in bone trabecula in the osteoporotic groups. Scale bar = 1 mm.
Anatomia 03 00008 g001
Figure 2. (af) Masson–Goldner micrographs of lumbar 4 (L4) vertebral bodies of sham, OVX+diet, and OVX+steroid rats after 3 and 12 months (n = 6 per time point). The data demonstrate a marked reduction in the trabecular area (green) in the OVX+diet and OVX+steroid groups. The region of interest (ROI) is marked with a purple line. (g) Percentage of the trabecular surface of the ROI shows a reduction in the OVX+diet and OVX+steroid compared to the sham group. Data are shown as mean ± SD. * = p < 0.05, *** = p < 0.001. Scale bar = 0.5 mm.
Anatomia 03 00008 g002
Figure 3. (af) Representative micrographs of lumbar 4 (L4) vertebral bodies of sham, OVX+diet, and OVX+steroid after 3 and 12 months stained with Masson–Goldner. A marked reduction in the mineralized bone (green) in OVX+diet (b,e) and OVX+steroid (c,f) after 3 and 12 months compared to sham control (a,d). Increases of non-mineralized matrix (osteoid, red) in both osteoporotic groups compared to sham control could be detected. (g) Percentage of mineralized bone per trabecula (n = 6 per time point). (h) Percentage of non-mineralized osteoid per trabecula. All data are presented as the mean ± SD. Scale bar = 0.5 mm. *** = p < 0.001.
Anatomia 03 00008 g003
Figure 4. (ag) Enzyme histochemistry staining for alkaline phosphatase (ALP) activity of L4 vertebral bodies of sham, OVX+diet, and OVX+steroid after 3 and 12 months. A reduction in ALP activity in OVX+diet (b,e) and OVX+steroid (c,f) after 12 months compared to sham control (a,d) could be detected. Quantification of ALP activity was performed by manual tracking of the positive areas of the trabecular surface covered by ALP staining (black arrow, g) as a percentage of the trabecular area. (h) Percentage of ALP-positive osteoblast area per trabecular surface of the vertebral body (n = 6 per time point). Data are shown as mean ± SD. Scale bar for (af) = 0.5 mm, for (g) = 50 μm. * = p < 0.05.
Anatomia 03 00008 g004
Figure 5. (af) Enzyme histochemistry staining for tartrate-resistant acid phosphatase (TRAP) activity of lumbar 4 (L4) vertebral bodies of sham, OVX+diet, and OVX+steroid after 3 and 12 months. Marked increases of TRAP activity (red) indicating osteoclasts in OVX+diet (b,e) and OVX+steroid (c,f) after 3 and 12 months compared to sham control (a,d). (g) Number of TRAP-positive osteoclasts per trabecular surface of the vertebral body (n = 6 per time point) shows increases in OVX+diet at both time points compared to other experimental groups. All data are presented as the mean ± SD. Scale bar = 0.5 mm. *** = p < 0.001.
Anatomia 03 00008 g005
Figure 6. (ac) Cx43 immunohistochemistry of osteoblasts (black arrow, (a)), osteoclasts (white arrow, (b)), and a negative control where the primary antibody was omitted (NC,c). Cx43 staining of lumbar 4 (L4) vertebral bodies of sham (d,g), OVX+diet (e,h), and OVX+steroid groups (f,i) after 3 and 12 months. Note the reduction in Cx43-positive trabecular areas (black arrows) in OVX+diet and OVX+steroid compared to the sham group. (j) Percentage of Cx43-positive osteoblasts area per trabecula (n = 6 per time point). (k) Number of Cx43-positive osteoclasts per trabecular surface of the vertebral body (n = 6 per time point). Asterisk (*) indicating the presence of osteocytes in the trabeculae. All data are presented as the mean ± SD. Scale bar in (ac) = 50 μm and in (di) = 0.5 mm. * = p < 0.05, ** = p < 0.01, and *** = p < 0.001.
Anatomia 03 00008 g006
Disclaimer/Publisher’s Note: The statements, opinions and data contained in all publications are solely those of the individual author(s) and contributor(s) and not of MDPI and/or the editor(s). MDPI and/or the editor(s) disclaim responsibility for any injury to people or property resulting from any ideas, methods, instructions or products referred to in the content.

