
Design and Evaluation of an Asynchronous VR Exploration System for Architectural Design Discussion Content


Abstract
:1. Introduction
1.1. Research Background
1.2. Problems and Proposed Approaches
2. Related Work
2.1. Architectural Design Review and Discussion
2.2. Spatial–Temporal Data Summarization Visualization
2.3. Summarization-to-Detail Exploration and Visualization
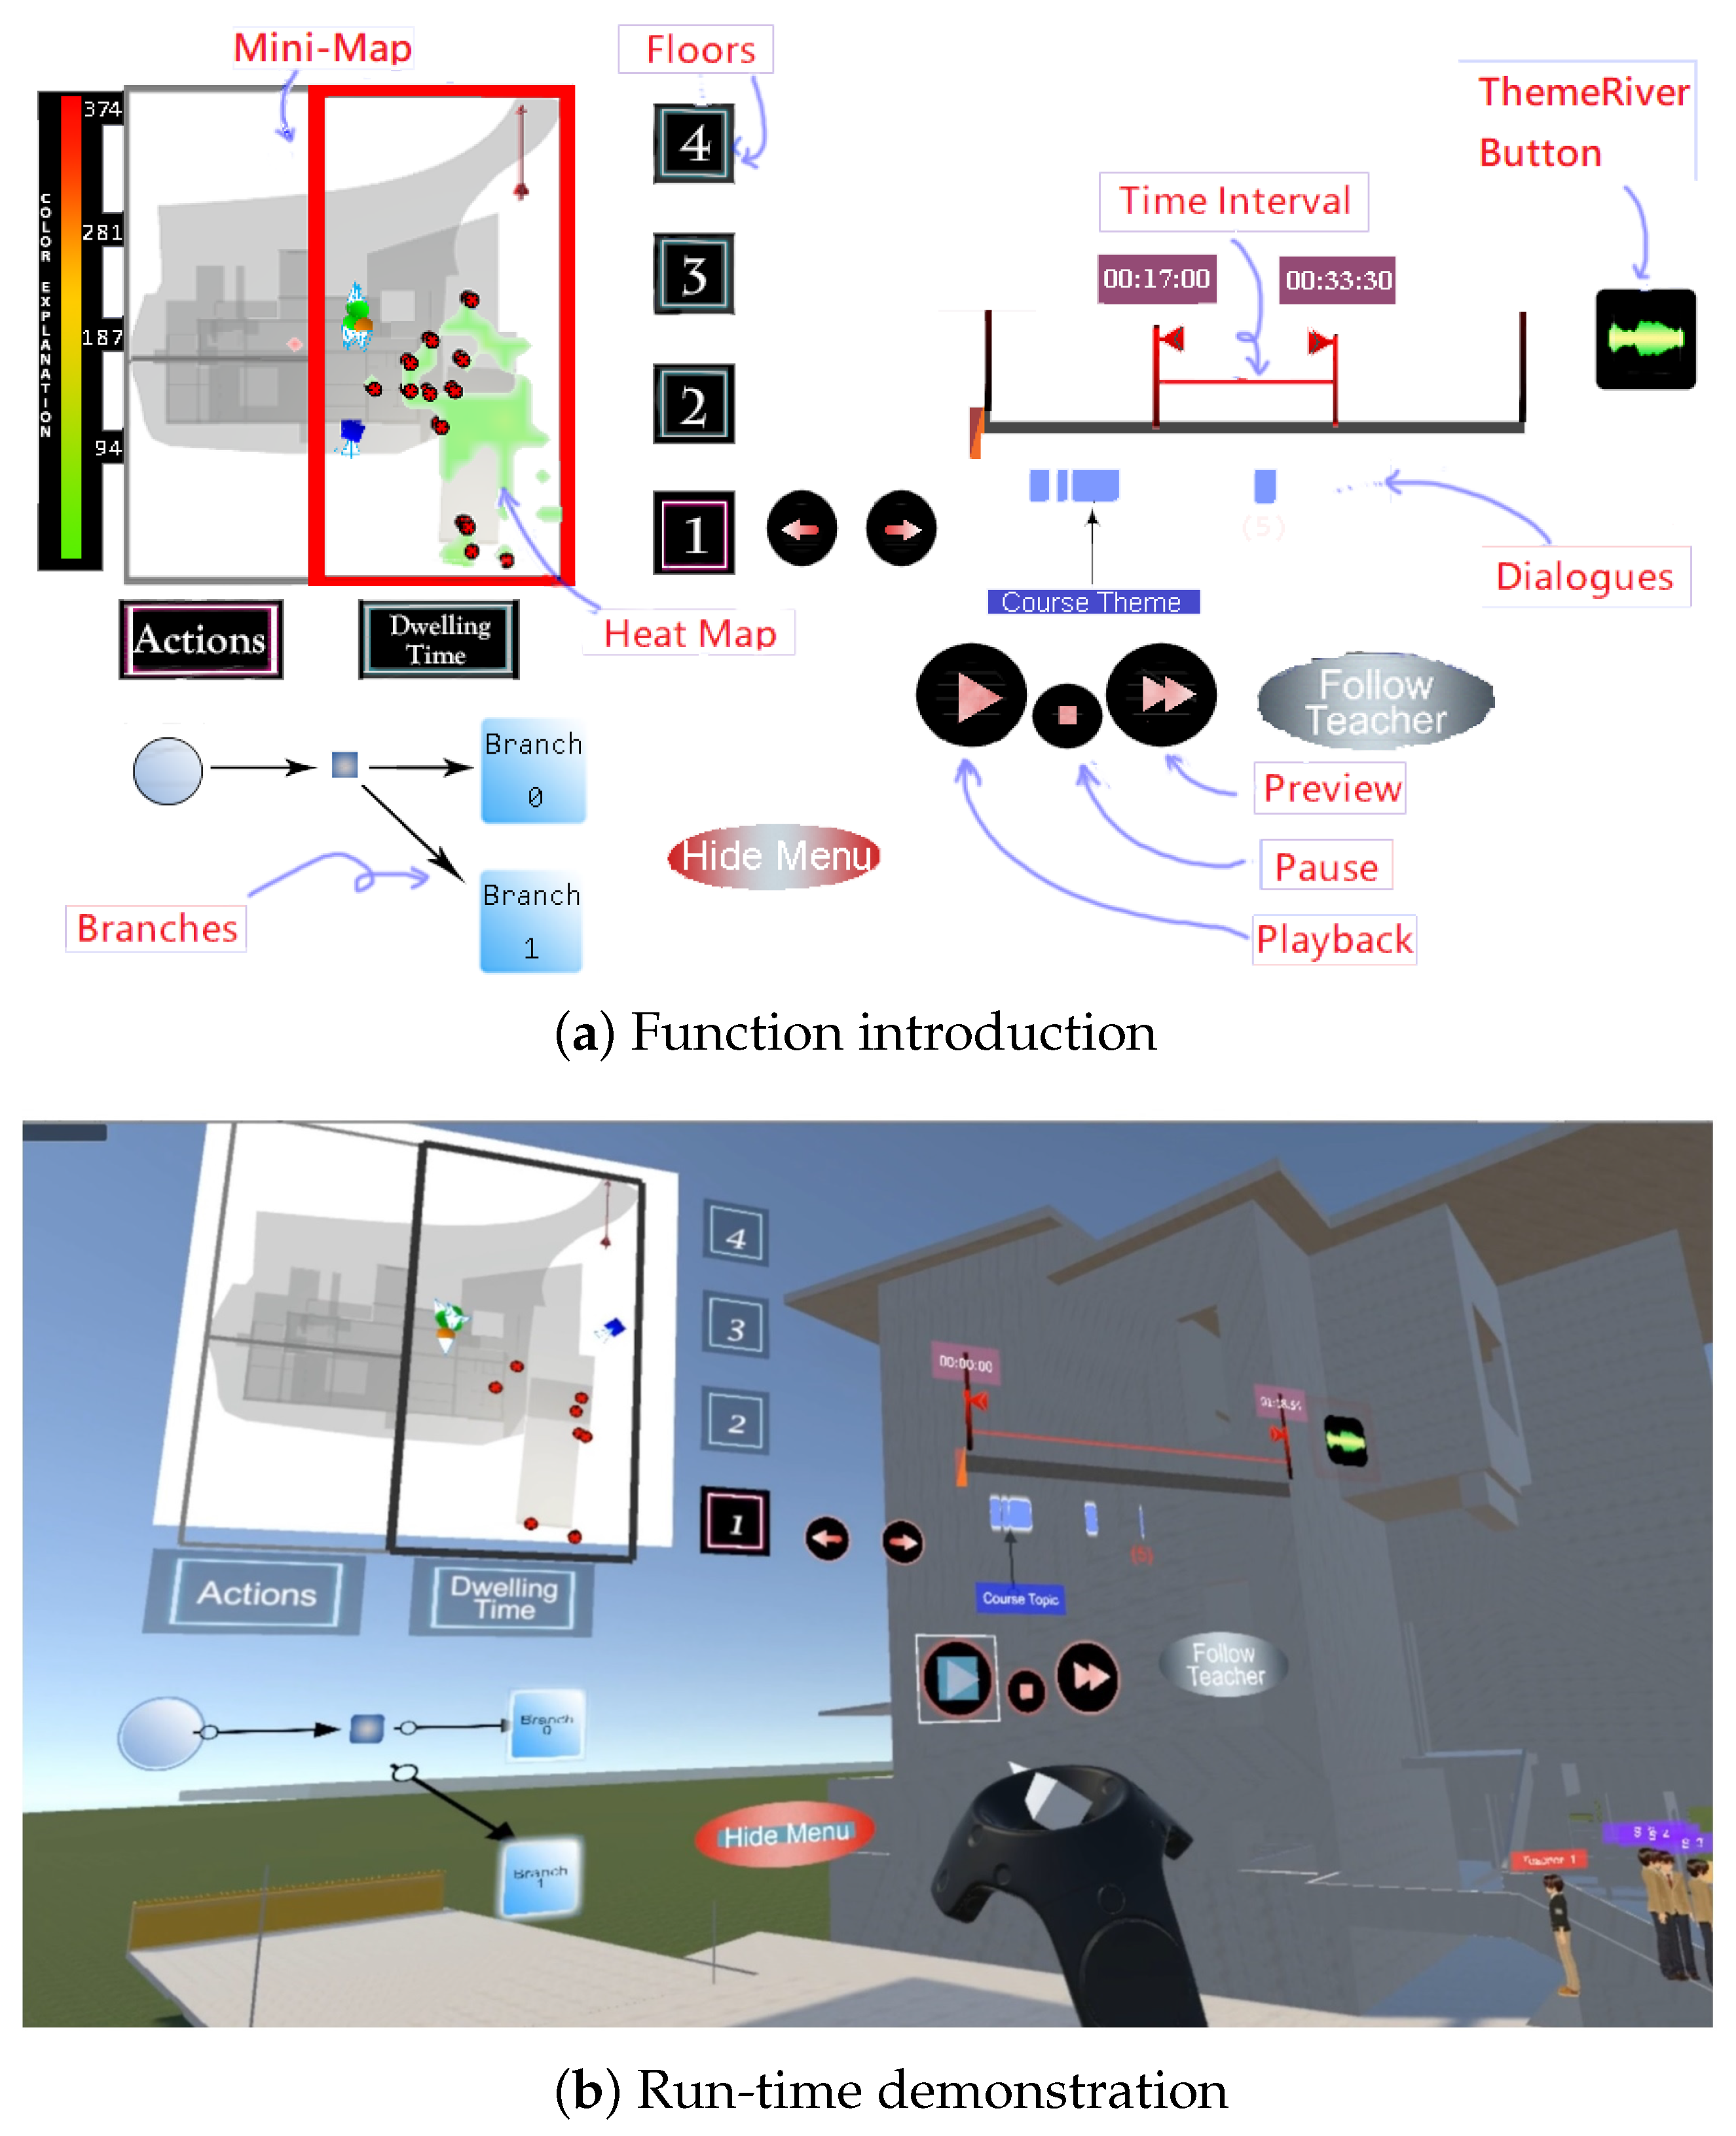
3. System Design and Description
3.1. Overview
3.2. Summarization Visualization
3.2.1. Minimap and Spatial Summarization Visualization
3.2.2. Timeline and Temporal Summarization Visualization
3.2.3. Branches
3.3. Filtering of Time Interval
3.4. Preview
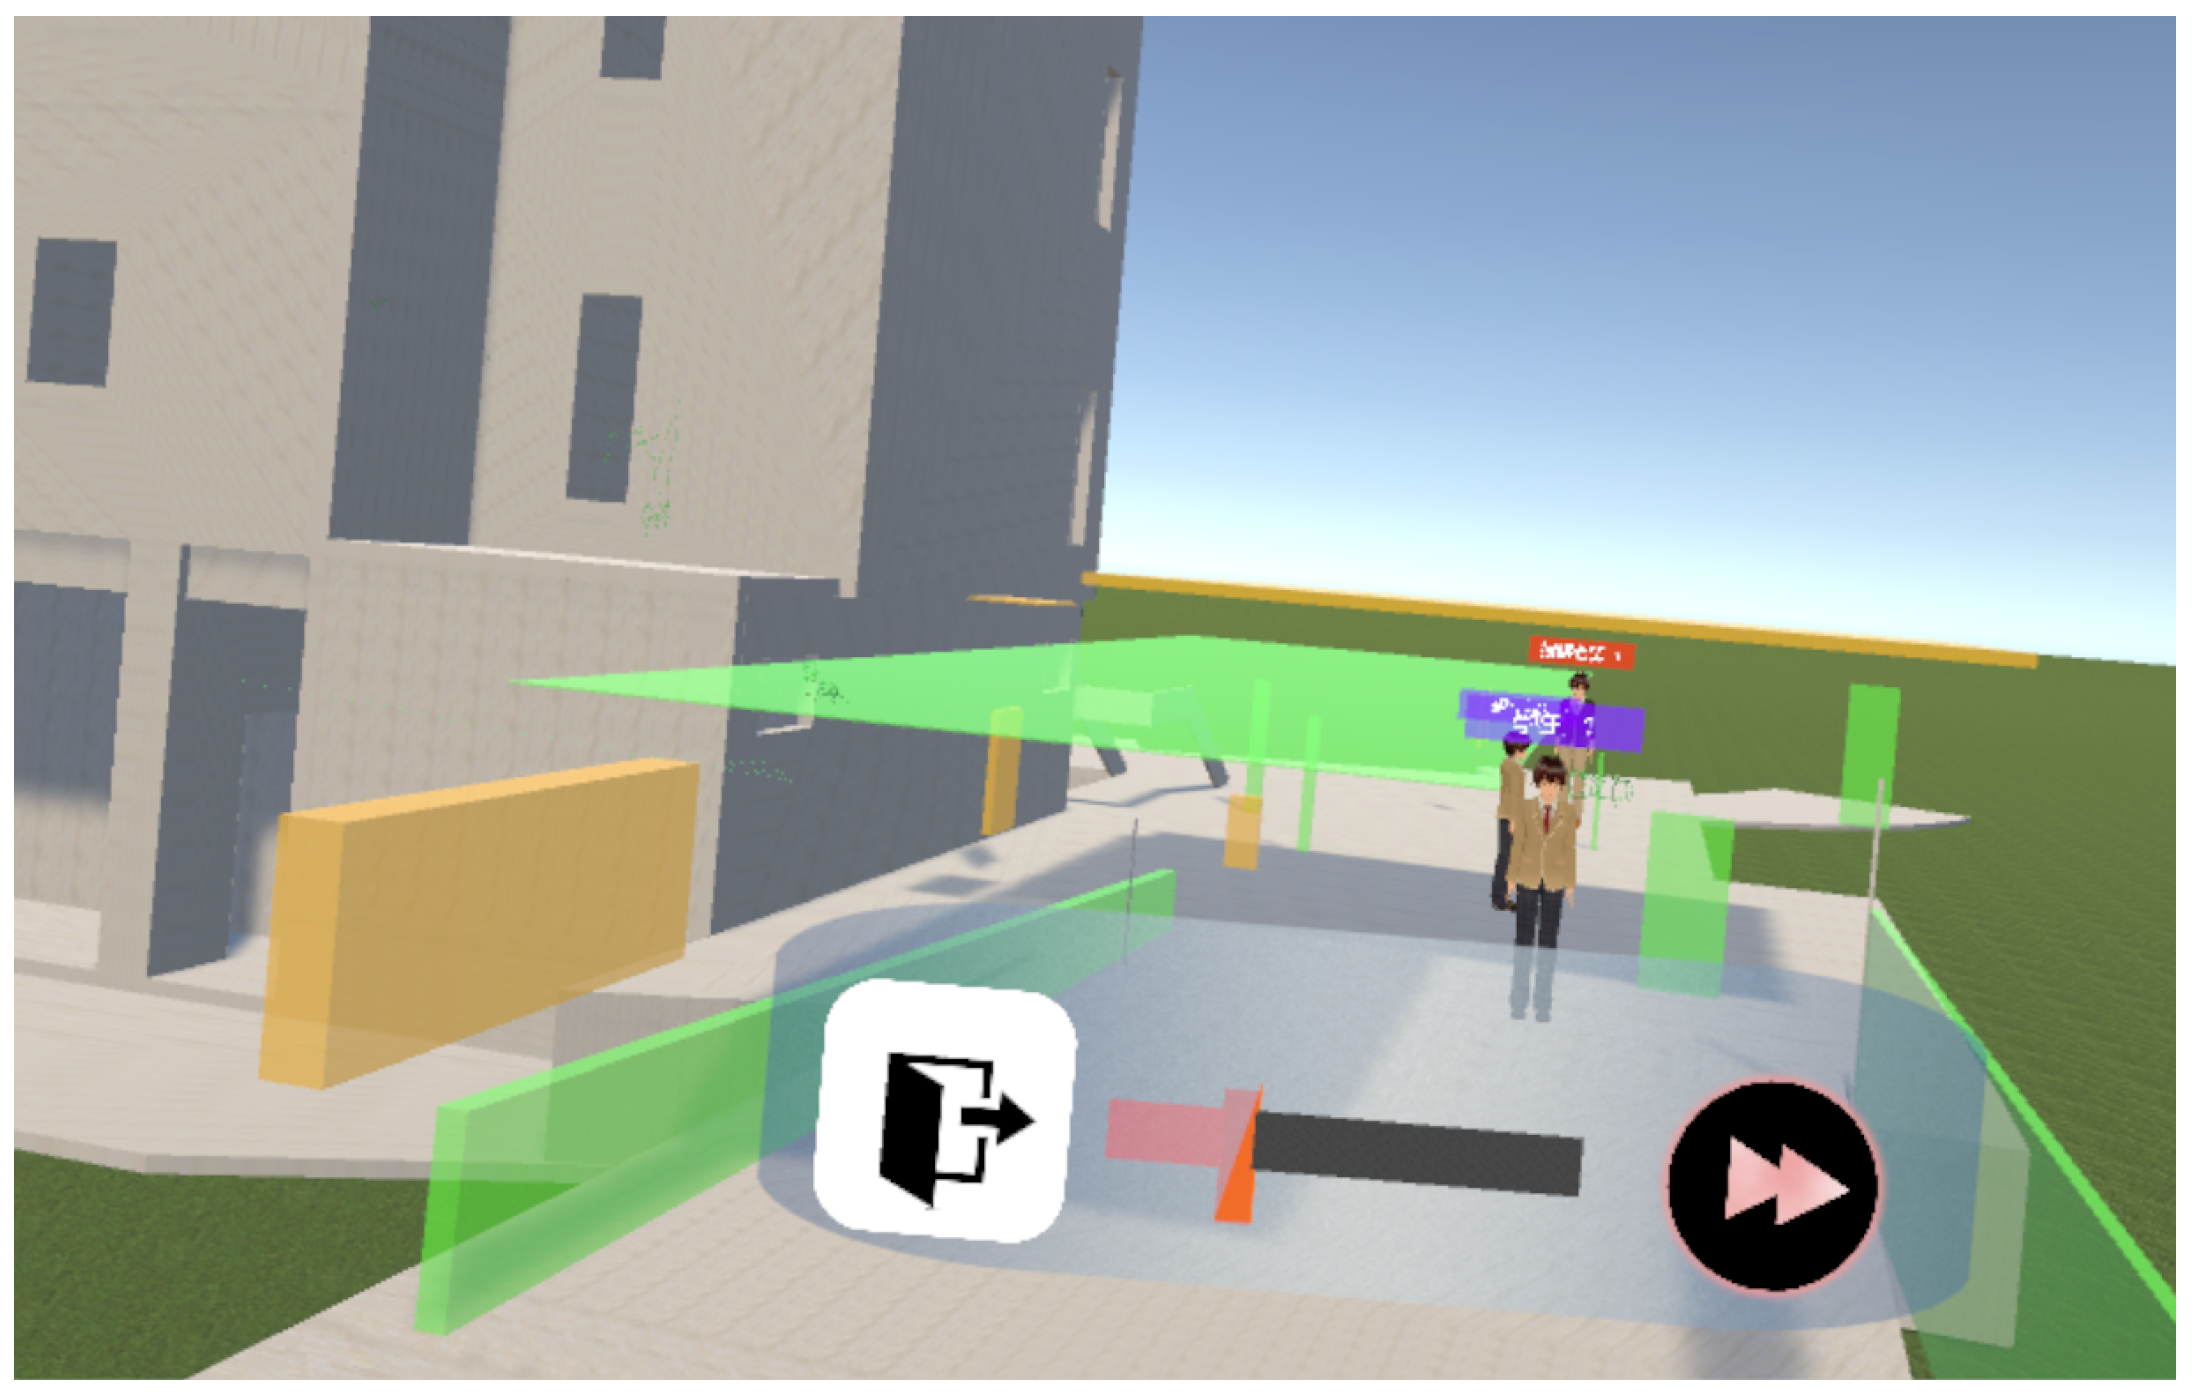
3.5. Playback
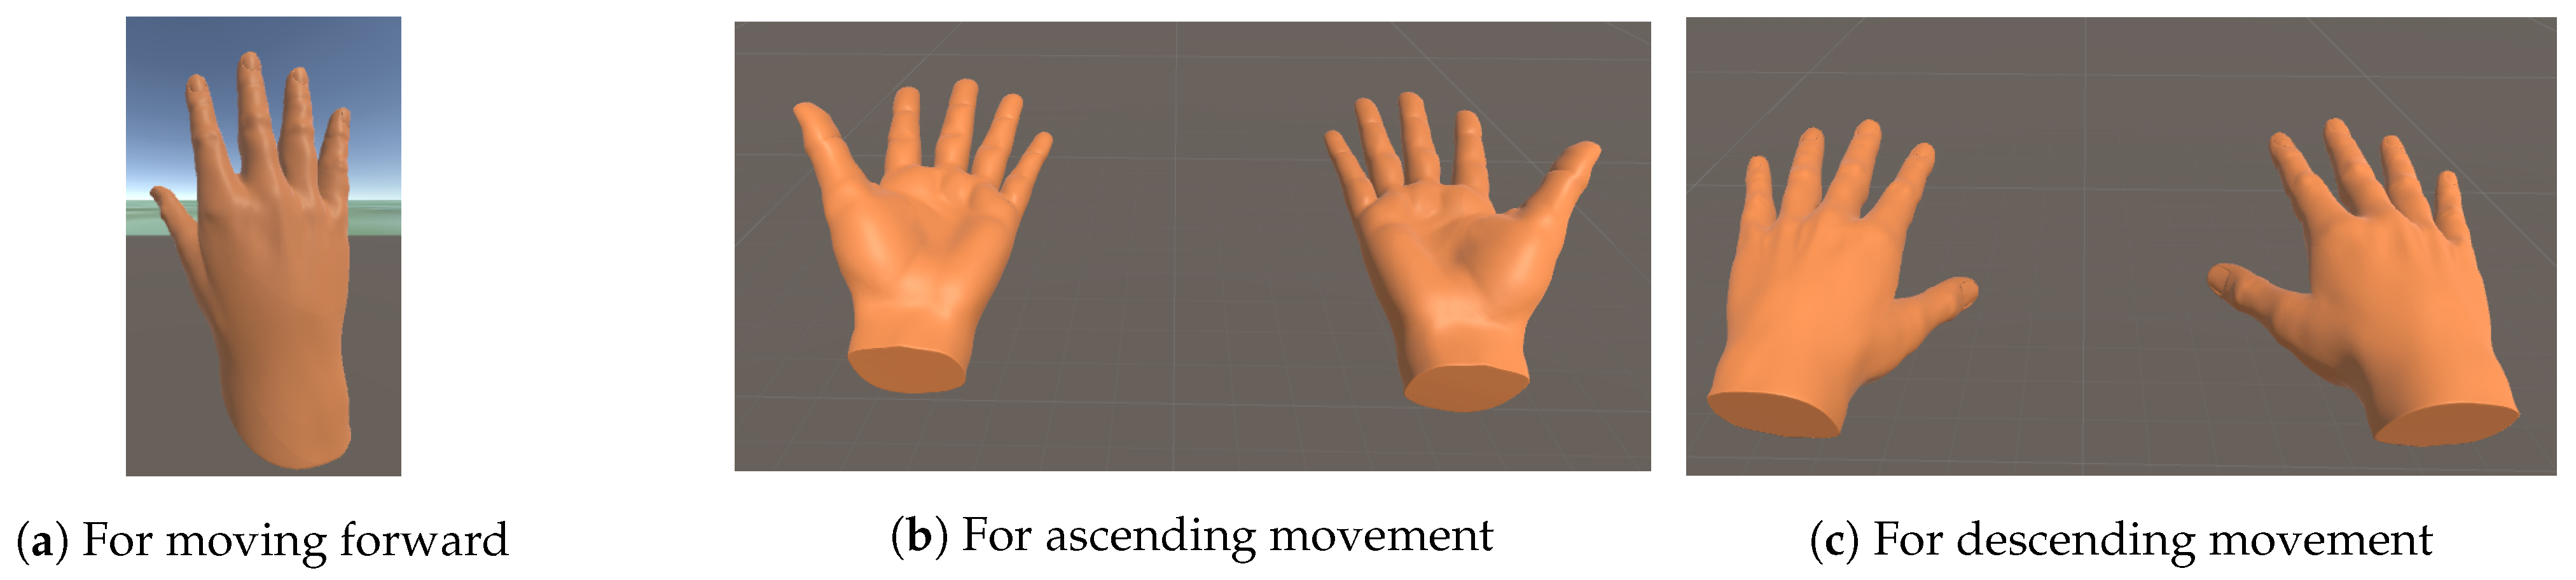
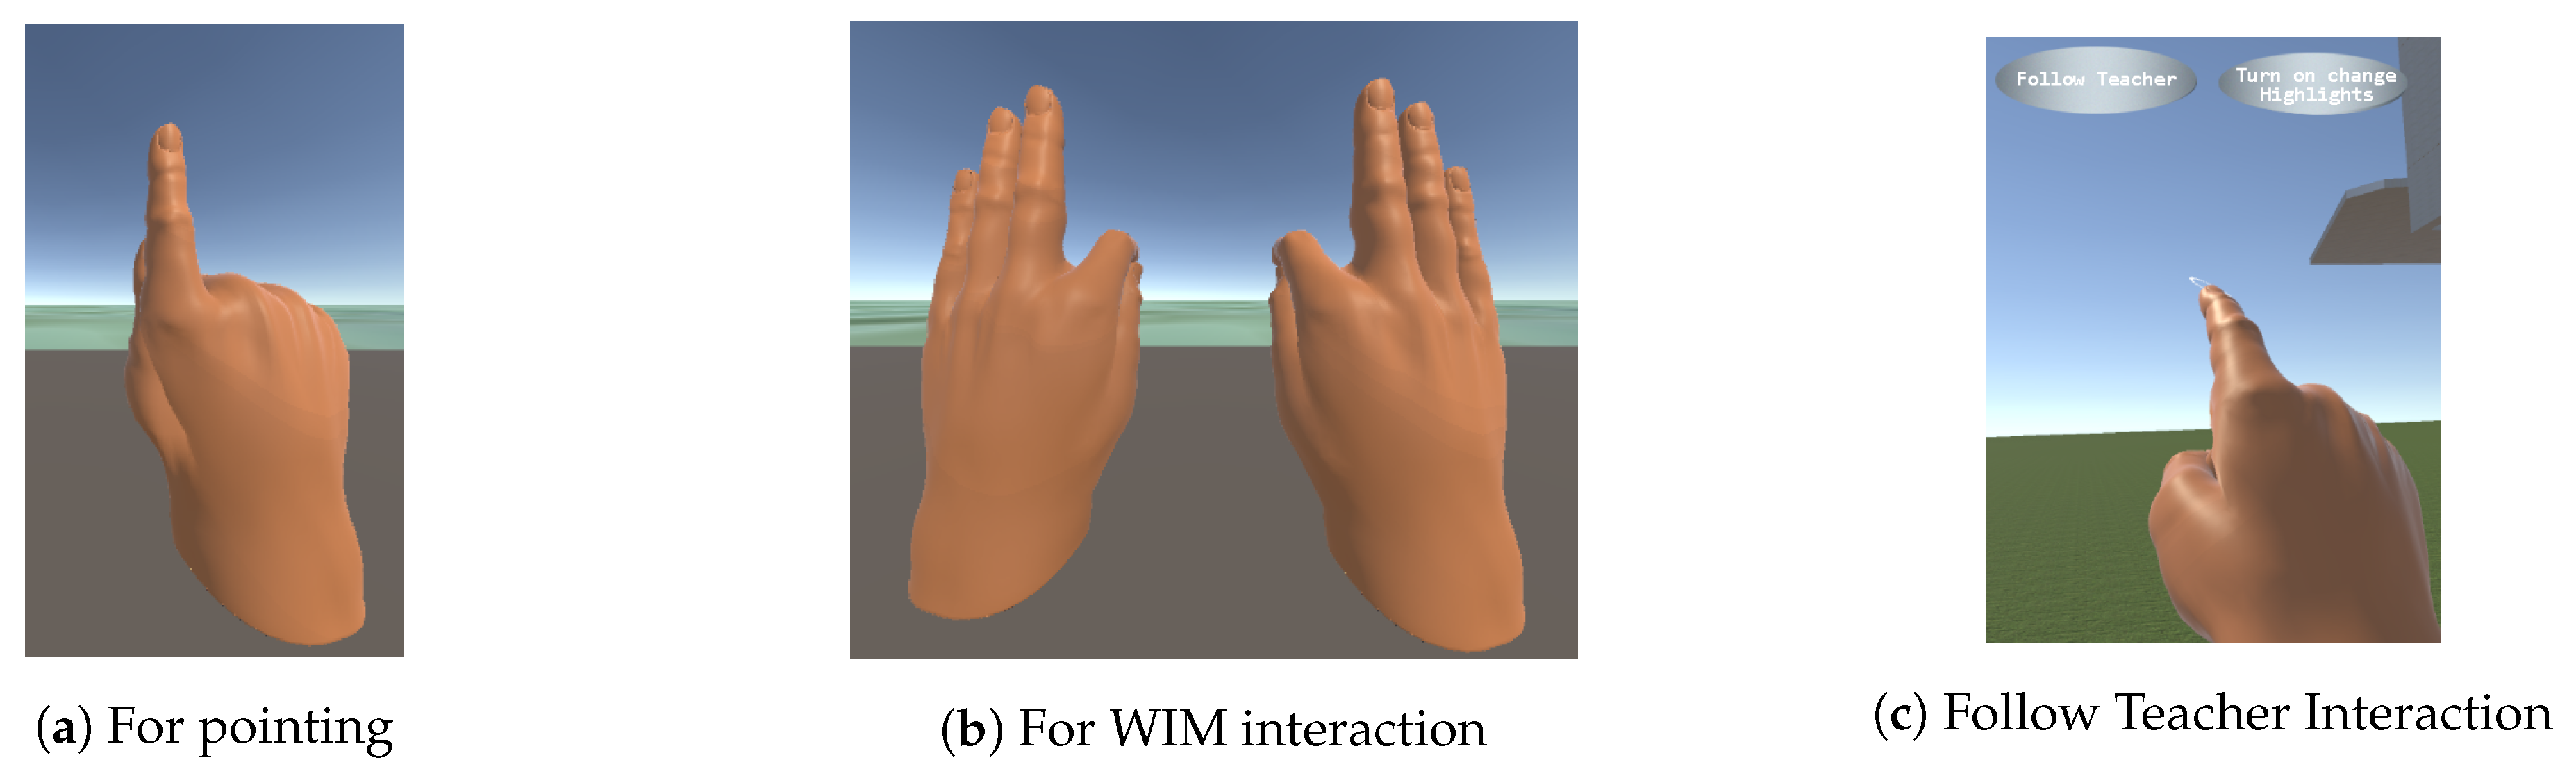
3.6. Gesture-Based Interaction and User Interface
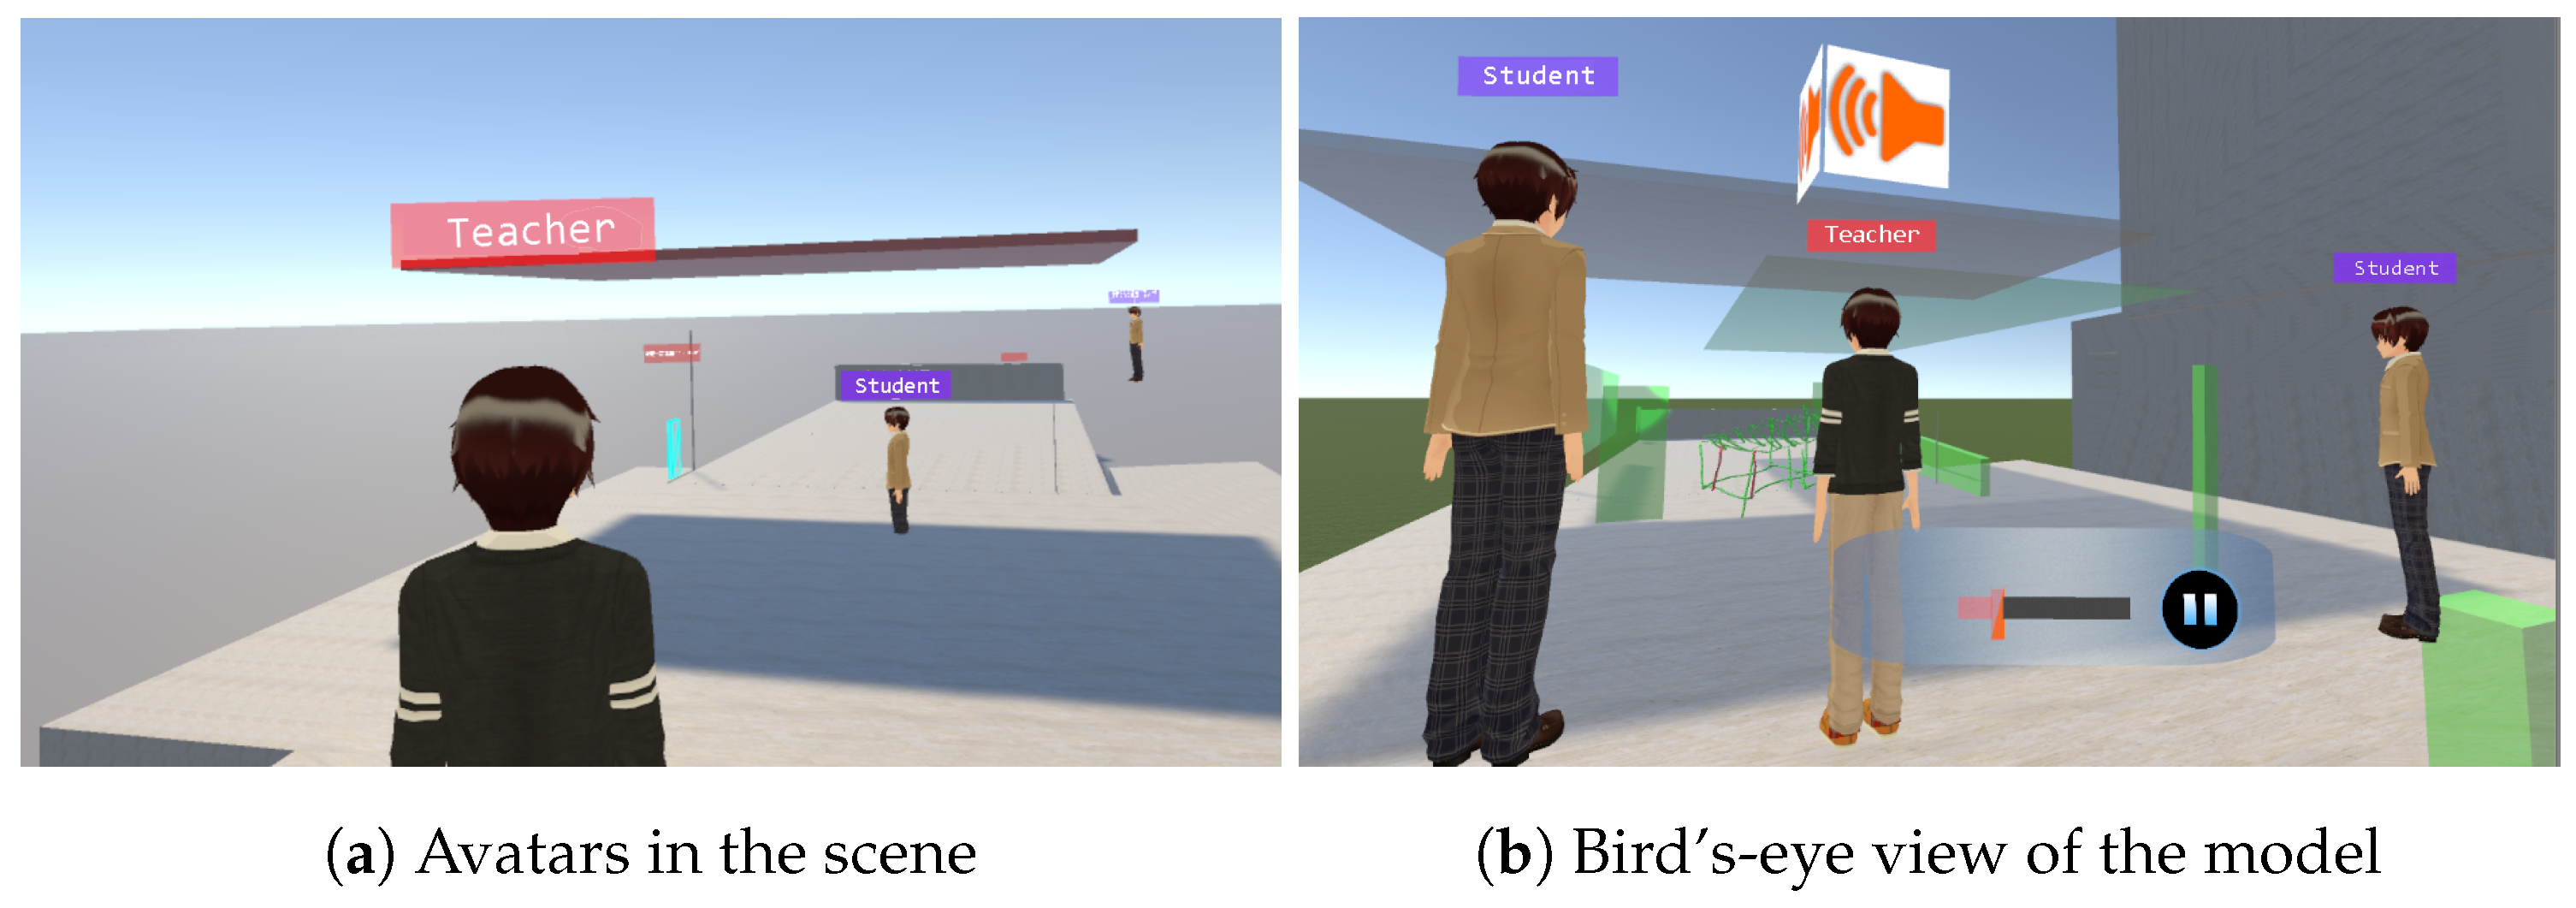
3.7. An Example Scenario
4. User Evaluation
4.1. Participants
4.2. Course Material
4.3. Study Design
4.4. Procedure
4.5. Quantitative Results and Discussion
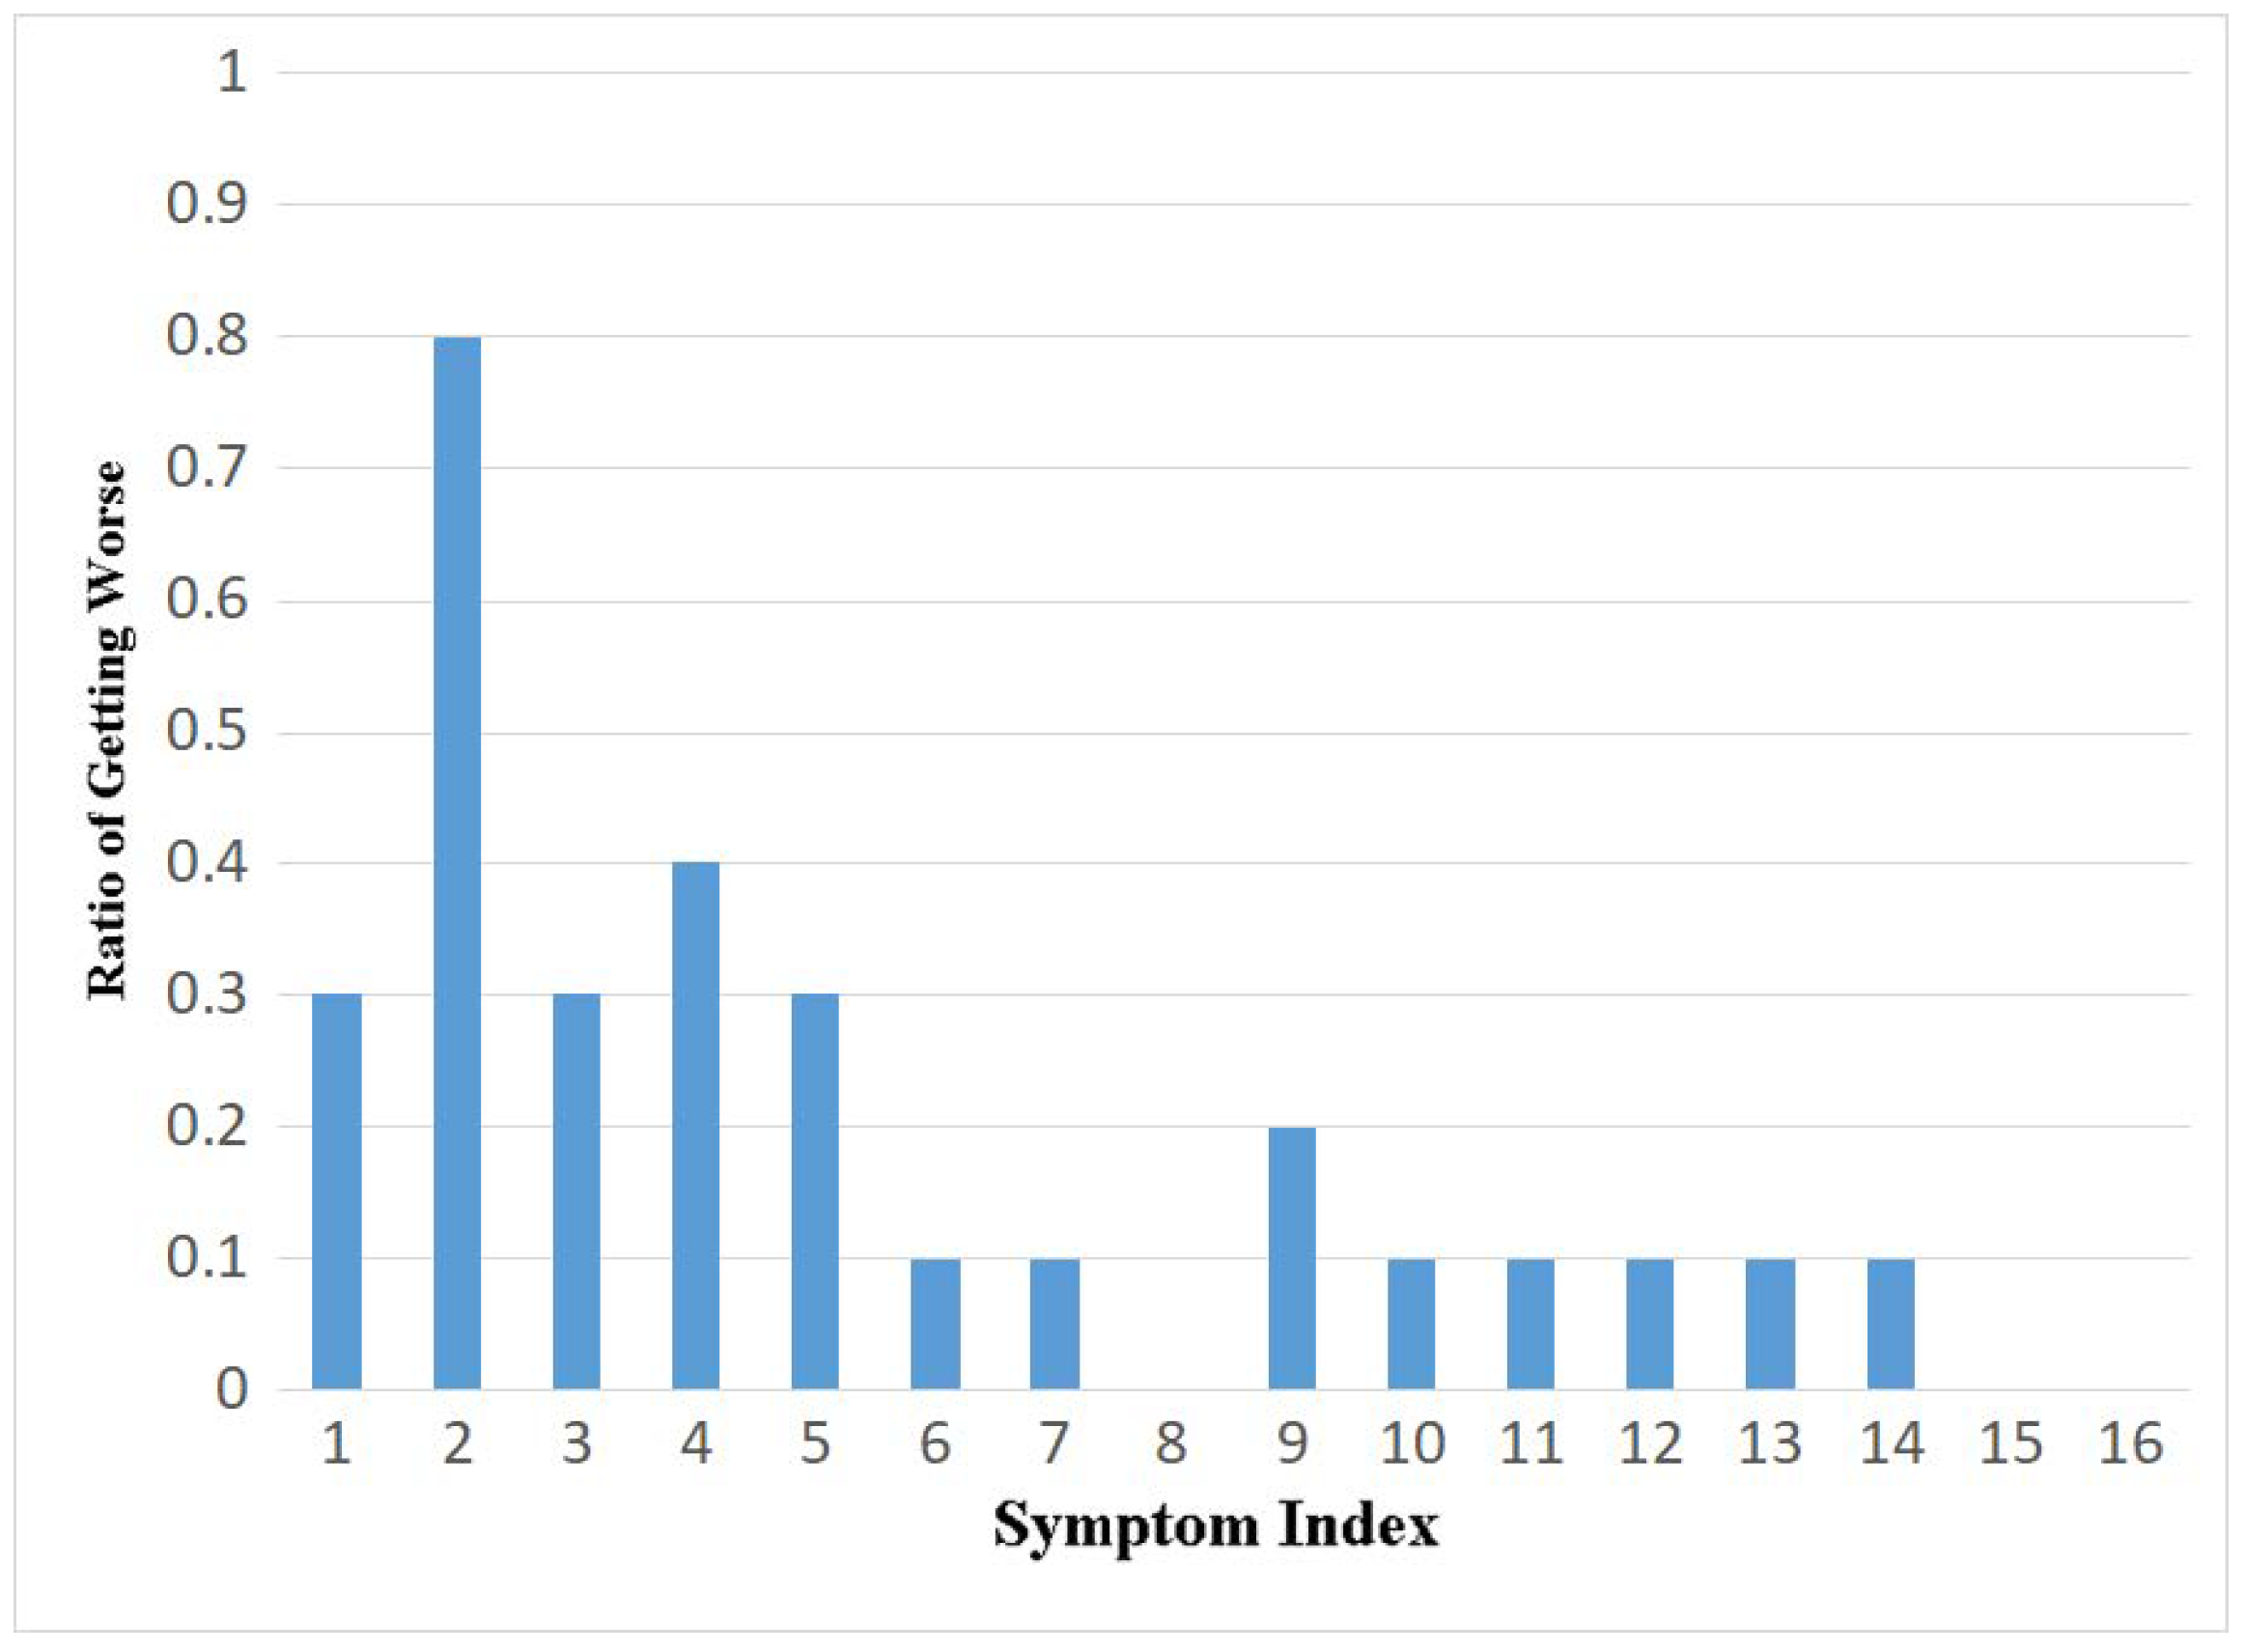
4.5.1. Simulator Sickness Questionnaire (SSQ)
4.5.2. NASA TLX Questionnaire
4.5.3. Presence and Co-Presence Questionnaire
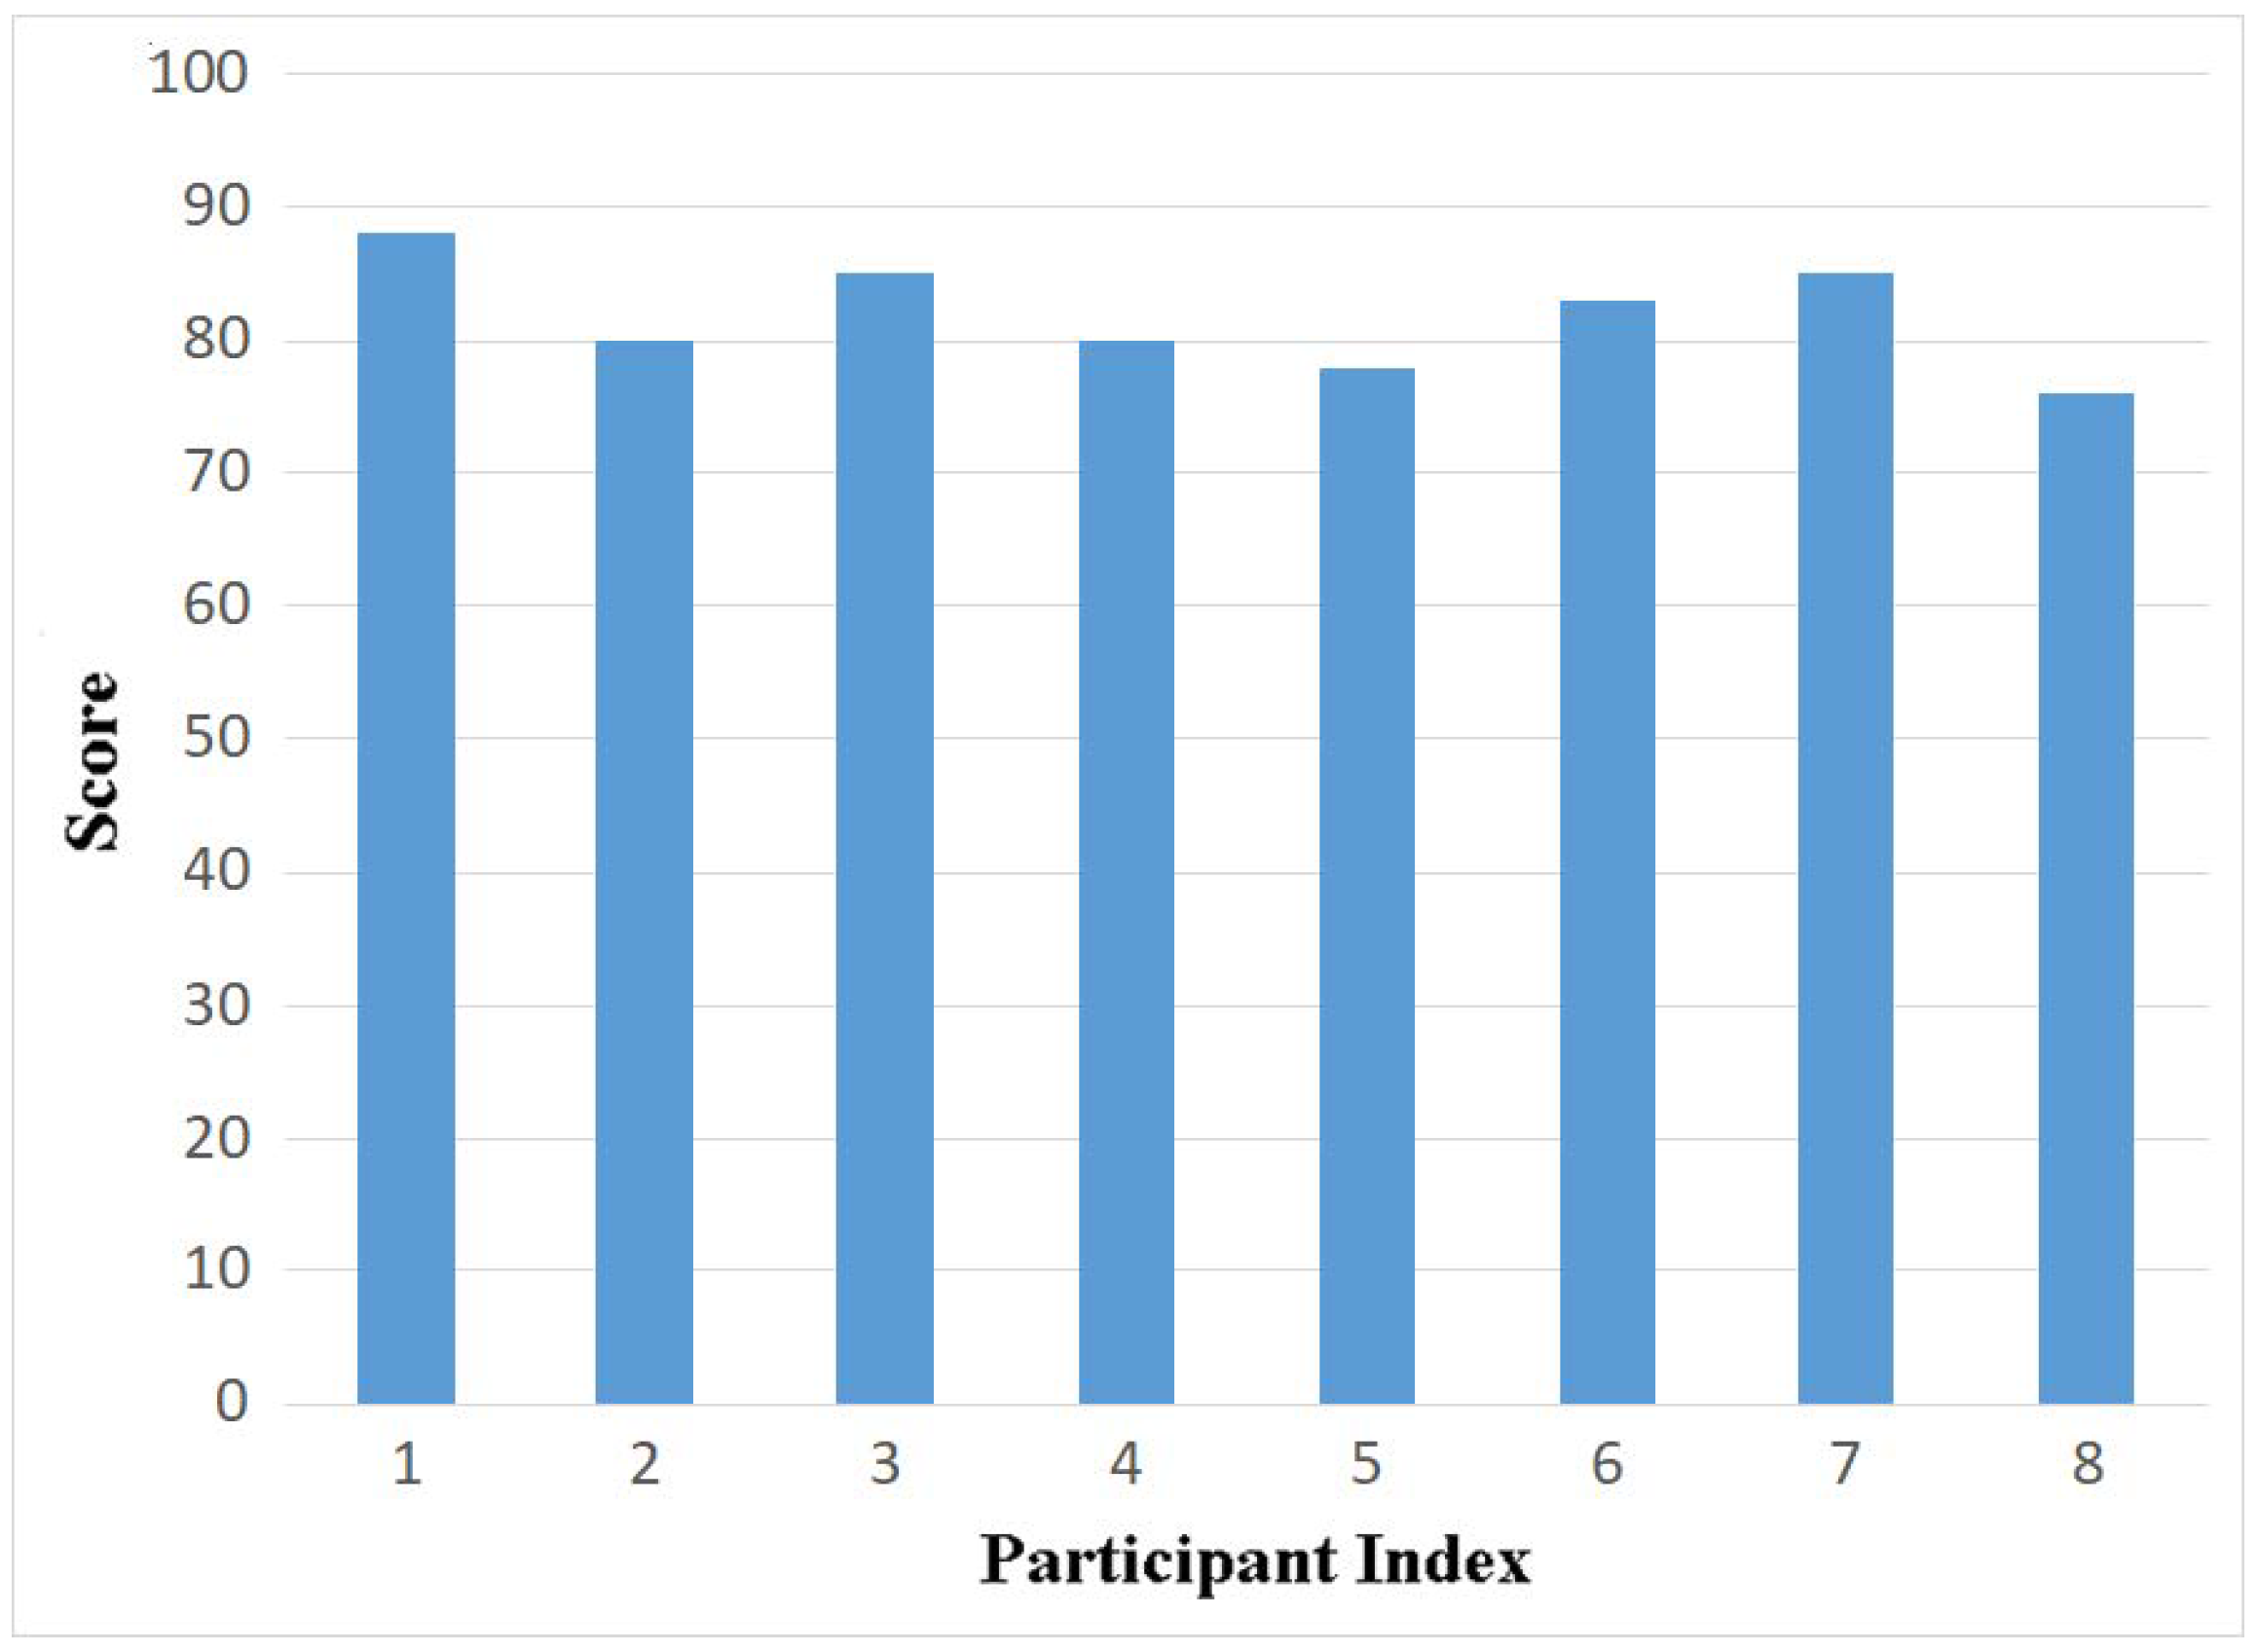
4.5.4. System Usability Satisfaction Questionnaire
4.5.5. System Evaluation Questionnaire
4.5.6. System Overall Evaluation
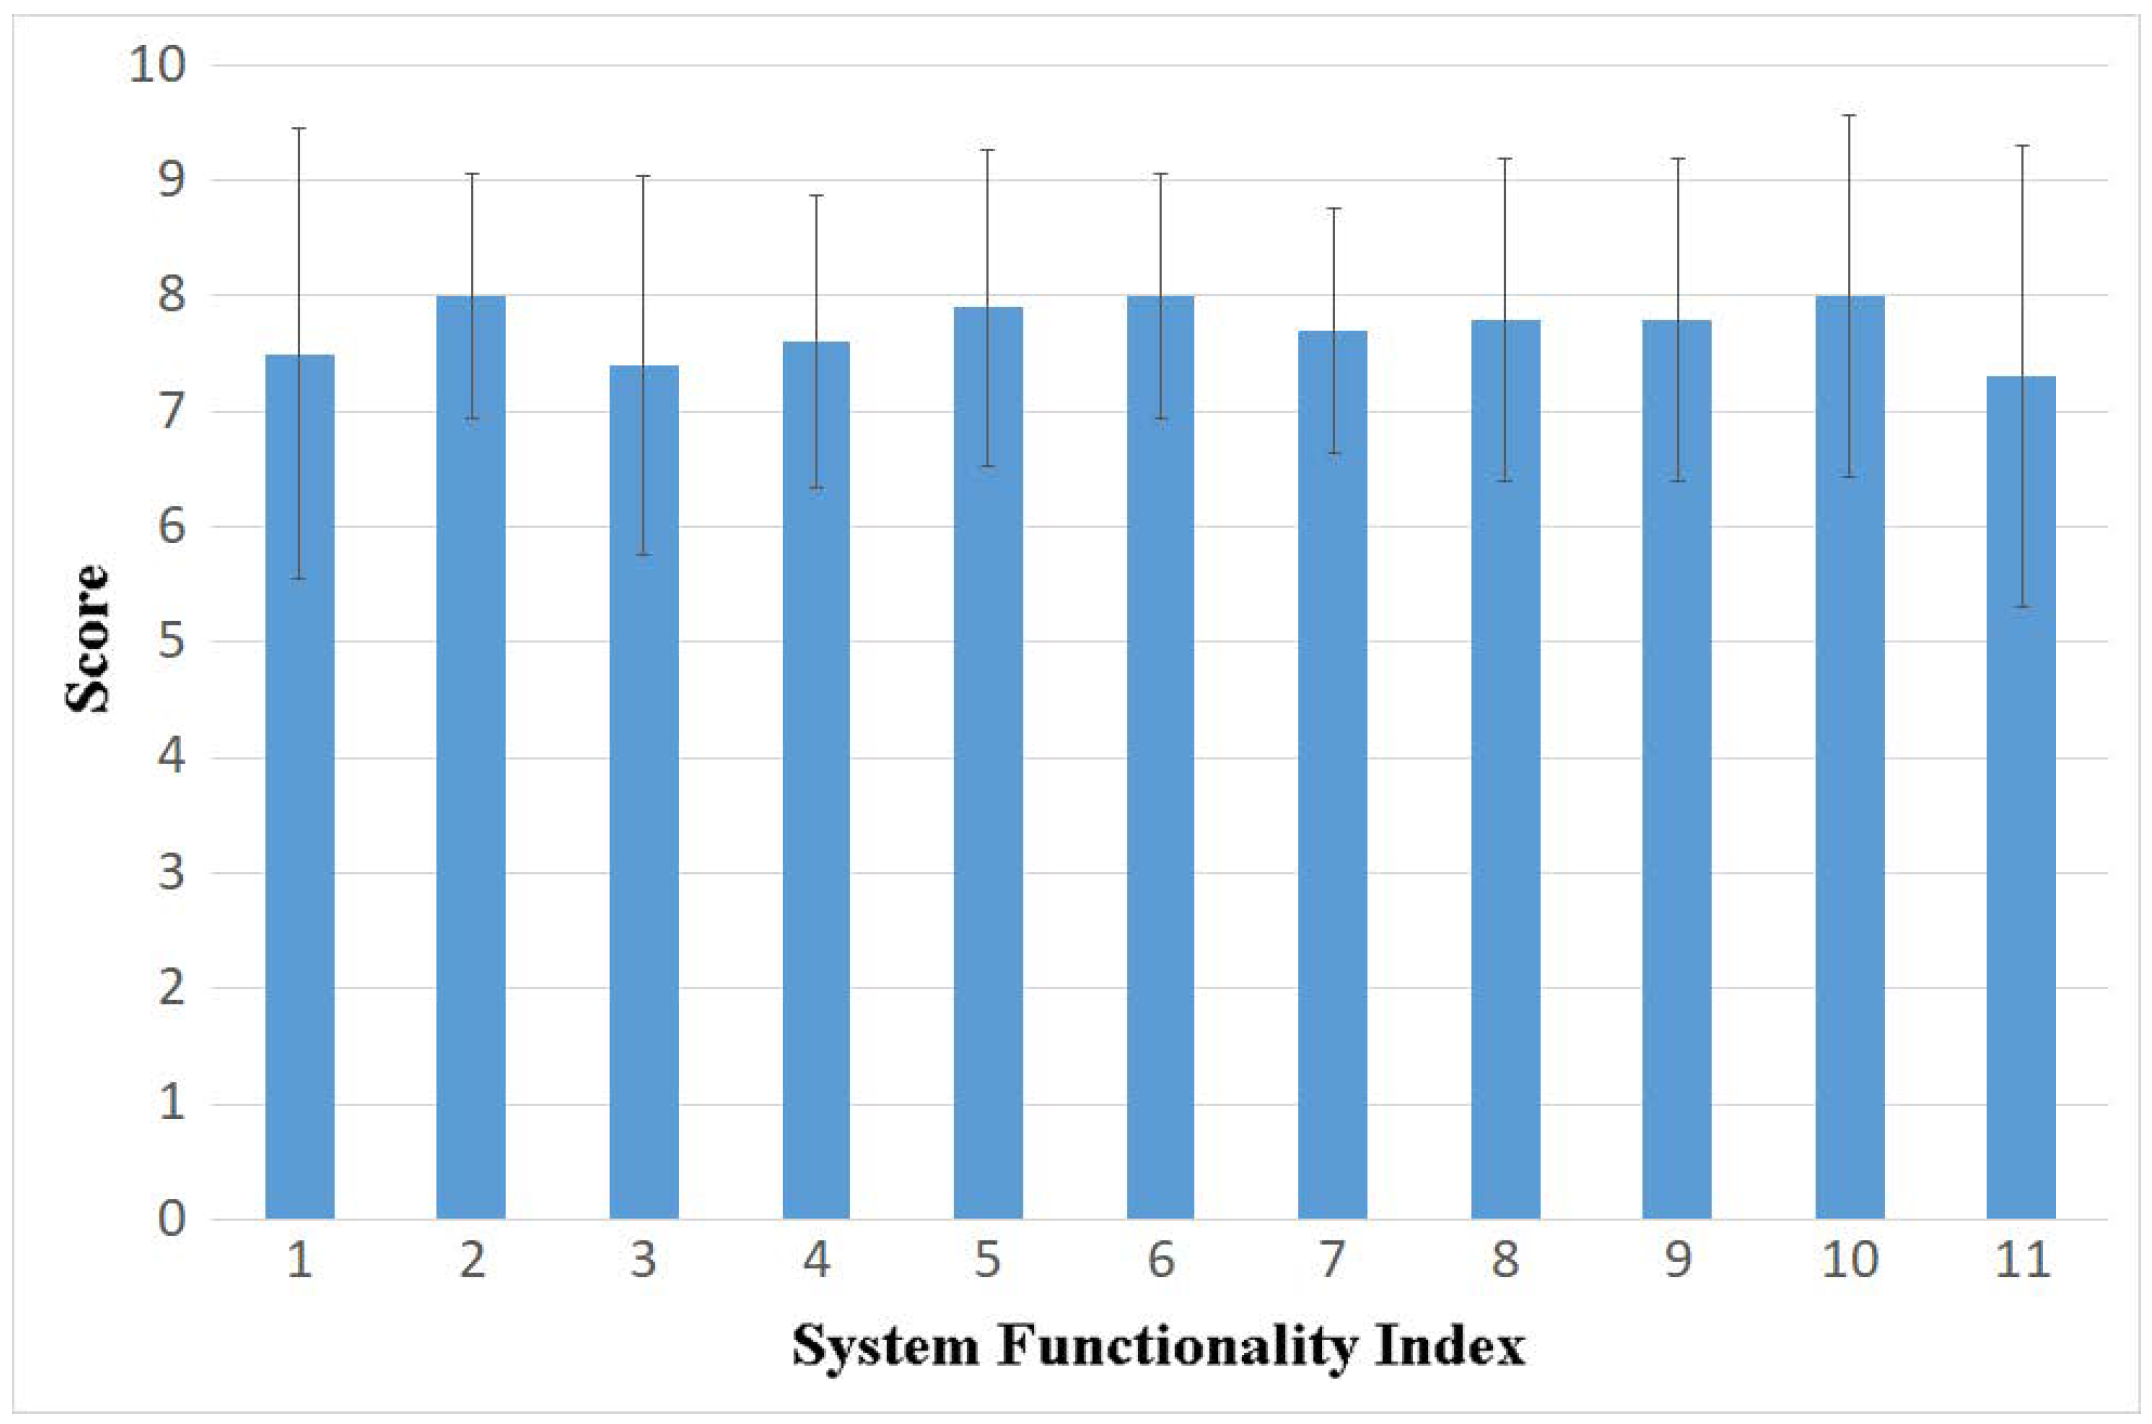
4.5.7. System Interactive Functionality
4.5.8. Learning Effectiveness Assessment
4.6. Discussion of Qualitative and Quantitative Results
5. Conclusions and Future Works
Author Contributions
Funding
Institutional Review Board Statement
Informed Consent Statement
Data Availability Statement
Conflicts of Interest
References
- Anderson, L.; Esser, J.; Interrante, V. A virtual environment for conceptual design in architecture. In Proceedings of the ACM Workshop on Virtual Environments 2003, Zurich, Switzerland, 22–23 May 2003; pp. 57–63. [Google Scholar]
- Coburn, J.Q.; Freeman, I.; Salmon, J.L. A review of the capabilities of current low-cost virtual reality technology and its potential to enhance the design process. J. Comput. Inf. Sci. Eng. 2017, 17, 031013. [Google Scholar] [CrossRef]
- Portman, M.E.; Natapov, A.; Fisher-Gewirtzman, D. To go where no man has gone before: Virtual reality in architecture, landscape architecture and environmental planning. Comput. Environ. Urban Syst. 2015, 54, 376–384. [Google Scholar] [CrossRef]
- Goldschmidt, G.; Hochman, H.; Dafni, I. The design studio “crit”: Teacher–student communication. AI Edam 2010, 24, 285–302. [Google Scholar] [CrossRef]
- Castronovo, F.; Nikolic, D.; Liu, Y.; Messner, J. An evaluation of immersive virtual reality systems for design reviews. In Proceedings of the 13th International Conference on Construction Applications of Virtual Reality, London, UK, 30–31 October 2013; Volume 47. [Google Scholar]
- Hsu, T.; Tsai, M.; Babu, S.V.; Hsu, P.; Chang, H.; Lin, W.; Chuang, J. Design and Initial Evaluation of a VR based Immersive and Interactive Architectural Design Discussion System. In Proceedings of the 2020 IEEE Conference on Virtual Reality and 3D User Interfaces (VR), Atlanta, GA, USA, 22–26 March 2020; pp. 363–371. [Google Scholar]
- Stoakley, R.; Conway, M.J.; Pausch, R. Virtual reality on a WIM: Interactive worlds in miniature. In Proceedings of the CHI, Denver, CO, USA, 7–11 May 1995; Volume 95, pp. 265–272. [Google Scholar]
- Inoue, S.; Rodgers, P.; Spencer, N.; Tennant, A. Reductionism as a tool for creative exploration. In Proceedings of the European Academy of Design Conference, Paris, France, 22–24 April 2015. [Google Scholar]
- Goldschmidt, G. Modeling the role of sketching in design idea generation. In An Anthology of Theories and Models of Design; Springer: Berlin/Heidelberg, Germany, 2014; pp. 433–450. [Google Scholar]
- Messner, J.I.; Yerrapathruni, S.C.; Baratta, A.J.; Whisker, V.E. Using virtual reality to improve construction engineering education. In Proceedings of the American Society for Engineering Education Annual Conference & Exposition, Nashville, TN, USA, 22–25 June 2003. [Google Scholar]
- Schnabel, M.A.; Kvan, T. Spatial understanding in immersive virtual environments. Int. J. Archit. Comput. 2003, 1, 435–448. [Google Scholar] [CrossRef]
- Bruder, G.; Steinicke, F.; Hinrichs, K.H. Arch-explore: A natural user interface for immersive architectural walkthroughs. In Proceedings of the 2009 IEEE Symposium on 3D User Interfaces, Lafayette, LA, USA, 14–15 March 2009; pp. 75–82. [Google Scholar]
- Cockburn, A.; Karlson, A.; Bederson, B.B. A review of overview+ detail, zooming, and focus+ context interfaces. ACM Comput. Surv. (CSUR) 2009, 41, 1–31. [Google Scholar] [CrossRef]
- Kraak, M.J. The space-time cube revisited from a geovisualization perspective. In Proceedings of the 21st International Cartographic Conference, Durban, South Africa, 10–16 August 2003; Citeseer: Princeton, NJ, USA, 2003; pp. 1988–1996. [Google Scholar]
- Coulton, P.; Bamford, W.; Cheverst, K.; Rashid, O. 3D Space-Time Visualization of Player Behaviour in Pervasive Location-Based Games. Int. J. Comput. Games Technol. 2008. [Google Scholar] [CrossRef]
- Zeng, W.; Zhong, C.; Anwar, A.; Arisona, S.M.; McLoughlin, I.V. MetroBuzz: Interactive 3D visualization of spatiotemporal data. In Proceedings of the 2012 International Conference on Computer Information Science (ICCIS), Kuala Lumpur, Malaysia, 12–14 June 2012; Volume 1, pp. 143–147. [Google Scholar]
- Von Landesberger, T.; Bremm, S.; Andrienko, N.; Andrienko, G.; Tekušová, M. Visual analytics methods for categoric spatio-temporal data. In Proceedings of the 2012 IEEE Conference on Visual Analytics Science and Technology (VAST), Seattle, WA, USA, 14–19 October 2012; pp. 183–192. [Google Scholar]
- Guo, S.; Xu, K.; Zhao, R.; Gotz, D.; Zha, H.; Cao, N. EventThread: Visual Summarization and Stage Analysis of Event Sequence Data. IEEE Trans. Vis. Comput. Graph. 2018, 24, 56–65. [Google Scholar] [CrossRef] [PubMed]
- Shapiro, B.R. Using Space Time Visualization in Learning Environment Design. In Proceedings of the 2017 CHI Conference Extended Abstracts on Human Factors in Computing Systems, CHI EA’17, New York, NY, USA, 6–11 May 2017; pp. 178–183. [Google Scholar] [CrossRef]
- Milgram, P.; Kishino, F. A taxonomy of mixed reality visual displays. IEICE Trans. Inf. Syst. 1994, 77, 1321–1329. [Google Scholar]
- Mulloni, A.; Seichter, H.; Schmalstieg, D. Indoor navigation with mixed reality world-in-miniature views and sparse localization on mobile devices. In Proceedings of the International Working Conference on Advanced Visual Interfaces, Capri Island, Italy, 21–25 May 2012; pp. 212–215. [Google Scholar]
- Bonsch, A.; Freitag, S.; Kuhlen, T.W. Automatic generation of world in miniatures for realistic architectural immersive virtual environments. In Proceedings of the 2016 IEEE Virtual Reality (VR), Greenville, SC, USA, 19–23 March 2016; pp. 155–156. [Google Scholar]
- Danyluk, K.; Ens, B.; Jenny, B.; Willett, W. A design space exploration of worlds in miniature. In Proceedings of the 2021 CHI Conference on Human Factors in Computing Systems, Yokohama, Japan, 8–13 May 2021; pp. 1–15. [Google Scholar]
- Shneiderman, B. The eyes have it: A task by data type taxonomy for information visualizations. In Proceedings of the 1996 IEEE Symposium on Visual Languages, Boulder, CO, USA, 3–6 September 1996; pp. 336–343. [Google Scholar]
- Zhang, N.; Tian, Y.; Patel, J.M. Discovery-driven graph summarization. In Proceedings of the 2010 IEEE 26th International Conference on Data Engineering (ICDE 2010), Long Beach, CA, USA, 1–6 March 2010; pp. 880–891. [Google Scholar]
- Nam, J.E.; Mueller, K. TripAdvisorN-D: A Tourism-Inspired High-Dimensional Space Exploration Framework with Overview and Detail. IEEE Trans. Vis. Comput. Graph. 2013, 19, 291–305. [Google Scholar] [CrossRef] [PubMed]
- Chen, Y.C.; Wang, Y.S.; Lin, W.C.; Huang, W.X.; Lin, I.C. Interactive visual analysis for vehicle detector data. In Proceedings of the Computer Graphics Forum; Wiley Online Library: Hoboken, NJ, USA, 2015; Volume 34, pp. 171–180. [Google Scholar]
- Sarikaya, A.; Gleicher, M.; Albers Szafir, D. Design Factors for Summary Visualization in Visual Analytics. Comput. Graph. Forum 2018, 37, 145–156. [Google Scholar] [CrossRef]
- Khan, A.; Sepasgozar, S.; Liu, T.; Yu, R. Integration of BIM and immersive technologies for AEC: A scientometric-SWOT analysis and critical content review. Buildings 2021, 11, 126. [Google Scholar] [CrossRef]
- Kennedy, R.S.; Lane, N.E.; Berbaum, K.S.; Lilienthal, M.G. Simulator sickness questionnaire: An enhanced method for quantifying simulator sickness. Int. J. Aviat. Psychol. 1993, 3, 203–220. [Google Scholar] [CrossRef]
- Cao, A.; Chintamani, K.K.; Pandya, A.K.; Ellis, R.D. NASA TLX: Software for assessing subjective mental workload. Behav. Res. Methods 2009, 41, 113–117. [Google Scholar] [CrossRef] [PubMed]
- Slater, M.; Usoh, M.; Steed, A. Depth of presence in virtual environments. Presence Teleoperat. Virtual Environ. 1994, 3, 130–144. [Google Scholar] [CrossRef]
- Nowak, K.L.; Biocca, F. The effect of the agency and anthropomorphism on users’ sense of telepresence, copresence, and social presence in virtual environments. Presence Teleoperat. Virtual Environ. 2003, 12, 481–494. [Google Scholar] [CrossRef]
- Lewis, J.R. IBM computer usability satisfaction questionnaires: Psychometric evaluation and instructions for use. Int. J.-Hum.-Comput. Interact. 1995, 7, 57–78. [Google Scholar] [CrossRef]


Disclaimer/Publisher’s Note: The statements, opinions and data contained in all publications are solely those of the individual author(s) and contributor(s) and not of MDPI and/or the editor(s). MDPI and/or the editor(s) disclaim responsibility for any injury to people or property resulting from any ideas, methods, instructions or products referred to in the content. |
© 2023 by the authors. Licensee MDPI, Basel, Switzerland. This article is an open access article distributed under the terms and conditions of the Creative Commons Attribution (CC BY) license (https://creativecommons.org/licenses/by/4.0/).
Share and Cite
Chang, H.-M.; Hsu, T.-W.; Tsai, M.-H.; Babu, S.V.; Chuang, J.-H. Design and Evaluation of an Asynchronous VR Exploration System for Architectural Design Discussion Content. Virtual Worlds 2024, 3, 1-20. https://doi.org/10.3390/virtualworlds3010001
Chang H-M, Hsu T-W, Tsai M-H, Babu SV, Chuang J-H. Design and Evaluation of an Asynchronous VR Exploration System for Architectural Design Discussion Content. Virtual Worlds. 2024; 3(1):1-20. https://doi.org/10.3390/virtualworlds3010001
Chicago/Turabian StyleChang, Hsuan-Ming, Ting-Wei Hsu, Ming-Han Tsai, Sabarish V. Babu, and Jung-Hong Chuang. 2024. "Design and Evaluation of an Asynchronous VR Exploration System for Architectural Design Discussion Content" Virtual Worlds 3, no. 1: 1-20. https://doi.org/10.3390/virtualworlds3010001
APA StyleChang, H.-M., Hsu, T.-W., Tsai, M.-H., Babu, S. V., & Chuang, J.-H. (2024). Design and Evaluation of an Asynchronous VR Exploration System for Architectural Design Discussion Content. Virtual Worlds, 3(1), 1-20. https://doi.org/10.3390/virtualworlds3010001