
Speech Intelligibility versus Congruency: User Preferences of the Acoustics of Virtual Reality Game Spaces

AudioLab, School of Physics, Engineering and Technology, University of York, York YO10 5DQ, UK
*
Author to whom correspondence should be addressed.
†
These authors contributed equally to this work.
Virtual Worlds 2024, 3(1), 40-61; https://doi.org/10.3390/virtualworlds3010003
Submission received: 13 June 2023
/
Revised: 28 November 2023
/
Accepted: 28 December 2023
/
Published: 19 January 2024
Abstract
:3D audio spatializers for Virtual Reality (VR) can use the acoustic properties of the surfaces of a visualised game space to calculate a matching reverb. However, this approach could lead to reverbs that impair the tasks performed in such a space, such as listening to speech-based audio. Sound designers would then have to alter the room’s acoustic properties independently of its visualisation to improve speech intelligibility, causing audio-visual incongruency. As user expectation of simulated room acoustics regarding speech intelligibility in VR has not been studied, this study asked participants to rate the congruency of reverbs and their visualisations in 6-DoF VR while listening to speech-based audio. The participants compared unaltered, matching reverbs with sound-designed, mismatching reverbs. The latter feature improved D50s and reduced RT60s at the cost of lower audio-visual congruency. Results suggest participants preferred improved reverbs only when the unaltered reverbs had comparatively low D50s or excessive ringing. Otherwise, too dry or too reverberant reverbs were disliked. The range of expected RT60s depended on the surface visualisation. Differences in timbre between the reverbs may not affect preferences as strongly as shorter RT60s. Therefore, sound designers can intervene and prioritise speech intelligibility over audio-visual congruency in acoustically challenging game spaces.
1. Introduction
Advancements in 3D audio spatializers for game engines allow a virtual room’s geometry and surface materials to inform reverb simulation. These algorithms, such as the one used in Google Resonance Audio, ask the sound designer to map the surfaces as visualized to the acoustic properties of surface materials known to the algorithm [1,2]. The algorithm then calculates the room’s corresponding reverb.
This strategy poses several unique artistic and technical challenges which the sound designer must mediate. Firstly, the spatial audio algorithm may only contain a limited number of surface materials that may not include corresponding options to the materials as visualized, potentially limiting the designer’s ability to match the room’s acoustics to its visualization. For example, Google Resonance Audio currently provides only a fixed set of 24 materials that can be matched to visuals [2].
Secondly, current reverberation algorithms, including commercial solutions, feature simulation inaccuracies, leading to plausible but inauthentic renditions [3]. Additionally, a one-to-one mapping mimicking real-world acoustics may not entirely be fit for purpose in a game as the mapping may contradict an experience’s overriding artistic requirements, such as expressing sensory hallucinations using audio [4]. Most importantly, game spaces may be designed with an emphasis on, for example, storytelling and interactivity rather than acoustic suitability [5], potentially leading to spaces with poor speech intelligibility. These challenges and their mitigation could introduce mismatches between what the player sees and expects to hear, i.e., spatial audio-visual incongruence.
However, spatial audio-visual incongruence could cause quality-degrading effects and negatively affect the player’s experience in VR ([6], p. 170). As users expect a reverb’s RT60 to match the presented room size and its visualization [7], the incongruence between a room’s visualization and expected auralization, also known as room divergence ([6], p. 170), may negatively affect distance perception and externalisation of auditory events [8,9,10,11,12]. Furthermore, players can only tolerate spatial and temporal incongruence of audio-visual stimuli to a limited degree [9,13]. In contrast, spatial audio-visual congruency may improve both user experience [14] and multi-modal integration [15]. Therefore, avoiding spatial audio-visual incongruence in VR is particularly important.
Resolving these artistic and technical challenges while minimizing room divergence creates a unique dilemma for sound designers, especially when a room’s simulated acoustics would impair its designated use case. If the player is supposed to understand speech-based audio in a highly reverberant, virtual room, should the surface materials used in a room’s auralization be changed independently from its visualization to reduce the reverberation time? While audio-visual incongruence regarding time, space and semantics have been studied in six-degrees-of-freedom (6-DoF) VR, investigations towards room divergence, sound designer intervention and speech intelligibility are under-researched.
This paper addresses this shortcoming by investigating participant expectations of mediated reverberation of indoor spaces presented in 6-DoF VR within the technological context of game experiences. Using a VR headset and reverberated speech-based test signals, this study placed participants in a stylized game world. The participants ranked four reverberation options in three indoor spaces according to spatial audio-visual congruence. The options are compared between a one-to-one mapping of a room’s surfaces as visualized (“congruent reverbs”) and three alternatives (“sound-designed reverbs”). The alternatives introduce intentional audio-visual mismatches in surface materials to improve a room’s acoustics regarding speech intelligibility and overall timbre. The resulting ratings are then tested for reliability, analysed using Plackett–Luce models (PLM) [16,17], correlated to their corresponding RT60s and tested for underlying covariates.
This paper’s study design has the following aims:
- To answer whether speech intelligibility and a reverb’s timbre are more important to users than congruency between a room’s visual representation and acoustics.
- To test if sound-designed room acoustics using strategic placement of alternative surface materials lead to positive congruency ratings despite audio-visual mismatches.
- To estimate the extent to which sound designers can improve a room’s suitability for speech.
2. Background
Testing a participant’s expectation of room acoustics in multi-modal environments such as 6-DoF VR is not straightforward, requiring consideration of various factors that could obscure findings. The visual impact on spatial audio perception, plausibility testing and test designs for studies in 6-DoF VR applications will be briefly discussed.
2.1. Visual Impact on the Perception of Spatial Audio
Firstly, visual stimuli can impact the perception of spatial audio. For example, the visual content affects the perceived audio quality [18], sound localisation (ventriloquism effect) [19,20,21,22] and distance perception of audio sources [23,24,25]. Sound localisation benefits from the presence of a visual-spatial frame [26], and visual distance perception benefits from the presence of reverberation [27]. However, the perception of reverberation may not be affected by visual room impressions in virtual environments [28]. This finding may depend on the participant’s strategy for resolving audio-visual incongruence. Additionally, audio-visual incongruence could impair cross-modal integration and thus lead to greater cognitive load [29]. Finally, scene complexity and interactivity in 6-DoF VR may impede quality judgments [30]. Thus, the experimental design must consider the interaction between the audio and visual stimuli and their degree of change between trials to minimize confounding factors.
2.2. Plausibility Testing
Plausibility testing of 6-DoF VR content is challenging. Lindau and Weinzierl define plausibility as the “perceived agreement with the listener’s expectation towards an equivalent real acoustic event” [31]. The participant’s personal experience and expectation become the reference—also called an inner reference—under which they judge the simulation [32]. Lindau and Weinzierl propose this concept as a criterion for evaluating VR applications [31]. However, the inner reference can be ’accurate, vague or wrong; thus, the listener’s expectation needs to be considered based on the “targeted group, their level of training and experience, the content, and the use case” [33]. Furthermore, the context in which the testing occurs must also be considered, including the sequence of plausibility evaluations due to priming effects [32]. These findings imply that the testing process and the experiment design may affect the observed experiment’s outcomes and that the results may not fully be transferable from one population to another.
2.3. Testing of Participants in 6-DoF VR
Due to a lack of standards for the subjective evaluation of spatial audio-visual content in headset-based 6-DoF VR, methodologies from prior VR studies and existing recommendations would need to be adapted to obtain appropriate testing and participant screening methods. Fela, Zacharov, and Forchhammer propose a framework for assessor selection [34]. It includes, among other aspects, a pre-screening questionnaire inquiring about the participant’s audio-visual experience and several audio-visual tests evaluating the participant’s discrimination ability to assess suitability for perceptual quality evaluation of 360 audio-visual content. Furthermore, the recommendation ITU-T P.919 suggests a limit of 25 min of continuous stimuli rating, minimum specifications of head-mounted displays (HMD), pre-and post-screening of subjects based on questionnaires or interviews, and the inclusion of dummy test conditions used as references [35].
Brinkmann and Weinzierl provide an overview of VR/AR-specific user interfaces, test procedures and toolkits, including examples of the application of MUSHRA, ABX or yes/no-tests, and the rank-by-elimination procedure [6]. The latter is adapted to 6-DoF VR by Rummukainen et al. and initially proposed by Wickelmaier et al. [16,36]. In the rank-by-elimination method, the participant removes stimuli from a given set sequentially while evaluating specific aspects of the stimuli. The order of removal corresponds to the participant’s ranking of the stimuli. Robotham et al. recommend using this method in multi-modal 6-DoF VR and reference-free testing due to its efficiency, mental demand and participant effort compared to MSHR (multiple stimuli, hidden reference) methods [30].
3. Materials and Methods
3.1. Design Criteria of the Study
The study presented in this paper tests the following null hypothesis:
H0:
Participants prefer a 1-to-1 mapping of a room’s surfaces as visualized to their acoustic equivalents (room congruency) over a sound-designed mapping that improves upon a room’s speech intelligibility or timbral colouration but induces room divergence.
The hypothesis assumes that speech intelligibility is improved when a room’s reverberation time is reduced [37,38] and a room’s timbre is improved when the reverberation has an even frequency response [39]. The hypothesis also assumes that the sound designer cannot change a room’s visualization.
The experimental design was fit around the study’s hypothesis and the previously discussed constraints of multi-modal testing in 6-DoF VR, resulting in the following criteria:
- To facilitate the participant’s natural movement, the study will run standalone on a Meta Quest 2 HMD.
- The room design should imitate real-world spaces: They should contain at least one window and feature commonly used building materials that are visible in the game space and available as an option in the reverberation algorithm. This criterion aims to increase the chance that the participant may have experienced such a space before and has a corresponding inner reference.
- The test signal that excites the room’s reverberation should be emitted from the same position as its visual representation to aid distance perception and audio-visual congruency.
- The test environment should be of low complexity with few visual changes between trials, and interaction should be limited to the bare essentials for the test.
- Room acoustics will be adjusted by only optimising the mapping of the surface materials between the audio and the visuals as per the definition of H0.
3.2. Test Environment
The study ran standalone on a Meta Quest 2 VR headset [44] with additional 3rd-party accessories attached to the headset. The accessories attempted to alleviate some of the constraints of the Quest 2. An alternative head strap facilitated personalising the headset’s fit to the participant’s head. The head strap also provided an additional power source that acted as a headset counterweight, leading to a more balanced weight distribution and extended running time. The closed headphones (Austrian Audio Hi-X55) improved the audio playback quality compared to the headset’s built-in speakers and minimized disruption from real-world sound sources and in situ acoustics. The headphones’ audio cable was coiled and tied to the head strap. The total weight of the headset, including accessories, was 1173 grams.
The study used Unity 2021.3.14f1 [45] and additional 3rd-party SDKs. Unity’s XR Interaction Toolkit 2.2.0 leveraged access to the VR headset and facilitated the implementation of user interaction [46]. FMOD 2.02.09 replaced Unity’s audio engine to facilitate audio implementation [47]. FMOD also integrated 3D spatial audio, including real-time reverberation for movement in 6-DoF using its built-in binaural renderer Google Resonance Audio [47]. Resonance Audio uses a generalized HRTF based on the Sadie database [1]. The headphones’ frequency response was equalized via FMOD’s convolution real-time effect using an impulse response created with the headphone calibration software AutoEQ 2.2.0 [48]. The visual assets were sourced from Unity’s Asset Store and free online repositories [49,50,51]. All Platforms Save exported user response data from Unity to JSON [52].
Despite Steam Audio potentially offering better acoustic simulations than Resonance Audio when using Odeon as a benchmark [53], Resonance Audio was used. Resonance Audio’s shoebox-type reverberation in FMOD facilitated the test design as changes in the mapping of materials used in the acoustic simulation can be heard in real-time [2]. Also, Resonance Audio offered more options to adjust the timbre of the reverb through a higher number of frequency bands with associated absorption coefficients. Furthermore, the opportunities of the reverberation algorithm invited sound designer intervention as some material combinations resulted in long reverb tails and stronger colouration than others (see Section 3.4.2), creating the need for this study.
The study ran in one of the teaching rooms at the AudioLab at the University of York. This room offered a quiet, large, unobstructed play space of approximately 5 m by 3 m.
3.3. Test Design
The experiment consisted of four sections presented in VR in 6-DoF: the pre-test questionnaire, the visual identification test, the congruency test, and the post-test questionnaire. The congruency test constituted the primary test of the study, whereas the others provided background information about the participant’s experience and perception. Appendix A contains the questionnaire used in the pre-and post-test questionnaire and lists the sources on which the questions are based. Separating the questionnaires and tests into separate sections (“scenes”) facilitated implementation and optimised the experiment to the Quest 2’s processing resources. Figure 1 provides a schematic overview of the experimental procedure.
To test the participant’s understanding of the visuals, the visual identification test asked the participant to identify the visual textures of selected surfaces in the virtual room using a multiple-choice testing process and repeated measures design. Each trial tested one surface material, with three different materials being tested. Once the participants had identified the material, they selected the corresponding text label out of seven possible options; however, only one option was correct. Each trial was repeated twice, leading to six trials in total. The order of the trials was fully randomised. All participants experienced all trials and all three surface materials.
To test the paper’s main hypothesis, the participant ranked the congruency of the reverberation of virtual rooms in the congruency test using a ranking-by-elimination procedure, considering the visible surface materials and the room’s size. This test played back four reverberation stimuli per trial represented by the letters A to D. Each letter corresponded to one reverberation option to be heard one at a time at will by the participant. In each trial, the participant was first asked to listen to all the reverberation options while moving slightly in the virtual play space. Then, they had to remove the least matching reverberation option one by one. Removing the option from the list was final; no undo was offered. One visual material covering most of the room’s surfaces was tested per trial. Each surface material to be tested was associated with its tailored reverberation options (Section 3.4.2).
This test tested the same three surface materials as the visual identification task but used three repetitions, leading to nine trials. The order of the trials and the association of letters to stimuli was randomised. This randomisation encouraged the participant to listen to each stimulus anew, restricting the potential for memorising the association between audio and visual stimuli. The test’s duration was limited to 20 min to constrain the maximum time spent in VR during the experiment and limit listening fatigue, staying below ITU-T P.919 recommended maximum duration [35]. Unless stopped by the test’s timeout, all participants answered all trials.
3.4. Spatial Audio-Visual Design
To avoid updating the participant’s inner reference of reverberation before the congruency task (“priming”), the study’s sections were differentiated between outdoor and indoor spaces and silent and reverberant indoor spaces.
3.4.1. Outdoor vs. Indoor Spaces
The outdoor spaces served as an arrival space for the participants to become accustomed to the virtual environment and its acoustic representation in 3D spatial audio before and after the two tests. They asked the participant to complete the questionnaires and read the section’s test instructions without experiencing indoor reverberation. The participants heard a quiet, atmospheric field recording of a mountain area with distant bird calls. The recording was decoded from first-order Ambisonics to binaural audio based on the listener’s head orientation. Aside from a male speech prompt (“audio level test”) in Section 1, no other sounds or reverberation were audible. The prompt played back a speech sample in front of the participants, asking them to alert the experimenter if the audio level was too high or too low.
The visual identification and congruency test occurred in the same virtual indoor rooms. Each room shares the same dimension of 7 by 4 by 11 m (W × H × L) across trials to minimize confounding variables. The room’s size of 308 m3 ensured an audible reverb tail with the tested surface materials. The rooms of the visual identification task remained silent to avoid priming the participant regarding the experiment’s reverberation before the congruency test. The rooms of the congruency test contained the reverberation options made audible by two test signals: a loop of male speech and a hum of a refrigerator.
The speech loop consisted of a male voice reading sentence 8 of list 1 of the revised list of phonetically balanced sentences [54]. The loop ended with ≈800 ms of silence. A 10 s reverb was applied on the recordist’s headphones during the recording of the loop to encourage him to strongly enunciate the text’s consonants and add clear pauses between words. The slow reading speed and silence between each loop improved speech intelligibility in large spaces and highlighted the reverb’s spectral behaviour over time.
The speech signal emanated from an inanimate, low-poly humanoid avatar 5.75 m from the participant’s default position. Its distance attenuation curve was set to fall off quickly within 8 m. This set-up attenuated the speech’s direct signal at the default position by approximately 20 dB to highlight the room’s reverberation to the participant. In other words, the participant heard the test signal very reverberant. However, as the test’s instructions encouraged, they could intuitively increase the speech’s direct signal level by walking or leaning towards the sound source.
The congruency test also included a recording of a barely audible refrigerator hum, emanating 8.67 m away from the participant’s default position and visualised by a low-poly model of a refrigerator. The hum subtly excited the room’s reverberation to prevent the room from falling silent in case the participant turned off the speech signal. The hum was set to a barely perceivable level to avoid acting as a masking signal.
3.4.2. Reverberation Design in the Congruency Test
Unfortunately, Google only provided a reference mapping of colours to acoustic surface materials in their reverberation demo scene, e.g., green for grass, dark blue-grey for rock [55]. A mapping to visual textured surfaces thus required user interpretation. The authors created their mapping based on their understanding of Resonance Audio’s surface material text labels and the labels of the visual textures provided by 3D artists. In some cases, for example, with Resonance Audio’s label “Curtain, Heavy” or “Acoustic Ceiling Tiles”, finding a corresponding visual depiction within asset libraries was challenging. Because of this reason, we preceded the congruency test with the visual identification task.
The three main test materials—marble (“Marble”), curtain heavy (“Fabric”) and concrete blocks (“Blocks”)—constituted edge cases. The first two were chosen as they resulted in intrinsically flawed reverberation when mapping the visual surface materials to acoustic materials in a one-to-one fashion. “Blocks” was chosen as a control, as the one-to-one mapping did not impair speech intelligibility. These materials, one per trial, were assigned to the front, right and back walls and ceiling (from the participant’s perspective). Comparing absorption coefficients of these materials [56], the marble material resulted in an overly long reverb tail as each frequency band absorbed very little acoustic energy; the fabric material (“curtain, heavy”) resulted in a reverb tail with strong colouration towards the low-frequency bands as the material absorbed lower frequencies less than higher frequencies; the concrete blocks resulted in a relatively short and balanced reverb tail due to the material’s relatively strong absorption across the frequency bands.
The left wall was assigned to a glass window, and the floor to a wooden parquet. The material used for the floor reduced the room’s overall reverberation time slightly. The window’s acoustic material avoided overly strong low-frequency absorption by using “glass thin” rather than “glass thick” and facilitated the use of ambient light (see Section 3.4.5).
The test design compared each one-to-one mapping to three alternatives (Table 1). The alternatives, except for reverb “J”, aimed to share the character of the one-to-one mappings wherever possible or suitable while gradually reducing spectral imbalances or lowering the reverb’s overall reverberation time (RT60) to improve speech intelligibility (D50). In contrast, “J” is used as an anchor to test if the one-to-one mapping of “I” is perceived as too short. The gradual improvements in acoustics between the alternatives are made by assigning plausible materials used for room acoustic treatments with increasingly higher absorption coefficients and strategic placement on the walls, e.g., “glass thick” instead of “glass thin” and “brick” instead of “marble” (reverb “B”). Changing the materials of the ceiling or floor has a larger effect than adjusting a side wall due to their difference in surface area. Furthermore, the negative impact of the alternative materials on the reverb’s spectral balance or overly strong absorption required replacing materials on additional surfaces, e.g., “concrete block coarse” on the ceiling instead of “curtain heavy” to soften the impact of “transparent” on the walls (“F”).
Table 2 provides general information about each room’s mean RT60 and the ratio between the low, mid, and high-frequency bands. The RT60s were reported by Resonance Audio using its reverb baking functionality. The mean is calculated across nine frequency bands running from 63 Hz to 8000 Hz. The ratio is based on the maximum RT60 in a grouped frequency band, indicating the room’s timbre. The low band considers the octave bands 63, 125 and 250 Hz; the mid-band corresponds to 500, 1000 and 2000 Hz; the high band corresponds to 4000 and 8000 Hz. For example, reverbs “E“ and “G” may appear boomy, whereas “H” appears rather bright and “F” is more neutral. Plots comparing the different reverberations’ RT60 per test material are supplied in Appendix B (Figure A1, Figure A2 and Figure A3).
Table 2 also shows a room’s mean D50. The D50 is an objective measure correlating to a room’s speech intelligibility, with higher values indicating better speech intelligibility and a Just Noticeable Difference (JND) of 5% [57,58]. The D50s were derived from impulse responses using Angelo Farina’s Aurora Plugins for Audacity [59] and calculated according to ISO 3382 [58]. The impulse responses were generated using a Dirac impulse placed at the speech signal’s position, captured at the listener’s default position [58] and recorded in Reaper [60] using the soundcard’s loopback function (RME Babyface). The Dirac impulse was used as the T20 measure derived from it approximated Resonance Audio’s reported values closer than an exponential sine sweep (see Figure A4 in Appendix B). Using an exponential sine sweep for IR measurement in Resonance Audio resulted in excessive background noise, obscuring reliable measurements. This effect was also encountered in [61]. To obtain a single value for the D50, the D50 has been averaged from 500 to 1000 Hz across three measurements/impulse responses according to [58].
3.4.3. Scenery
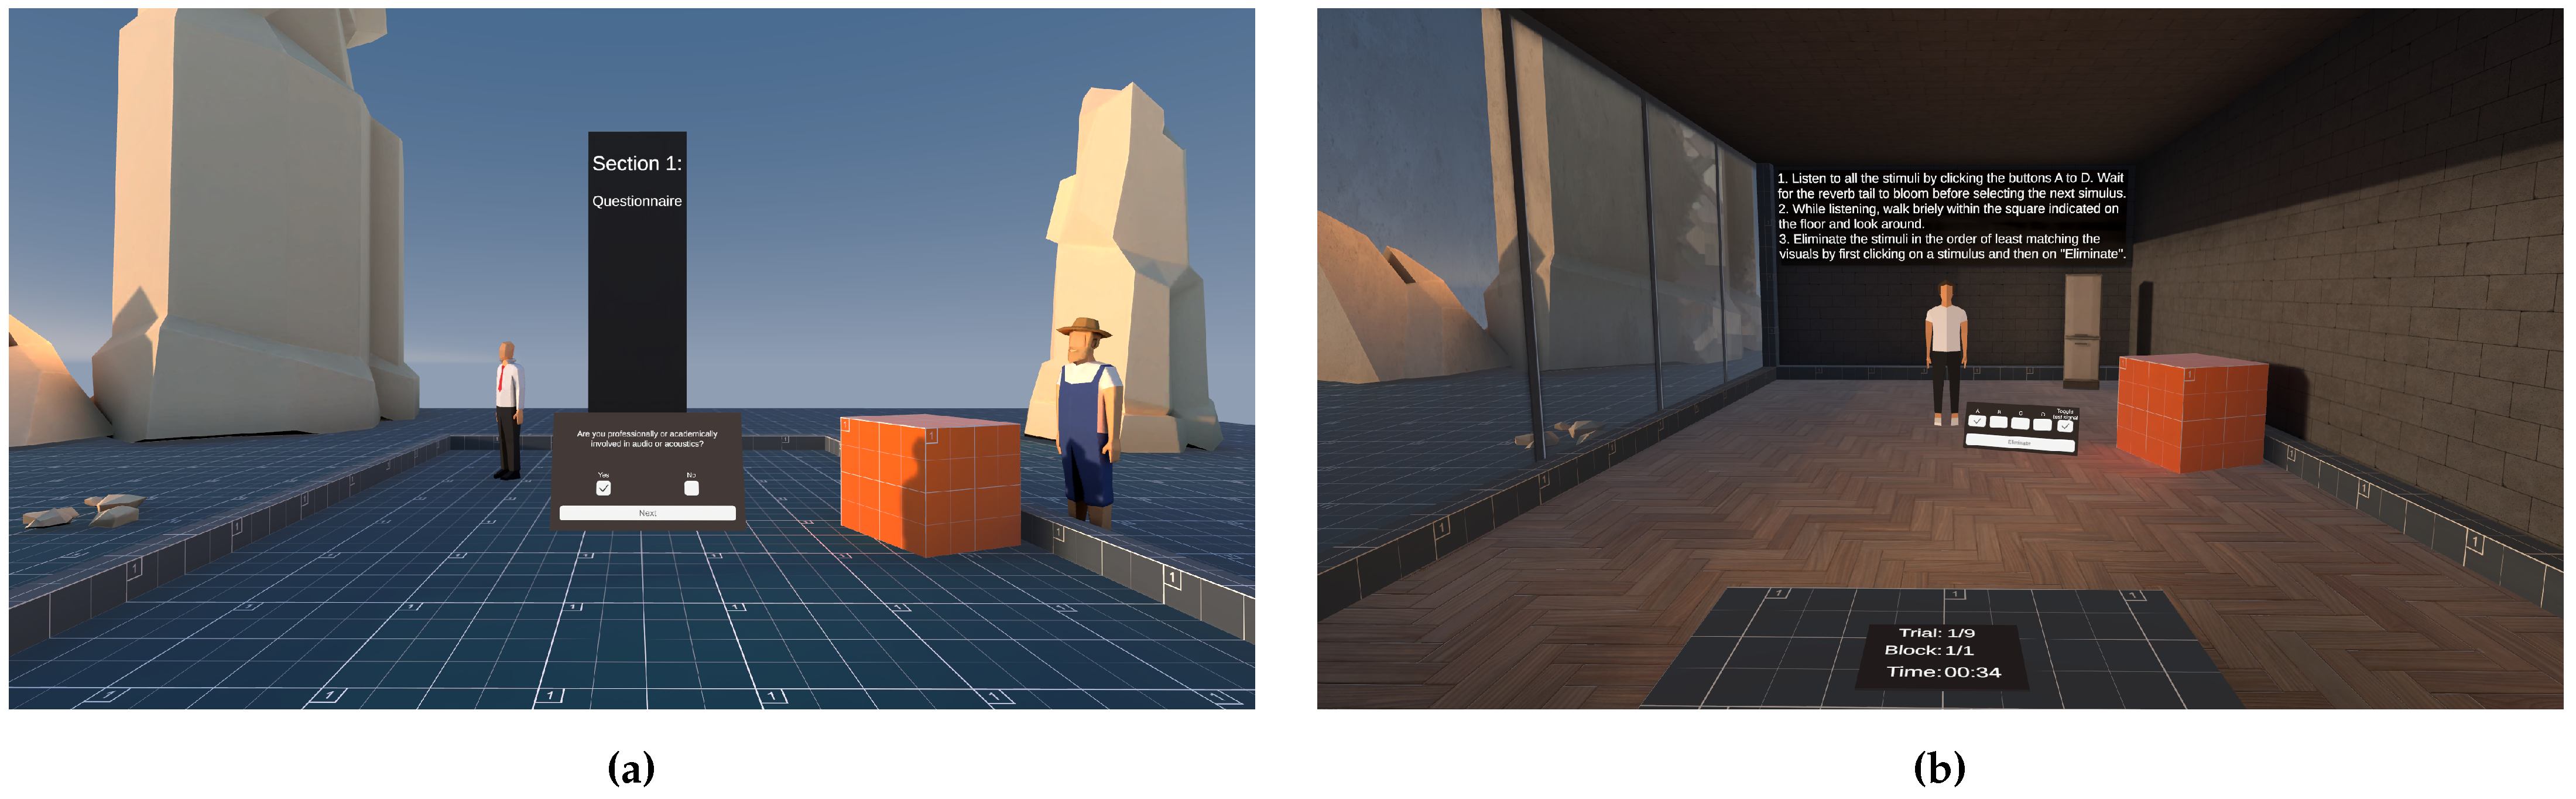
Discussing the visual scenery, the pre-test and post-test questionnaires placed the participant outdoors in a low-poly, mountain-like environment within a “sandbox” consisting of a frame around the floor (Figure 2a). A model of a “rising” sun was shown on the participant’s left, as well as a spotlight attached to a trussing rig behind the participant on their right. Further 3D models of small and large stones, a cube of 1 m3 (“the reference cube”), a monolith indicating the current section, and inanimate humanoids were placed across the scene. The user interface (UI) was floating at a fixed, central position in the virtual space.
The visual identification and congruency tests placed the participants first in a similar outdoor environment, presenting them with the test instructions. The participants were then transferred to an indoor environment for the tests (Figure 2b). A partially opaque window on the participant’s left allowed them to see the previous mountain environment. The test instructions were written on the front wall. Additional objects included a floating panel containing the UI, the reference cube, the sandbox frame and general information about the current trial (trial and block number, elapsed time). The congruency test also included low-poly models of a humanoid and a fridge.
3.4.4. Scale
Care has been taken to give the participant a consistent sense of scale. The reference cube, sandbox frame and floor contained grid-like textures that indicate a visual-spatial frame, as recommended in [26]. This frame was further reinforced by adding humanoid models, providing an intuitive, human-centred reference. Furthermore, the textures representing real-world materials approximated the scale of their real-world counterparts wherever possible to avoid contradictions in the visual-spatial frame.
3.4.5. Lighting
Two light sources provided lighting for the scenery. The sun provided general ambient lighting. The sun’s angle was set low to illuminate the right wall and floor of the scenery via the large window. The spotlight provided accent and task lighting to ensure the illumination of the central humanoid model, UI panel and floor. The shadows for these props were deactivated to conserve GPU processing power. The UI’s text was unlit, i.e., unaffected by the scenery’s lighting. The lighting remained unchanged for the outdoor and indoor environments to avoid adding confounding variables.
As recommended by [62] to reduce GPU and power consumption, the ambient lighting was pre-computed and stored into the 3D object’s texture (“baked”). However, the baking procedure required the test’s materials to be set up as separate rooms within a Unity scene so that each material’s associated texture could receive baked lighting, affecting the experiment’s locomotion design.
3.5. Locomotion and User Interface
From the participant’s point of view, the study includes no artificial motion, i.e., their movement in 6-DoF in the real world corresponds to their movement in the virtual world. However, as the rooms containing the test’s materials were separated in space, a teleportation system was required to transport participants between trials from one room to another and between the study’s sections. These transitions occasionally became visible as a brief, bright blue flash. The system teleports the participants to the same default position for every trial and section.
The user interface consisted of a flying panel presenting the UI. The UI contained text and buttons the participant activated by pointing at them with their hand-held controller and pressing its trigger button. The participant’s hands were represented in VR through a 3D model of a hand-held controller; no other limbs of the participant were represented.
3.6. Study Exclusion Criteria
Exclusion criteria were set to protect the safety of the participants, reduce the risk of infection by using a shared experiment apparatus and enable the participant to complete the study. This included:
- Limiting the participant’s age to fall between 18 and 60 years.
- Requiring the participant to be able to operate two hand-held controllers and a VR headset with headphones and be able to sit, stand and walk unassisted.
- Excluding participants with active medical conditions, such as open wounds, heart or neurological conditions, implanted electronics or photosensitivity.
- Excluding participants with self-determined low vision or major hearing impairments and vulnerable groups.
No harsher exclusion criteria for hearing abilities were set to increase participant eligibility. Ethnicity or gender have not been considered as confounding factors and, therefore, have not been controlled through targeted population sampling.
4. Results
4.1. Participant Demographics
Participants were recruited through university newsletters, and 19 individuals participated in the study. These individuals were students or staff from the university’s School of Physics, Engineering and Technology or XR Stories’ project team (“convenience sampling”), with most of the individuals being recruited from the audio engineering department. Participants were mostly male (89.5%), aged between 18 and 60. To aid compliance with GDPR data protection regulations and data anonymization, the participants’ exact ages, genders and ethnicities were not collected. Participants were not compensated for their time. Obtaining a larger sample size was not possible within the project constraints.
Convenience sampling was the preferred method of choice. It ensured that most participants would have had some form of audio training and would be able to discriminate the differences in the aural stimuli. Non-expert listeners were included in the data analysis as their rating performance did not substantially differ from the expert listeners.
According to the pre-test questionnaire, most participants were professionally or academically involved in audio or acoustics (78.9%, 15 participants), leading to a population bias towards participants with some form of audio training. This bias is slightly reflected in experience with spatial audio via loudspeakers, as 47.4% (9) have weekly or monthly and 36.8% (7) have seasonal exposure. However, this bias in audio training is not reflected in previous experience with VR, as an equal number of participants have either only yearly or never spent time in VR before as those who have on a monthly or weekly basis (42.1%, 8).
The main results of the visual identification task and post-test questionnaire will be briefly included in the discussion of the findings of the congruency test.
4.2. Congruency Test
The mean time to complete this test was 786.70 s (SD 228.53 s). The mean duration per trial is 88.95 s (SD 39.94 s, minimum 18.08 s, maximum 282.42 s). Two participants did not complete all the trials due to running out of time, leading to missing data. Missing data have been excluded from the analysis for the specific trial.
Most participants used their freedom in 6-DoF to explore the rooms (Figure A5). The mean distances walked were higher in the first trial (14.4 m, SD 10.22 m) than in the last (2.5 m, SD 2.24 m). Thus, most participants spent more time near their default position in subsequent trials. One participant required manual re-alignment of the virtual space with the play space in trial 5, leading to an artefact in the data. Furthermore, on average, participants approached the sound source by 0.41 m (SD 0.18 m) in all trials and by 0.8 m (SD 0.53 m) in the first trial, leading to an increase in its direct level by 2.9 LU (dB) and 5.3 LU (dB) at these listening positions.
4.2.1. Reliability Tests Performed on the Ratings
A Chi-square goodness-of-fit test was used to assess if each trial’s rankings were random, comparing the distribution of the observed rankings with assumed rankings based on mean ranks [63]. The null hypothesis tests if the distributions are the same [63]. Table 3 shows that this null hypothesis can be rejected for each trial, as the observed ratings differ significantly.
However, the observed ratings show poor agreement with each other and high variability in some instances. Counting the number of different ratings for the same reverb, for example, “L” received a different rating in each trial from 61.1% of the participants, whereas “A” received the same rating in all repetitions from 82.4% of the participants (Table 4). Results of the calculation of the Intraclass Correlation Coefficient (ICC) support this impression of variability (Table 5). The ICC is computed over the ratings and trials per material type using a two-way mixed effects model, absolute agreement and a single-rater unit [65]. The calculations indicate poor absolute agreement between the participants for the conditions “Fabric” and “Blocks” and good agreement for “Marble”, ICC = 0.33, 0.29, 0.73 respectively and p < 0.001 in all three conditions (Table 5).
Friedman tests were run to confirm whether the distributions of the ratings per condition and option differ significantly between the trial repetitions. Although the p-values diverge between the different options, with “D”, “F”, “H” and “J” having the lowest p-values (0.097, 0.121, 0.118, 0.115 respectively), none falls below the significance threshold of a < 0.05.
4.2.2. Plackett–Luce
For fitting the ranking vectors to Plackett–Luce models, the PlackettLuce R-package was used [67], as suggested in [16]. It calculates the likelihood of an item to be selected in worth relative to a reference item; item worth “corresponds to the ranks provided by the subjects” [63,67]. The PlackettLuce package also computes Z tests if there are significant differences between the worth of the items relative to the reference [67].
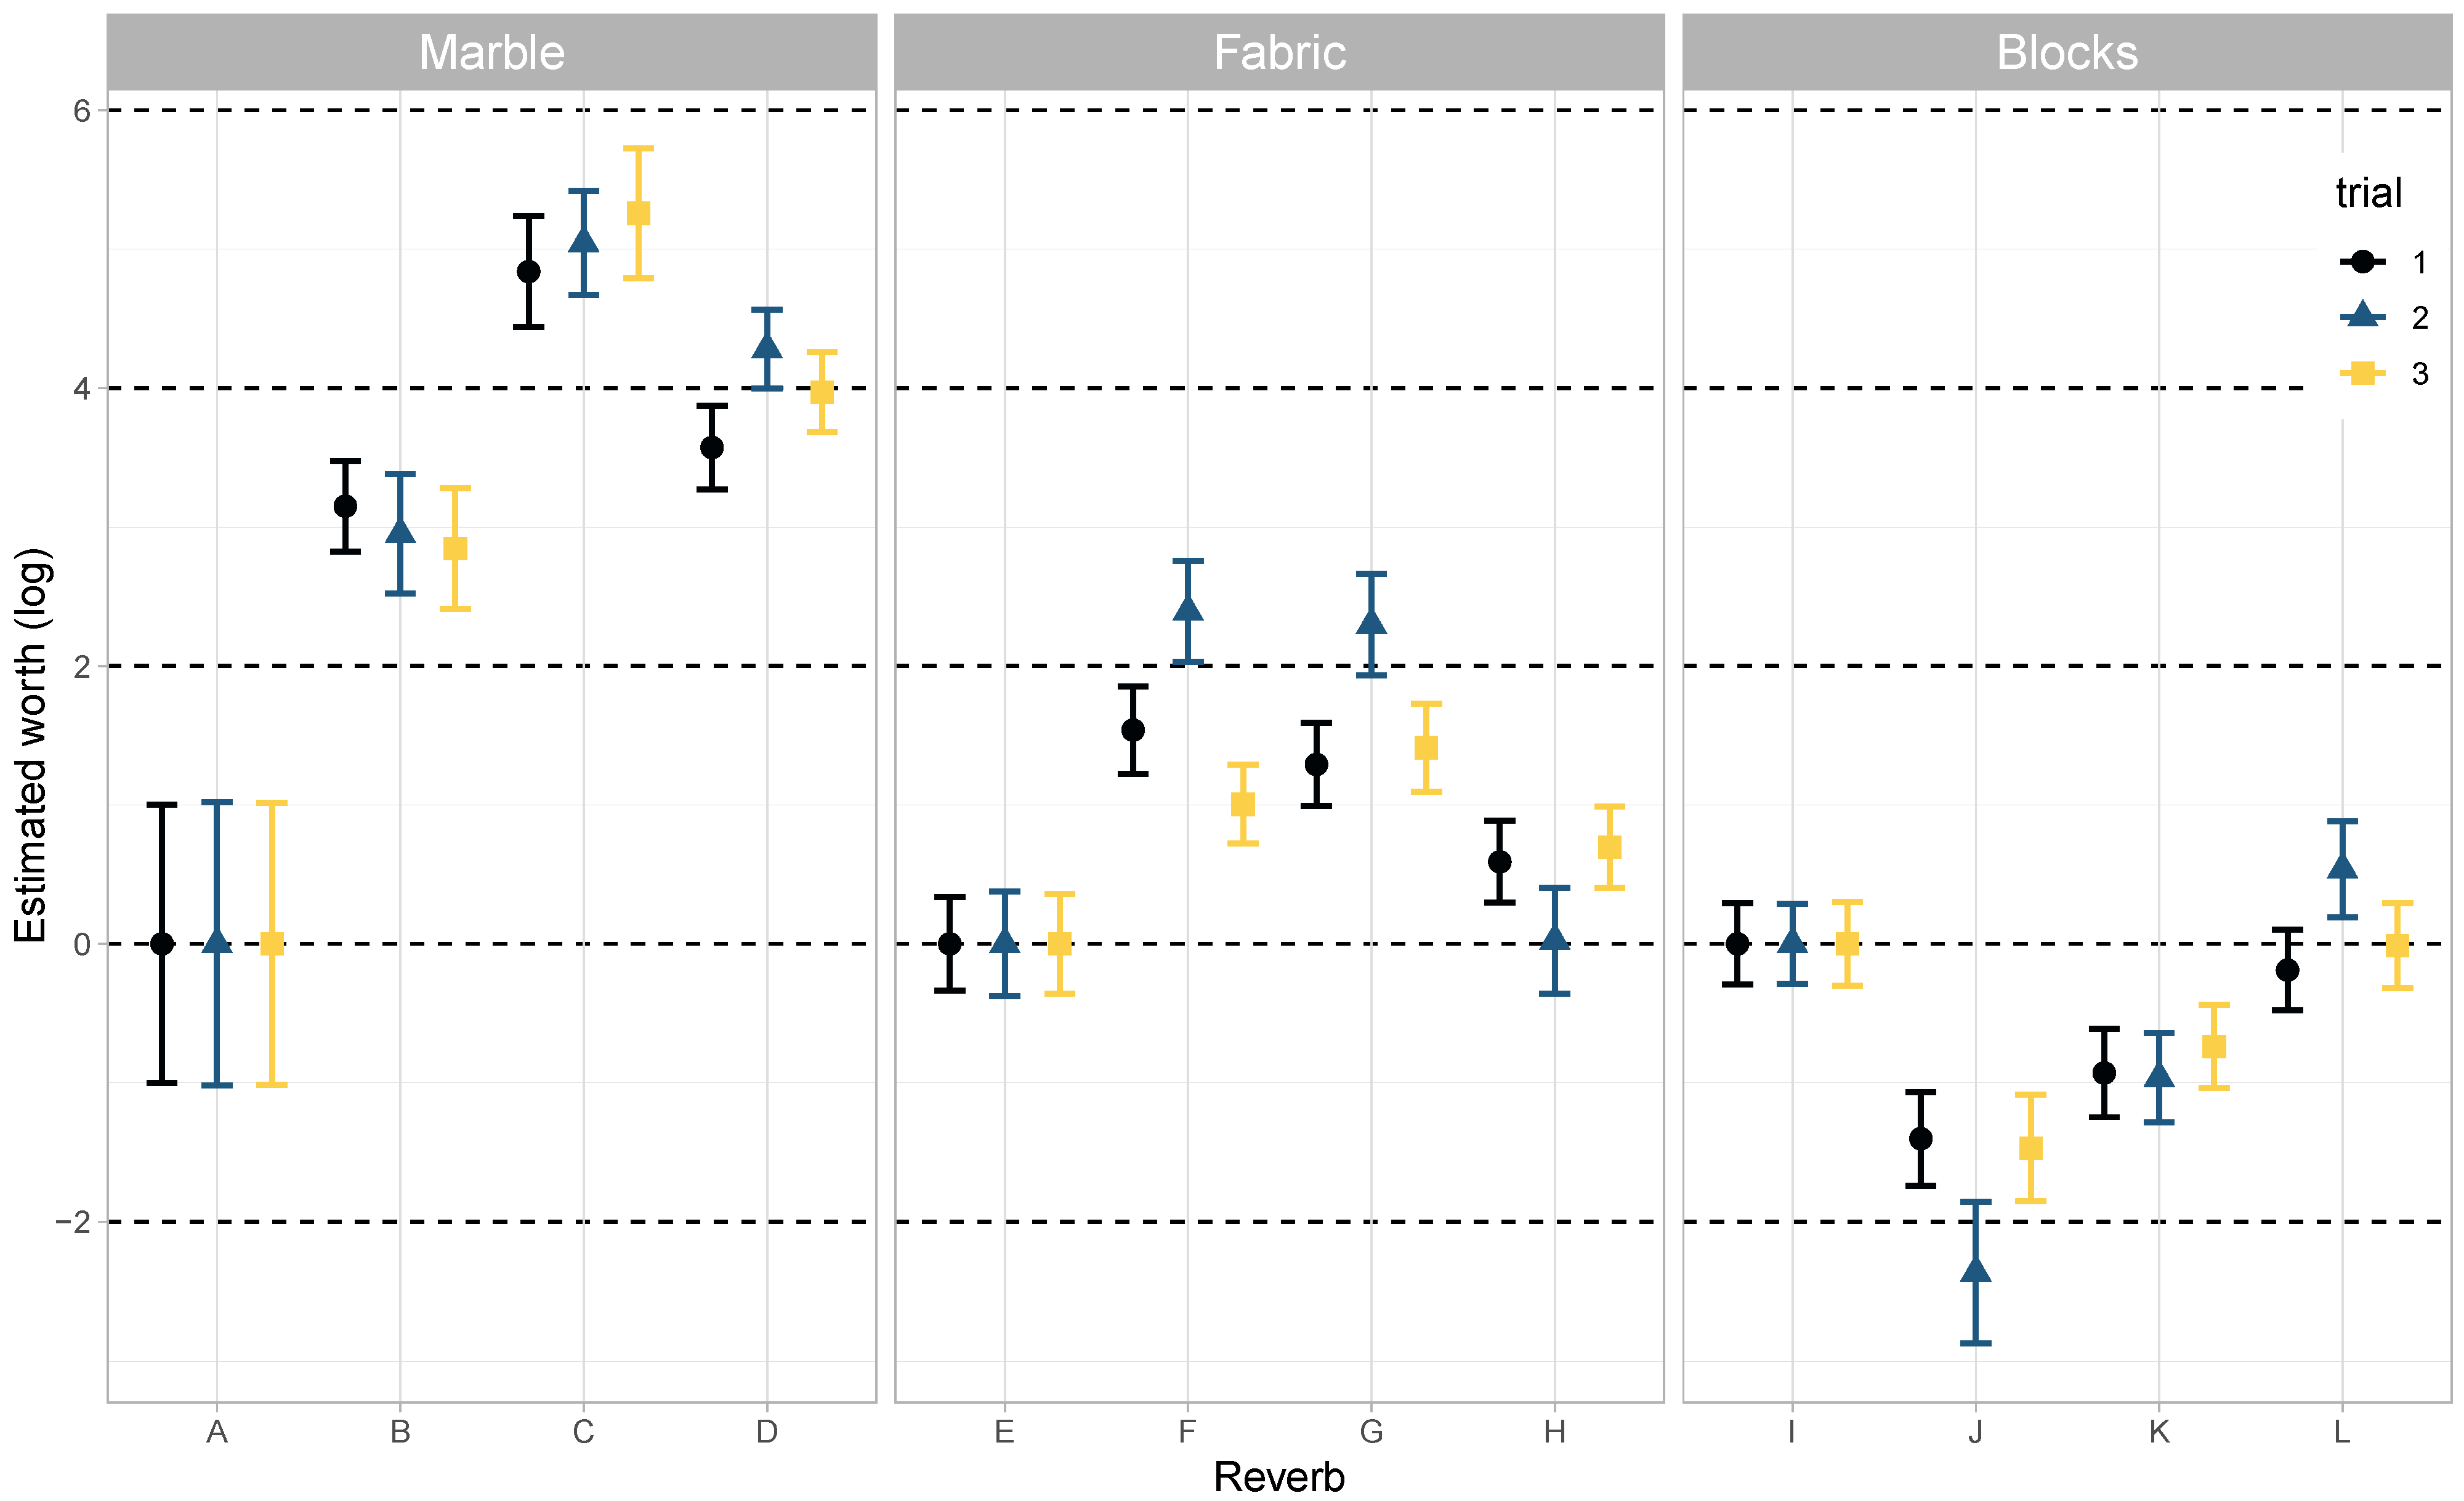
Figure 3 presents the estimated worth (log) per test material across trials. Reverbs “A”, “E” and “I” correspond to the one-to-one mapping of visual to acoustic materials and are set as the reference to which the PLM compares the alternative reverbs.
The spread and variability of the worth estimates between the material conditions relative to the one-to-one mapping differ greatly. All reverb options in “Marble” are rated significantly higher than “A” in all trials. Reverb “C” performs best (mean z = 4.49, p < 0.001), followed by “D” (mean z = 3.65, p < 0.001) and “B” (mean z = 2.9, p < 0.01). In contrast, the worth estimates vary considerably for reverb “F”, “G”, and “H” across trials in “Fabric”. “F” and “G” perform better than “E”, especially in trial 2 (z = 4.2, p < 0.001; z = 4.04, p < 0.001), but “H” does not significantly perform better than “E” in any of the trials (mean z = 0.98, p = 0.42). When using “F” as the reference of comparison, the estimated item worth for “G” does not differ from “F” significantly across all trials. In “Blocks”, reverb “J” performs worst compared to “I” (mean z = −3.38, p < 0.01), followed by “K” (mean z = −2.00, p < 0.1). However, there is no significant difference in item worth between “I” and “L”.
These results are mirrored in Table 6, which shows the median PLM’s estimate of the probability of a reverb option being ranked highest when averaged across trials. “C” remains distinctly the highest-rated in “Marble”, whereas “Fabric” and “Blocks” essentially share ties between the two best-ranked options (“F” and “G”; “I” and “L”).
4.2.3. Correlation between RT60 and Ratings
The correlation between a reverb’s probability of being rated best and its associated RT60 was calculated. Visual inspection of a scattergraph revealed a nonlinear relationship between the two variables and an association between a lower RT60 and a higher rating in most cases (Figure 4). “Blocks” in all trials and “Fabric” in trial 3 form exceptions to this observation. Due to the nonlinearity and non-monotonic behaviour of the two variables, distance correlation was used to calculate the correlation between the two variables, as proposed by Szekely et al. [68]. A zero value would imply that both variables are independent. The calculation, using the R-package energy [69] and based on the conditions’ mean probabilities, revealed a highly correlated relationship between the two variables for “Marble” (R = 0.89) and “Fabric” (R = 0.92), and a good correlation for “Blocks” (R = 0.71).
4.2.4. Effect of Other Covariates on Ratings
To better understand the study’s potential effect on the inner reference of the participants, their ratings were grouped according to their first experienced test condition (“first”). Eight participants encountered the condition “Fabric” as their first trial in the test, six experienced “Blocks” first and five experienced “Marble” first. These groups are compared to a “control” group who initially experienced another condition. For “Fabric”, this resulted in 11 participants and 13 in “Blocks”. The subdivision for “Marble” was ignored as their ratings were less subject to change. PLMs were calculated separately per condition and grouping. Additionally, Mann–Whitney U tests using an exact sampling distribution for U were run in IBM SPSS to check for significant differences between the distribution of the ratings of these two groups [70,71] (see Table 7). The distribution of the rating of “F” differed significantly only in the first trial and not in its subsequent trials, p = 0.041 compared to p = 0.545 and p = 0.659. The PLM estimates for “I” suggested a similar effect, but a Mann–Whitney U test did not support this impression, p = 0.152 compared to p = 1 and p = 1.
As “Blocks” were the only condition in which a sufficient number of participants misidentified the surface material at least once (N = 8), Mann–Whitney U tests were performed for the condition’s first trial to analyse whether this misidentification led to different distributions of the ratings between the two groups (identification correct vs incorrect). However, no significant differences were found in the distributions of the rating scores for each “I” and “L”, U = 54.5, p = 0.395, z = 0.919 and U = 34.5, p = 0.442, z = −0.822 (Table 8). Therefore, based on the available data in this paper, a visual surface identification test may not be necessary.
5. Discussion
The results of the PLM and the correlation between RT60 and rating probability show that the paper’s main hypothesis (H0), i.e., participants preferring congruent spaces over sound-designed spaces, needs to be considered based on the condition of speech intelligibility when using speech-based test signals.
The H0 can be rejected in spaces with low D50s or excessive ringing, as seen in “Marble” and “Fabric”. Their sound-designed options were rated significantly higher than those resulting from a one-to-one mapping from visual to acoustic materials. The highest-rated options featured the highest D50 and shortest RT60 options, the latter corresponding to a duration between 38% and 39% of the one-to-one mapping’s mean RT60. This finding is consistent with Kolarik et al., who suggest listeners may overestimate room sizes in reverberant rooms [72]. Therefore, RT60s should be shortened in very reverberant or spectrally imbalanced spaces.
However, the H0 cannot be rejected when a room’s D50 is already high enough to indicate sufficient speech intelligibility, as shown in the ratings in “Blocks”. The comparatively low ratings of the sound-designed options highlight an upper and lower limit of acceptable RT60s in this case.
This upper and lower limit suggests two conclusions. Firstly, if the original mapping does not impair speech intelligibility, improving the room acoustics further could cause perceived room divergence or have a negligible effect. Thus, unprompted sound design may confuse the participants, which may be reflected in an overall low absolute agreement between the raters. Secondly, participants seem to expect reverberation times relative to visualised surface materials and room size, as the best-rated options in "Fabric" had a lower RT60 than the best-rated options in “Blocks”. This finding aligns with the participant behaviour described in Burnett et al. [7]. Therefore, RT60s should only be shortened where necessary.
Timbral differences in the reverb options may affect preference ratings less than suitability for speech-based signals. For example, “G” should have been rated higher than “F” consistently, as the visual materials used in the “Fabric” condition should have suggested a reverb having higher reverberance at low frequencies. Similarly, the room’s visualization in “Marble” should have suggested more pronounced reverberation at low-mid frequencies, yet “C” was preferred instead despite its reverberance at high frequencies.
The paper’s findings could affect a variety of production contexts. If good speech intelligibility is required in a game space, sound designers should optimize a room’s D50 in worst-case scenarios instead of ensuring overly strong congruence to a room’s visual appearance. In less-worst-case scenarios, the upper and lower bounds of expected RT60 must be considered, and sound designer intervention may not be necessary. Finally, as a factor associated with the use case of spaces, speech-intelligibility could also be considered in automated reverb estimation of complex visual scenes, such as the method shown in [73], to skew the results towards “stylisation” to account for listener preferences or improve accessibility for the hard of hearing [74].
5.1. Limitations
The study’s findings are subject to limitations due to the study’s experiment design and low sample size when participants are separated into groups.
The participants’ ratings may have been biased towards speech intelligibility due to the experiment design. Resonance Audio’s reverb may have obscured the speech stimuli due to its inherent background noise (see Section 3.4.2). However, the negative impact of Resonance Audio’s background noise may have been mitigated by the participant’s ability to move in 6-DoF, improving the ratio between the direct and reverberated speech signals. The tracking data show that most participants followed this encouragement in movement. However, more research is needed to support this observation. An additional, non-speech-based test signal could have provided a baseline to distinguish between the perception of room congruence and speech intelligibility. This alternative was dropped during the study’s development to reduce experiment duration in favour of a repeated measure design.
As the listener is placed into a stylized, game-like environment, the participant’s expectation may also be skewed towards unrealistic spatial audio-visual representation of space. They may assume “perfect” speech intelligibility over realism, as common in mediated experiences and known as “verbocentrism” in cinematic experiences [75]. Furthermore, the reverb’s quality may also not have been sufficient to excite realism, as only 42.1% (8) participants agreed with finding a suitable reverb option for the rooms presented. However, the study aimed to improve the understanding of the user’s expectation of reverbs in game-like spaces using readily available technologies, which led to this experiment design.
The impact of the order of experienced conditions and their repeated presentation may affect ratings, as suggested in [32]. This effect is shown in the significant differences in the rating of “F” compared to their control group and subsequent ratings. However, this effect was not observed in other conditions, nor did it affect the overall distribution of the ratings independently of the grouping. Due to the subdivision of participants into exclusive groups leading to low, uneven sample sizes per condition, the statistical power of this finding is limited. Furthermore, the Friedman tests calculated per reverb option showed that a repeated rating of the same stimuli may not be necessary, as the distribution of the ratings overall did not change significantly.
5.2. Future Work
Future studies could provide additional evidence towards the preference of speech intelligibility over room congruence in game spaces presented in VR with alternative experiment designs. The repeated measurement design could be replaced with more stimuli to be rated to increase the number of data points available, increasing the detail to support the findings. A larger range of test signals could be used to distinguish between the spatial needs of the test signals and overall spatial audio-visual congruency. Additionally, direct methods of audio quality evaluation could be used to rate the reverb options [30], which may feature less noise than the ranking-by-elimination procedure used in this paper (see Section 4.2.1). Several sound designers could “tune” the rooms, and their interventions could be compared to differentiate between personal approaches to spatial audio-visual mapping.
Author Contributions
Conceptualization, C.P.; Funding acquisition, D.T.M.; Investigation, C.P., D.T.M.; Project administration, D.T.M.; Resources, D.T.M.; Software, C.P.; Supervision, D.T.M.; Writing—original draft, C.P.; Writing—review & editing, C.P. and D.T.M. All authors have read and agreed to the published version of the manuscript.
Funding
This research was funded by XR Stories as part of the UK Research and Innovation Arts and Humanities Research Council Creative Industries Clusters Programme, grant number AH/S002839/1.
Institutional Review Board Statement
The study was conducted in accordance with the Declaration of Helsinki and approved by the Physical Sciences Ethics Committee of the University of York (Popp270422, 15 December 2022).
Informed Consent Statement
Informed consent was obtained from all subjects involved in the study. Participant data has been anonymised.
Data Availability Statement
The data presented in this study are openly available in: https://doi.org/10.5281/zenodo.10518139 (accessed on 17 January 2024).
Acknowledgments
We would like to thank Aglaia Foteinou for her support in calculating and analysing the room impulse responses. We would also like to thank the reviewers of this paper for their time and effort in improving it.
Conflicts of Interest
The authors declare no conflict of interest.
Appendix A

Table A1.
Questions asked in the pre-and post-questionnaire listed in presentation order. The column “Edited” refers to the question being altered to fit the study’s context.
Table A1.
Questions asked in the pre-and post-questionnaire listed in presentation order. The column “Edited” refers to the question being altered to fit the study’s context.
| Item | Question | Source | Edited |
|---|---|---|---|
| Pre_1 | Are you professionally or academically involved in audio or acoustics? | [34] | n |
| Pre_2 | How often do you experience spatial audio via loudspeakers in the cinema, at home or at work? | [34] | y |
| Pre_3 | How often do you play first-person shooter games in VR or non-VR? | ||
| Pre_4 | How often do you spend time in VR | ||
| Post_1 | In this study, I always found a matching reverb tail among the options offered. | ||
| Post_2 | Regarding choosing a matching reverb, I thought the system was easy to use. | [76] | y |
| Post_3 | While I was in the virtual environment, I had a sense of “being there”. | [77] | n |
Appendix B
Figure A1.
RT60s of “Marble” as reported by Resonance Audio. Percentages in the legend refer to the reverb’s mean probability estimate of being ranked best.
Figure A1.
RT60s of “Marble” as reported by Resonance Audio. Percentages in the legend refer to the reverb’s mean probability estimate of being ranked best.

Figure A2.
RT60s of “Fabric” as reported by Resonance Audio. Percentages in the legend refer to the reverb’s mean probability estimate of being ranked best.
Figure A2.
RT60s of “Fabric” as reported by Resonance Audio. Percentages in the legend refer to the reverb’s mean probability estimate of being ranked best.

Figure A3.
RT60s of “Blocks” as reported by Resonance Audio. Percentages in the legend refer to the reverb’s mean probability estimate of being ranked best.
Figure A3.
RT60s of “Blocks” as reported by Resonance Audio. Percentages in the legend refer to the reverb’s mean probability estimate of being ranked best.

Figure A4.
RT60 of reverb I of “Blocks” as reported by Resonance Audio (“Resonance”) compared to T20s derived from impulse response measurements using a 10s exponential sine sweep (“Sweep”), an anechoic recording of a starter pistol (“Pistol”) [78,79] and a Dirac impulse. The sweep-based T20 differs substantially below 4000 Hz from the RT60 reported by Resonance Audio, whereas the Dirac-based T20 is more similar, especially in the frequency bands from 250 to 4000 Hz. The mean RT60s averaged across 250 to 4000 Hz are 1.147833 s (“Sweep”), 0.860667 s (“Pistol”), 0.699500 s (“Dirac”) and 0.679867 s (“Resonance”).

Figure A5.
Top-down view of the participants’ movement patterns as a 2D histogram. “X” marks the position of the sound source. The histograms’ units of the x and y axis are in meters. The colours indicate the amount of time spent at a specific position. There is a general preference for the participants to remain near their default position. Participant 2 required a manual re-alignment of the virtual space with the play space, leading to a disjunct movement pattern.

References
- Gorzel, M.; Allen, A.; Kelly, I.; Kammerl, J.; Gungormusler, A.; Yeh, H.; Boland, F. Efficient Encoding and Decoding of Binaural Sound with Resonance Audio. In Proceedings of the Audio Engineering Society Conference: 2019 AES International Conference on Immersive and Interactive Audio, York, UK, 17 March 2019. [Google Scholar]
- Google LLC. Resonance Audio FMOD Plugin Reference. Available online: https://resonance-audio.github.io/resonance-audio/reference/fmod/class/fmod-resonance-audio-room.html (accessed on 7 March 2023).
- Brinkmann, F.; Aspöck, L.; Ackermann, D.; Lepa, S.; Vorländer, M.; Weinzierl, S. A round robin on room acoustical simulation and auralization. J. Acoust. Soc. Am. 2019, 145, 2746. [Google Scholar] [CrossRef] [PubMed]
- Weinel, J.; Cunningham, S. Designing game audio based on avatar-centered subjectivity. In Foundations in Sound Design for Interactive Media, 1st ed.; Routledge: New York, NY, USA, 2019; Volume 2, pp. 59–77. [Google Scholar]
- Totten, C.W. An Architectural Approach to Level Design, 2nd ed.; CRC Press: Boca Raton, FL, USA, 2019; ISBN 9780815361367. [Google Scholar]
- Brinkmann, F.; Weinzierl, S. Audio Quality Assessment for Virtual Reality. In Sonic Interactions in Virtual Environments; Geronazzo, M., Serafin, S., Eds.; Springer International Publishing: Cham, Switzerland, 2023; pp. 145–178. [Google Scholar]
- Burnett, B.; Neidhardt, A.; Cvetković, Z.; Hacıhabiboğlu, H.; De Sena, E. User Expectation of Room Acoustic Parameters in Virtual Reality Environments. In Proceedings of the 2023 Immersive and 3D Audio: From Architecture to Automotive (I3DA), Bologna, Italy, 5–7 September 2023. [Google Scholar]
- Gil-Carvajal, J.C.; Cubick, J.; Santurette, S.; Dau, T. Spatial Hearing with Incongruent Visual or Auditory Room Cues. Sci. Rep. 2016, 6, 37342. [Google Scholar] [PubMed]
- Gorzel, M.; Corrigan, D.; Squires, J.; Boland, F.; Kearney, G. Distance perception in real and virtual environments. In Proceedings of the Audio Engineering Society Conference: UK 25th Conference: Spatial Audio in Today’s 3D World, York, UK, 25–27 March 2012. [Google Scholar]
- Werner, S.; Klein, F.; Mayenfels, T.; Brandenburg, K. A summary on acoustic room divergence and its effect on externalization of auditory events. In Proceedings of the 2016 Eighth International Conference on Quality of Multimedia Experience (QoMEX), Lisbon, Portugal, 6–8 June 2016. [Google Scholar]
- Klein, F.; Amengual Gari, S.V.; Arend, J.M.; Robinson, P.W. Towards determining thresholds for room divergence: A pilot study on detection thresholds. In Proceedings of the 2021 Immersive and 3D Audio: From Architecture to Automotive (I3DA), Bologna, Italy, 8–10 September 2021. [Google Scholar]
- Li, S.; Schlieper, R.; Tobbala, A.; Peissig, J. The Influence of Binaural Room Impulse Responses on Externalization in Virtual Reality Scenarios. NATO Adv. Sci. Inst. Ser. E Appl. Sci. 2021, 11, 10198. [Google Scholar] [CrossRef]
- Kim, H.; Lee, I.K. Studying the Effects of Congruence of Auditory and Visual Stimuli on Virtual Reality Experiences. IEEE Trans. Vis. Comput. Graph. 2022, 28, 2080–2090. [Google Scholar] [CrossRef] [PubMed]
- Zhang, S.; Liu, Y.; Song, F.; Yu, D.; Bo, Z.; Zhang, Z. The Effect of Audiovisual Spatial Design on User Experience of Bare-Hand Interaction in VR. Int. J. -Hum. -Comput. Interact. 2023, 1–12. [Google Scholar] [CrossRef]
- Serafin, S. Audio in Multisensory Interactions: From Experiments to Experiences. In Sonic Interactions in Virtual Environments; Geronazzo, M., Serafin, S., Eds.; Springer International Publishing: Cham, Switzerland, 2023; pp. 305–318. [Google Scholar]
- Rummukainen, O.; Robotham, T.; Schlecht, S.J.; Plinge, A.; Herre, J.; Habels, E.A.P. Audio quality evaluation in virtual reality: Multiple stimulus ranking with behavior tracking. In Proceedings of the Audio Engineering Society Conference: 2018 AES International Conference on Audio for Virtual and Augmented Reality, Audio Engineering Society, Redmond, WA, USA, 20–22 August 2018. [Google Scholar]
- Plackett, R.L. The Analysis of Permutations. J. R. Stat. Soc. Ser. C Appl. Stat. 1975, 24, 193–202. [Google Scholar] [CrossRef]
- Rummukainen, O.; Wang, J.; Li, Z.; Robotham, T.; Yan, Z.; Li, Z.; Xie, X.; Nagel, F.; Habets, E.A.P. Influence of Visual Content on the Perceived Audio Quality in Virtual Reality. In Proceedings of the Audio Engineering Society Convention 145, New York, NY, USA, 17–19 October 2018. [Google Scholar]
- Alais, D.; Burr, D. The ventriloquist effect results from near-optimal bimodal integration. Curr. Biol. 2004, 14, 257–262. [Google Scholar] [CrossRef]
- Hendrickx, E.; Paquier, M.; Koehl, V.; Palacino, J. Ventriloquism effect with sound stimuli varying in both azimuth and elevation. J. Acoust. Soc. Am. 2015, 138, 3686–3697. [Google Scholar] [CrossRef]
- Hládek, Ľ.; Seitz, A.R.; Kopčo, N. Auditory-visual interactions in egocentric distance perception: Ventriloquism effect and aftereffect. J. Acoust. Soc. Am. 2021, 150, 3593. [Google Scholar] [CrossRef]
- Huisman, T.; Dau, T.; Piechowiak, T.; MacDonald, E. The Ventriloquist Effect is not Consistently Affected by Stimulus Realism. J. Percept. Imaging 2022, 5, 1–10. [Google Scholar] [CrossRef]
- Etchemendy, P.E.; Abregú, E.; Calcagno, E.R.; Eguia, M.C.; Vechiatti, N.; Iasi, F.; Vergara, R.O. Auditory environmental context affects visual distance perception. Sci. Rep. 2017, 7, 7189. [Google Scholar] [PubMed]
- Postma, B.N.J.; Katz, B.F.G. The influence of visual distance on the room-acoustic experience of auralizations. J. Acoust. Soc. Am. 2017, 142, 3035. [Google Scholar] [CrossRef] [PubMed]
- Zahorik, P. Asymmetric visual capture of virtual sound sources in the distance dimension. Front. Neurosci. 2022, 16, 958577. [Google Scholar] [CrossRef]
- Valzolgher, C.; Alzhaler, M.; Gessa, E.; Todeschini, M.; Nieto, P.; Verdelet, G.; Salemme, R.; Gaveau, V.; Marx, M.; Truy, E.; et al. The impact of a visual spatial frame on real sound-source localization in virtual reality. Curr. Res. Behav. Sci. 2020, 1, 100003. [Google Scholar]
- Lin, W.Y.; Wang, Y.C.; Wu, D.R.; Venkatakrishnan, R.; Venkatakrishnan, R.; Ebrahimi, E.; Pagano, C.; Babu, S.V.; Lin, W.C. Empirical Evaluation of Calibration and Long-term Carryover Effects of Reverberation on Egocentric Auditory Depth Perception in VR. In Proceedings of the 2022 IEEE Conference on Virtual Reality and 3D User Interfaces (VR), Christchurch, New Zealand, 12–16 March 2022; pp. 232–240. [Google Scholar]
- Schutte, M.; Ewert, S.D.; Wiegrebe, L. The percept of reverberation is not affected by visual room impression in virtual environments. J. Acoust. Soc. Am. 2019, 145, EL229. [Google Scholar] [PubMed]
- Diaconescu, A.O.; Alain, C.; McIntosh, A.R. The co-occurrence of multisensory facilitation and cross-modal conflict in the human brain. J. Neurophysiol. 2011, 106, 2896–2909. [Google Scholar] [CrossRef] [PubMed]
- Robotham, T.; Rummukainen, O.S.; Kurz, M.; Eckert, M.; Habets, E.A.P. Comparing Direct and Indirect Methods of Audio Quality Evaluation in Virtual Reality Scenes of Varying Complexity. IEEE Trans. Vis. Comput. Graph. 2022, 28, 2091–2101. [Google Scholar]
- Lindau, A.; Weinzierl, S. Assessing the Plausibility of Virtual Acoustic Environments. Acta Acust. United Acust. 2012, 98, 804–810. [Google Scholar] [CrossRef]
- Kuhn-Rahloff, C. Prozesse der Plausibilitätsbeurteilung am Beispiel ausgewählter elektroakustischer Wiedergabesituationen. Ein Beitrag zum Verständnis der “inneren Referenz” perzeptiver Messungen. Ph.D. Thesis, Technische Universität Berlin, Berlin, Germany, 2011. [Google Scholar]
- Neidhardt, A.; Schneiderwind, C.; Klein, F. Perceptual Matching of Room Acoustics for Auditory Augmented Reality in Small Rooms-Literature Review and Theoretical Framework. Trends Hear 2022, 26, 23312165221092919. [Google Scholar]
- Fela, R.F.; Zacharov, N.; Forchhammer, S. Assessor selection process for perceptual quality evaluation of 360 audiovisual content. J. Audio Eng. Soc. 2022, 70, 824–842. [Google Scholar]
- ITU-T. Subjective Test Methodologies for 360º Video on Head-Mounted Displays; Technical Report Recommendation ITU-T P.919; International Telecommunication Union: Geneva, Switzerland, 2020. [Google Scholar]
- Wickelmaier, F.; Umbach, N.; Sering, K.; Choisel, S. Comparing Three Methods for Sound Quality Evaluation with Respect to Speed and Accuracy. In Proceedings of the Audio Engineering Society Convention 126, Munich, Germany, 7–10 May 2009. [Google Scholar]
- Fogerty, D.; Alghamdi, A.; Chan, W.Y. The effect of simulated room acoustic parameters on the intelligibility and perceived reverberation of monosyllabic words and sentences. J. Acoust. Soc. Am. 2020, 147, EL396. [Google Scholar] [CrossRef]
- Gelfand, S.A.; Hochberg, I. Binaural and monaural speech discrimination under reverberation. Audiology 1976, 15, 72–84. [Google Scholar] [CrossRef]
- Cox, T.J.; D’Antonio, P.; Avis, M.R. Room sizing and optimization at low frequencies. J. Audio Eng. Soc. 2004, 52, 640–651. [Google Scholar]
- Genzel, D.; Schutte, M.; Brimijoin, W.O.; MacNeilage, P.R.; Wiegrebe, L. Psychophysical evidence for auditory motion parallax. Proc. Natl. Acad. Sci. USA 2018, 115, 4264–4269. [Google Scholar] [CrossRef] [PubMed]
- Nilsson, N.C.; Serafin, S.; Steinicke, F.; Nordahl, R. Natural Walking in Virtual Reality: A Review. Comput. Entertain. 2018, 16, 1–22. [Google Scholar] [CrossRef]
- Moghadam, K.; Banigan, C.; Ragan, E.D. Scene Transitions and Teleportation in Virtual Reality and the Implications for Spatial Awareness and Sickness. IEEE Trans. Vis. Comput. Graph. 2020, 26, 2273–2287. [Google Scholar] [CrossRef] [PubMed]
- Buttussi, F.; Chittaro, L. Locomotion in Place in Virtual Reality: A Comparative Evaluation of Joystick, Teleport, and Leaning. IEEE Trans. Vis. Comput. Graph. 2021, 27, 125–136. [Google Scholar] [PubMed]
- Meta. Device Specifications. Available online: https://developer.oculus.com/resources/oculus-device-specs/ (accessed on 22 March 2022).
- Unity Software Inc. Unity Real-Time Development Platform, Version 2021.3.14f; Unity Software Inc.: San Francisco, CA, USA, 2022. [Google Scholar]
- Unity Software Inc. XR Interaction Toolkit, Version 2.2.0; Unity Software Inc.: San Francisco, CA, USA, 2022. [Google Scholar]
- Firelight Technologies Pty Ltd. FMOD, Version 2.02.09; Firelight Technologies Pty Ltd: Melbourne, Australia, 2022. [Google Scholar]
- Pasanen, J. AutoEq: Automatic Headphone Equalization from Frequency Responses, Version 2.2.0; Github: San Francisco, CA, USA, 2022; Available online: https://github.com/jaakkopasanen/AutoEq (accessed on 28 November 2022).
- Unity Technologies. Unity Asset Store—The Best Assets for Game Making. Available online: https://assetstore.unity.com/ (accessed on 7 March 2023).
- 3DTextures.Me. Fabric Padded 005. Available online: https://3dtextures.me/2021/03/05/fabric-padded-005/ (accessed on 21 February 2023).
- TextureCan. Herringbone Parquet Wooden Floor Texture. Available online: https://www.texturecan.com/details/142/ (accessed on 21 February 2023).
- Gley. All Platforms Save, Version 1.1.6; Unity Asset Store: San Francisco, Ca, USA, 2022; Available online: https://assetstore.unity.com/packages/tools/integration/all-platforms-save-115960 (accessed on 9 March 2023).
- Selfridge, R.; Cook, J.; McAlpine, K.; Newton, M. Creating Historic Spaces in Virtual Reality Using Off-the-Shelf Audio Plugins. In Proceedings of the 2019 AES International Conference on Immersive and Interactive Audio, York, UK, 27–29 March 2019. [Google Scholar]
- Rothauser, E.H. IEEE Recommended Practice for Speech Quality Measurements. IEEE Trans. Audio Electroacoust. 1969, 17, 225–246. [Google Scholar]
- Google LLC. Developer Guide for Resonance Audio for Unity. Available online: https://resonance-audio.github.io/resonance-audio/develop/unity/developer-guide (accessed on 7 December 2021).
- Google LLC. room_effects_utils.cc at master · resonance-audio/resonance-audio. Available online: https://github.com/resonance-audio/resonance-audio/blob/master/platforms/common/room_effects_utils.cc (accessed on 27 February 2023).
- Kuttruff, H. Room Acoustics; CRC Press: Boca Raton, FL, USA, 2016. [Google Scholar]
- ISO 3382-1:2009; Acoustics—Measurement of Room Acoustic Parameters. Part 1: Performance Spaces. International Standards Organization: Geneva, Switzerland, 2022.
- Campanini, S.; Farina, A. A new Audacity feature: Room objective acoustical parameters calculation module. In Proceedings of the Linux Audio Conference 2009, Parma, Italy, 16–19 April 2009. [Google Scholar]
- Cockos Incorporated. REAPER, Version 6.79; Cockos Inc.: San Francisco, CA, USA, 2023. [Google Scholar]
- Remaggi, L.; Kim, H.; Jackson, P.J.B.; Hilton, A. Reproducing Real World Acoustics in Virtual Reality Using Spherical Cameras. In Proceedings of the 2019 AES International Conference on Immersive and Interactive Audio, York, UK, 27–29 March 2019. [Google Scholar]
- Arm Limited. Advanced VR Graphics Techniques. Available online: https://developer.arm.com/documentation/102073/latest/ (accessed on 19 January 2022).
- Finch, H. An introduction to the analysis of ranked response data. Pract. Assessment Res. Eval. 2022, 27, 20. [Google Scholar]
- Lee, P.H.; Yu, P.L.H. pmr: Probability Models for Ranking Data. Available online: https://CRAN.R-project.org/package=pmr (accessed on 25 September 2023).
- Koo, T.K.; Li, M.Y. A Guideline of Selecting and Reporting Intraclass Correlation Coefficients for Reliability Research. J. Chiropr. Med. 2016, 15, 155–163. [Google Scholar] [CrossRef]
- William Revelle. psych: Procedures for Psychological, Psychometric, and Personality Research. Available online: https://CRAN.R-project.org/package=psych (accessed on 25 September 2023).
- Turner, H.L.; van Etten, J.; Firth, D.; Kosmidis, I. Modelling Rankings in R: The PlackettLuce Package. Comput. Stat. 2020, 35, 1027–1057. [Google Scholar] [CrossRef]
- Székely, G.J.; Rizzo, M.L.; Bakirov, N.K. Measuring and testing dependence by correlation of distances. AOS 2007, 35, 2769–2794. [Google Scholar]
- Rizzo, M.; Szekely, G. energy: E-Statistics: Multivariate Inference via the Energy of Data. Available online: https://CRAN.R-project.org/package=energy (accessed on 25 September 2023).
- Dinneen, L.C.; Blakesley, B.C. A Generator for the Sampling Distribution of the Mann-Whitney U Statistic. J. R. Stat. Soc. Ser. C Appl. Stat. 2018, 22, 269–273. [Google Scholar]
- IBM Corp. IBM SPSS Statistics for Windows, Version 28.0; IBM Corp.: Armonk, NY, USA, 2021. [Google Scholar]
- Kolarik, A.J.; Moore, B.C.J.; Cirstea, S.; Aggius-Vella, E.; Gori, M.; Campus, C.; Pardhan, S. Factors Affecting Auditory Estimates of Virtual Room Size: Effects of Stimulus, Level, and Reverberation. Perception 2021, 50, 646–663. [Google Scholar] [CrossRef] [PubMed]
- Colombo, M. Vision-based Acoustic Information Retrieval for Interactive Sound Rendering. In Proceedings of the 2021 IEEE International Symposium on Mixed and Augmented Reality Adjunct (ISMAR-Adjunct), Bari, Italy, 4–8 October 2021. [Google Scholar]
- McClenaghan, I.; Pardoe, L.; Ward, L. The next generation of audio accessibility. In Proceedings of the Audio Engineering Society Convention 152, The Hague, The Netherlands, 7–8 May 2022. [Google Scholar]
- Chion, M. The Voice in Cinema; Columbia University Press: New York, NY, USA, 1999. [Google Scholar]
- Brooke, J. SUS: A quick and dirty usability scale. In Usability Evaluation in Industry; Jordan, P., Thomas, B., McClelland, I., Weerdmeester, B., Eds.; CRC Press: London, UK, 1996; pp. 189–194. [Google Scholar] [CrossRef]
- Makransky, G.; Lilleholt, L.; Aaby, A. Development and validation of the Multimodal Presence Scale for virtual reality environments: A confirmatory factor analysis and item response theory approach. Comput. Human Behav. 2017, 72, 276–285. [Google Scholar] [CrossRef]
- Stevens, F.; Murphy, D. Spatial Impulse Response Measurement in an Urban Environment. In Proceedings of the Audio Engineering Society Conference: 55th International Conference: Spatial Audio, Helsinki, Finland, 27–29 August 2014. [Google Scholar]
- Murphy, D.T. OpenAIR—The Open Acoustic Impulse Response Library. Available online: https://www.openair.hosted.york.ac.uk/ (accessed on 12 May 2023).
Figure 1.
Schematic overview of the experimental procedure, detailing the tasks and tests of each of the study’s sections.
Figure 1.
Schematic overview of the experimental procedure, detailing the tasks and tests of each of the study’s sections.

Figure 2.
Screenshots of the experiment. (a) One of the outdoor environments with floating UI and reference objects. (b) The indoor environment of the congruency test, including the reference objects, floating UI, and trial information.
Figure 2.
Screenshots of the experiment. (a) One of the outdoor environments with floating UI and reference objects. (b) The indoor environment of the congruency test, including the reference objects, floating UI, and trial information.

Figure 3.
PLM parameter estimates in logarithmic worth for the reverb options across trials per material type. Higher worth values will result in participants giving a higher rank to the options.
Figure 3.
PLM parameter estimates in logarithmic worth for the reverb options across trials per material type. Higher worth values will result in participants giving a higher rank to the options.

Figure 4.
RT60 (in seconds) by the probability of an option being rated best. The points and their shape correspond to the probabilities of each trial (square = 1st trial, dot = 2nd trial, triangle = 3rd trial). The thick line indicates the median probability across trials. Colour corresponds to the surface material type.

Table 1.
Overview of the surface mapping of the reverberation options, labelled A to L, per test material, i.e., “Marble”, “Fabric”, and “Blocks”, using the text labels provided by Resonance Audio.
Table 1.
Overview of the surface mapping of the reverberation options, labelled A to L, per test material, i.e., “Marble”, “Fabric”, and “Blocks”, using the text labels provided by Resonance Audio.
| Marble | Reverbs | |||
|---|---|---|---|---|
| Surface | A | B | C | D |
| left | glass thin | glass thick | glass thick | glass thick |
| right | marble | marble | marble | marble |
| floor | parquet on concrete | parquet on concrete | wood panel | wood panel |
| ceiling | marble | brick bare | wood panel | marble |
| back | marble | marble | marble | marble |
| front | marble | marble | marble | marble |
| Fabric | Reverbs | |||
| Surface | E | F | G | H |
| left | glass thin | glass thick | glass thin | glass thick |
| right | curtain heavy | transparent | fiberglass insulation | concrete blocks coarse |
| floor | parquet on concrete | wood panel | parquet on concrete | wood panel |
| ceiling | curtain heavy | concrete block coarse | acoustic ceiling tiles | concrete blocks coarse |
| back | curtain heavy | transparent | fiberglass insulation | concrete blocks coarse |
| front | curtain heavy | transparent | fiberglass insulation | acoustic ceiling tiles |
| Blocks | Reverbs | |||
| Surface | I | J | K | L |
| left | glass thin | glass thick | glass thick | glass thin |
| right | concrete block coarse | concrete block coarse | concrete block coarse | concrete block coarse |
| floor | parquet on concrete | wood panel | acoustic ceiling tiles | wood panel |
| ceiling | concrete block coarse | concrete block painted | concrete block coarse | concrete block coarse |
| back | concrete block coarse | concrete block painted | concrete block coarse | concrete block coarse |
| front | concrete block coarse | concrete block painted | concrete block coarse | acoustic ceiling tiles |
Table 2.
Overview of the reverbs’ relevant room acoustic parameters per test material.
| Marble | A | B | C | D |
|---|---|---|---|---|
| RT60 mean (s)/(SD) | 3.86 (0.69) | 2.65 (0.61) | 1.49 (0.71) | 2.16 (0.92) |
| RT60 relative to one-to-one mapping (%) | 69 | 39 | 56 | |
| Ratio (low:mid:high) | 1.00:1:0.93 | 0.81:1:1.00 | 0.43:1:0.98 | 0.48:1:1.01 |
| D50 mean (%)/(SD) | 29 (1.77) | 36 (1.34) | 44 (2.09) | 39 (0.68) |
| Fabric | E | F | G | H |
| RT60 mean (s)/(SD) | 0.62 (0.56) | 0.24 (0.03) | 0.24 (0.14) | 0.45 (0.11) |
| RT60 relative to one-to-one mapping (%) | 38 | 39 | 73 | |
| Ratio (low:mid:high) | 2.54:1:0.48 | 0.78:1:1.07 | 1.92:1:0.72 | 0.69:1:1.20 |
| D50 mean (%)/(SD) | 62 (3.34) | 66 (0.91) | 68 (2.26) | 58 (0.94) |
| Blocks | I | J | K | L |
| RT60 mean (s)/(SD) | 0.63 (0.15) | 1.00 (0.32) | 0.3 (0.05) | 0.48 (0.11) |
| RT60 relative to one-to-one mapping (%) | 157 | 47 | 75 | |
| Ratio (low:mid:high) | 0.75:1:1.15 | 0.61:1:1.08 | 0.88:1:1.15 | 0.72:1:1.16 |
| D50 mean (%)/(SD) | 55 (1.76) | 50 (0.35) | 66 (0.77) | 57 (2.01) |
Table 3.
Chi-square statistic and the p-value of the goodness-of-fit test between observed ratings and assumed random ratings per material and trial repetition. The test statistics were calculated using the PMR R-package [64].
Table 3.
Chi-square statistic and the p-value of the goodness-of-fit test between observed ratings and assumed random ratings per material and trial repetition. The test statistics were calculated using the PMR R-package [64].
| Marble | Fabric | Blocks | |||||||
|---|---|---|---|---|---|---|---|---|---|
| Trial | 1 | 2 | 3 | 1 | 2 | 3 | 1 | 2 | 3 |
| 39.82 | 41.97 | 38.44 | 16.45 | 32.49 | 9.27 | 12.28 | 28.07 | 12.47 | |
| p | <0.001 | <0.001 | <0.001 | <0.001 | <0.001 | 0.012 | 0.003 | <0.001 | 0.003 |
Table 4.
Number of different ratings (#) for the same reverb across trials.
| Marble | Fabric | Blocks | ||||||||||
|---|---|---|---|---|---|---|---|---|---|---|---|---|
| # | A (%) | B (%) | C (%) | D (%) | E (%) | F (%) | G (%) | H (%) | I (%) | J (%) | K (%) | L (%) |
| 1 | 82.4 | 35.3 | 58.8 | 29.4 | 27.8 | 0.0 | 16.7 | 11.1 | 11.1 | 27.8 | 0.0 | 11.1 |
| 2 | 17.6 | 47.1 | 41.2 | 70.6 | 38.9 | 61.1 | 77.8 | 72.2 | 66.7 | 55.6 | 72.2 | 27.8 |
| 3 | 0.0 | 17.6 | 0.0 | 0.0 | 33.3 | 38.9 | 5.6 | 16.7 | 22.2 | 16.7 | 27.8 | 61.1 |
Table 5.
Results of calculating the ICC using the psych R-package using a two-way mixed effects model, single-rater unit and absolute agreement [66]. The ICC is calculated across the four reverb options and 3 trial repetitions per material condition.
Table 5.
Results of calculating the ICC using the psych R-package using a two-way mixed effects model, single-rater unit and absolute agreement [66]. The ICC is calculated across the four reverb options and 3 trial repetitions per material condition.
| 95% Confidence Interval | F Test with True Value 0 | |||||||
|---|---|---|---|---|---|---|---|---|
| Material | Type | ICC | Lower Bound | Upper Bound | F | df1 | df2 | p |
| Marble | ICC2 | 0.73 | 0.56 | 0.89 | 53 | 11 | 198 | 0.000 |
| Fabric | ICC2 | 0.33 | 0.17 | 0.6 | 10 | 11 | 198 | 0.000 |
| Blocks | ICC2 | 0.29 | 0.15 | 0.57 | 8.9 | 11 | 198 | 0.000 |
Table 6.
Median probability of a reverb ranked highest as estimated by the PLM per trial and averaged across trials.
Table 6.
Median probability of a reverb ranked highest as estimated by the PLM per trial and averaged across trials.
| Marble | Fabric | Blocks | ||||||||||
|---|---|---|---|---|---|---|---|---|---|---|---|---|
| A | B | C | D | E | F | G | H | I | J | K | L | |
| Median (%) | 0.4 | 7.7 | 67.8 | 20.1 | 9.0 | 42.0 | 41.7 | 16.3 | 37.1 | 8.5 | 16.0 | 36.6 |
Table 7.
Difference in rating between participants’ first impression of a particular material condition compared to later trials. Only the reverb options “F” and “I” are shown here for brevity, as these options showed the highest rating in the “first” group.
Table 7.
Difference in rating between participants’ first impression of a particular material condition compared to later trials. Only the reverb options “F” and “I” are shown here for brevity, as these options showed the highest rating in the “first” group.
| Fabric | Blocks | |||||
|---|---|---|---|---|---|---|
| F 1 | F 2 | F 3 | I 1 | I 2 | I 3 | |
| N (control) | 11 | 11 | 11 | 13 | 13 | 12 |
| N (first) | 8 | 8 | 7 | 6 | 6 | 6 |
| PLM top rank (control) | 28.6% | 52.7% | 27.5% | 31.9% | 30.6% | 30.6% |
| PLM top rank (first) | 77.1% | 41.5% | 25.6% | 62.2% | 33.2% | 42.4% |
| Mean rank (control) | 12.27 | 9.32 | 9.05 | 11.31 | 10 | 9.5 |
| Mean rank (first) | 6.88 | 10.94 | 10.21 | 7.17 | 10 | 9.5 |
| U | 19 | 51.5 | 43.5 | 22 | 39 | 36 |
| p (exact) | 0.041 | 0.545 | 0.659 | 0.152 | 1 | 1 |
| z | −2.223 | 0.684 | 0.473 | −1.581 | 0 | 0 |
Table 8.
Difference in ranking distribution between incorrect and correct surface material identification, calculated with SPSS using an exact sampling distribution for U [70,71].
| Blocks | ||||
|---|---|---|---|---|
| I 1 | J 1 | K 1 | L 1 | |
| Mean rank (incorrect) | 8.69 | 9.06 | 9.81 | 11.19 |
| Mean rank (correct) | 10.95 | 10.68 | 10.14 | 9.14 |
| U | 54.5 | 51.5 | 45.5 | 34.5 |
| p (exact) | 0.395 | 0.545 | 0.904 | 0.442 |
| z | 0.919 | 0.682 | 0.129 | −0.822 |
Disclaimer/Publisher’s Note: The statements, opinions and data contained in all publications are solely those of the individual author(s) and contributor(s) and not of MDPI and/or the editor(s). MDPI and/or the editor(s) disclaim responsibility for any injury to people or property resulting from any ideas, methods, instructions or products referred to in the content. |
© 2024 by the authors. Licensee MDPI, Basel, Switzerland. This article is an open access article distributed under the terms and conditions of the Creative Commons Attribution (CC BY) license (https://creativecommons.org/licenses/by/4.0/).
Share and Cite
MDPI and ACS Style
Popp, C.; Murphy, D.T. Speech Intelligibility versus Congruency: User Preferences of the Acoustics of Virtual Reality Game Spaces. Virtual Worlds 2024, 3, 40-61. https://doi.org/10.3390/virtualworlds3010003
AMA Style
Popp C, Murphy DT. Speech Intelligibility versus Congruency: User Preferences of the Acoustics of Virtual Reality Game Spaces. Virtual Worlds. 2024; 3(1):40-61. https://doi.org/10.3390/virtualworlds3010003
Chicago/Turabian StylePopp, Constantin, and Damian T. Murphy. 2024. "Speech Intelligibility versus Congruency: User Preferences of the Acoustics of Virtual Reality Game Spaces" Virtual Worlds 3, no. 1: 40-61. https://doi.org/10.3390/virtualworlds3010003