Abstract
This study presents a comprehensive bibliometric analysis conducted in R Studio of the scientific landscape regarding commodity markets, trading strategies, sustainable production, integration of technologies such as machine learning, and their economic impacts, covering publications from 1974 to 2023. Employing a sophisticated query in Scopus, we meticulously compiled and analyzed data, revealing an annual growth rate of 10.46% in related scientific publications, with an average citation rate of 6.60 per document. The results indicate sustained interest in commodity research over time, with a significant increase observed in scientific production, particularly since the early 2008s. International collaboration is prominent, reflecting the global nature of research in commodity markets. Key themes such as “futures markets”, “commodity prices”, and “energy commodities” emerge from the analysis of keywords and bigrams, highlighting areas of interest within the field. Additionally, thematic mapping highlights emerging and niche themes in commodity research, providing insight into evolving trends and areas of specialization. Factorial analysis of keywords reveals the underlying structures of association between key concepts, shedding light on the intricate dynamics of research in the field of commodities. This research delineates the complex interplay between commodity markets and global economic dynamics, offering invaluable insights for academics, policymakers, and market participants aiming to navigate the intricate world of commodities in the digital age.
1. Introduction
In a world marked by rapid economic changes and increasingly tight interconnectedness among global markets, the study of commodity markets is of vital importance. Our study focuses on a comprehensive bibliometric analysis of the scientific landscape concerning commodity markets, trading strategies, sustainable production, fintech integration, and their economic impacts. Over the years, commodity markets have become a subject of increased interest as price fluctuations and volatility have become significant aspects of the global economy.
Commodity markets, as asserted by the World Bank [1], represent a current topic of significance, yet despite its crucial importance, understanding the mechanisms and factors driving the evolution of this market has not been sufficiently researched. The evolution of these commodity markets can facilitate the construction of policy frameworks for a sustainable economy, as commodities are vital assets for contemporary society [2], encompassing all primary material goods used for energy, agriculture, production, and consumption [2,3]. Furthermore, the literature highlights that commodities also play a central role in the financial world [4] by using goods and trade assets as financial instruments, leading to the term “financialization of commodities” [5,6,7]. Given the unprecedented transformations of the commodity market in the current era, driven by both the dynamic economic landscape and emerging technologies, we are facing a reality where technological innovation, climate change, geopolitical instability, and global economic fluctuations have created a complex and unpredictable environment for trading and managing commodities [8,9,10,11]. All these changes underscore the importance of analyzing not only the commodity market itself but also how it interacts with other factors, both traditional and based on the needs of contemporary society. The commodity market must be viewed as a cybernetic, adaptive, and dynamic system to be analyzed and understood.
Therefore, the main purpose of our study was to conduct a comprehensive and updated analysis of the commodity market in the current era to better understand the dynamics and challenges of this market and to provide essential insights for adapting policies and economic strategies to the demands and opportunities of the present. Consequently, our research explores topics such as commodity futures, agricultural commodities, volatility effects, cointegration, speculation effects, the impact of COVID-19, and risk management strategies. To better outline the main purpose of this research, we established the following research questions (RQs).
RQ1: How have factors such as technological innovation, climate change, and geopolitical instability in recent years influenced the dynamics of the commodity market, especially regarding price volatility and risk management strategies?
RQ2: What are the specific effects of the COVID-19 pandemic on various sectors of the commodity market, such as energy, metals, and agricultural products, and how have these sectors responded to these challenges?
RQ3: To what extent have cointegration among various commodities and the effects of speculation influenced the behavior and evolution of the commodity market in recent years, and how can these phenomena provide insights for anticipating future trends?
RQ4: What are effective strategies and policies for risk management in the face of commodity market volatility in the current era, considering changes in the structure and relative importance of different commodities in the context of the global economy?
This research highlights the importance and complexity of the commodity market within the current context of economic, technological, and geopolitical changes. By examining the influence of technological innovation, climate change, and geopolitical instability on the dynamics of the commodity market, we identify how these factors may contribute to price volatility and the need to adapt risk management strategies in this market. Additionally, the specific effects of the COVID-19 pandemic on various sectors of the commodity market can reveal different vulnerabilities and the resilience of these sectors in the face of unforeseen and exceptional events. Analyzing the cointegration of various commodities and the effects of speculation can provide us with a deeper understanding of the behavior and evolution of the commodity market, offering important insights for anticipating future trends.
This paper is divided into the following sections. Section 2 presents the results obtained from the bibliometric analysis conducted using the R Studio software. Section 3 focuses on analyzing the research questions addressed in the introductory section and interpreting the results obtained in the context of the main purpose of our study, as defined in the research questions. Section 4 is dedicated to presenting the methodological flow regarding the steps involved in the bibliometric analysis, from data extraction and processing to graphical representation. The final part, Section 5, is dedicated to presenting the overall conclusions of the study, its limitations, and future research directions.
2. Materials and Methods
Bibliometric analysis is essential for managing the growth of empirical research, which can lead to fragmentation and controversy in research streams. Scientific mapping, the process of visualizing and analyzing scientific literature, is complex and challenging due to the need to use various software tools and its multifaceted nature [12]. Bibliometric analysis is an essential method that is increasingly used in various research fields, such as analyzing the relationship between financial contagion and shadow banking [13], agent-based modeling and AI [14], cybernetics [15], social media [16], tourism [17], forecasting emerging technology [18], etc.
In our study, we use the R Studio software solution, specifically the Bibliometrix R-package, to conduct the proposed analysis in accordance with the recommendations provided by Aria and Cuccurullo [12]. We recommend the open-source R Studio solution for its flexibility and integration with statistical packages. To access the Bibliometrix package in R Studio, you will need to install the Bibliometrix package (<<install.packages(“bibliometrix”>>)), access the specific library (<<library(bibliometrix>>), and then call the biblioshiny function (<<biblioshiny()>>). The methodological process we follow adheres to the guidelines proposed by Aria and Cuccurullo [12], and Zupic and Čater [19], which divide the process into 5 steps. The first step involves designing the study and defining the topic, followed by data collection and analysis. The next step in the bibliometric process is graphical representation of the data, followed by interpreting the generated outputs.
Regarding our study, the first step involved identifying the most relevant keywords through a thorough review of specialized articles, as well as addressing current issues, the impact of emerging technologies, and the modern needs of society. After establishing these keywords, the next step was selecting a source database. We used the Scopus database. Our decision to use the Scopus database instead of another database such as Web of Science was based on Visser’s study [20], which highlights the overlap of documents between Scopus and other databases. For example, Scopus has 27 million documents, while WoS has 23 million. Our bibliometric approach follows the same methodology found in other bibliometric research, such as analyzing the relationship between the shadow banking sector and financial contagion effects [13], discovering patterns in fuzzy logic and artificial intelligence [21], analyzing the quality of the educational system [22], and so forth. Table 1 outlines the steps we took in data extraction.

Table 1.
Steps for selecting data.
Thus, step 1 involves searching for articles with titles related to commodity markets and associated concepts, resulting in 2478 identified articles. The next step was to search for the same keywords within abstracts, yielding 9373 articles. The same query was performed for searching these concepts in keywords, resulting in 5113 articles. In step 4, queries from steps 1, 2, and 3 were combined to search for articles with relevant titles, abstracts, and keywords, resulting in 956 articles. Another criterion used for data filtering was limiting articles to those published in the English language, as this is the dominant language in the research field. Additionally, this filter helps ensure consistent analysis and greater robustness in the obtained results. The final step involved retaining articles published until the year 2023.
The choice of these keywords reflects the concerns and relevant areas addressed in research on commodity markets. Each keyword was carefully selected to cover different aspects of this vast and complex domain. The first keyword, “commodity markets”, serves as the main focal point indicating the overall focus of research on commodity markets. Reflecting an interest in commodity trading and related aspects, the keyword “commodity trading” was selected. Considering emerging trends and the emphasis on sustainable economies, “sustainable commodity production” is chosen to highlight sustainable production practices and environmental aspects. “Fintech commodities” was selected to investigate the intersection of financial technology and traded commodities. Furthermore, “commodity pricing” was chosen to cover articles focused on pricing mechanisms and influencing factors. “Energy commodities” and “agricultural commodities” were chosen to cover interests in energy and agricultural commodity markets, respectively. “Commodity futures” was chosen to address the topic of futures contracts related to commodities and their associated aspects. Given the close ties between commodity markets and economic developments, the keyword “impact of commodities on economy” was selected to explore the influence of commodity markets on global and local economies. Considering the need to analyze risk components in any economic system, “commodity risk management” was selected. Lastly, “financialization of commodity markets” was chosen to address concerns regarding the increased involvement of the financial sector in commodity markets and its implications. In the specialized literature, there are also several bibliometric studies conducted on the commodity market, but most of them are focused on a single perspective. For example, Mbarki et al. [4] conducted a bibliometric study to analyze commodities–financial markets intersections. Lin et al. [7] performed a scientometric analysis focusing on mapping the oil price against the stock market. Another interesting perspective is the analysis of contagion effects on the agricultural commodity market [23].
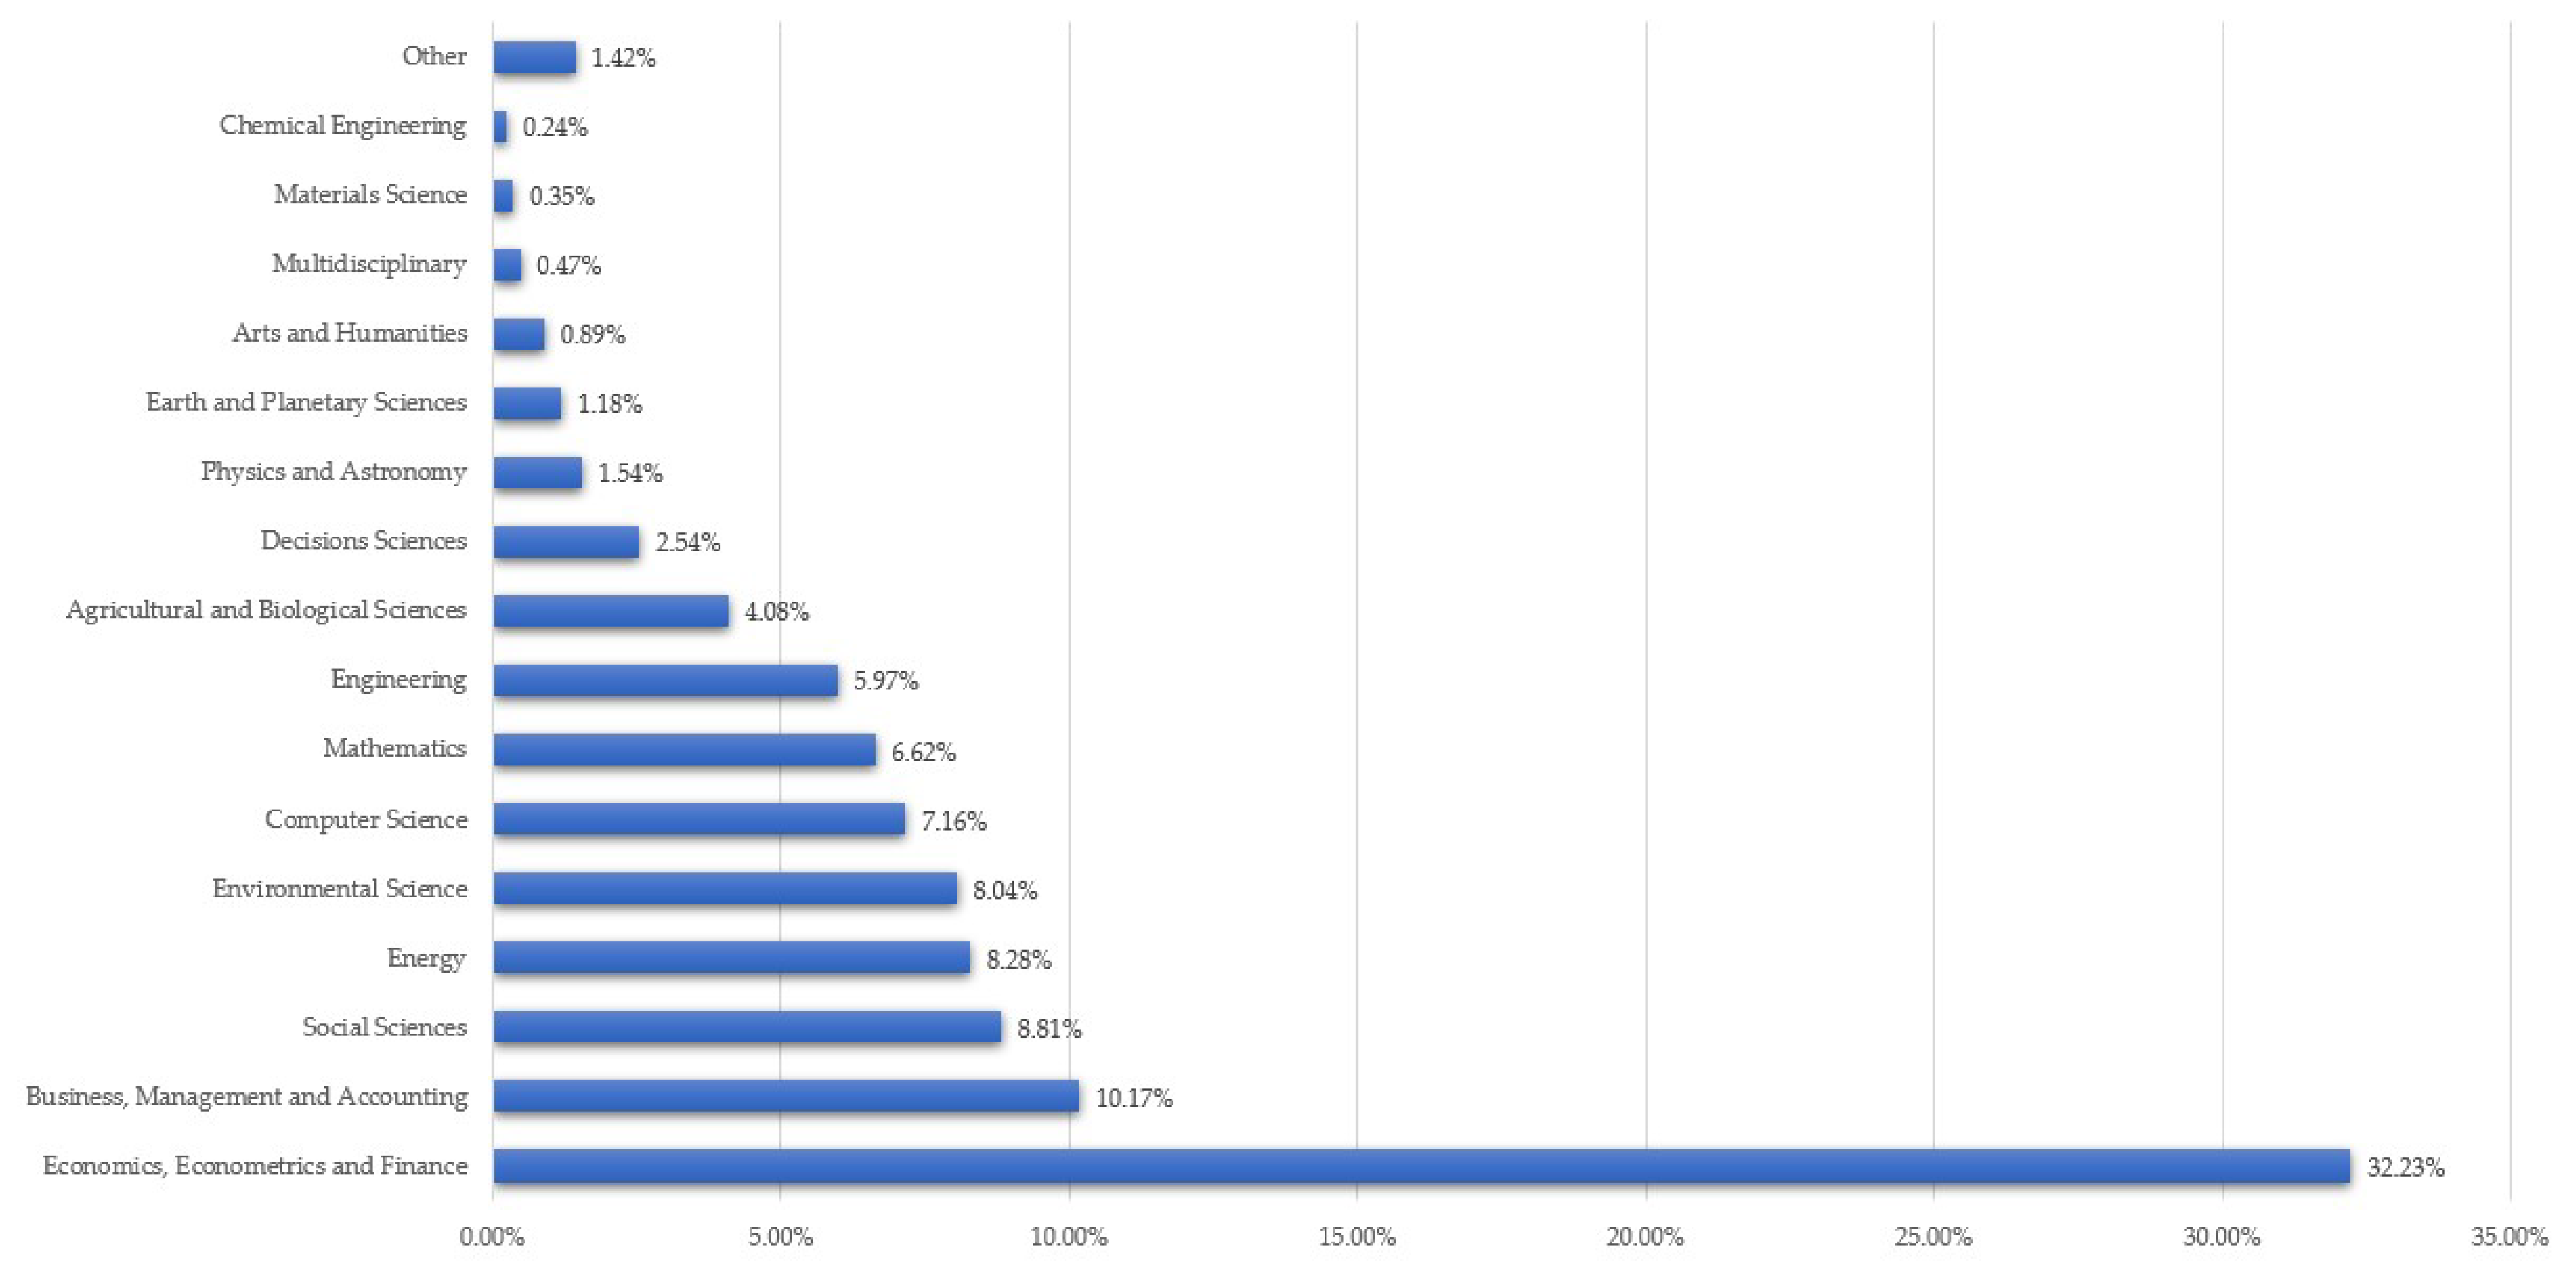
The resulting scientific documents are distributed across multiple domains according to the information extracted from Scopus. These can be seen in Figure 1.

Figure 1.
Distribution of publications by research field.
Figure 1 provides a comprehensive overview of the academic landscape, highlighting a variety of domains addressing the field of commodities.
Taking all these factors into account, our comprehensive bibliometric analysis can be considered a landmark for academics, policymakers, or industry specialists regarding the various trends in the commodity market intersecting with all these factors highlighted by the keywords used for database extraction.
3. Results
This section focuses on presenting the results and graphics obtained from the bibliometric analysis conducted as part of this study. This section is divided into several areas, each addressing different aspects of the analysis. Specifically, the areas covered include source analysis, author analysis, research analysis, and keyword analysis, as well as a mixed analysis encompassing the creation of co-occurrence networks, thematic maps, factorial analysis, collaboration networks, and countries collaboration world maps. Through these diverse analyses, we aim to provide a comprehensive understanding of the scholarly landscape with regard to our research topic. Each subsection will offer insights into the patterns, trends, and relationships observed within the analyzed literature.
Table 2 provides the main information regarding the obtained data. In the context of our study, these results offer a general overview of the scientific landscape concerning commodity markets. The analyzed duration, covering the period 1974–2023, indicates a sustained interest in this field over time. With an average annual growth rate of 10.46%, it is evident that research in this domain has experienced significant expansion over the years, reflecting an increased concern with the subject of commodity markets. The source of documents is diversified, with a total of 408 identified sources. This suggests that research in the field of commodity markets is approached from multiple perspectives, with a wide range of information sources available for study. The total number of identified documents is 897, with an average of 19.77 citations per document. This indicates that research in this field is well established and that published works have a significant impact in the academic community. Additionally, we observe an internationalization of collaborations, with 31.1% of documents having international co-authors. This suggests that research in the field of commodity markets is a global endeavor, with collaborations between researchers from different countries and regions. Thus, according to the results from Table 1, the importance and continued relevance of research in the field of commodity markets are underscored, suggesting that this domain is well developed and diversified, offering ample opportunities for exploring and understanding the dynamics and impact of these markets in the context of the global economy.
Table 2.
The main key metrics used in bibliometric analysis.
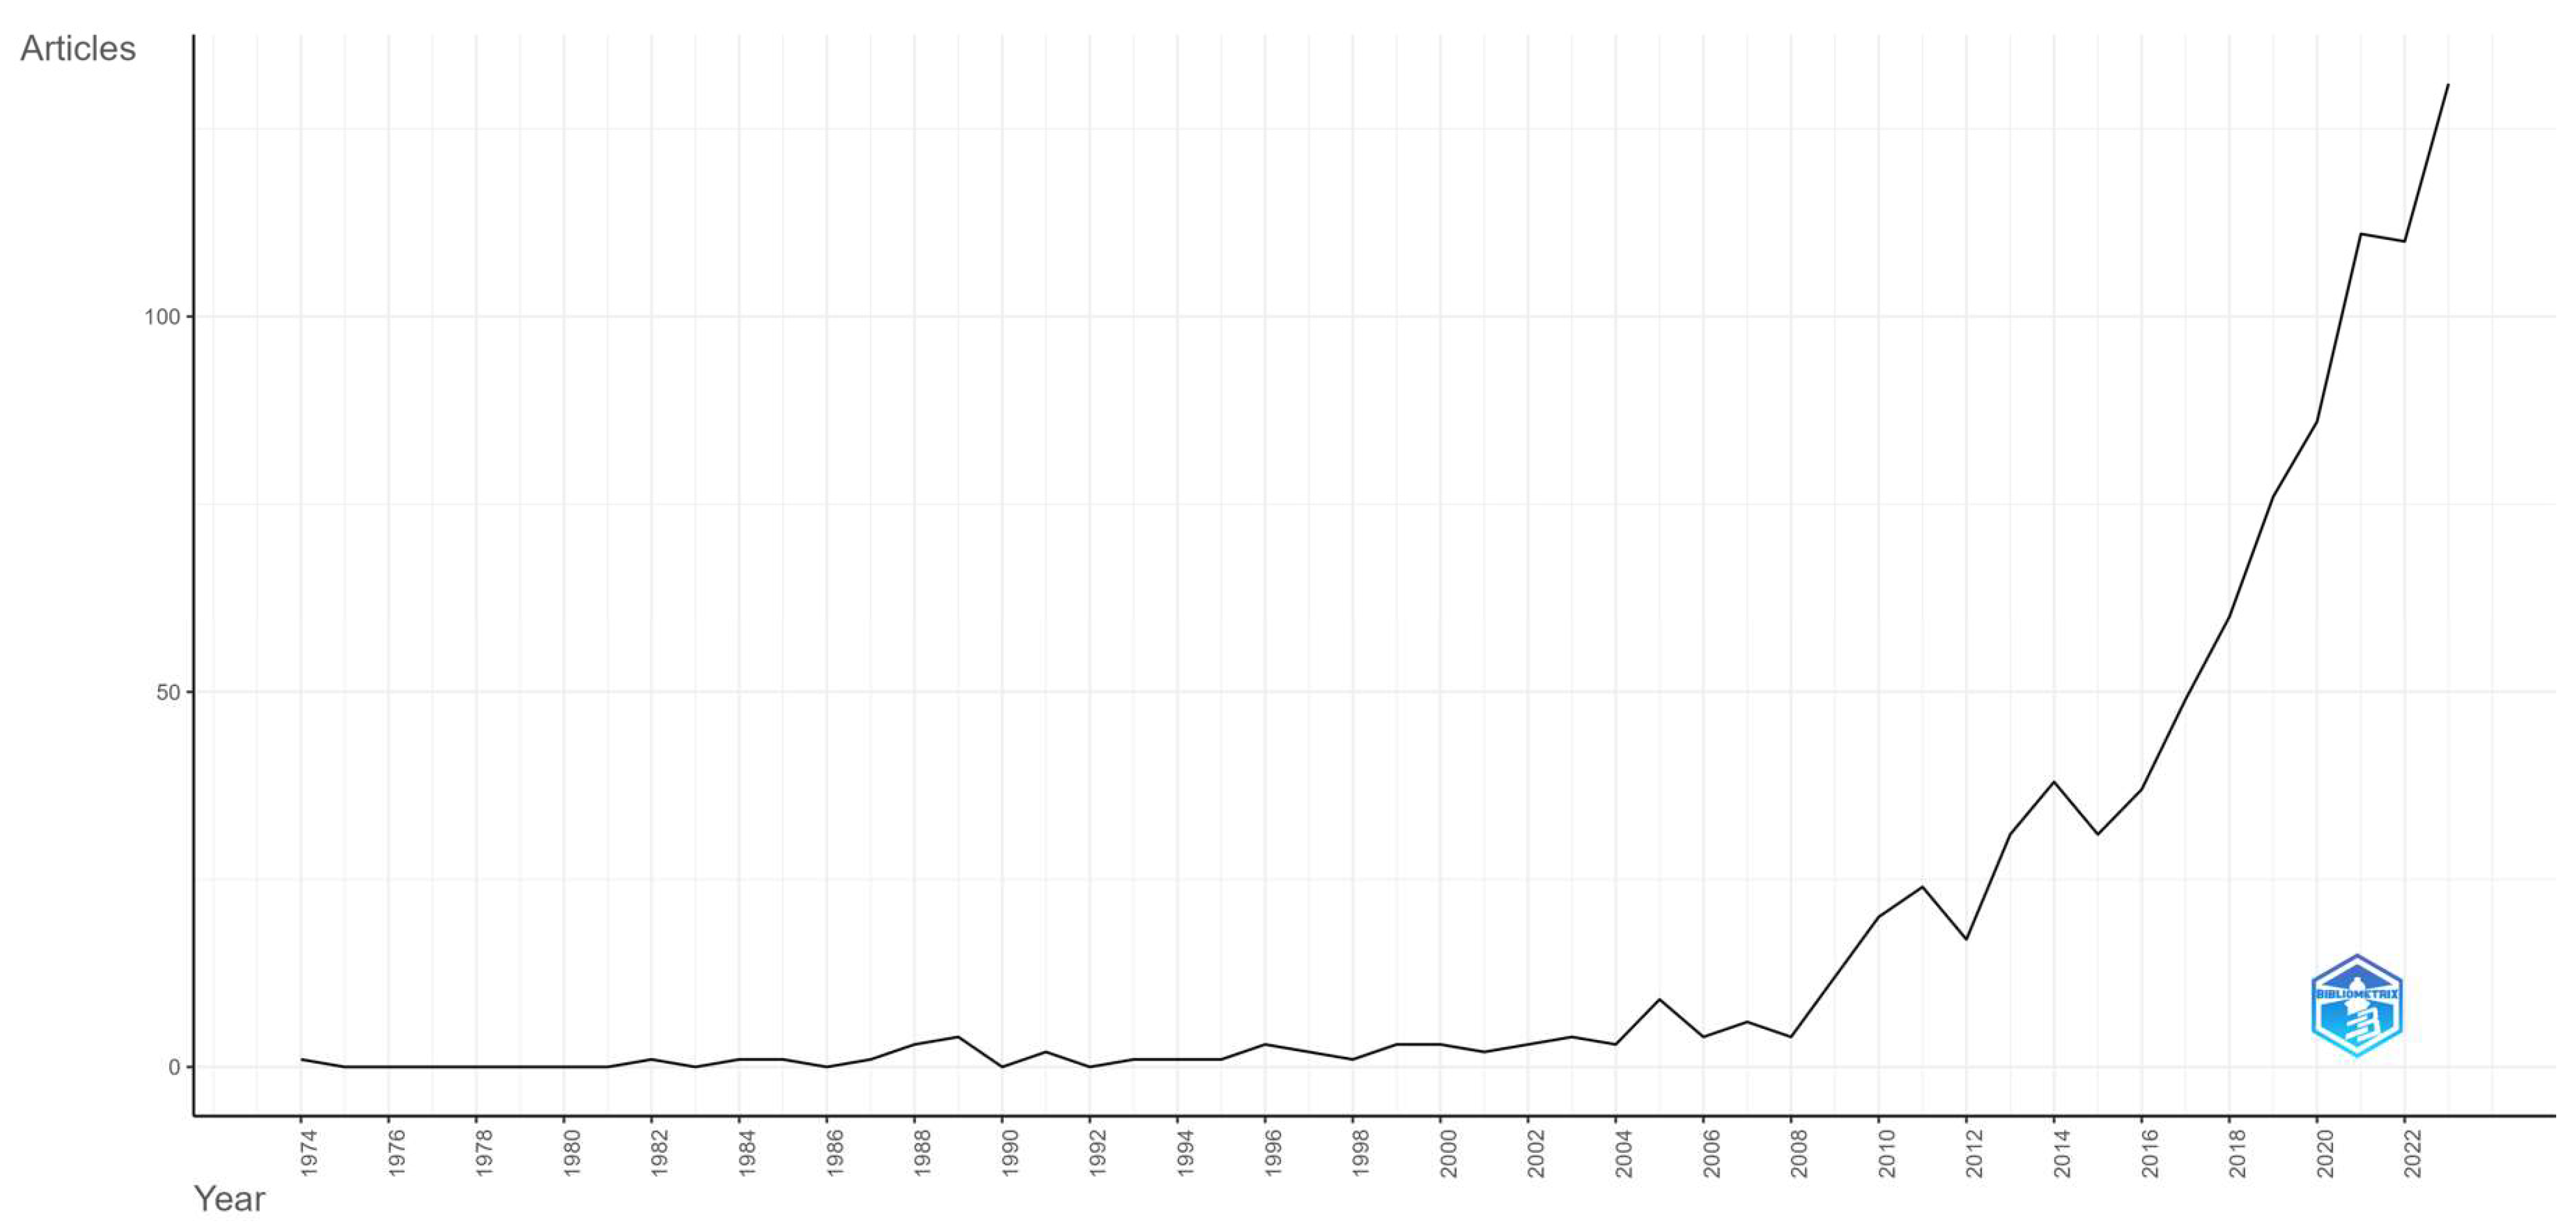
The results presented in Figure 2 provide a perspective on the evolution of scientific production in the analyzed field over several decades. In the early years, scientific production appears to have been very low or even nonexistent, except for some minor fluctuations. Starting in the 1980s and 1990s, we observe a gradual increase in the number of articles published per year, with certain annual fluctuations. This growth intensifies from the 2000s onwards, and from the 2010s onwards, we see a significant and consistent increase in scientific production. The 2010s and beyond seem to be periods of rapid and consistent growth, reflecting an increase in interest and research activity in the field. This upward trend suggests a maturation of the field and an increase in research involvement, with heightened interest from the scientific community and decision-makers. In particular, the years 2018–2023 are remarkable for a spectacular increase in scientific production, with a consistently growing number of articles per year. This may be attributed to heightened interest from researchers, technological advancements, better funding, or other factors that have encouraged research activity in the field. Overall, these data suggest a significant evolution of the field during the analyzed period and a continuous and increased interest in research in this domain.
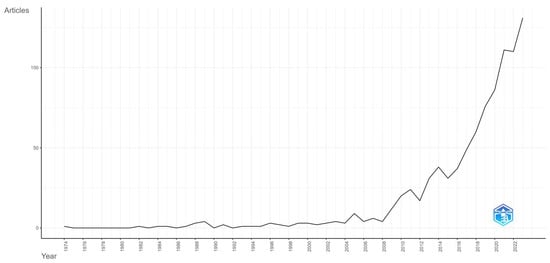
Figure 2.
Annual scientific production analyzed in the period 1974–2023.
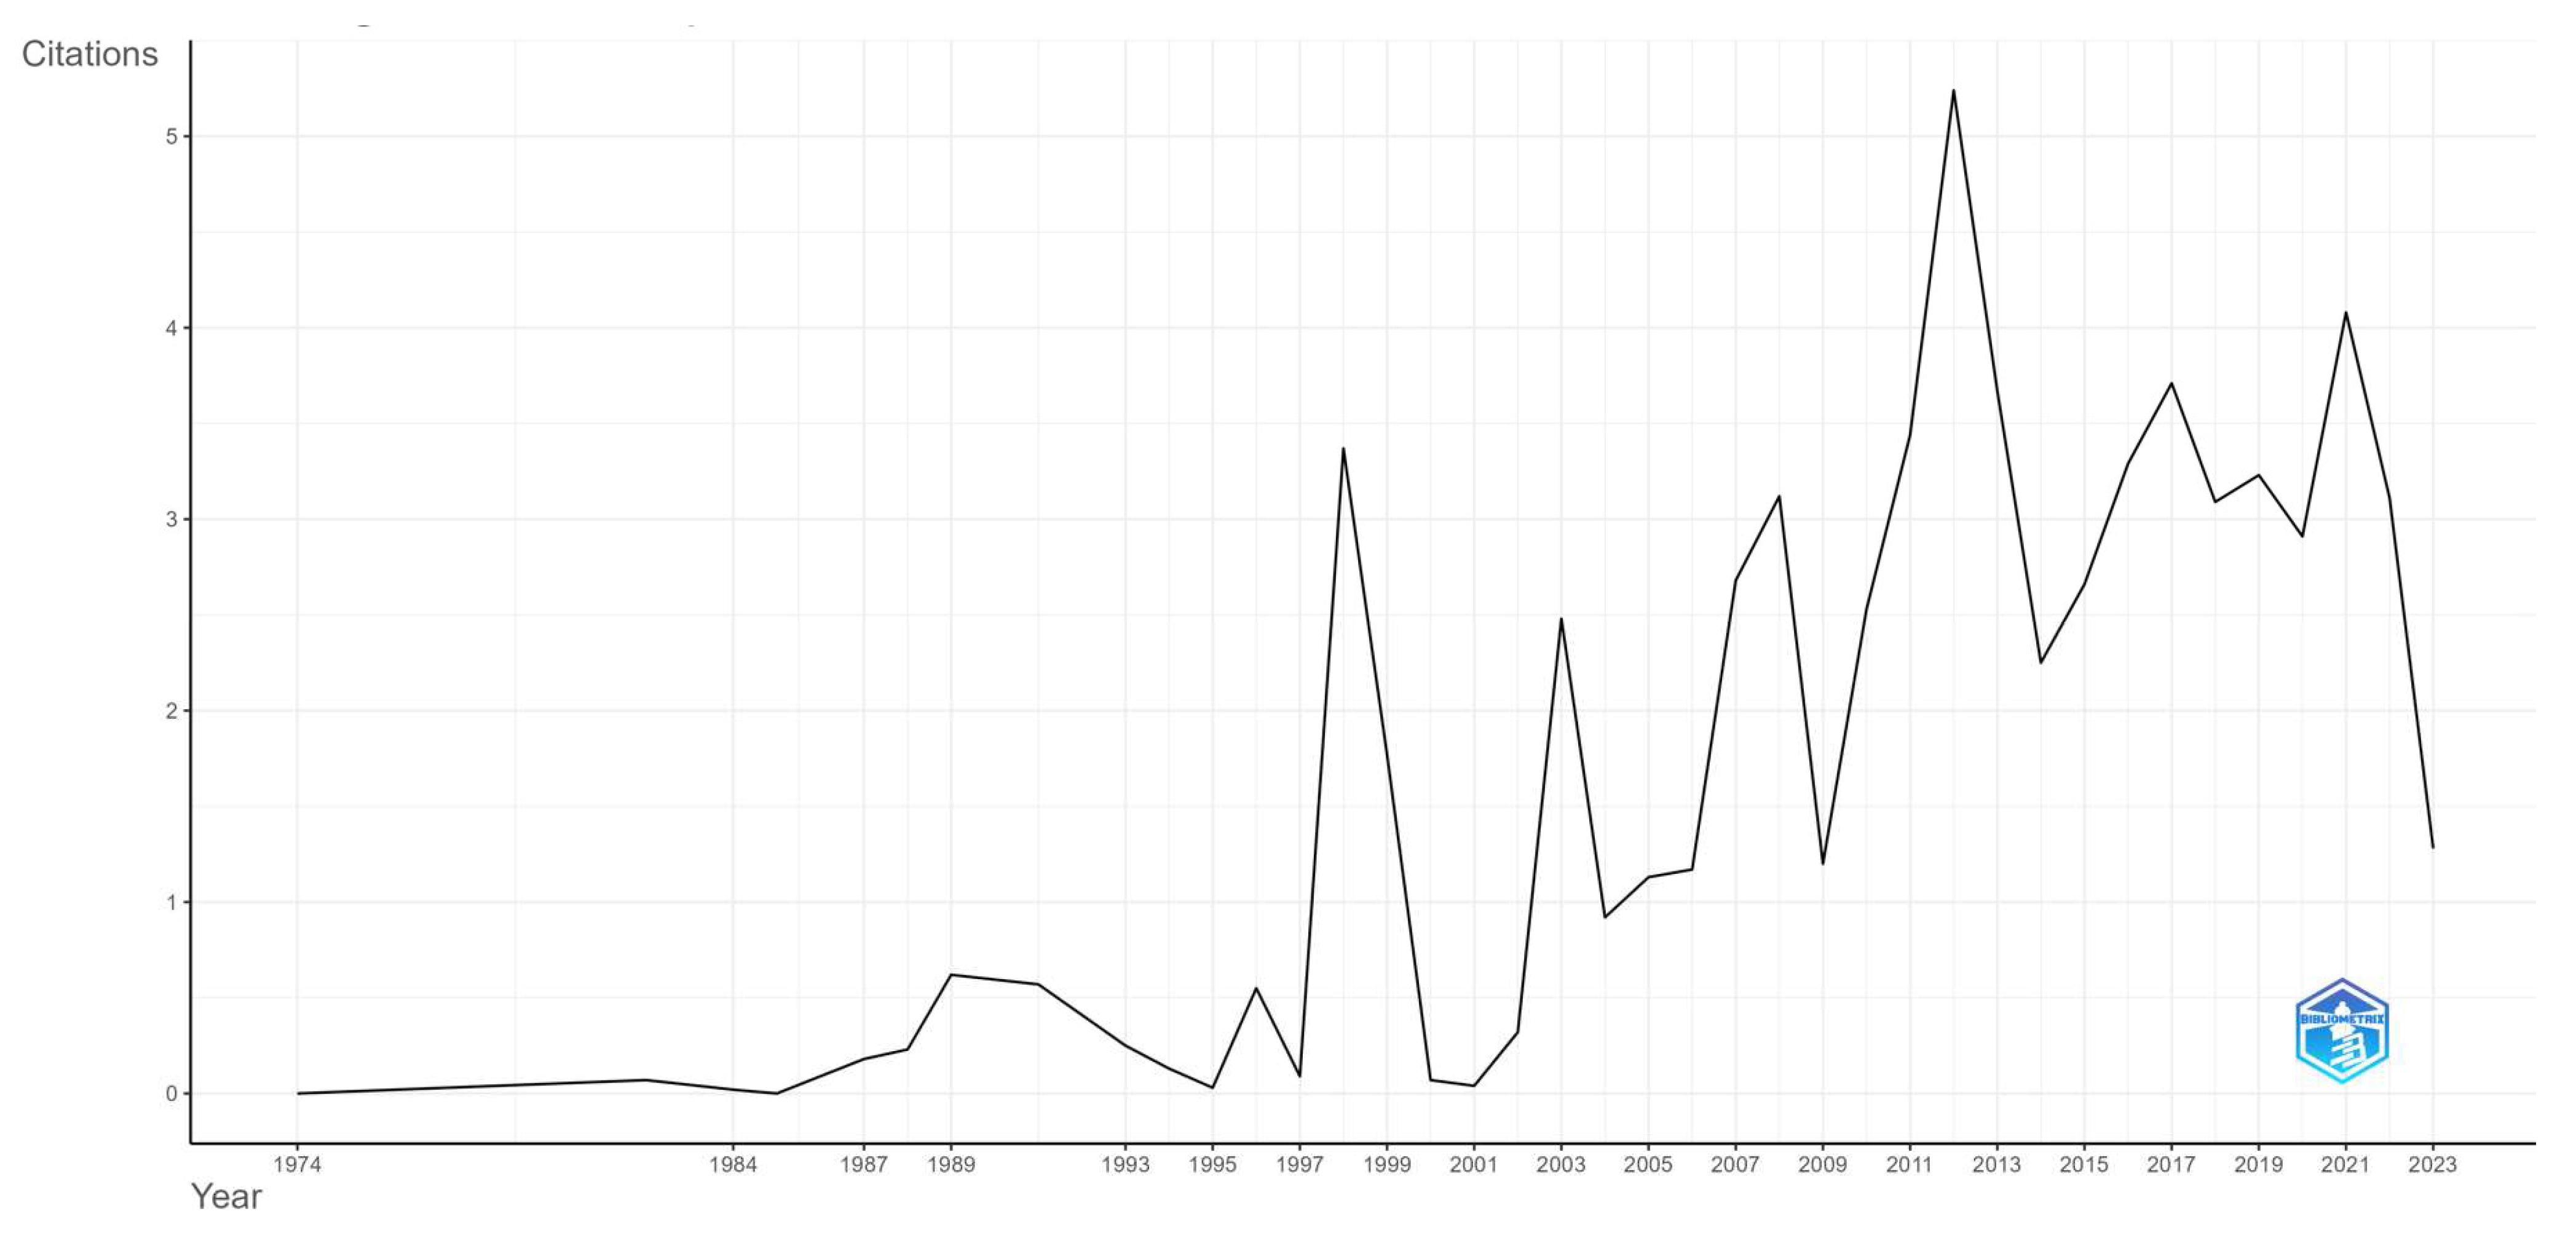
Figure 3 presents the average citations per article each year. In the early years, such as 1974 and 1985, the citation average is very low or even zero, which may indicate a low level of recognition and impact of the research published during those periods. As we progress over time, we observe significant increases in the citation average per year. For instance, in the years 1988, 1989, and 1999, the citation average is relatively high, indicating a heightened impact of the research published in those years. In recent years, such as the period 2013–2018, though the number of citations per year is generally lower than in previous years, it is still significant and indicates a continued interest and relevance of the published research. This may be attributed to a greater dilution of interest and attention given to each article in a broader publishing context. There is a significant variation in the average citations per article over the years, with some abrupt fluctuations between years. This fluctuation could be influenced by several factors, such as the topic and quality of the articles, the subject’s importance at a certain time, or trends in the research field. Overall, these results suggest that research published in different periods has had varying impact, and the field may be subject to changes and fluctuations regarding its relevance and recognition within the scientific community.
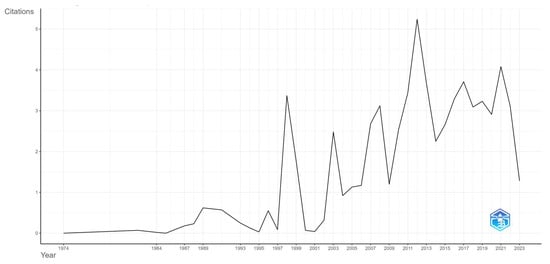
Figure 3.
Average citations per year.
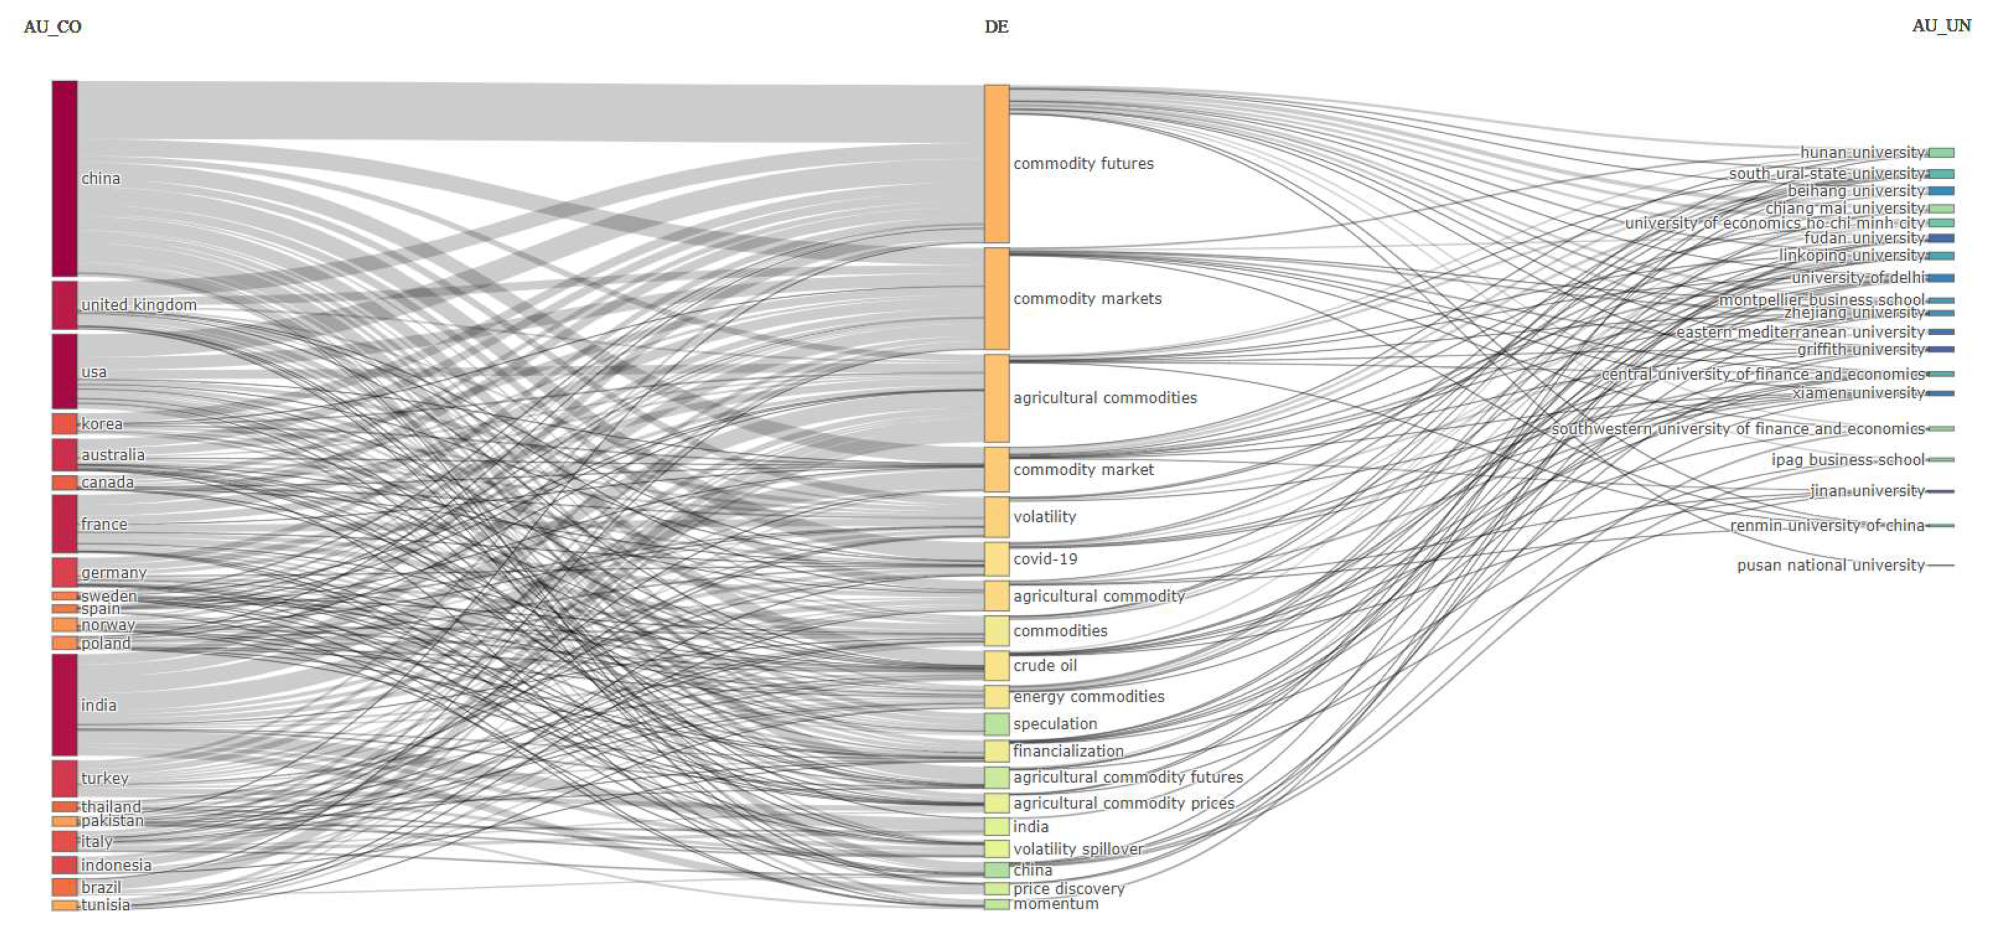
Figure 4 shows, for instance, that China is a significant source of research in the field of commodity futures, with numerous external collaborations. It connects most strongly with the keywords “commodity futures”, “commodity markets”, and “agricultural commodities”, indicating a close link between China and this research subject, as well as with other research topics such as “volatility”, “energy commodities”, “COVID-19”, and “financialization”. China has extensive and diversified collaborations in the field of commodity market research, with partnerships involving institutions like Hunan University, Xiamen University, and Pusan National University. On the other hand, Indonesia shows a smaller but still significant contribution to research in commodity markets. It also connects strongly with “commodity markets”, as well as with “agricultural commodities”, “COVID-19”, “crude oil”, and “volatility spillover”, reflecting the diversity of research interests in Indonesia.
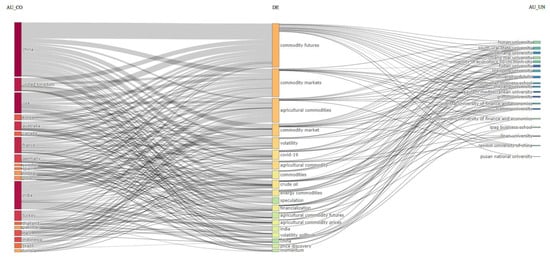
Figure 4.
Three-field plot (left—countries, middle—keywords, right—affiliations).
3.1. Sources
This section focuses on the analysis of sources as an essential component of our bibliometric analysis as it provides us with a comprehensive perspective on the academic landscape regarding commodity markets and related topics. We examine the 10 most relevant sources that have significantly contributed to the academic literature in the field of commodity markets, including core sources by Bradford’s law and sources’ production over time. Bradford’s law states that for a given research field, there are a few highly productive journals, a larger number of moderately productive ones, and an even larger number with constantly decreasing productivity, classifying these three categories into Zones 1, 2, and 3 [24,25].
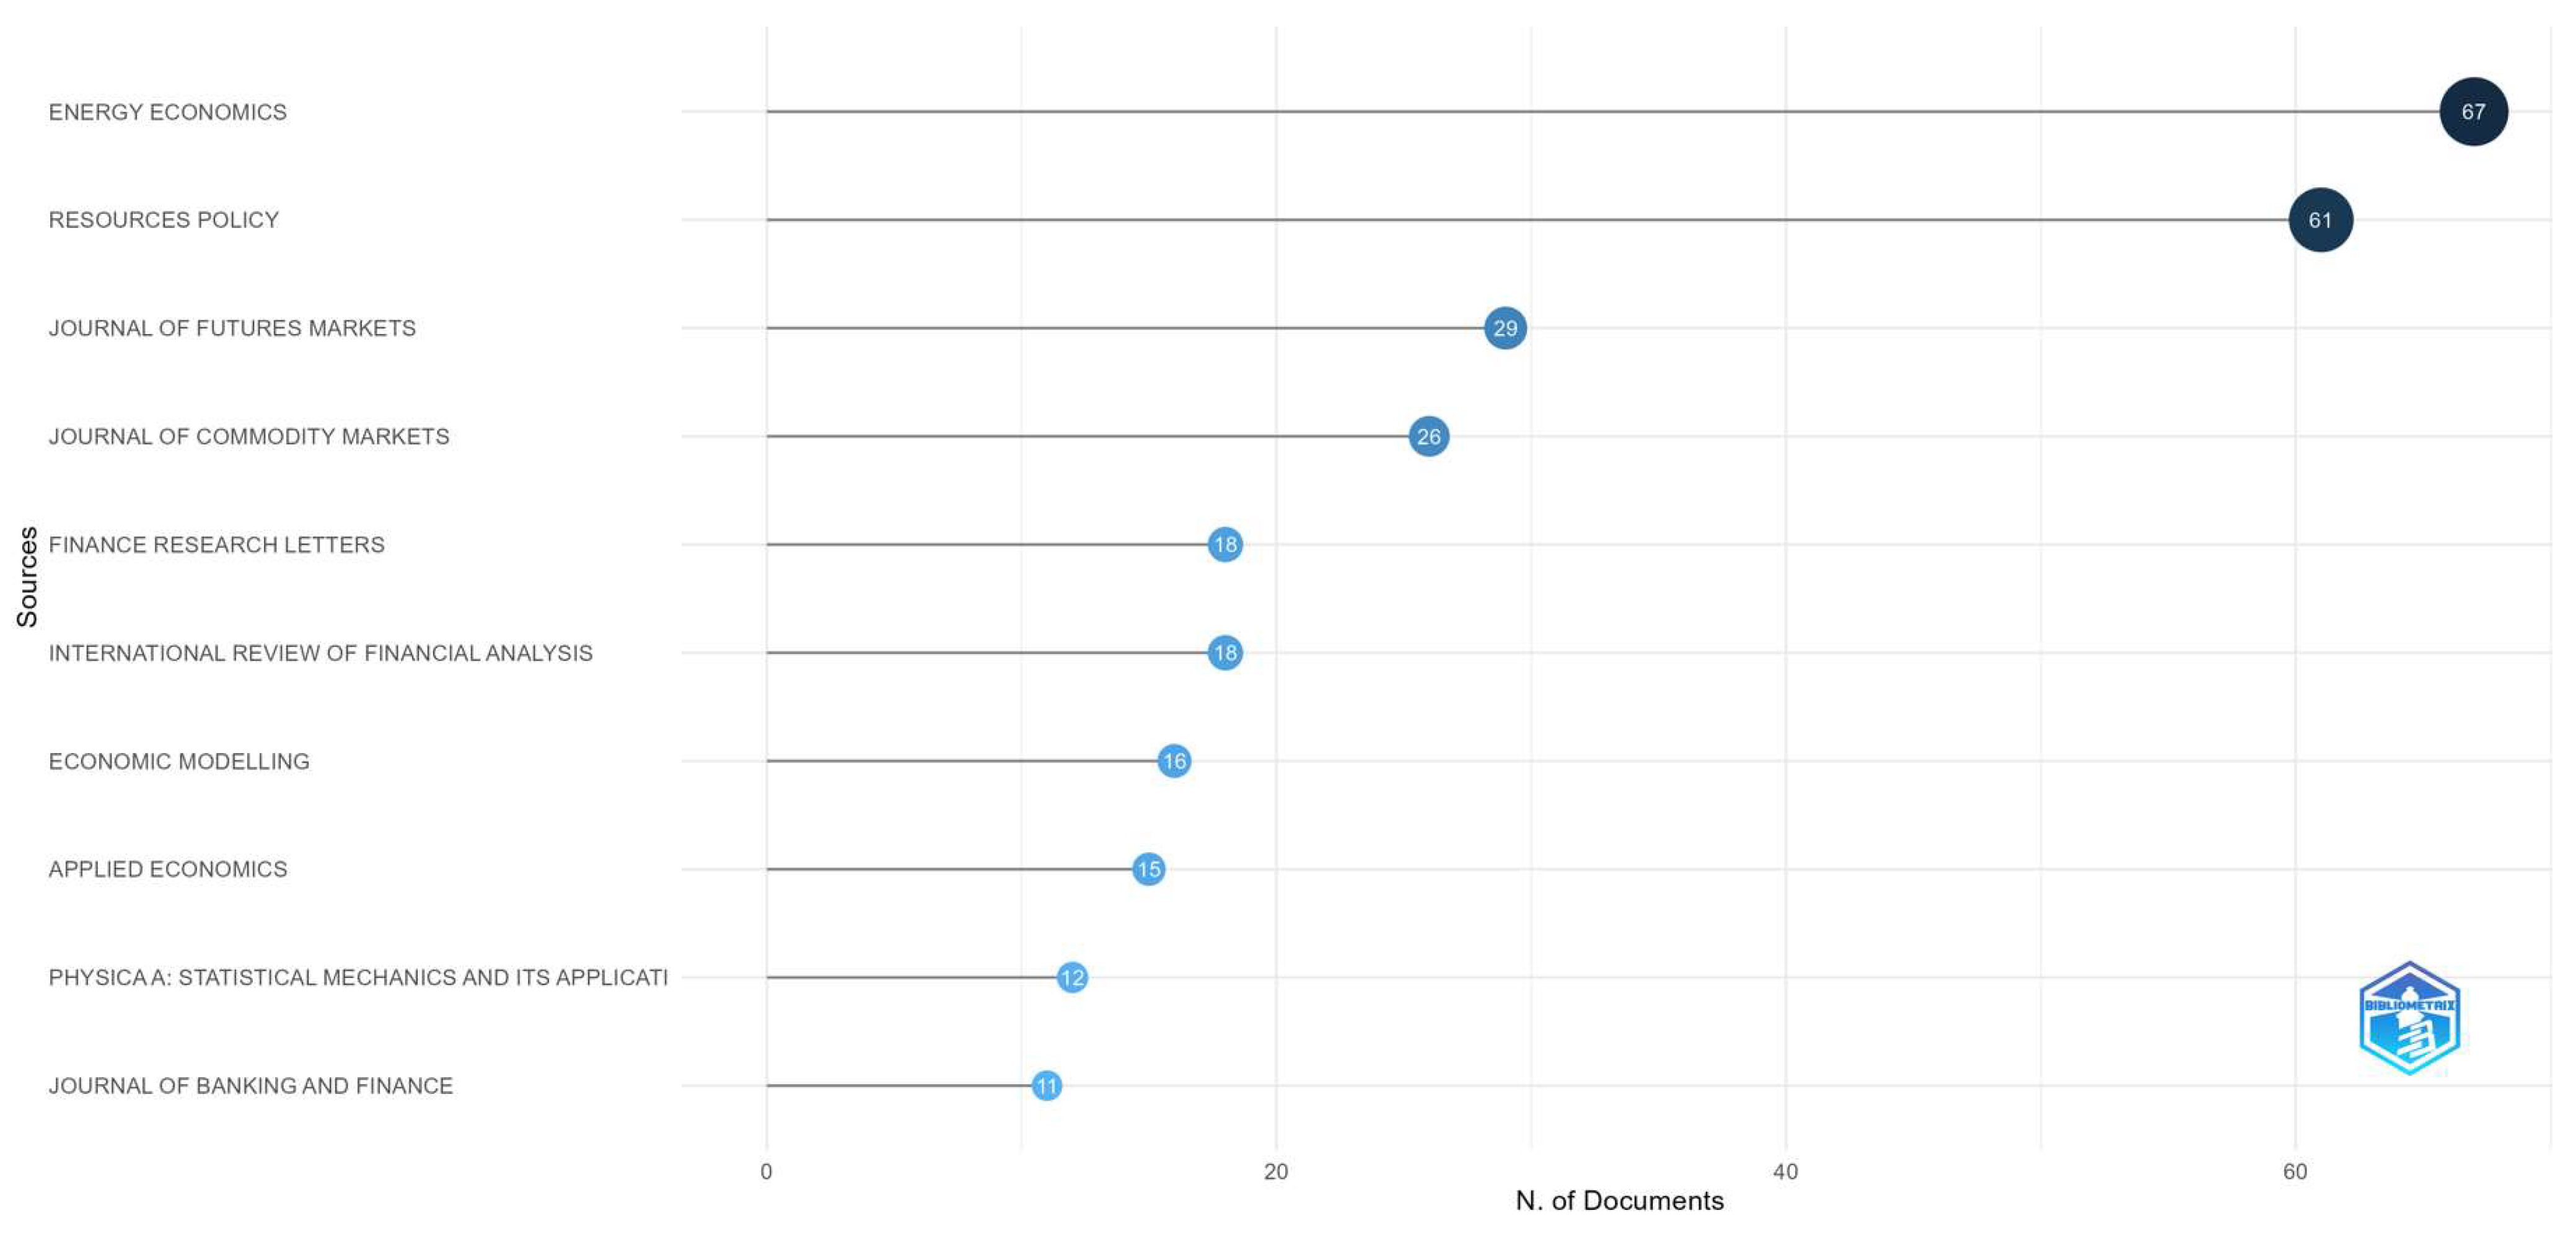
Figure 5 depicts the top 10 most relevant sources classified by the number of publications. We observe that the journal Energy Economics ranks first. This journal focuses on topics related to energy economics, making it a relevant source in the context of our analysis as energy plays a crucial role in commodity markets, particularly regarding the energy resources used in production and consumption. Another significant journal is Resources Policy, which examines policies and strategies related to the use and management of natural resources, including commodities. Ranking third is the Journal of Futures Markets. This journal deals with publications regarding the latest developments in the field of financial market futures and derivatives. The Journal of Commodity Markets ranks fourth in the conducted ranking, being a specialized journal in the field of commodity markets, directly relevant to our research topic and providing a detailed perspective on the dynamics and evolution of these markets.
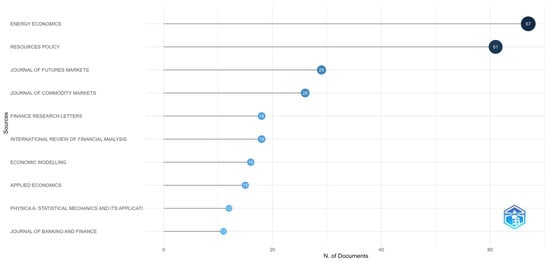
Figure 5.
Top 10 relevant sources by number of scientific documents published.
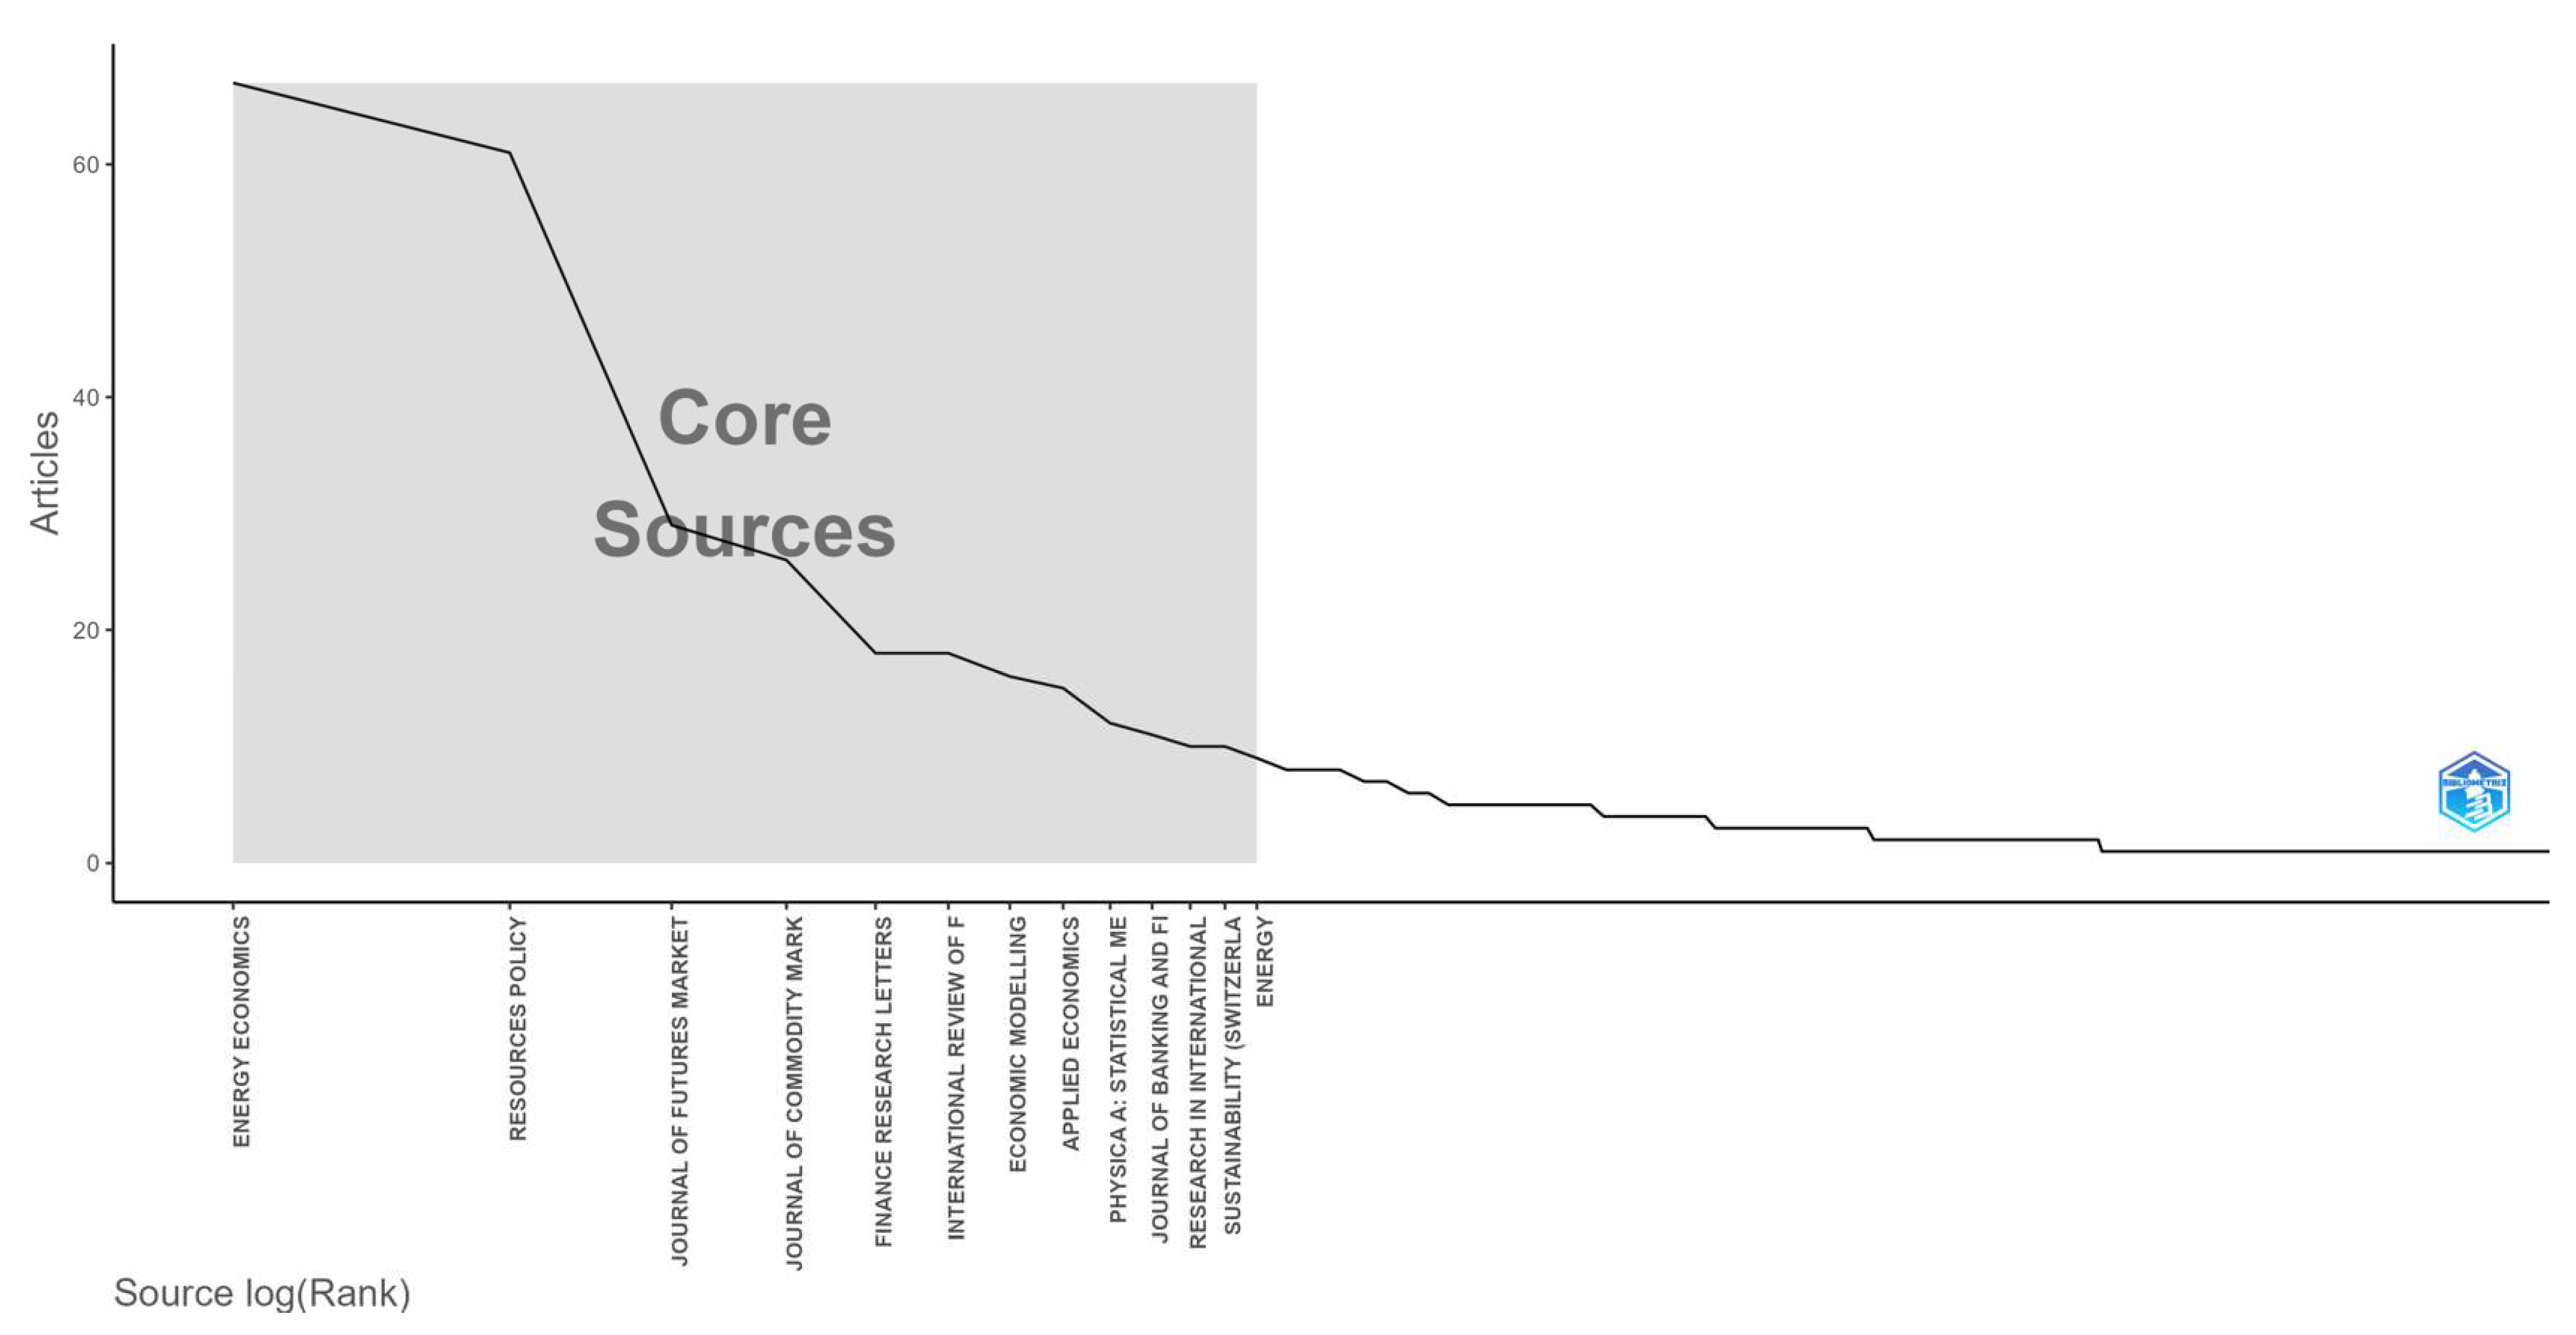
Bradford’s law is a bibliometric principle that suggests that the number of journals contributing to a specific field of research follows a certain pattern. According to this law, a small number of journals (Zone 1) contribute to the majority of publications in a field, while a larger number of journals contribute to a smaller proportion of publications. In Figure 5, only the journals/sources falling within Zone 1 according to Bradford’s law are depicted. Zone 2 is characterized by an average number of scientific documents published by an average number of sources, while Zone 3 classifies a large number of journals that have published a small number of scientific documents [24,26]. According to Figure 6, Energy Economics ranks first with a frequency of 67 publications, followed closely by Resources Policy with 61 publications. These two journals fall into Zone 1 according to Bradford’s law, indicating that they are core sources contributing significantly to the literature in this field. The Journal of Futures Markets, Journal of Commodity Markets, Finance Research Letters, International Review of Financial Analysis, Economic Modelling, Applied Economics, and Journal of Banking and Finance also fall into Zone 1, indicating their importance as core sources in the field of commodity markets research.
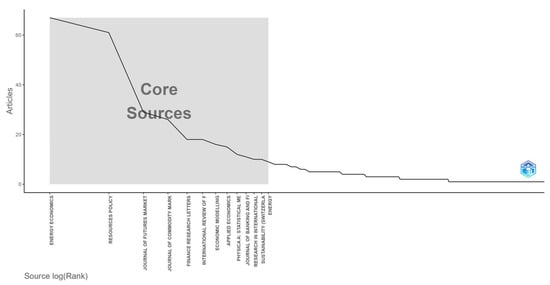
Figure 6.
Core sources by Bradford’s law.
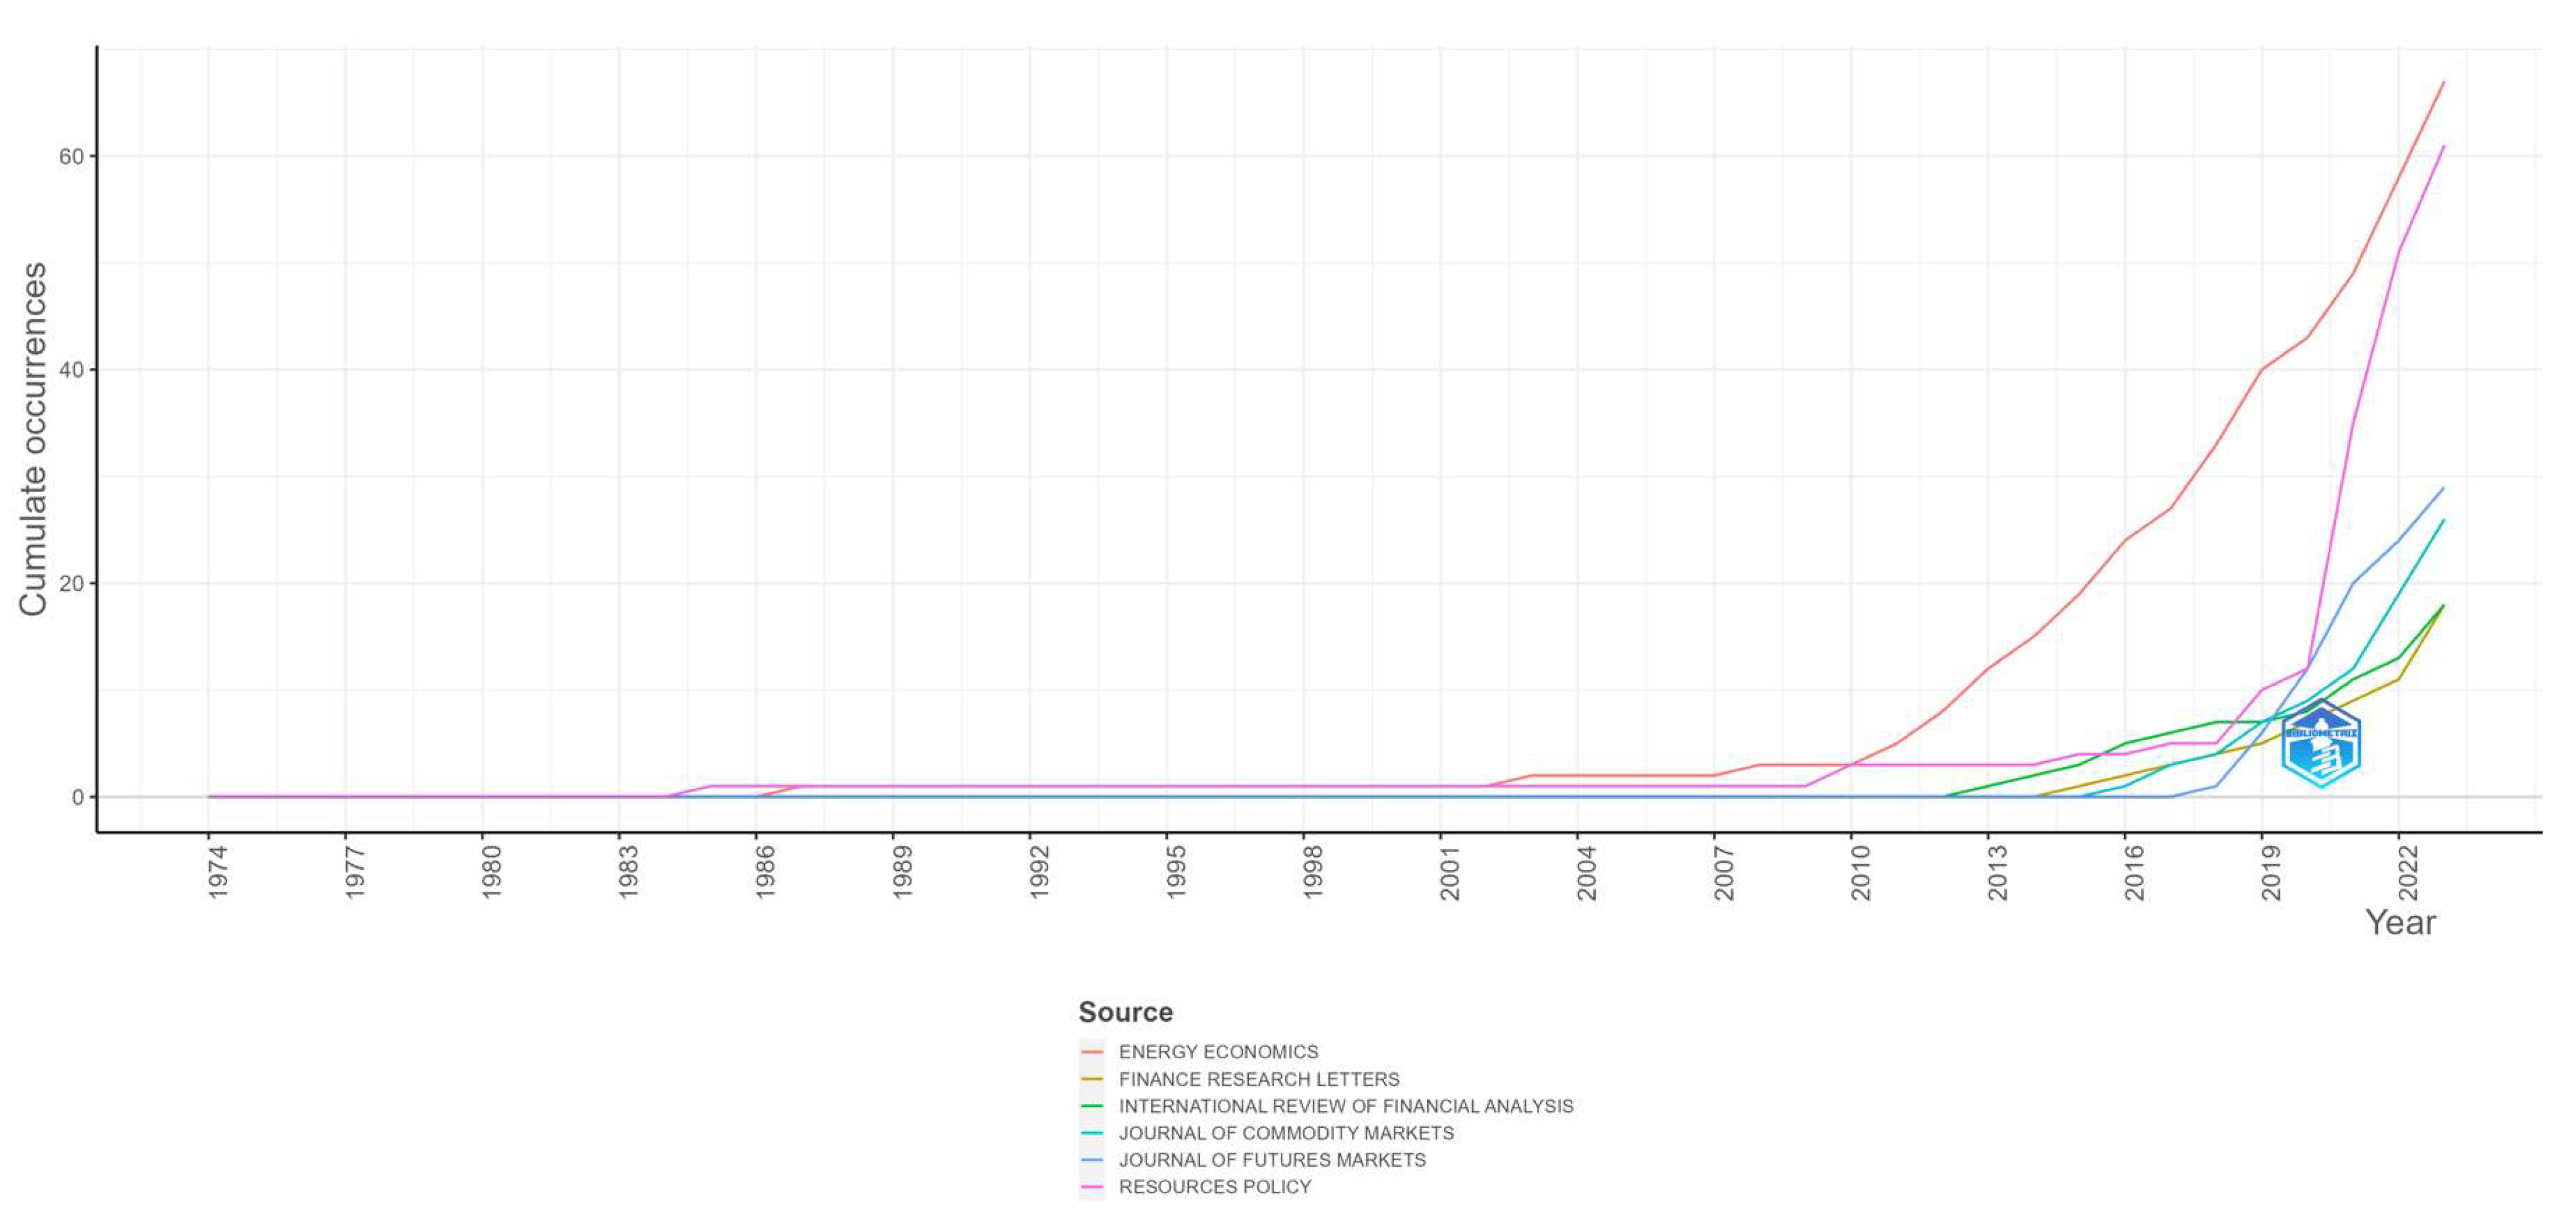
The findings highlighted by Bradford’s law are reinforced by the results depicted in Figure 7, which presents sources’ production over time. Additionally, we observe in Figure 7 that after the year 2010, the Energy Economics Journal significantly increased its scientific publication production from 3 publications in 2010 to 67 in 2023.
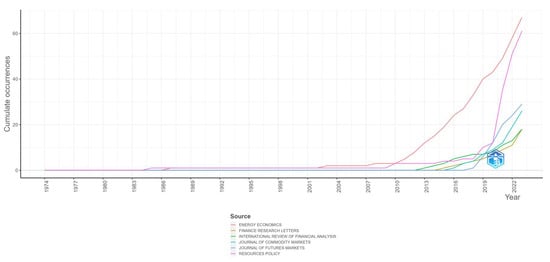
Figure 7.
Top 6 sources’ production over time.
3.2. Authors
This section aims to analyze the authors, an essential aspect of our bibliometric study, as authors represent a fundamental component of academic literature in the field of commodity markets and related subjects. We examine the most relevant authors and their production evolution over time, aiming to identify significant contributions and relevant trends in this domain. By analyzing authors and their production over time, we will gain a deeper insight into individual contributions to the scientific literature in this field and how they have evolved over the years.
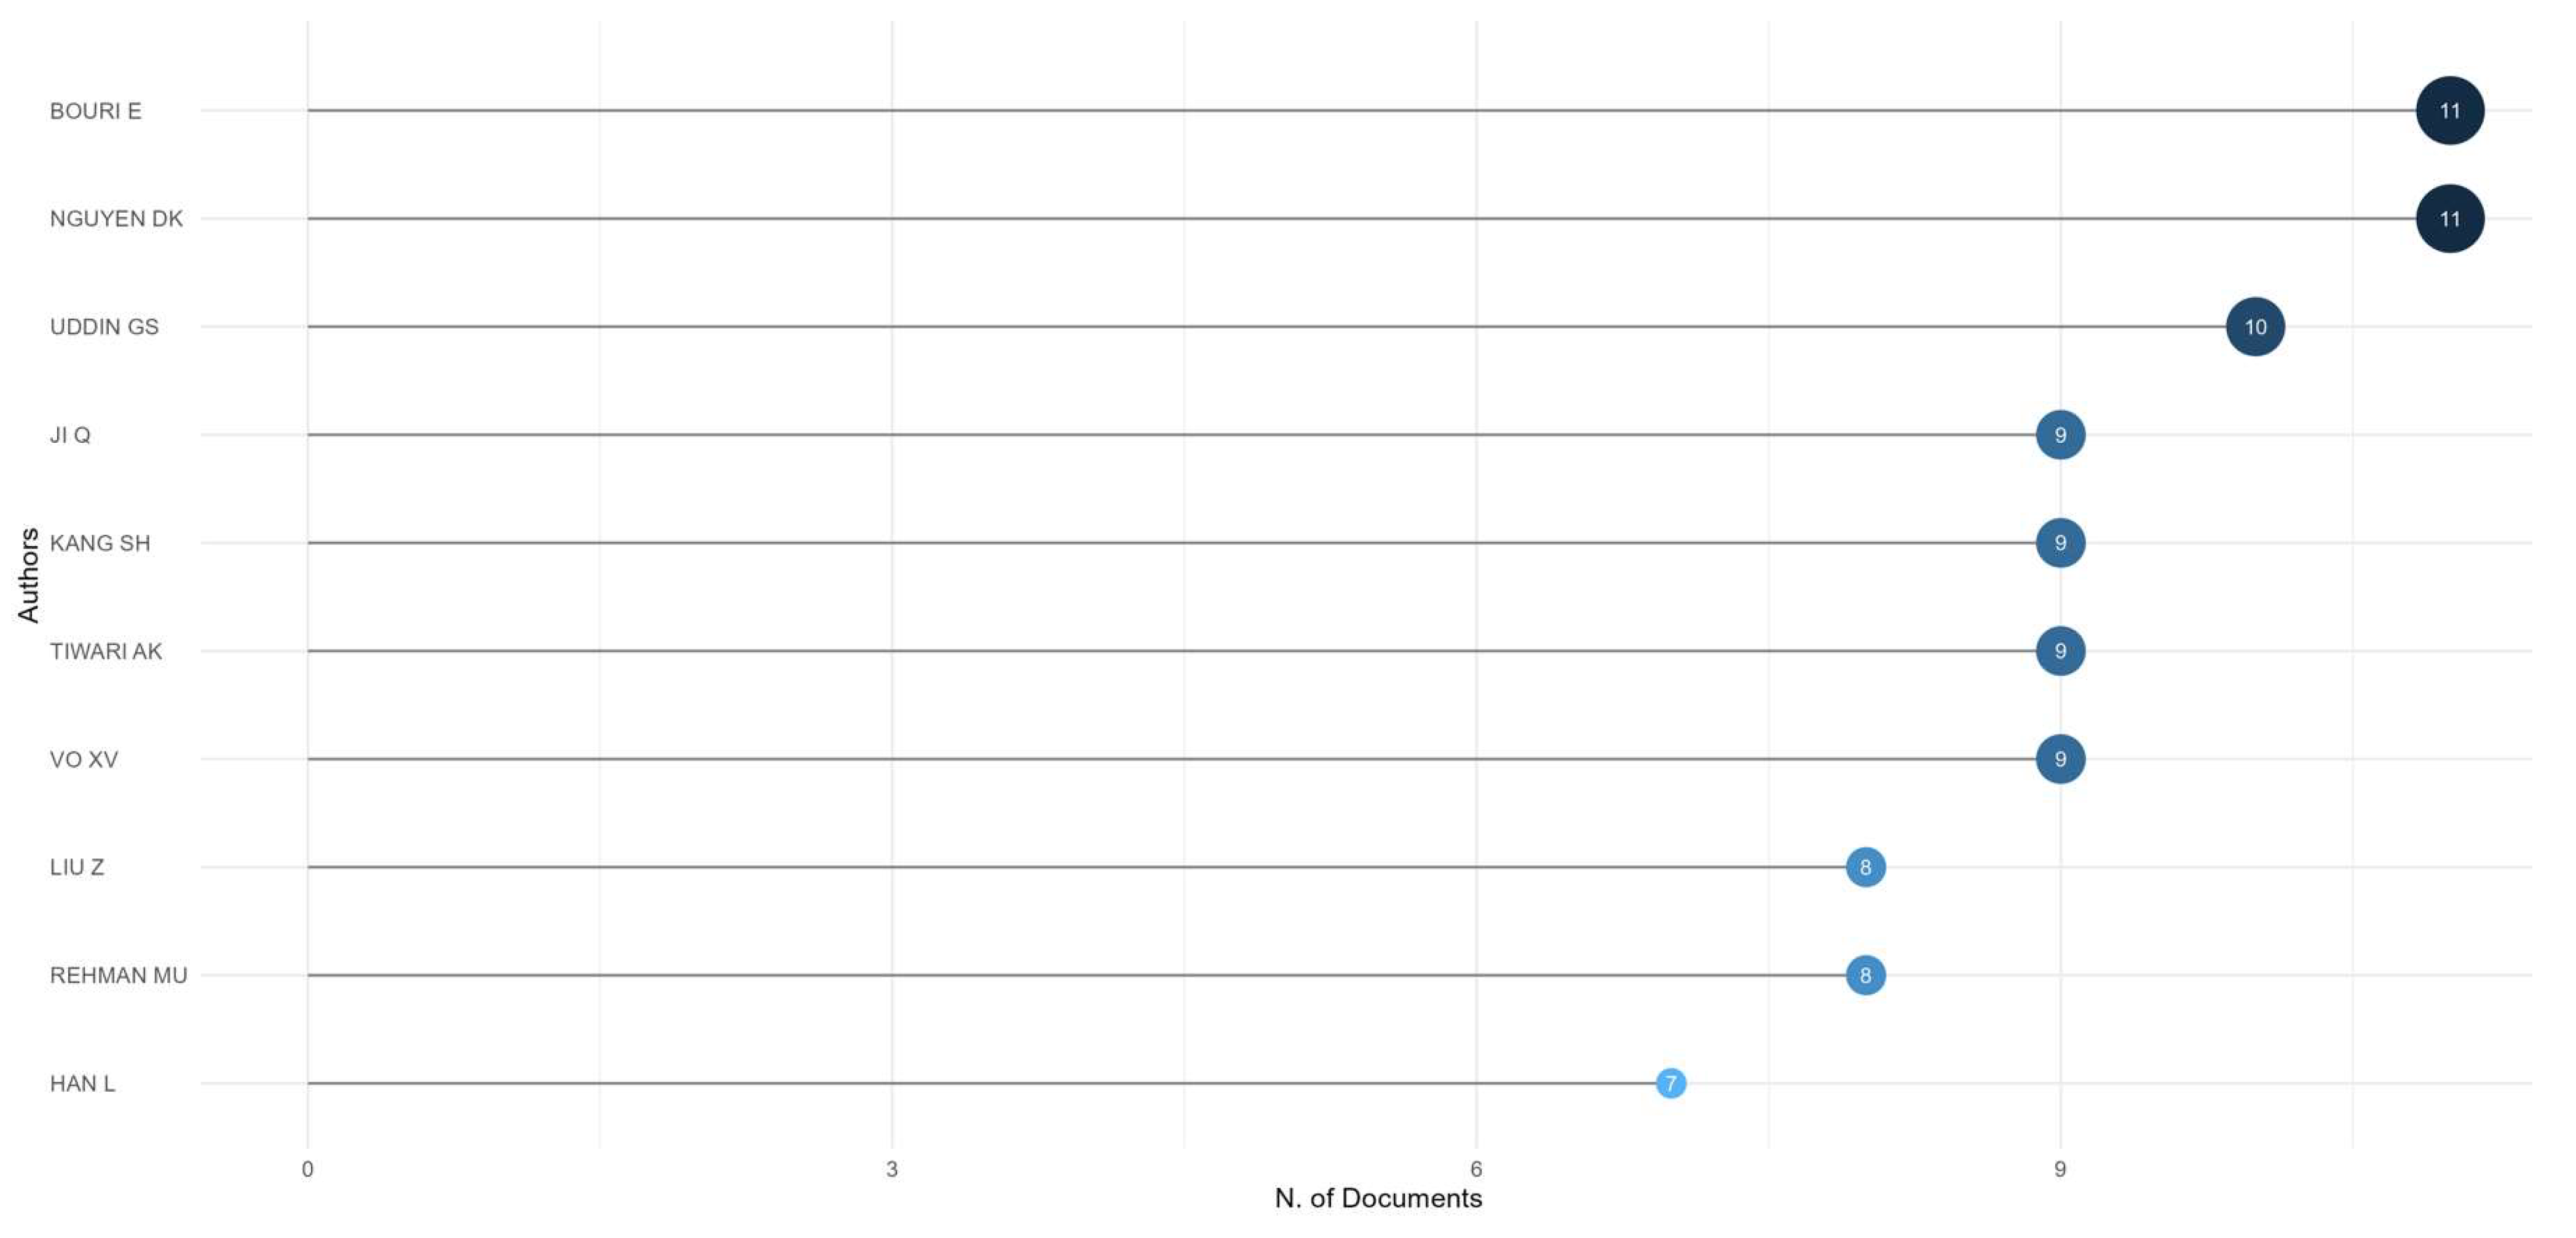
The information from Figure 8 shows the total number of articles published by each author identified in our bibliometric analysis. The authors Bouri E., Nguyen D.K., and Uddin G.S. are in the top three according to the graph.

Figure 8.
Top 10 relevant authors by number of scientific documents published.
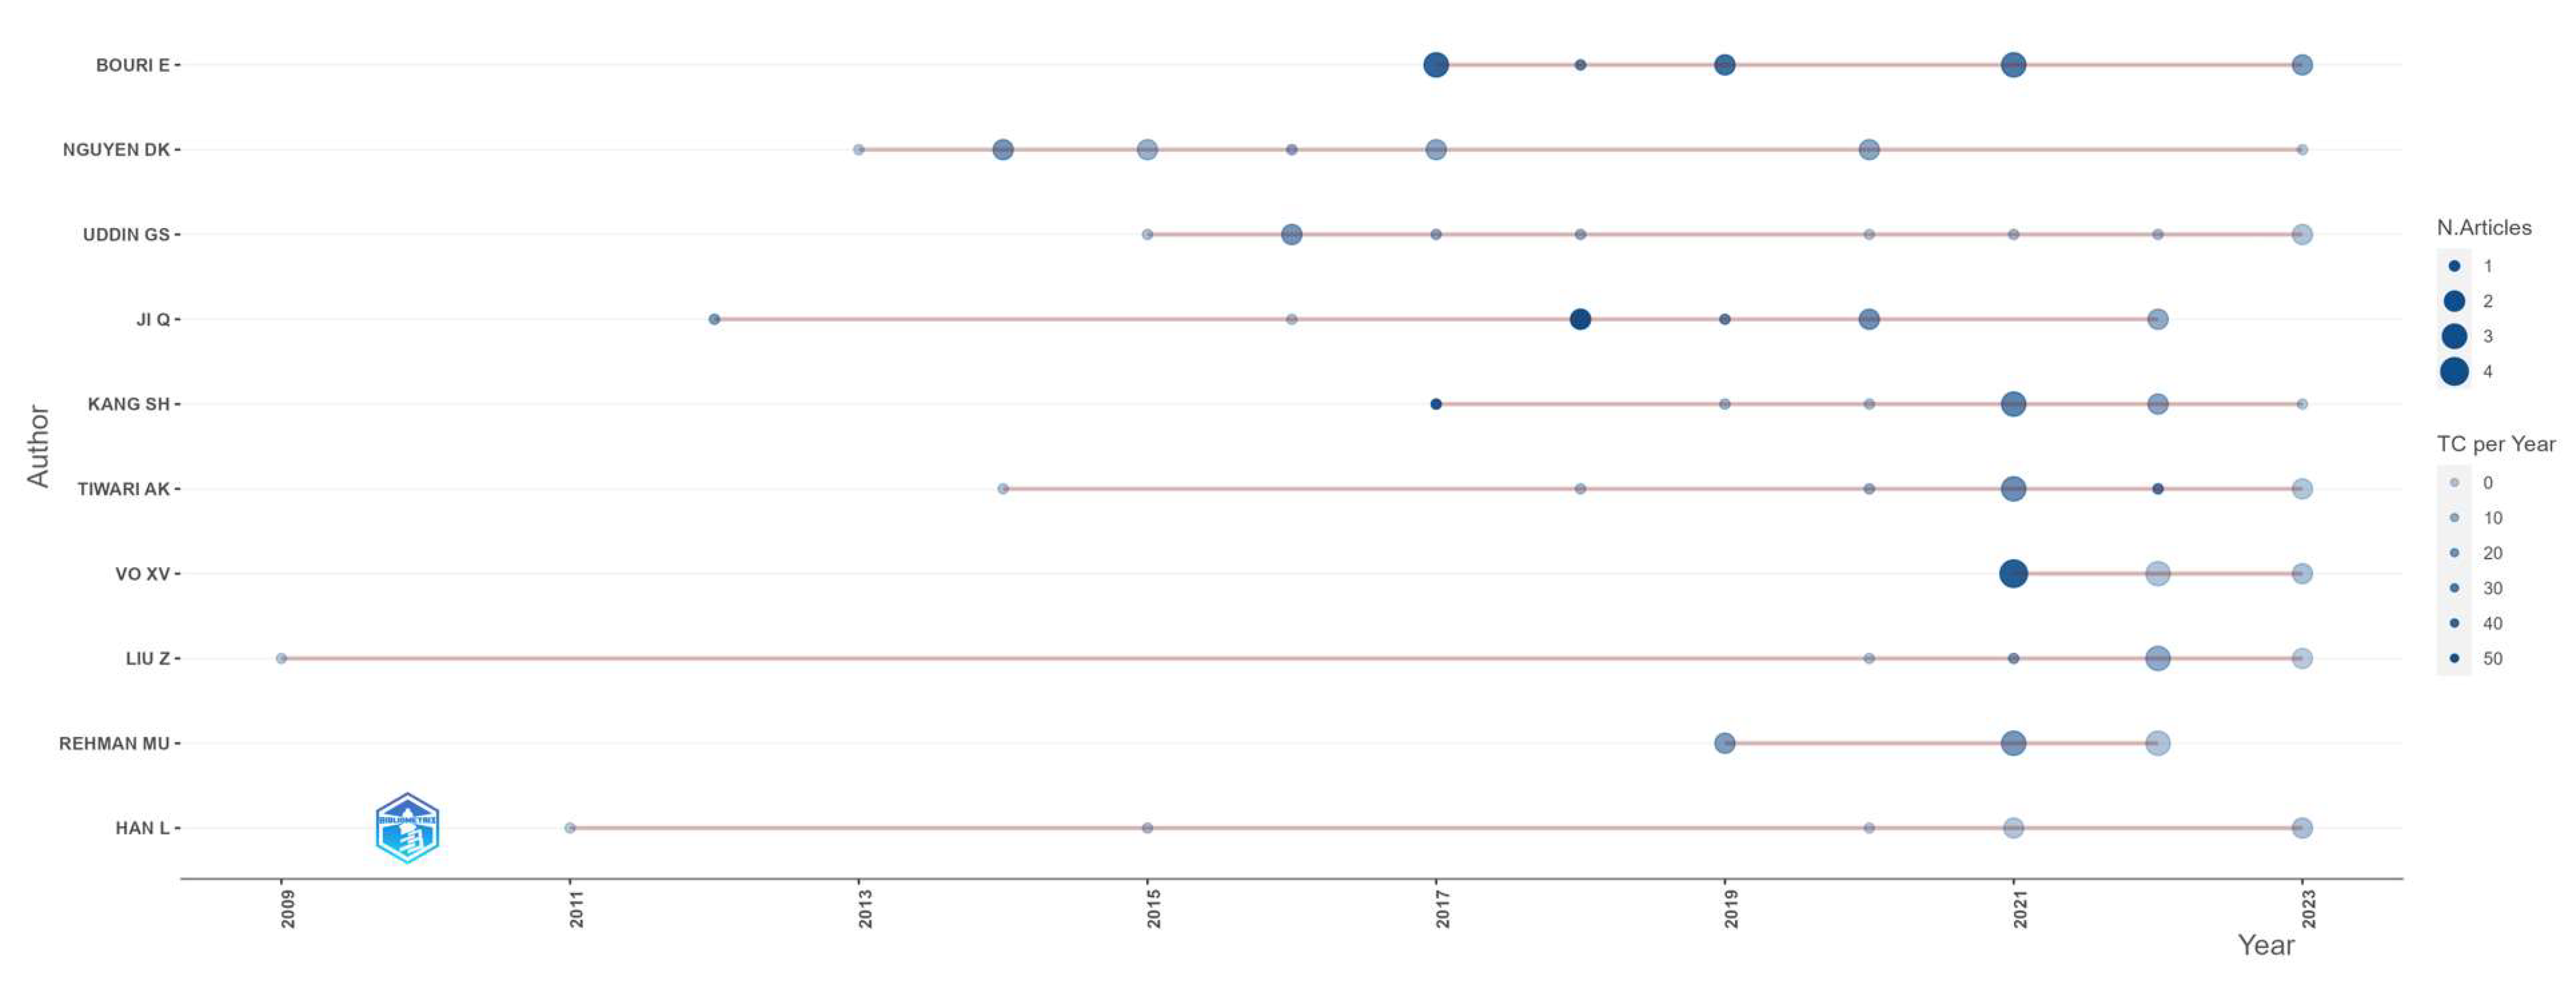
Figure 9 illustrates the frequency of publications and the total number of citations per year for each author in the bibliometric analysis. The most prolific authors are Bouri E., Nguyen D.K., Ji Q., Kang S.H., and Vo X.V., with multiple publications and a significant number of citations in the years under examination. There is a variety of patterns regarding authors’ production over time. The dots represent a mix of the number of articles published and the number of citations received. The larger they are, the more publications they signify, and the more intense the blue, the more citations the corresponding author has received. Some authors have published more works in specific years, generating a higher number of citations, while others may have a more uniform distribution of publications over the years. For example, author Vo X.V. published the highest number of articles in 2021 (4 articles) and received the most citations (totaling 45 citations) during that year. Analyzing authors’ production over time provides us with a deeper understanding of their individual contributions and their impact in the field of commodity markets and related subjects.
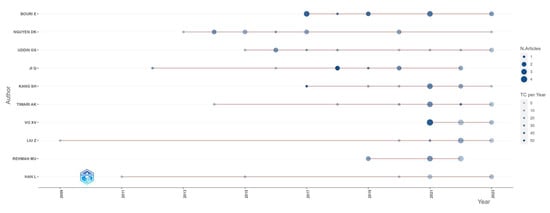
Figure 9.
Authors’ production over time by number of published documents and total citations per year.
3.3. Affiliations
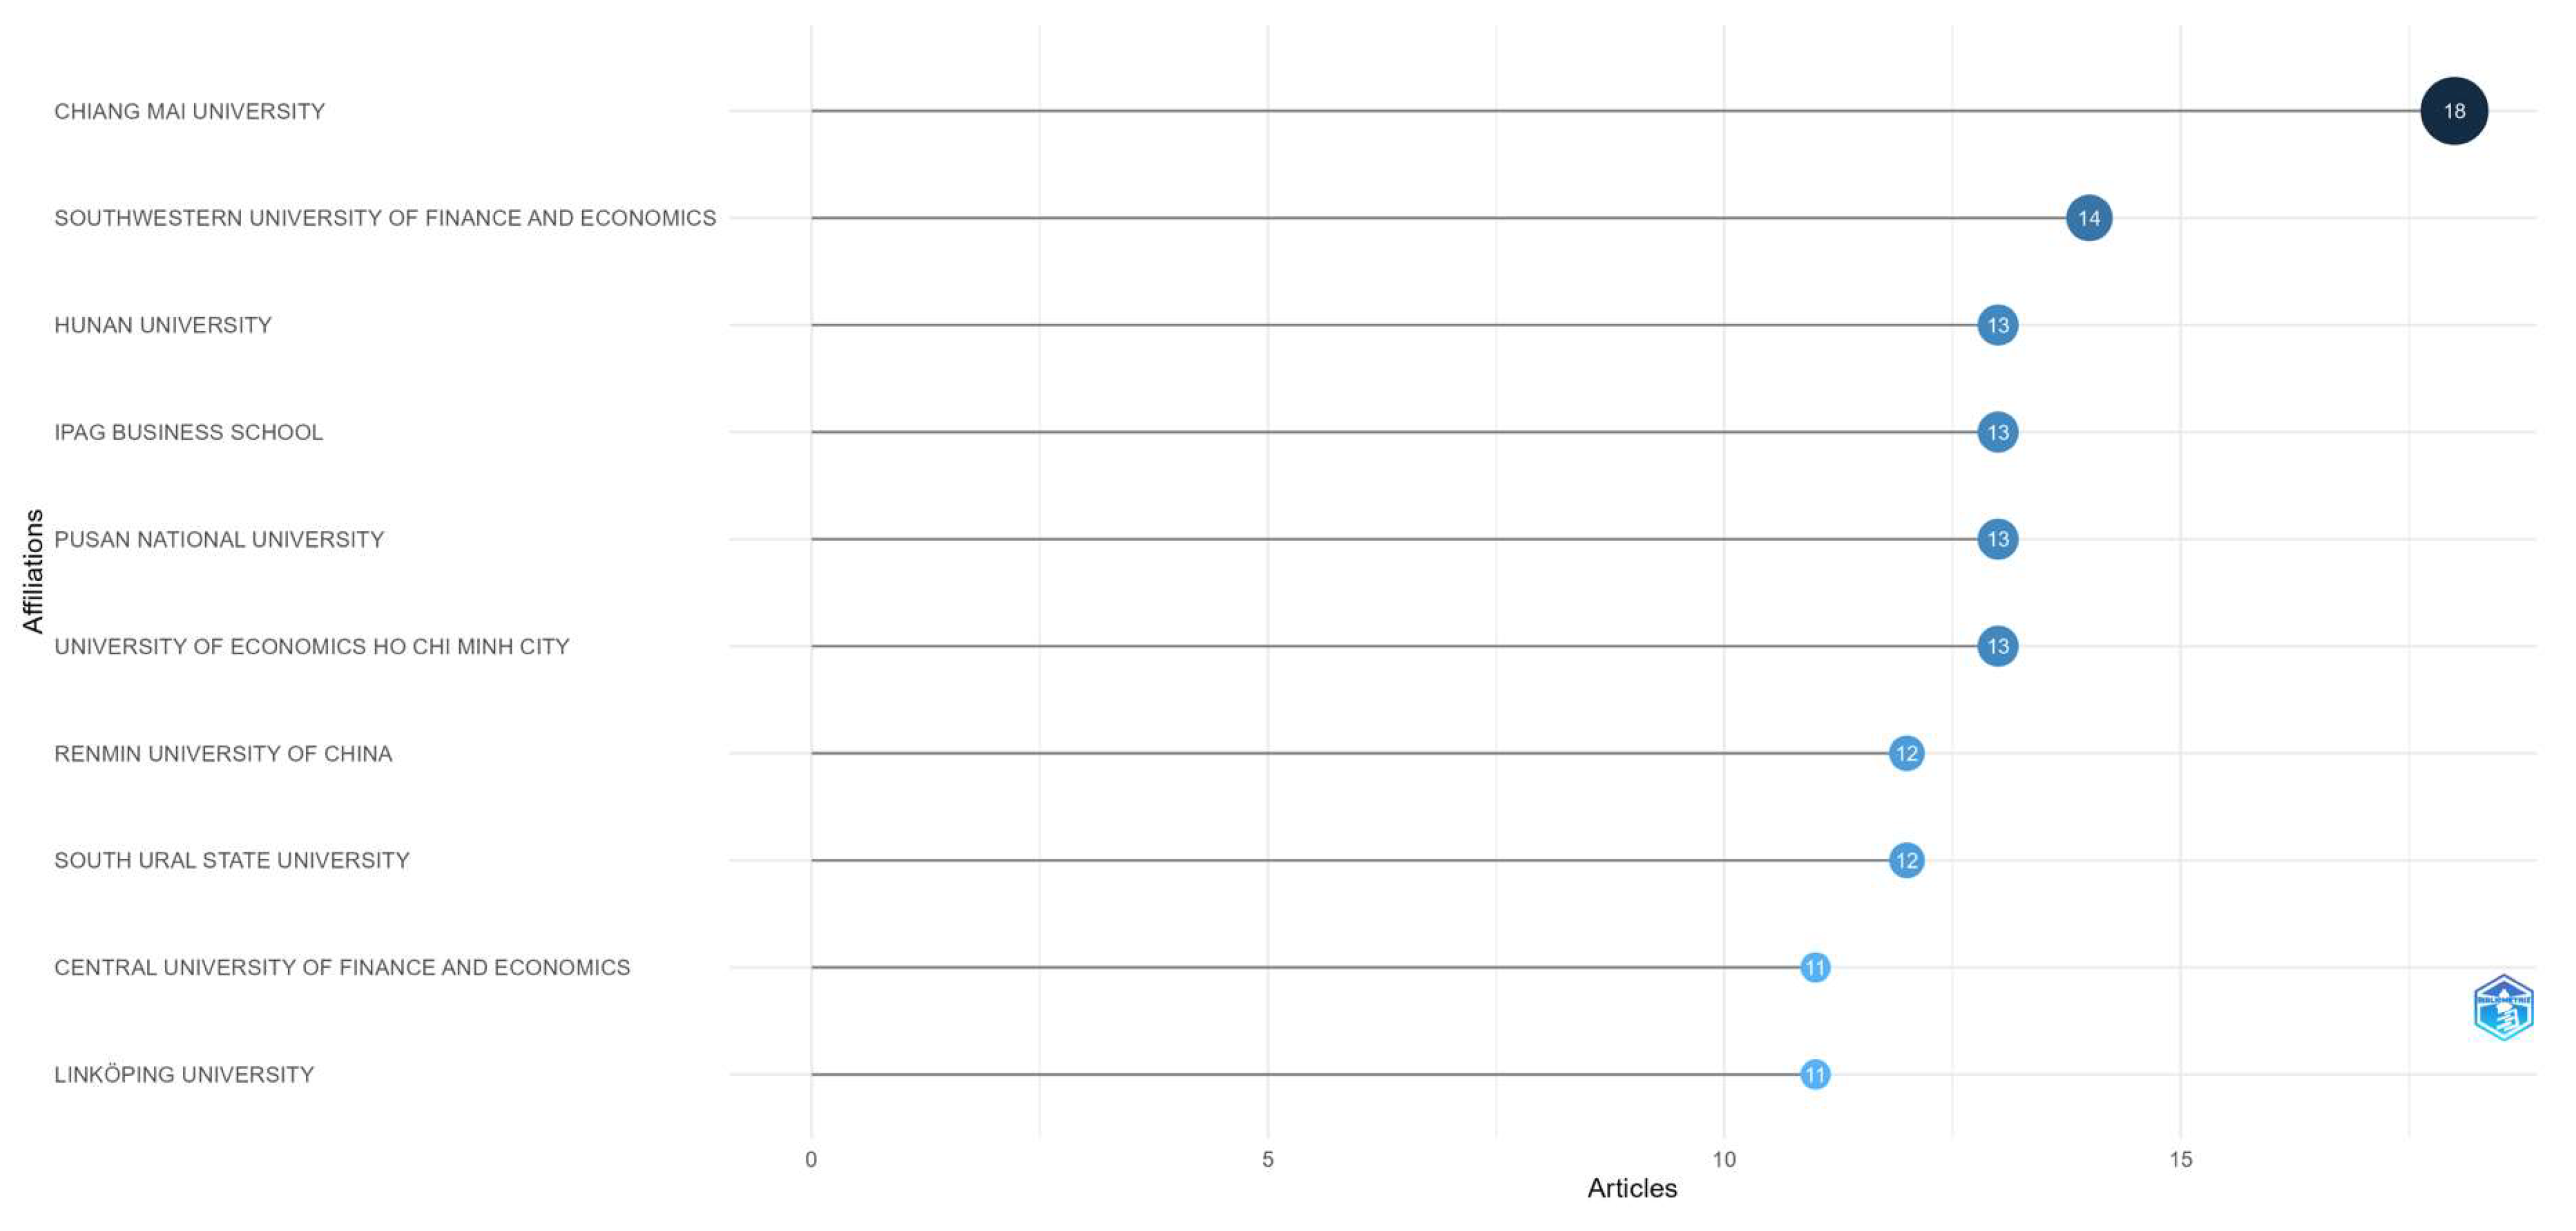
This subsection aims to present the top 10 affiliations (institutions or organizations) within our bibliometric study. Authors’ affiliations with various institutions can provide insight into the influence and expertise of these institutions in the field of commodity markets and related subjects. Analyzing affiliations is crucial for understanding academic networks and collaborations between institutions in this specific research domain. By identifying and examining the most significant affiliations, we can gain a clearer picture of the contributions of institutions and how they contribute to the advancement of knowledge in this field. The most relevant affiliations are the institutions that have contributed the highest number of articles in our bibliometric analysis. According to Figure 10, Chiang Mai University tops the list, associated with six articles in the field of commodity markets and related subjects. Following closely are Southwestern University of Finance and Economics (14 articles) and Hunan University, Ipag Business School, Pusan National University, University of Economics Ho Chi Minh City, each with 13 articles. These affiliations represent important academic centers that have had a significant impact on the scientific production related to the analyzed field.
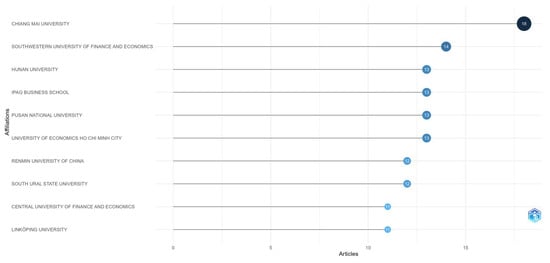
Figure 10.
Top 10 relevant affiliations by number of scientific documents published.
3.4. Countries
This section focuses on analyzing countries within our bibliometric study, examining aspects such as corresponding author’s countries, scientific production of each country, and the countries with the most citations in the field of commodity markets and related subjects. By studying the geographical distribution of scientific production and its impact, we aim to gain a comprehensive understanding of each country’s contributions to the academic literature in this field.
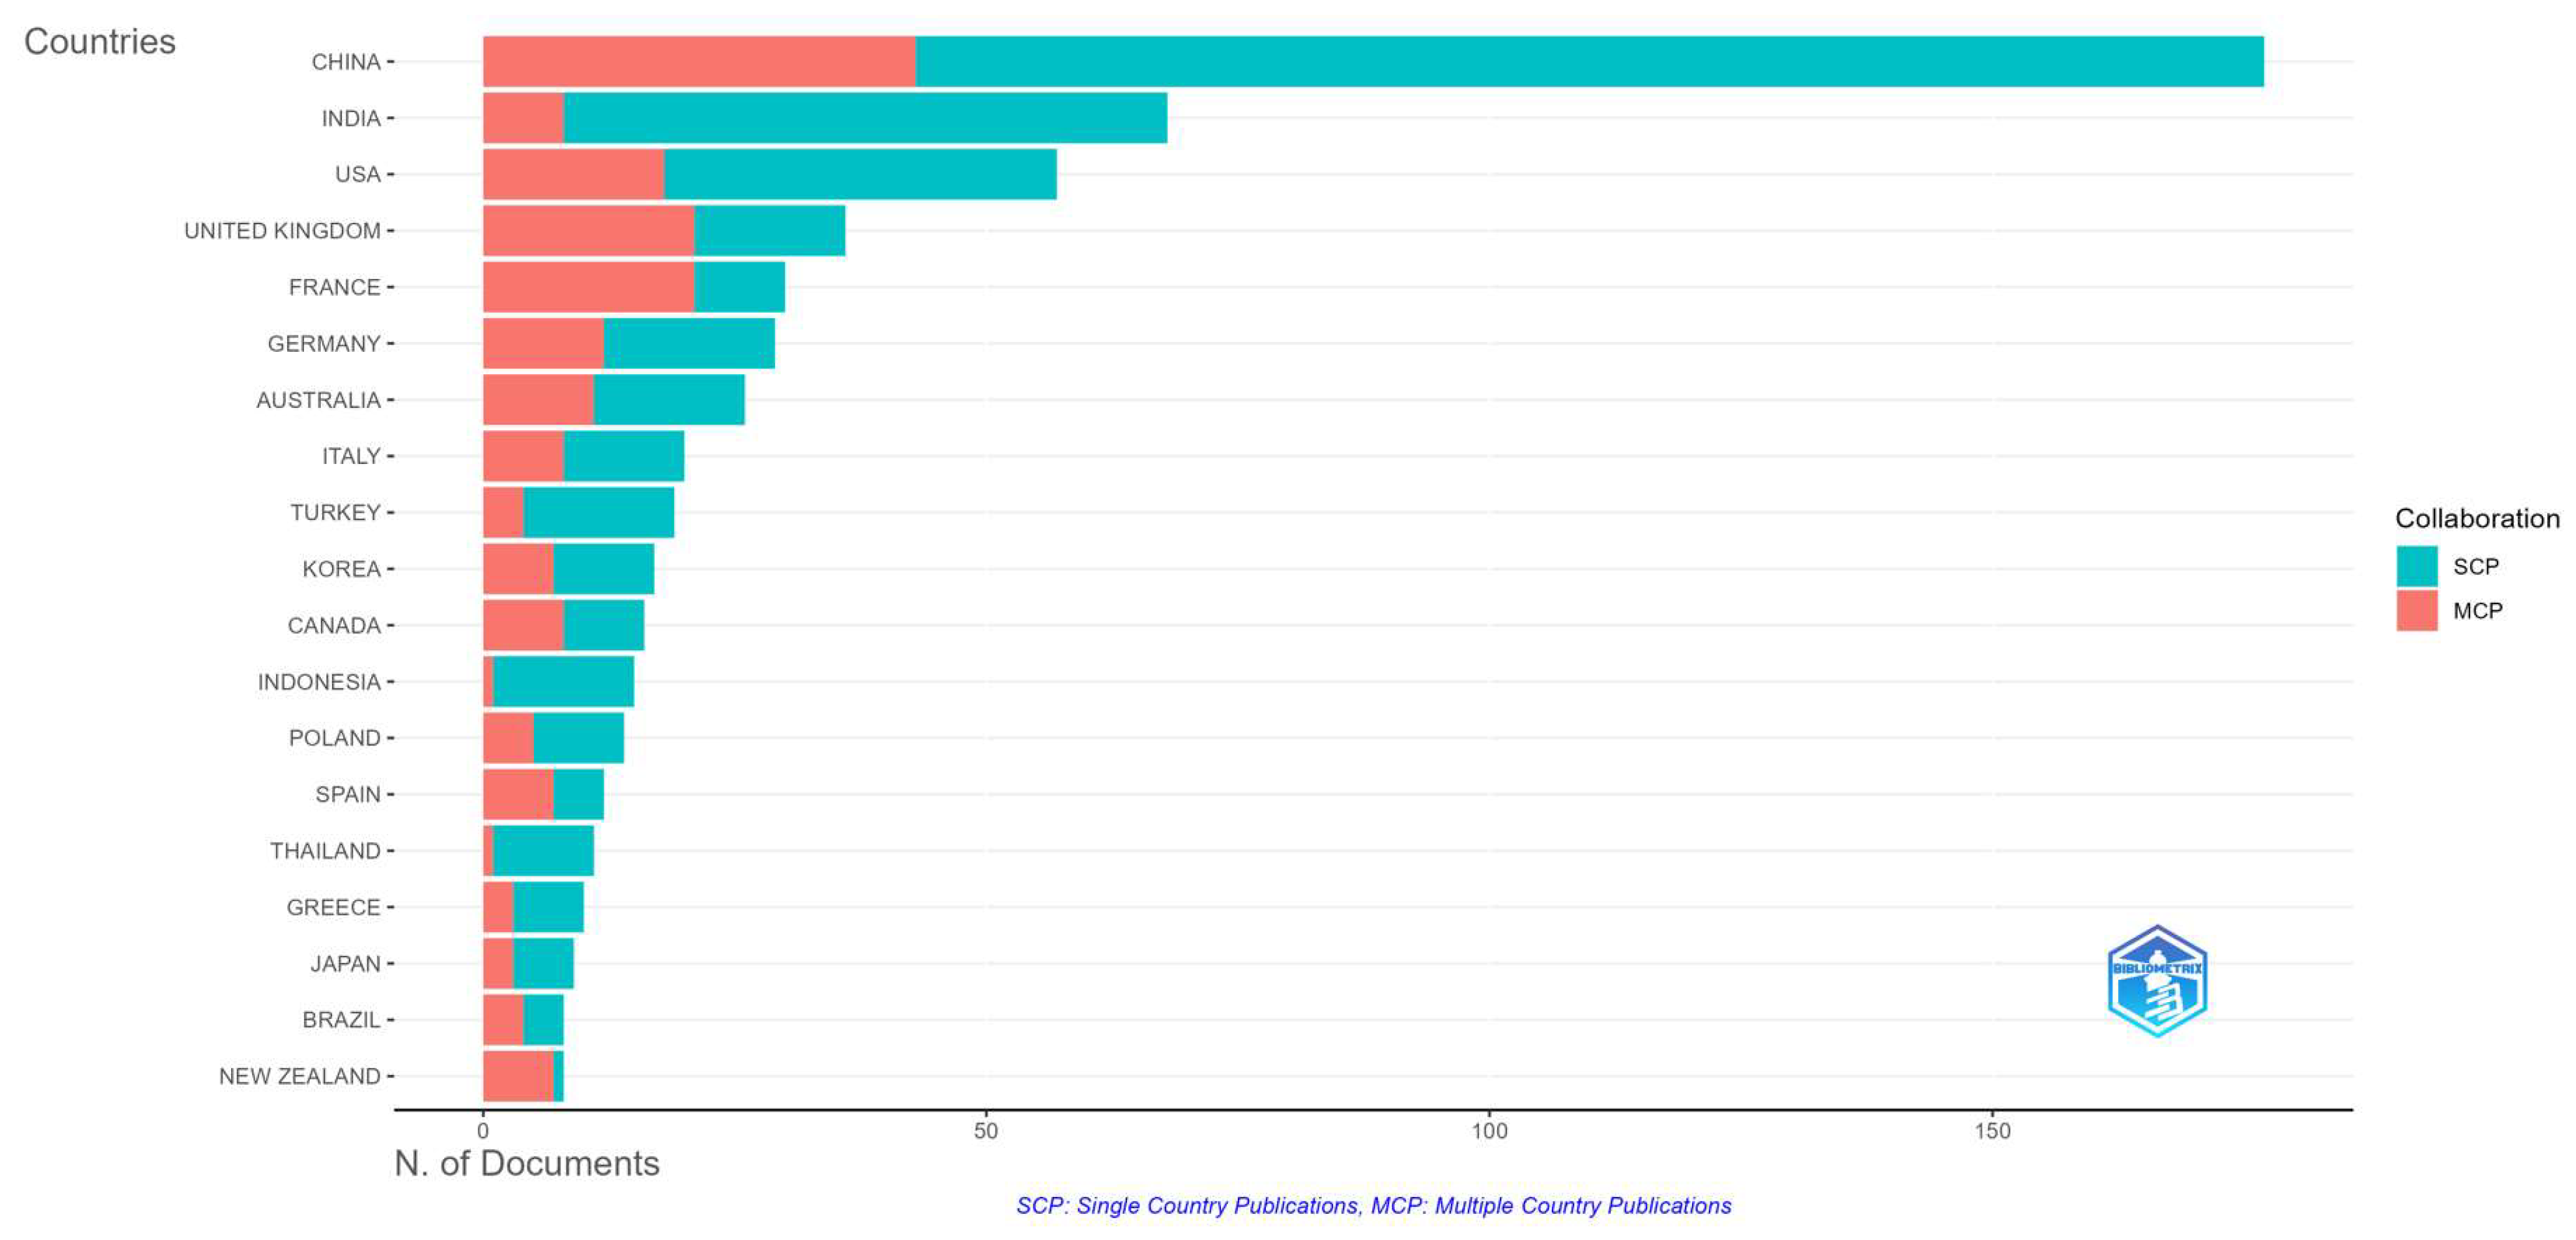
Figure 11 highlights the distribution of authors’ country correspondences in our study based on the number of articles, single-country publications (SCPs), multiple-country publications (MCPs), frequency, and MCP ratio. It is evident that China has the highest presence in publications related to commodity markets, with a significant number of articles and a relatively high frequency. Additionally, the percentage of publications in multiple countries (134 publications) suggests extensive collaboration between Chinese researchers and those from other countries in this field. The ratio of publications from China relative to other countries is 0.243. India holds a significant position in the top contributions, with a considerable number of articles published. However, the proportion of collaborations with other countries (60 publications) seems to be lower compared to other countries (0.118). Although the USA ranks lower in terms of the total number of articles published in this field, they still make a significant contribution. The high percentage of publications in multiple countries (0.316) suggests that American researchers are involved in a wide range of international collaborations in this field. The United Kingdom has a relatively small number of articles published compared to other countries, but the high percentage of publications in multiple countries (0.583) indicates significant involvement in international collaborations. In Table 2, one can observe the calculated values for the top 10 countries from Figure 10 for single-country publications (SCPs), multiple-country publications (MCPs), and the multiple-country publication ratio (MCP ratio).

Figure 11.
Corresponding author’s countries.
The multiple-country publication (MCP) ratio in Table 3 is calculated according to Equation (1):
Table 3.
Contributions of top 10 countries to commodity market research.
Figure 12 provides an overview of the scientific production across various regions, presenting the frequency of publications from each country. The more intense the blue color, the higher it indicates the number of articles published in that respective country. For instance, China stands out as the most prolific contributor with 460 publications, followed by the USA with 199 publications and India with 188 publications. Notably, the UK and France also exhibit substantial scientific output, each contributing over 90 publications. This distribution underscores the global engagement and diverse involvement of different countries in commodity market research. Moreover, it reflects the widespread interest and participation in this field across diverse regions worldwide.
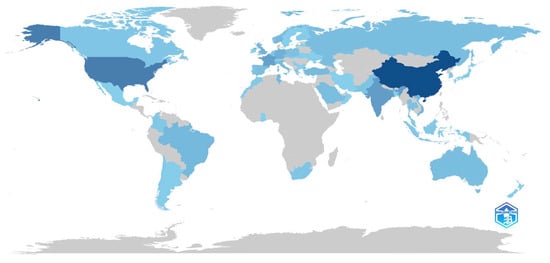
Figure 12.
Countries’ scientific production.
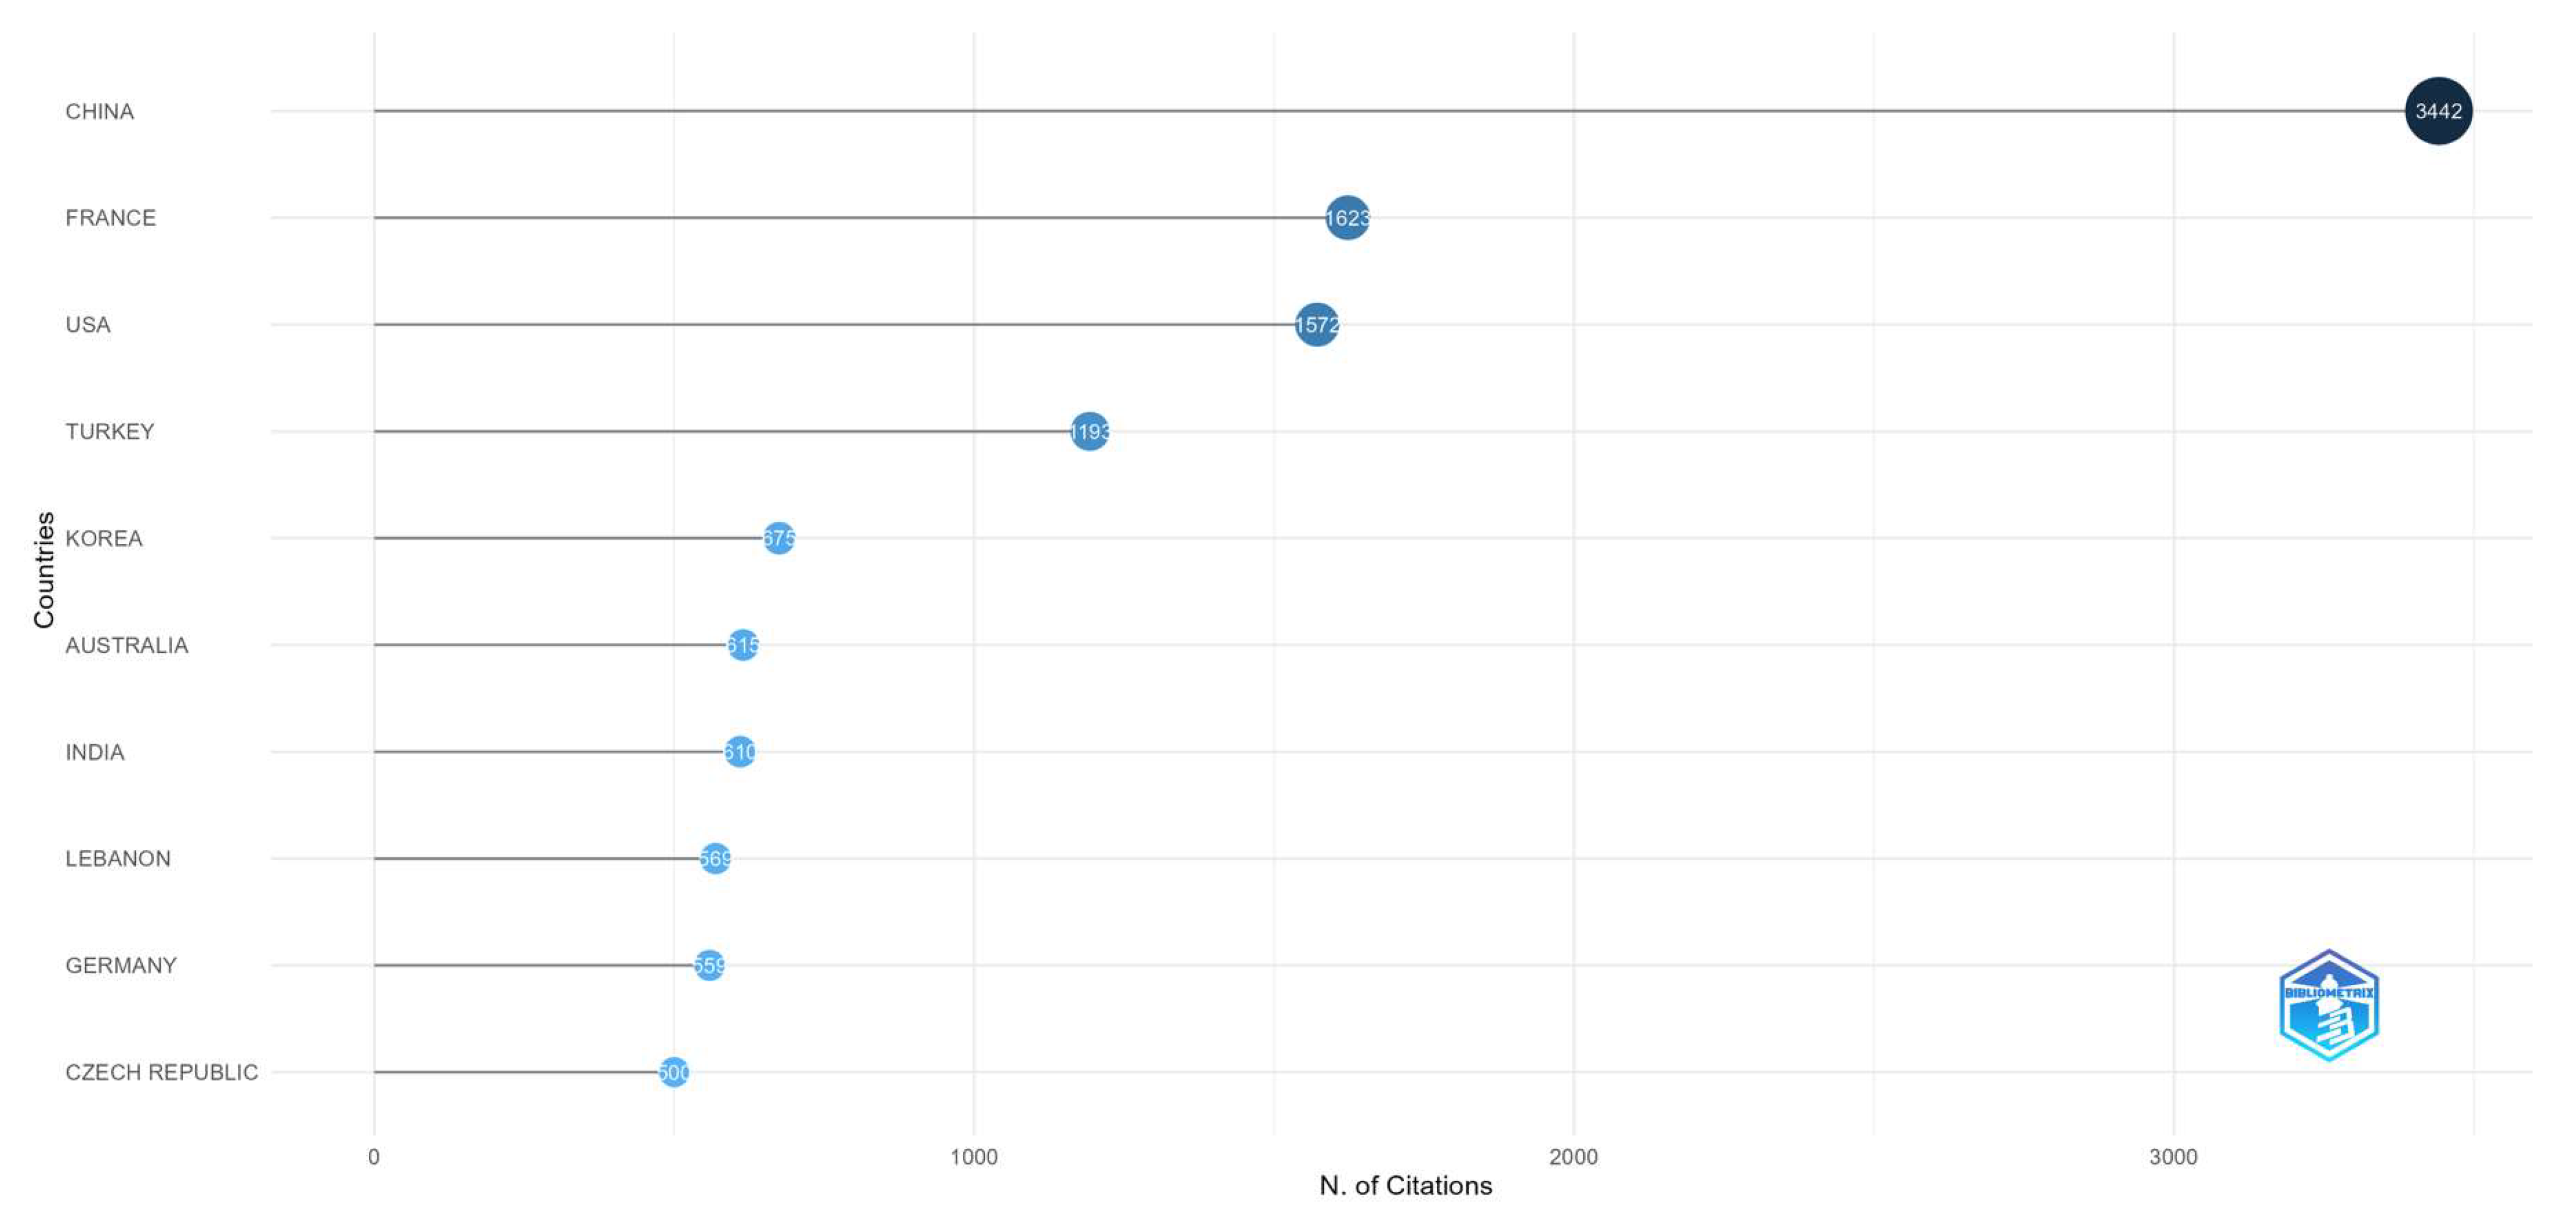
Figure 13 presents the 10 most cited countries in the domain we analyzed. We observe that China leads with 3442 citations, followed by France with 1623 citations and the USA with 1572 citations. Turkey ranks fourth, with 1193 citations, while South Korea is fifth with 675 citations. Australia is in sixth place with 615 citations, and India occupies seventh place with 610 citations. Lebanon is eighth with 569 citations, and Germany (559 citations) and the Czech Republic (500 citations) complete the top.
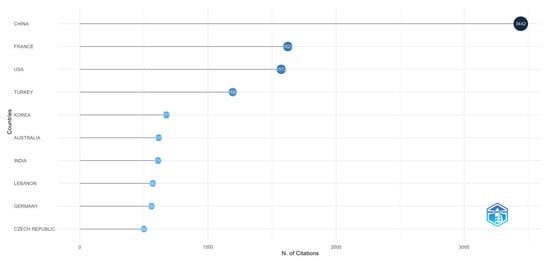
Figure 13.
Top 10 cited countries.
3.5. Document Analysis
This section focuses on analyzing documents, representing a crucial part of our bibliometric study. The aim is to investigate the most globally cited documents the context of commodity markets and related subjects. By examining these documents, we will be able to identify the works with the greatest impact in the field and better understand their contribution to academic literature. Analyzing globally cited documents will provide us with a comprehensive perspective on the main research directions and their influence in the field of commodity markets.
Table 4 presents the most globally cited documents, providing an in-depth understanding of the literature relevant to my analysis. The qualitative analysis conducted in Table 4 for the 10 most cited scientific papers addresses various aspects of the relationship between different commodity markets and their dynamics. By applying advanced statistical models and methodologies, the authors uncover significant findings regarding price transmission, volatility effects, and market movements. Among the prolific models applied in these studies, there is a notable emphasis on econometric models such as those specific to GARCH methodology. These perspectives provide valuable insights for investors, decision-makers, and researchers, offering new perspectives on portfolio diversification, risk management, and understanding interconnectedness within commodity markets. These works provide a comprehensive perspective on the dynamics and interactions among different asset classes, thus providing a solid framework for understanding the complexity of commodity markets in the context of our bibliometric study.
Table 4.
Highly cited documents worldwide.
3.6. Mixed-Methods Analysis
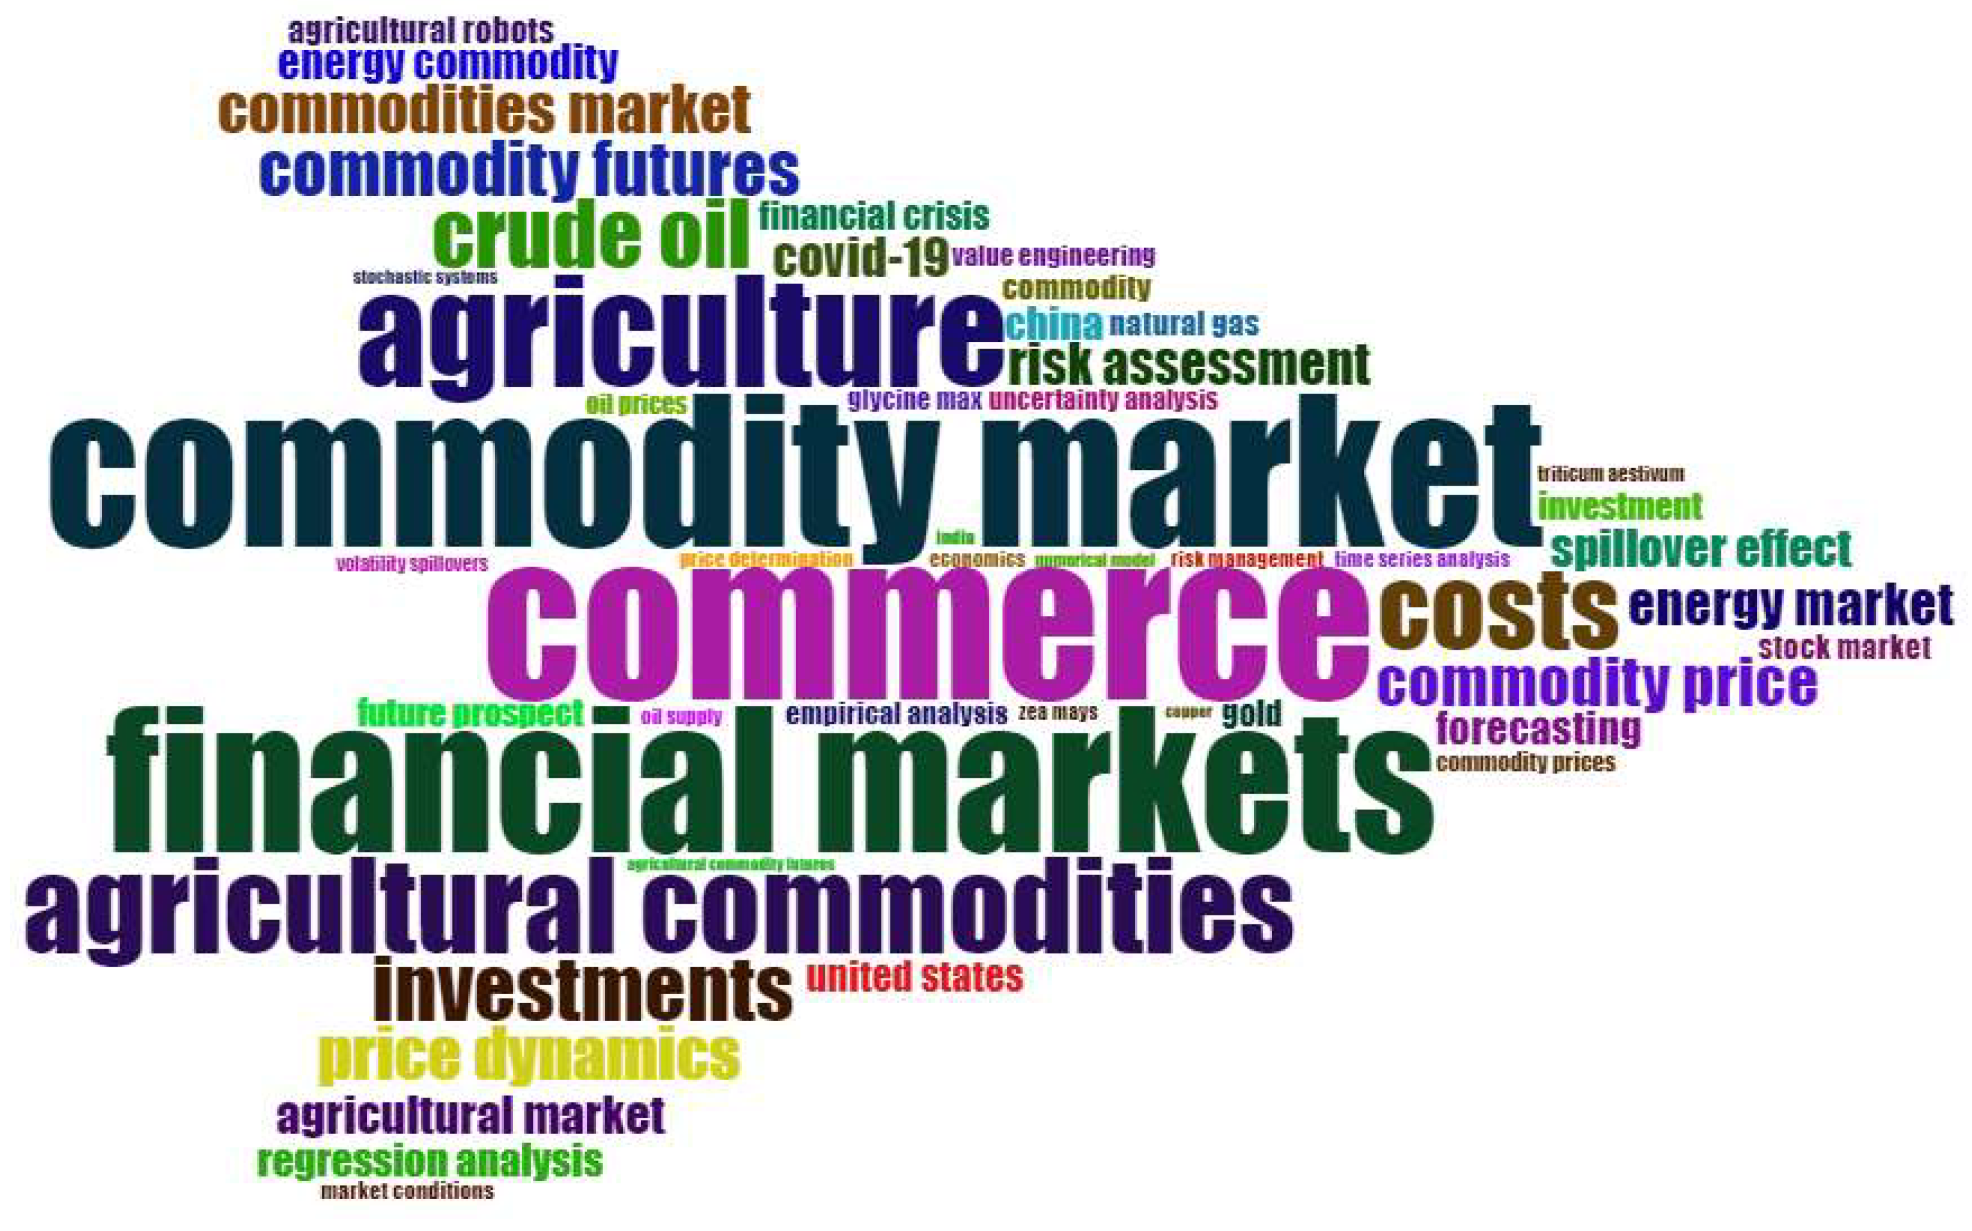
Figure 14 provides a visual representation of the most frequent KeyWords Plus. The WordCloud generated based on KeyWords Plus from our research highlights several key aspects related to the analyzed topic. Terms such as “commodity market”, “agriculture”, “crude oil”, “energy market”, “commodity futures”, and “commodity price” indicate a significant focus on analyzing commodity markets, particularly in relation to the agricultural and energy sectors. This suggests that the research focuses on understanding the dynamics of prices and associated risks in these markets, including contagion effects and volatility. Additionally, terms such as “financial markets”, “risk assessment”, “forecasting”, “investment”, and “financial crisis” indicate a concern for the economic and financial context in which these analyses take place, including risk management and evaluating the future outlook of commodity markets. Entries such as “COVID-19” also show an awareness of the impact of contemporary events on these markets. Overall, the WordCloud emphasizes the diversity and complexity of the analyzed topics in the research, addressing essential aspects of commodity markets and their economic and financial environment.

Figure 14.
WordCloud (KeyWords Plus).
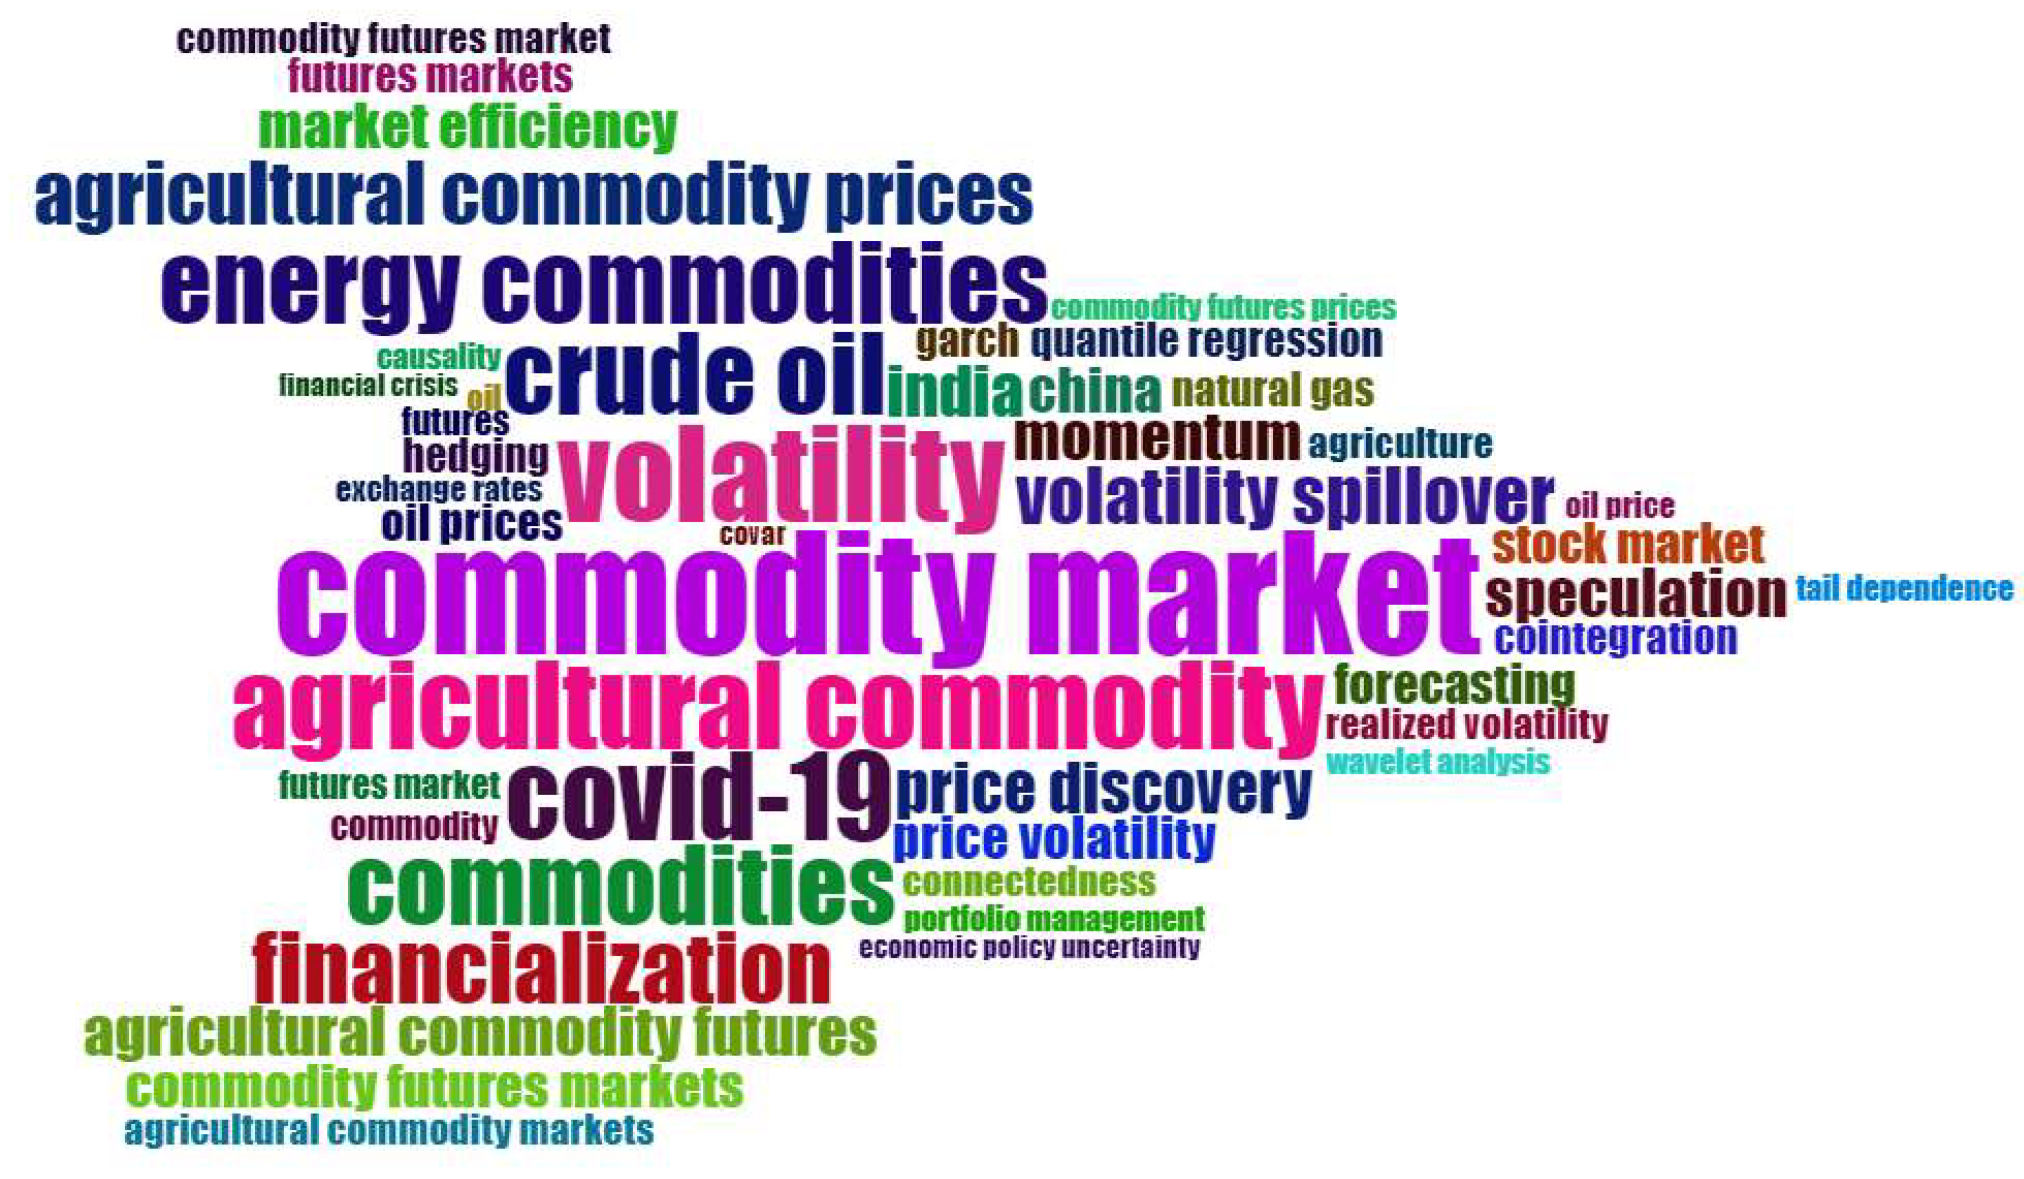
The WordCloud based on authors’ keywords from Figure 15 provides an in-depth insight into the topics of interest in the field of commodity research. Terms such as “commodity markets”, “agricultural commodities”, “volatility”, “crude oil”, “energy”, “COVID-19”, “financialization”, and “speculation” are among the most frequently encountered. These keywords suggest a concern for analyzing commodity markets, including price dynamics, volatility, contagion effects, and other aspects relevant to understanding and managing these markets. Additionally, concepts such as “portfolio management”, “causality”, “forecasting”, and “financial crisis” are highlighted, indicating a comprehensive and interdisciplinary approach in the research. These authors’ keywords indicate a focus on financial instruments and the structure and behavior of commodity markets in general. Additionally, the key term “agricultural commodities” underscores the emphasis on the agricultural segment of commodity markets, with concerns related to production, trade, and prices. Furthermore, researchers show interest in analyzing price fluctuations and associated risks in commodity markets, as well as in aspects related to the financialization of commodity markets and speculative behavior. The appearance of the keyword “COVID-19” reflects awareness of the pandemic’s impact on commodity markets and its potential effects on scientific research in the field of commodities.
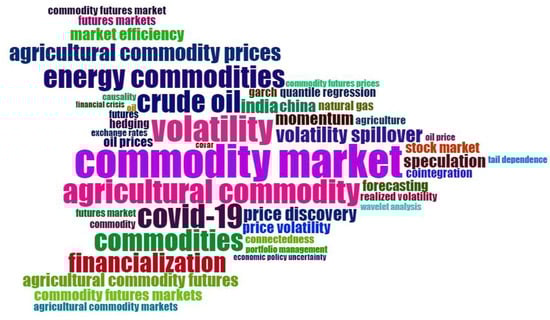
Figure 15.
WordCloud (authors’ keywords).
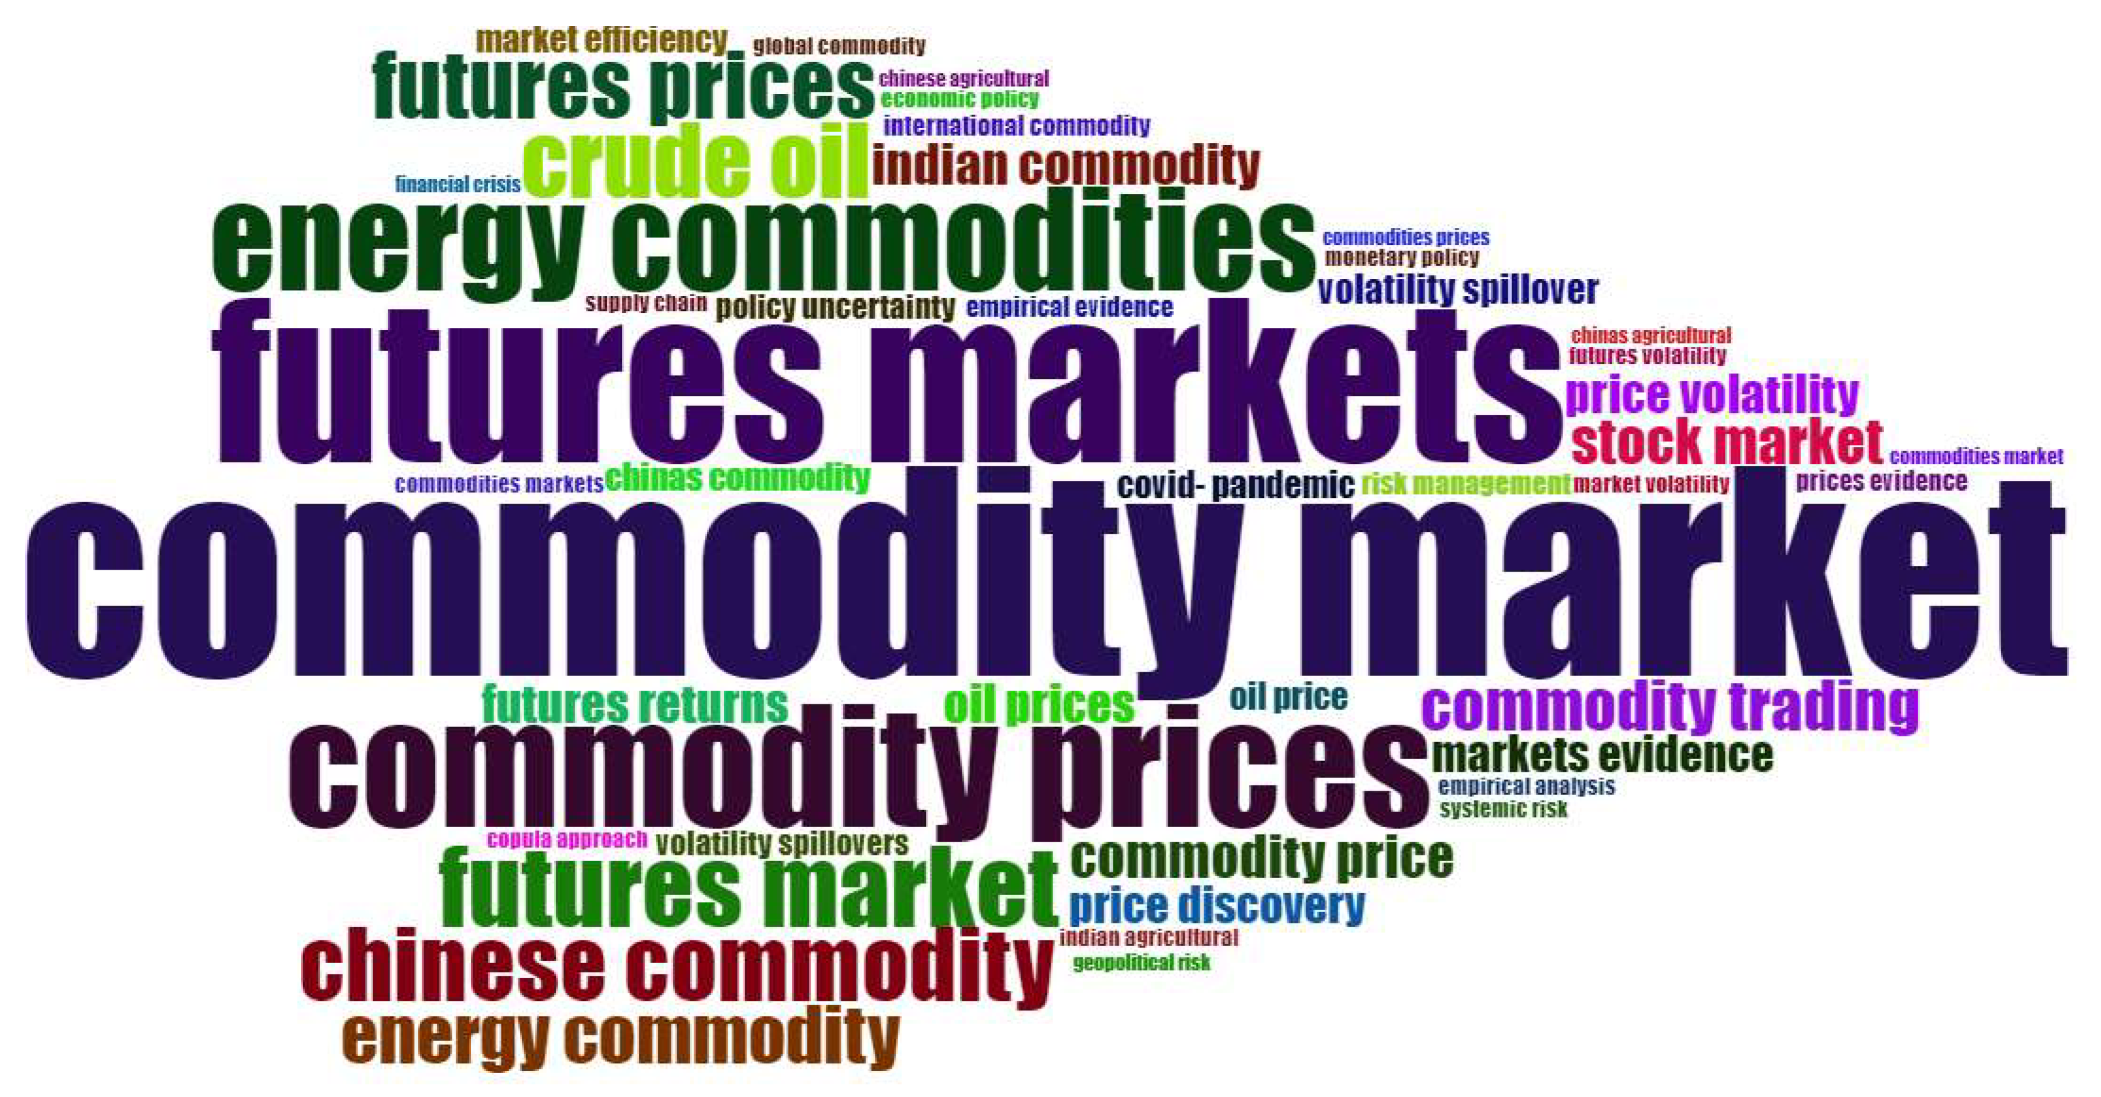
The WordCloud based on the bigrams from Figure 16 reveals some of the most frequent word associations used in the research. These bigrams include terms such as “commodity futures”, “commodity markets”, “agricultural commodities”, “crude oil”, “commodities markets”, “energy commodities”, and “agricultural commodities”. Additionally, highlighted are associations between “COVID-19” and “pandemic”, reflecting interest in the pandemic’s impact on commodity markets and related research. Furthermore, the bigrams indicate a concern for aspects related to price volatility, risk management, market efficiency, and price discovery. These word associations reflect the diversity and complexity of the topics addressed in the research within the field of commodity markets. Additionally, terms such as “copula approach”, “volatility spillovers”, “empirical analysis”, and “systemic risk” reflect specific concerns and methodological approaches used in research on commodity markets. The copula approach [37] refers to a statistical method used to model dependence between random variables. In our context, this approach can be employed to investigate the complex relationships and interdependencies between commodity prices and other influencing factors. Empirical analysis indicates the use of observed or empirical data to test hypotheses and models proposed in the research. This empirical analysis [38] can aid in understanding the actual behavior of commodity markets and evaluating the effectiveness of various strategies and policies.

Figure 16.
WordCloud (bigrams titles).
In order to analyze the relationships between terms or concepts in a set of textual data, the co-occurrence network in Figure 17 was created. Our network indicates two distinct clusters, each having its own dominant theme. Cluster 1 appears to be associated with specific aspects of agricultural commodity markets and economic models. Terms such as “agriculture”, “agricultural commodities”, “commodity price”, “agricultural market”, and “commodity prices” are most influential in this cluster. This suggests that this part of the network is oriented towards the analysis and discussion of issues related to the agricultural sector and commodity price dynamics. On the other hand, Cluster 2 seems to focus on more general aspects of financial and economic markets. Terms such as “commerce”, “financial markets”, “commodity market”, “investments”, and “commodities market” dominate here. This cluster suggests that this part of the network is oriented towards discussions about global financial markets, including commodity trading, investments, and associated risks. In both clusters, there are also terms that transcend the specific boundaries of domains, such as “COVID-19” and “financial crisis”, indicating an awareness of the impact of external events on markets and research in the commodities and finance domains.
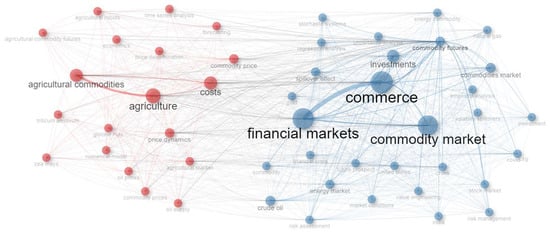
Figure 17.
Co-occurrence networks.
The thematic map in Figure 18 provides a visual representation of the relationships between various concepts or key terms within a research domain. This helps in understanding how the concepts are interconnected and how they fit into broader or more specialized themes. It can be observed that 14 clusters have been formed placed in four quadrants: emerging or declining themes, niche themes, motor themes, and basic themes. The niche themes quadrant is characterized by high density, indicating intense development of themes, and low centrality, suggesting that these themes are not central to the analysis. Four clusters have formed in this quadrant. The cluster associated with “finance” indicates interest in financial aspects in analyzing commodity markets. The cluster related to technologies such as “deep learning” and “neural networks” suggests the use of these technologies in analyzing and modeling commodity markets. The cluster concerning “futures price” and “spot price” indicates concern for the evolution of prices over time and for the differences between futures and spot prices. The cluster addressing “climate change”, “globalization”, and “commodity trading” indicates interest in socioeconomic and geopolitical factors that can influence commodity markets.
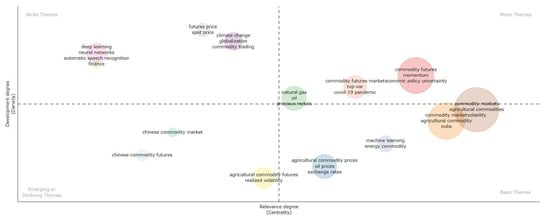
Figure 18.
Thematic map.
Clusters in the emerging or declining themes quadrant are characterized by lower development of these themes in scientific publications and do not suggest high relevance. Three clusters in this quadrant are justified by their niche focus on a single market, namely, “Chinese commodity market” and “Chinese commodity futures”.
In the basic themes quadrant, four clusters can be identified. This quadrant has low density but high centrality, suggesting that the themes are important but not central to the study. The cluster focusing on “agricultural commodity prices”, “oil prices”, and “exchange rates” reflects the importance of these fundamental topics in analyzing commodity markets. The cluster related to “machine learning” and “energy commodities” indicates interest in using advanced technologies in analyzing energy commodities. The cluster discussing “commodity markets”, “agricultural commodities”, and “India” suggests interest in trade relations and India’s influence on commodity markets. The cluster focusing on “commodity markets”, “agricultural commodities”, and “volatility” reflects concern for price dynamics and associated risks in these markets.
The motor themes quadrant indicates that the themes here are important and of interest to researchers. The cluster addressing “natural gas”, “oil”, and “precious metals” indicates the importance of these commodities in the economy and investments. The cluster related to “commodity futures market”, time-varying variance analysis (“tvp-var”), and the “COVID-19 pandemic “suggests interest in the evolution of futures markets and the impact of current events on them. The cluster discussing the “future of commodities”, “momentum”, and “uncertainty in economic policies” indicates interest in future prospects for markets, growth trends, and risks associated with global economic policies.
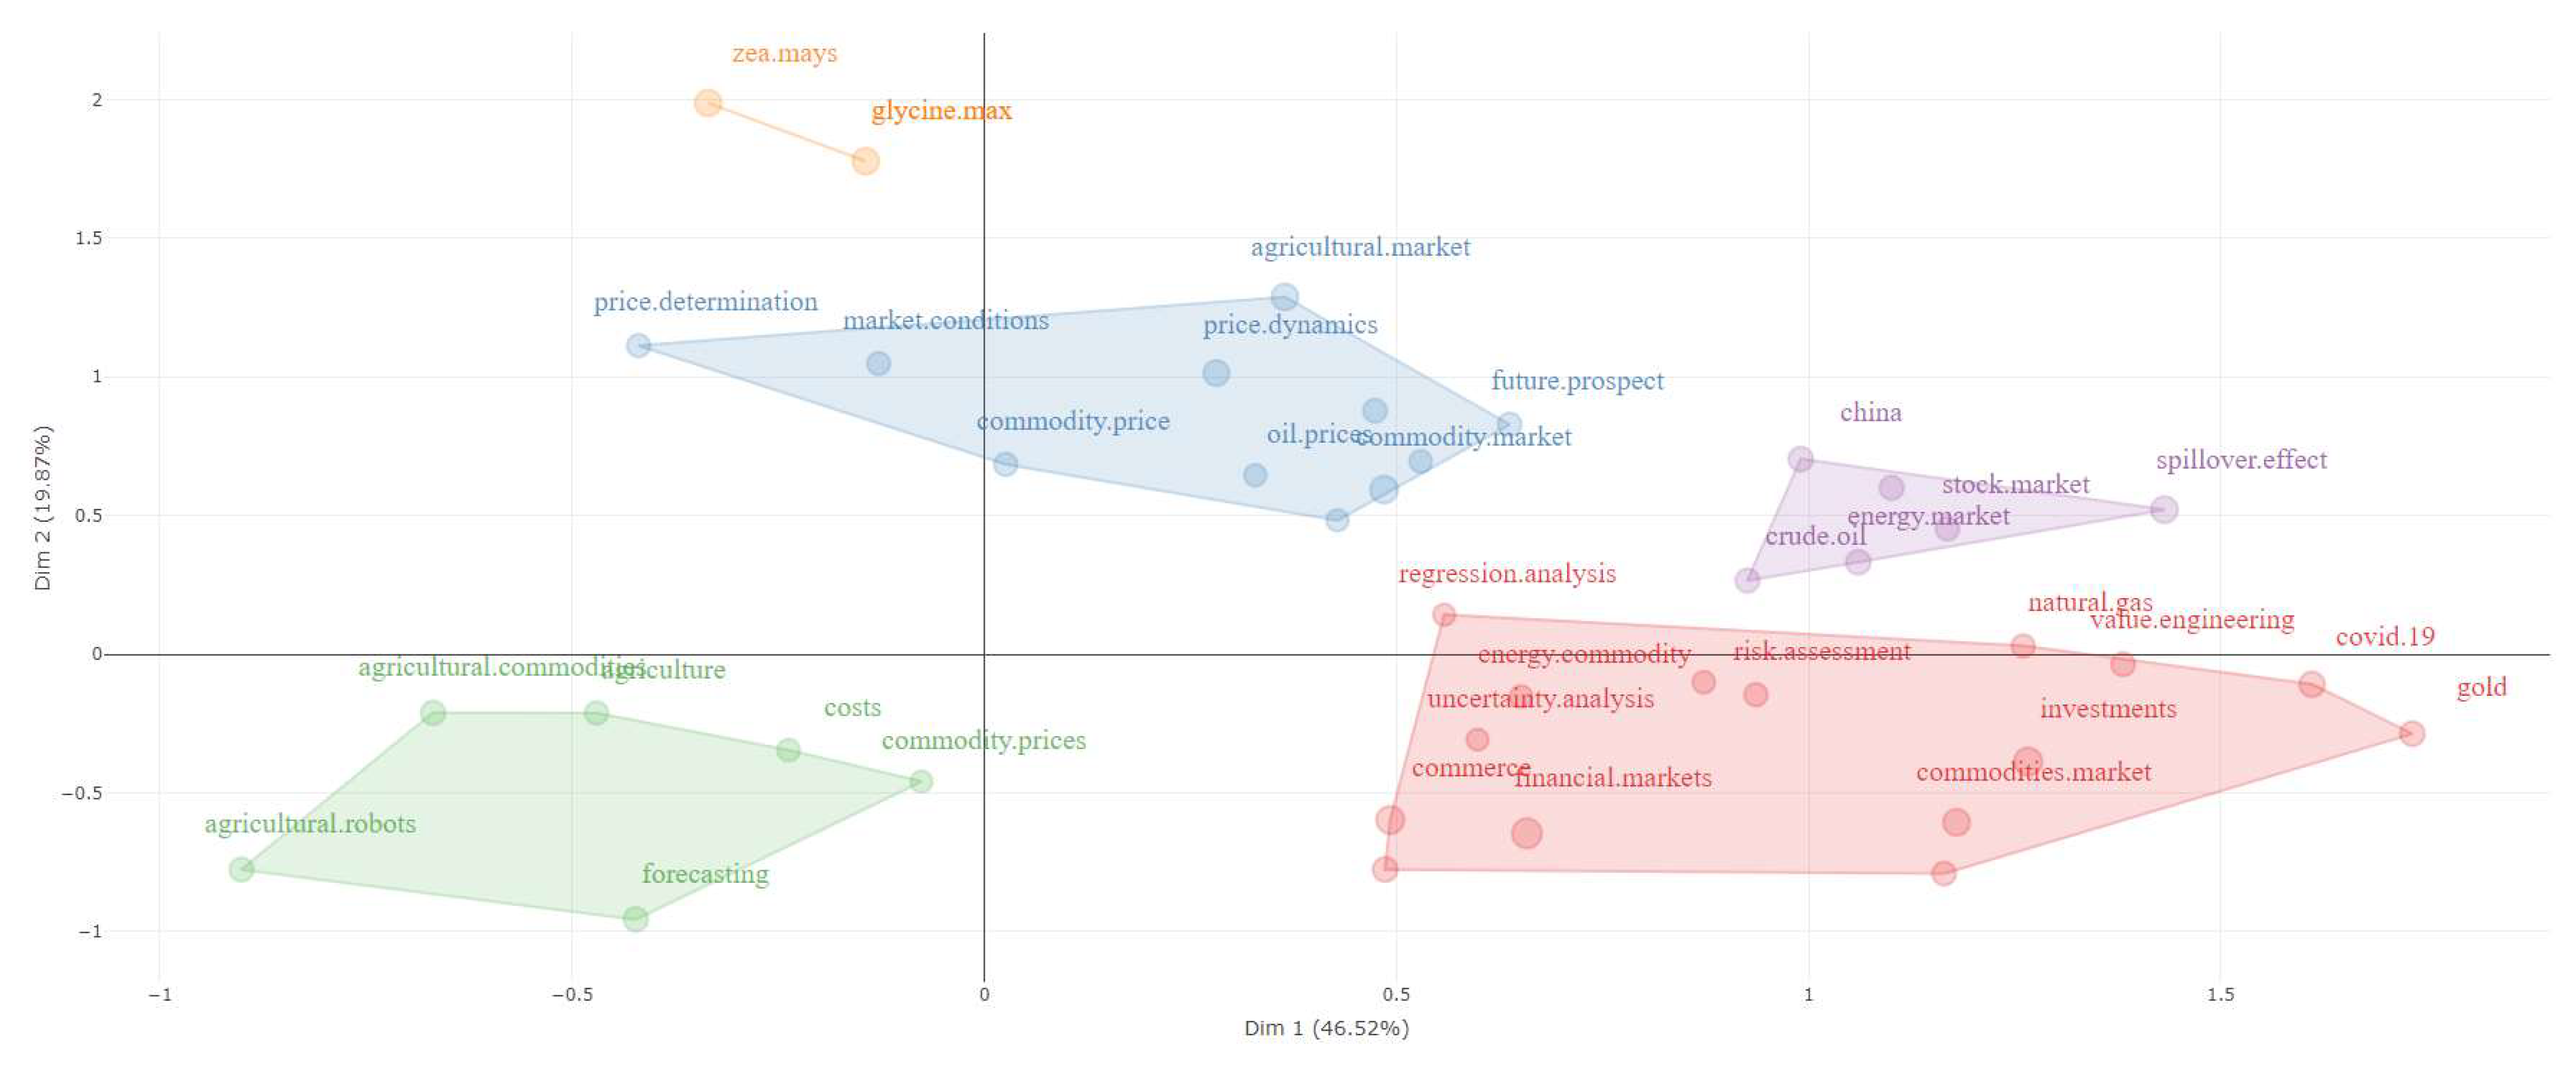
In Figure 19, factorial analysis of KeyWords Plus was conducted. Factorial analysis is a technique used to understand the hidden structure of relationships among different observed variables [39]. In this case, we have two main dimensions (Dim. 1 and Dim. 2) that were identified through the factorial analysis of the data. Dimension 1 (Dim. 1) indicates the degree of association between variables that lie in the same direction in the factorial space. Variables with high factorial loadings on this dimension are considered to have a strong association or to be correlated with each other. This dimension is relevant, as it can identify patterns or underlying structures in our data. Dimension 2 (Dim. 2) represents the additional variability of the data that is not explained by the primary dimension (Dim. 1). Variables with high factorial loadings on this dimension can be considered to have a different or distinct behavior compared to those on Dim. 1. Together, these two dimensions allow for a more comprehensive understanding of the structure and relationships within the analyzed dataset, contributing to the identification of important patterns and trends. It is observed that the variables are grouped into five main clusters. A first analyzed cluster (purple) is the one with high factorial loadings on Dimension 1 and Dimension 2, indicating a strong association between the variables in this group and significant variability in both directions of the factorial space. Concepts in this cluster, such as “finance”, “investments”, “COVID-19”, and “gold”, are considered to be strongly correlated and may exhibit distinct patterns or behaviors. Another cluster (blue) with high factorial loadings on Dimension 1 but lower loadings on Dimension 2 suggests a strong association between variables in a single direction of the factorial space. This indicates that variables in this cluster, such as “commodity market”, “price dynamics”, and “commodity price”, are closely correlated, but exhibit less variability compared to those in the previously described cluster (purple). The factorial loadings of variables in the third cluster (green) are low on both dimensions, suggesting a weaker association between variables and lower variability in the data. This cluster includes variables such as “agriculture”, “forecasting”, and “agricultural robots”. Variables in the fourth cluster (red) have high factorial loadings on Dimension 1 but lower loadings on Dimension 2, indicating a strong association in one direction of the factorial space and less variability in the other direction. Included in this cluster are variables such as “crude oil”, “energy market”, and “investment”. The fifth cluster (orange) has high factorial loadings on Dimension 2 but lower loadings on Dimension 1, indicating a stronger association in another direction of the factorial space. Variables in this cluster, such as “glycine max” and “zea mays”, exhibit a different or distinct behavior from the other clusters.

Figure 19.
Factorial analysis.
4. Discussion
Following the comprehensive bibliometric analysis presented in this study, a profound understanding of the scientific landscape related to commodity markets and related topics emerges. The results obtained from the various analyses conducted, such as source analysis, author analysis, research analysis, keyword analysis, as well as mixed analysis including the creation of co-occurrence networks, thematic maps, factorial analysis, collaboration networks, and country collaboration world maps, provide a detailed picture of the evolution and interactions in the literature. We observe that over the analyzed period, between 1974 and 2023, interest in research in the field of commodities has been constant and increasing, with an average annual growth rate of 10.46%. This indicates a significant expansion of research in the field of commodities over the years, reflecting growing interest in the subject of commodity markets. International collaboration is evident, with 31.10% of documents having international co-authors, highlighting the global nature of research in this field.
Our study was based on testing four research questions. Regarding RQ1, our analysis revealed that factors such as technological innovation, climate change, and geopolitical instability have had a significant impact on the commodity market in recent years, directly influencing price dynamics and risk management strategies. We observed that technological advancements, such as blockchain technologies and artificial intelligence, have introduced new ways of trading and managing risks in commodity markets. Our analysis indicated a growing interest in advanced technologies in commodity market analysis, with a particular emphasis on their use in anticipating and managing associated risks. Our data highlighted that climate change has had a significant impact on the agricultural commodity market, leading to significant fluctuations in production and prices. There is a growing concern in research about how climate change affects the supply and demand of commodities, and these variables are integrated into risk management strategies.
From the perspective of RQ2, the results show that there is a significant increase in scientific production in the field of commodity markets in the years following the COVID-19 pandemic. This suggests that the pandemic has had a significant impact on the interest and attention given to this field. Therefore, it is likely that the COVID-19 pandemic has influenced various sectors of the commodity market, and detailed results of future analyses could provide more precise information on how these sectors have reacted to the challenges posed by the pandemic.
Furthermore, regarding RQ3, our analysis indicates that there is a variety of concepts and terms related to cointegration, as well as speculation effects, in the specialized literature. This suggests that these phenomena have been topics of interest and research in the field of commodity markets. Therefore, it is likely that they have played a significant role in the behavior and evolution of the commodity market in recent years.
RQ4 was formulated to analyze effective strategies and policies for managing risks in the face of market volatility in the current era.
Our study highlights several phenomena related to the commodity market. For example, there is a significant focus in the research on the analysis of agricultural commodities and the financial market, as evidenced by the co-occurrence network analysis, which emphasizes these topics where two clusters have formed along these two directions. Furthermore, our results make significant contributions in highlighting emerging technologies used in commodity market analysis. We observed that artificial intelligence and machine learning techniques represent niche topics, alongside traditional approaches that utilize econometric techniques. Practically, this result suggests that researchers and practitioners are trying to explore new methods and technologies to improve the understanding and analysis of the dynamics of the commodity market.
Also, our results show that there is significant interest in risk management in the specialized literature related to commodity markets. Additionally, topics related to volatility and the economic impact of commodity markets are highlighted. Therefore, it is likely that there are various strategies and policies that have been discussed and proposed for managing risk in the face of market volatility. A detailed study of these strategies and policies could provide important guidance for adopting effective approaches to risk management in the current era.
5. Conclusions
Our bibliometric study provides a comprehensive perspective on the dynamics and trends in the field of commodity markets and can serve as a basis for guiding future research and the development of policies and strategies in this domain. Summarizing the obtained results, we observed a significant diversity of sources used in commodity market research, indicating a multi-perspective approach to the subject. Additionally, journals such as Energy Economics, Resources Policy, and the Journal of Futures Markets are identified as the most relevant sources in the field under study, suggesting that these publications have played a central role in the development of specialized literature. Furthermore, the application of Bradford’s law highlights the importance of a limited number of journals in making a major contribution to specialized literature in commodity markets. Regarding the analysis of main authors and collaborations among them, our results underline the interdisciplinary nature of research in commodity markets. Institutions such as Chiang Mai University, Southwestern University of Finance and Economics, and Hunan University stand out as among the most relevant in the field studied, as well as being the most prolific in scientific production related to commodity markets, suggesting a significant contribution to scientific production in this domain. The affiliation of higher-education institutions and organizations from different regions highlights the global nature of research in commodity markets and the expansion of international collaborations. Identifying key terms and dominant concepts in specialized literature emphasizes the major concerns and trends in commodity markets. We observed that keywords such as “volatility spillover”, “energy commodity”, “speculation”, and “co-integration” are recurrent, reflecting key foci of interest and research in this field. The use of various analytical techniques, such as creating co-occurrence networks, factorial analysis, and thematic maps, has provided a deeper understanding of relationships and structures in the specialized literature. Identifying thematic clusters and connections between concepts has revealed emerging directions and research interests in commodity markets. Our study may have potential limitations. For example, restricting the analysis to certain databases or sources of information could influence the representativeness of the results. Another limitation could be the analysis being conducted solely on articles and scientific publications from the Scopus database. Other materials such as books may be equally important, but they are not included in Scopus. Future research directions include expanding the analysis to explore newer or more specific directions in commodity markets, such as the impact of emerging technologies or economic policies.
Author Contributions
Conceptualization, I.N. and N.C.; methodology, I.N.; software, I.N.; validation, I.N. and N.C.; formal analysis, I.N. and N.C.; investigation, I.N.; resources, I.N.; data curation, I.N.; writing—original draft preparation, I.N.; writing—review and editing, I.N. and N.C.; visualization, I.N. and N.C.; supervision, I.N. and N.C. All authors have read and agreed to the published version of the manuscript.
Funding
This research received no external funding.
Institutional Review Board Statement
Not applicable.
Informed Consent Statement
Not applicable.
Data Availability Statement
Data are contained within the article.
Conflicts of Interest
The authors declare no conflicts of interest.
References
- The World Bank. Commodity Markets: Evolution, Challenges, and Policies; World Bank: Washington, DC, USA, 2022. [Google Scholar]
- Jacks, D.S.; Stuermer, M. What Drives Commodity Price Booms and Busts? Energy Econ. 2020, 85, 104035. [Google Scholar] [CrossRef]
- Zhang, Q.; Hu, Y.; Jiao, J.; Wang, S. Exploring the Trend of Commodity Prices: A Review and Bibliometric Analysis. Sustainability 2022, 14, 9536. [Google Scholar] [CrossRef]
- Mbarki, I.; Khan, M.A.; Karim, S.; Paltrinieri, A.; Lucey, B.M. Unveiling Commodities-Financial Markets Intersections from a Bibliometric Perspective. Resour. Policy 2023, 83, 103635. [Google Scholar] [CrossRef]
- Naeem, M.A.; Karim, S.; Uddin, G.S.; Junttila, J. Small Fish in Big Ponds: Connections of Green Finance Assets to Commodity and Sectoral Stock Markets. Int. Rev. Financ. Anal. 2022, 83, 102283. [Google Scholar] [CrossRef]
- Dahl, R.E.; Oglend, A.; Yahya, M. Dynamics of Volatility Spillover in Commodity Markets: Linking Crude Oil to Agriculture. J. Commod. Mark. 2020, 20, 100111. [Google Scholar] [CrossRef]
- Lin, B.; Su, T. Mapping the Oil Price-Stock Market Nexus Researches: A Scientometric Review. Int. Rev. Econ. Financ. 2020, 67, 133–147. [Google Scholar] [CrossRef]
- Zavyalov, D.; Zavyalova, N.; Saginova, O.; Kireeva, N. Digitalisation Processes and Their Impact on the Development of Commodity Trading Companies. SHS Web Conf. 2021, 93, 01016. [Google Scholar] [CrossRef]
- Iliyasu, J.; Sanusi, A.R. Climate Change’s Impact on Commodity Prices: A New Challenge for Monetary Policy. Port. Econ. J. 2023. [Google Scholar] [CrossRef]
- Wang, Y.; Bouri, E.; Fareed, Z.; Dai, Y. Geopolitical Risk and the Systemic Risk in the Commodity Markets under the War in Ukraine. Financ. Res. Lett. 2022, 49, 103066. [Google Scholar] [CrossRef]
- Sakkas, A.; Tessaromatis, N. Factor Based Commodity Investing. J. Bank. Financ. 2020, 115, 105807. [Google Scholar] [CrossRef]
- Aria, M.; Cuccurullo, C. Bibliometrix: An R-Tool for Comprehensive Science Mapping Analysis. J. Informetr. 2017, 11, 959–975. [Google Scholar] [CrossRef]
- Nica, I.; Delcea, C.; Chiriță, N.; Ionescu, Ș. Quantifying Impact, Uncovering Trends: A Comprehensive Bibliometric Analysis of Shadow Banking and Financial Contagion Dynamics. Int. J. Financ. Stud. 2024, 12, 25. [Google Scholar] [CrossRef]
- Ionescu, Ș.; Delcea, C.; Chiriță, N.; Nica, I. Exploring the Use of Artificial Intelligence in Agent-Based Modeling Applications: A Bibliometric Study. Algorithms 2024, 17, 21. [Google Scholar] [CrossRef]
- Nica, I. Bibliometric Mapping in the Landscape of Cybernetics: Insights into Global Research Networks. Kybernetes 2024. [Google Scholar] [CrossRef]
- Abbas, A.F.; Jusoh, A.; Mas’od, A.; Alsharif, A.H.; Ali, J. Bibliometrix Analysis of Information Sharing in Social Media. Cogent Bus. Manag. 2022, 9, 2016556. [Google Scholar] [CrossRef]
- Campra, M.; Riva, P.; Oricchio, G.; Brescia, V. Bibliometrix Analysis of Medical Tourism. Health Serv. Manag. Res. 2022, 35, 172–188. [Google Scholar] [CrossRef] [PubMed]
- Daim, T.U.; Rueda, G.; Martin, H.; Gerdsri, P. Forecasting Emerging Technologies: Use of Bibliometrics and Patent Analysis. Technol. Forecast. Soc. Chang. 2006, 73, 981–1012. [Google Scholar] [CrossRef]
- Zupic, I.; Čater, T. Bibliometric Methods in Management and Organization. Organ. Res. Methods 2015, 18, 429–472. [Google Scholar] [CrossRef]
- Visser, M.; Van Eck, N.J.; Waltman, L. Large-Scale Comparison of Bibliographic Data Sources: Scopus, Web of Science, Dimensions, Crossref, and Microsoft Academic. Quant. Sci. Stud. 2021, 2, 20–41. [Google Scholar] [CrossRef]
- Nica, I.; Delcea, C.; Chiriță, N. Mathematical Patterns in Fuzzy Logic and Artificial Intelligence for Financial Analysis: A Bibliometric Study. Mathematics 2024, 12, 782. [Google Scholar] [CrossRef]
- Brika, S.K.M.; Algamdi, A.; Chergui, K.; Musa, A.A.; Zouaghi, R. Quality of Higher Education: A Bibliometric Review Study. Front. Educ. 2021, 6, 666087. [Google Scholar] [CrossRef]
- Santana, T.; Horta, N.R.; Ramos, M.C.; Vasconcelos, R.N.; Dias, R.T.; Zebende, G.F. Interdependence and Contagion of Effect in the Agricultural Commodities Market: A Bibliometric Analysis. Preprints 2023, 2023061078. [Google Scholar] [CrossRef]
- Nash-Stewart, C.E.; Kruesi, L.M.; Del Mar, C.B. Does Bradford’s Law of Scattering Predict the Size of the Literature in Cochrane Reviews? J. Med. Libr. Assoc. 2012, 100, 135–138. [Google Scholar] [CrossRef]
- Desai, N.; Veras, L.; Gosain, A. Using Bradford’s Law of Scattering to Identify the Core Journals of Pediatric Surgery. J. Surg. Res. 2018, 229, 90–95. [Google Scholar] [CrossRef] [PubMed]
- Alvarado, R.U. Growth of Literature on Bradford’s Law. Investig. Bibl. Arch. Bibl. E Inf. 2016, 30, 51–72. [Google Scholar] [CrossRef]
- Kang, S.H.; McIver, R.; Yoon, S.-M. Dynamic Spillover Effects among Crude Oil, Precious Metal, and Agricultural Commodity Futures Markets. Energy Econ. 2017, 62, 19–32. [Google Scholar] [CrossRef]
- Creti, A.; Joëts, M.; Mignon, V. On the Links between Stock and Commodity Markets’ Volatility. Energy Econ. 2013, 37, 16–28. [Google Scholar] [CrossRef]
- Nazlioglu, S.; Erdem, C.; Soytas, U. Volatility Spillover between Oil and Agricultural Commodity Markets. Energy Econ. 2013, 36, 658–665. [Google Scholar] [CrossRef]
- Vacha, L.; Barunik, J. Co-Movement of Energy Commodities Revisited: Evidence from Wavelet Coherence Analysis. Energy Econ. 2012, 34, 241–247. [Google Scholar] [CrossRef]
- Du, X.; Yu, C.L.; Hayes, D.J. Speculation and Volatility Spillover in the Crude Oil and Agricultural Commodity Markets: A Bayesian Analysis. Energy Econ. 2011, 33, 497–503. [Google Scholar] [CrossRef]
- Miffre, J.; Rallis, G. Momentum Strategies in Commodity Futures Markets. J. Bank. Financ. 2007, 31, 1863–1886. [Google Scholar] [CrossRef]
- Nazlioglu, S.; Soytas, U. Oil Price, Agricultural Commodity Prices, and the Dollar: A Panel Cointegration and Causality Analysis. Energy Econ. 2012, 34, 1098–1104. [Google Scholar] [CrossRef]
- Bouri, E.; Jalkh, N.; Molnár, P.; Roubaud, D. Bitcoin for Energy Commodities before and after the December 2013 Crash: Diversifier, Hedge or Safe Haven? Appl. Econ. 2017, 49, 5063–5073. [Google Scholar] [CrossRef]
- Ji, Q.; Fan, Y. How Does Oil Price Volatility Affect Non-Energy Commodity Markets? Appl. Energy 2012, 89, 273–280. [Google Scholar] [CrossRef]
- Nazlioglu, S. World Oil and Agricultural Commodity Prices: Evidence from Nonlinear Causality. Energy Policy 2011, 39, 2935–2943. [Google Scholar] [CrossRef]
- Gao, Q.; Zeng, H.; Sun, G.; Li, J. Extreme Risk Spillover from Uncertainty to Carbon Markets in China and the EU—A Time Varying Copula Approach. J. Environ. Manag. 2023, 326, 116634. [Google Scholar] [CrossRef] [PubMed]
- Zhu, M.; Liang, C.; Yeung, A.C.L.; Zhou, H. The Impact of Intelligent Manufacturing on Labor Productivity: An Empirical Analysis of Chinese Listed Manufacturing Companies. Int. J. Prod. Econ. 2024, 267, 109070. [Google Scholar] [CrossRef]
- Derviş, H. Bibliometric Analysis Using Bibliometrix an R Package. J. Sci. Res. 2020, 8, 156–160. [Google Scholar] [CrossRef]


Disclaimer/Publisher’s Note: The statements, opinions and data contained in all publications are solely those of the individual author(s) and contributor(s) and not of MDPI and/or the editor(s). MDPI and/or the editor(s) disclaim responsibility for any injury to people or property resulting from any ideas, methods, instructions or products referred to in the content. |
© 2024 by the authors. Licensee MDPI, Basel, Switzerland. This article is an open access article distributed under the terms and conditions of the Creative Commons Attribution (CC BY) license (https://creativecommons.org/licenses/by/4.0/).