Abstract
Background: Perivascular adipose tissue (PVAT) attenuation has emerged as a novel biomarker for identifying high-risk arterial plaques due to its association with inflammation. Recognizing the systemic nature of atherosclerosis and its link with major cardiovascular events in coronary disease, this study evaluated PVAT attenuation in the peripheral arteries using CT imaging to expand the understanding of its diagnostic and prognostic potential. Methods: a retrospective analysis of 53 consecutive patients who underwent CT angiography, examining PVAT density across five primary peripheral arterial segments. A 5 mm region of interest adjacent to the vascular wall was analyzed by two blinded readers, with reproducibility coefficients calculated to determine the reliability of the measurements. For the statistical analyses, mean values were derived from these measurements. The patients were stratified into four groups based on the degree of arterial stenosis: <25%, 25–50%, 50–70%, and >70%. PVAT density comparisons between these groups were performed using the Kruskal–Wallis test and the pairwise Mann–Whitney U test with Holm–Bonferroni correction for multiple comparisons. Results: the Kruskal–Wallis test revealed statistically significant disparities in PVAT density across the categorically differentiated stenosis groups (p < 0.001), indicating an association between PVAT density and arterial stenosis severity. This association was especially pronounced in the external iliac, common femoral, superficial femoral, and popliteal arteries, where the p-values were consistently below 0.05. Subsequent pairwise analyses utilizing the Mann–Whitney U test with Holm–Bonferroni correction affirmed these findings, in particular for the external iliac, common femoral, superficial femoral and popliteal arteries (p < 0.05). Conclusions: our findings reinforce the correlation between increased PVAT density and the degree of arterial stenosis, supporting the clinical value of PVAT as a non-invasive biomarker for cardiovascular risk stratification and potentially guiding therapeutic interventions.
1. Introduction
Lower extremity peripheral arterial disease (PAD) is increasingly acknowledged as a significant public health concern affecting approximately 12% to 14% of the general population, with the prevalence escalating to nearly 30% in individuals over 50 years of age [1]. PAD is closely associated with increased risks of cardiovascular diseases and a higher overall mortality. Notably, the 5-year mortality associated with chronic limb-threatening ischemia without amputation is estimated at 55–65%, exceeding the mortality rates of many cancers [2,3]. PAD manifests as systemic atherosclerosis, characterized by stenosis or occlusion in the peripheral arterial vasculature of the lower limbs, leading to symptoms such as intermittent claudication, ischemic rest pain, and a progressive decline in functional capacity—indicative of compromised blood flow and tissue ischemia [4].
At the core of the atherosclerotic processes in the lower limbs is also a vascular inflammation process, in which the visceral adipose tissue plays a significant role, as already demonstrated in coronary artery disease [5,6]. Indeed, the visceral adipose tissue impacts vascular homeostasis by releasing factors that influence the layers of the smooth muscle cells, thereby regulating the vascular tone, blood flow distribution, angiogenesis, and inflammatory processes [7]. In fact, as already reported in the literature [8], there is a positive correlation between the perivascular attenuation levels of the perivascular adipose tissue (PVAT) measured in the CTA and the adjacent plaque, supporting a direct bilateral influence [6,9,10,11,12,13,14,15,16].
Although increased PVAT density is associated with coronary artery disease and high-risk vulnerable plaques, this association has not yet been evaluated in the lower limb peripheral arteries. Therefore, the purpose of this study was to investigate the association between the grades of lower limb peripheral arterial stenosis and vascular adipose tissue density at CTA.
2. Materials and Methods
2.1. Study Population
This retrospective study received approval from the local Ethics Committee. It was funded by the local research resources of CDI Centro Diagnostico Italiano S.p.A. (Milan, Italy), a clinical diagnostic center. Given its retrospective design, obtaining specific informed consent from the participants was deemed unnecessary.
The study involved a retrospective evaluation of a consecutive cohort of patients of both genders, diagnosed with PAD, who had previously undergone CTA. The criteria for exclusion included patients who had undergone a surgical bypass and those who had already received surgical treatment for PAD.
2.2. Images Acquisition
The computed tomography angiography (CTA) procedures were conducted using a 64-slice CT scanner (SOMATOM Definition AS, Siemens Healthcare GmbH, Erlangen, Germany, EU). This was in alignment with the specific clinical requirements of each case. The patient positioning involved a supine, feet-first orientation.
The scanner’s beam collimation was set at 64 × 0.625 mm, with a tube voltage of 120 kVp. An automatic tube current modulation feature was activated, allowing a range between 90 and 330 mA. The scanning volume encompassed an area extending from the T12 vertebral level down to the feet. For the image reconstruction, a standard kernel was used, producing images with a slice thickness of 1.25 mm. For the contrast CT, a bolus of Iopamiro 370 mg/mL (Bracco Imaging S.p.A., Milan, Italy) was injected with a flow of 5 mL/s using a CT Exprès® injector (Bracco Imaging S.p.A., Via E. Folli 50, Milan, Italy).
2.3. Image Analyses
In this study, five key arterial segments in both legs of each patient were assessed: the common iliac (CI), external iliac (EI), common femoral (CF), superficial femoral (SF), and popliteal arteries (POP).
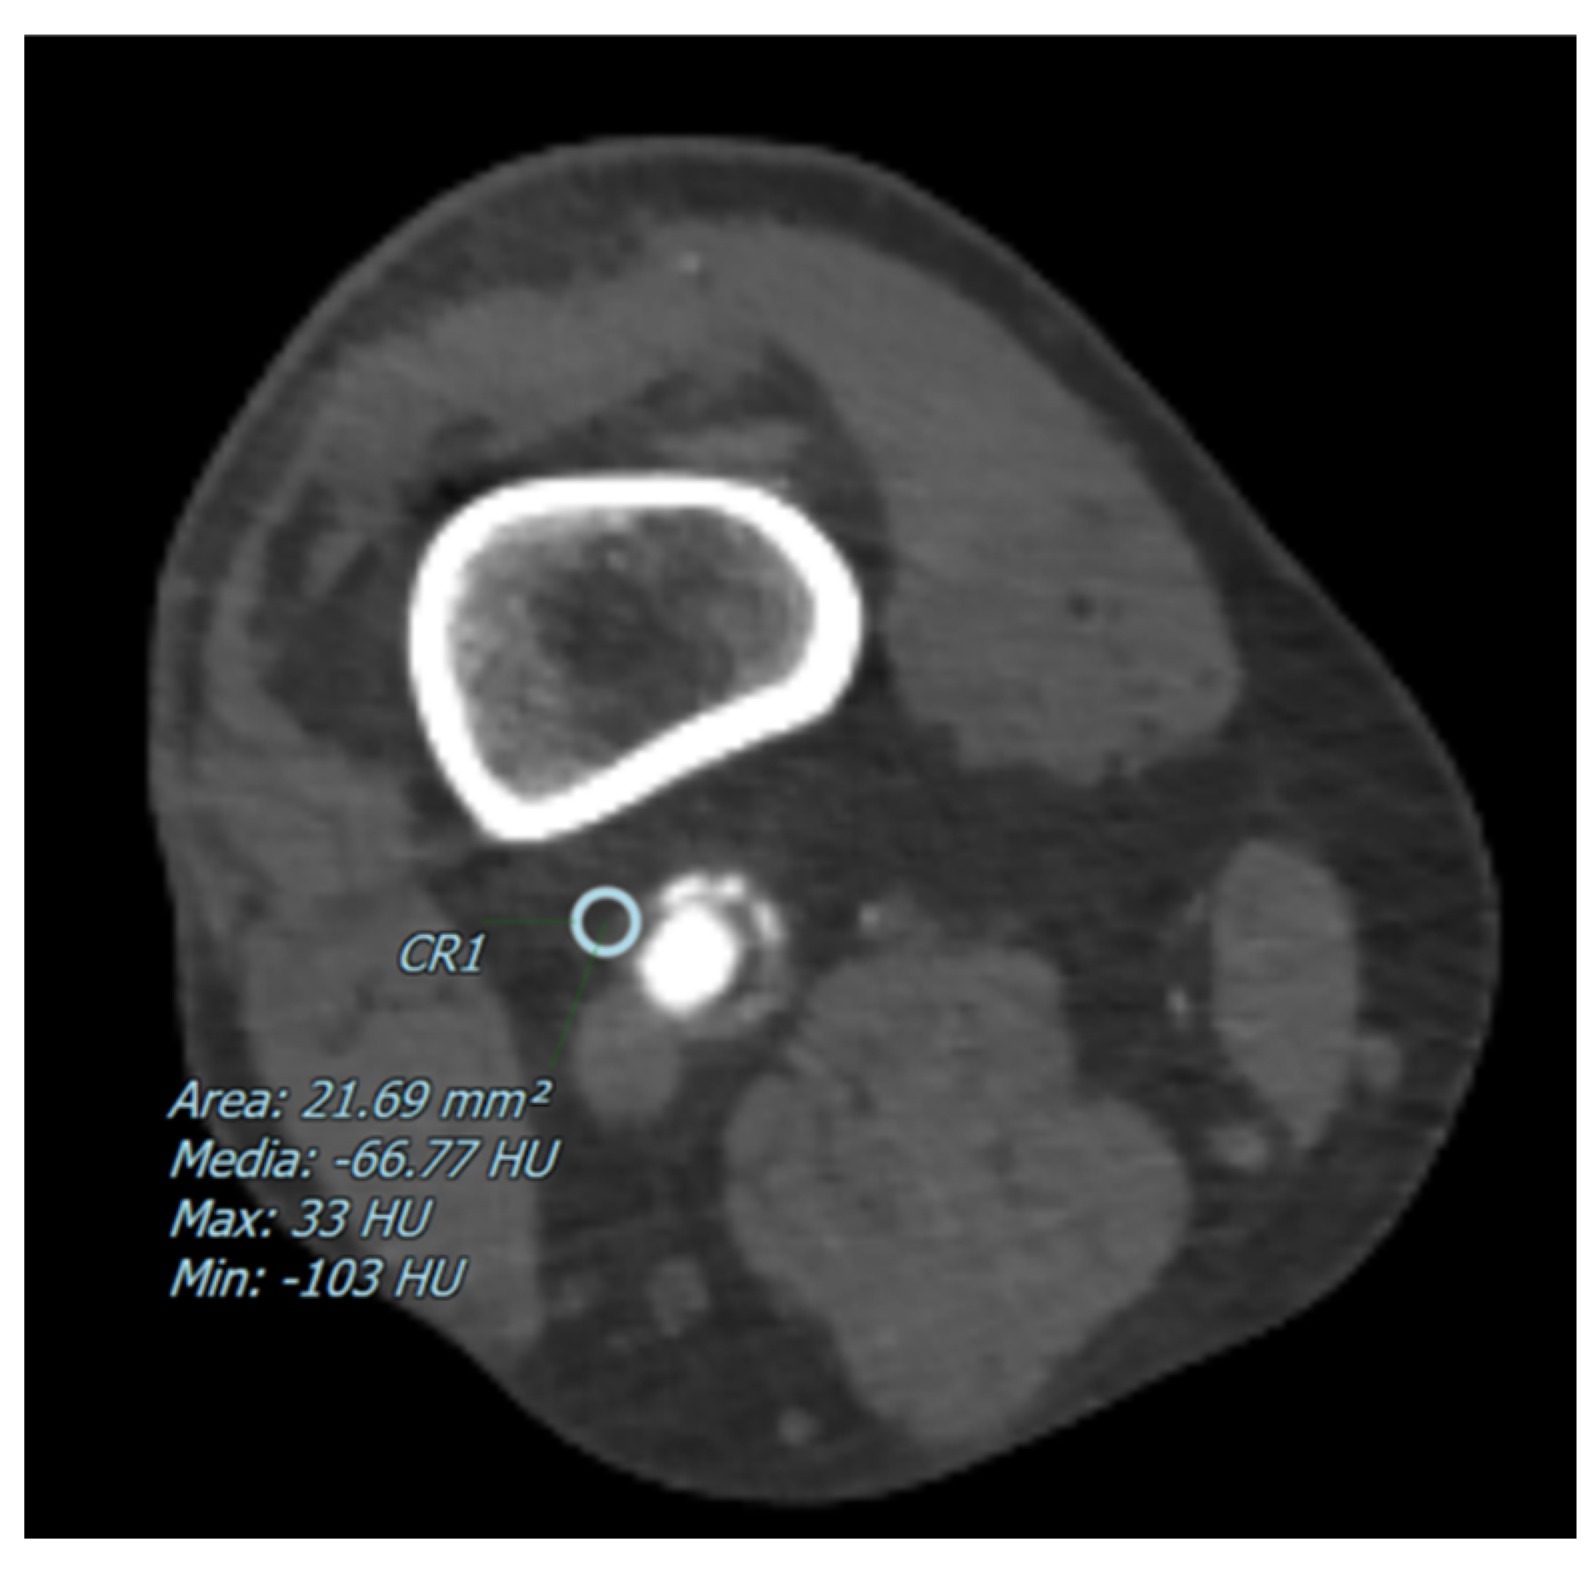
The degree of arterial stenosis was categorized into four distinct classes: <25%, 25–50%, 50–70%, and >70%. Perivascular adipose tissue (PVAT) density, measured in Hounsfield Units (HU), was determined by positioning a 5 mm circular region of interest (ROI) adjacent to the vascular wall, as shown in Figure 1 and Figure 2. Additionally, for each of these vascular segments, both the degree of stenosis and the corresponding PVAT attenuation values were quantitatively assessed.

Figure 1.
The figure shows an example of a CT image with a pointed perivascular adipose tissue density in a patient with a partial arterial stenosis of the popliteal artery. The blue circle represents the ROI where the perivascular adipose tissue density has been measured in Hounsfield Units (HU).
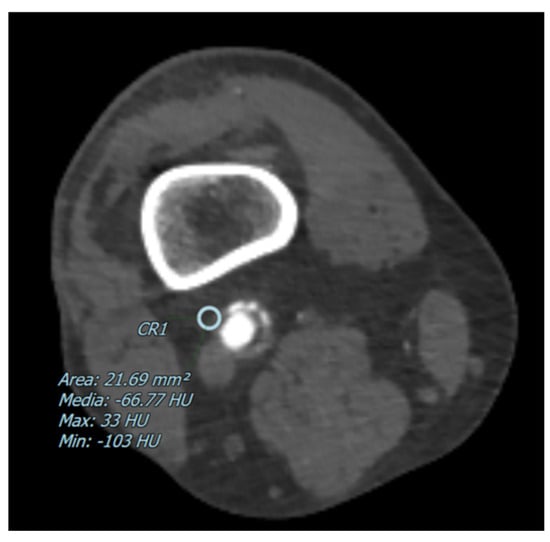
Figure 2.
The figure shows an example of a CT image with a pointed perivascular adipose tissue density in a patient with a preserved artery canalization The blue circle represents the ROI where the perivascular adipose tissue density has been measured in Hounsfield Units (HU).
2.4. Statistical Analysis
We assessed the normality of the continuous data using the Shapiro–Wilk test. Data conforming to a normal distribution were reported as mean ± standard deviation (SD), while non-normal data were described using the median and inter-quartile range (IQR).
PVAT density was quantified through the region of interest (ROI) placements by two evaluators in a blinded manner, and the inter-rater reproducibility was gauged using the coefficient of reproducibility (CoR). Given that reproducibility ranged from 75% to 83%, we utilized the mean of the measurements from both readers for the statistical analysis.
To investigate the relationship between the average PVAT density and various degrees of stenosis, we applied the Kruskal–Wallis test to identify the group differences. This was supplemented by the pairwise Mann–Whitney U test with the Holm–Bonferroni correction for more detailed comparisons, with adjusted p-values provided to enhance clarity.
Statistical analyses were performed using SPSS for Windows, version 21.0 (SPSS Inc., Chicago, IL, USA), and Microsoft Excel 2010 (Redmond, WA, USA). We established a p-value threshold of less than 0.05 to determine the statistical significance.
3. Results
3.1. Population Analysis
In accordance with the defined exclusion criteria, a select cohort of consecutive 53 patients was identified and analyzed. The cohort had a median age of 69 (IQR 60–78; max 89, min 46) years. Among these patients, 34 (64%) were men with a median age of 69 (IQR 62–78; max 89, min 46) years and 19 (36%) were women with a median age of 68 (IQR 54–79; min 50, max 87) years.
For each patient, two resident radiologists conducted blind evaluations on both legs, specifically assessing the five key arterial segments mentioned above (see Section 2). The reproducibility between the readers was assessed using the CoR; however, in order to use a more robust value for the statistical analysis, the mean value of both readers’ measures was used. The CoR for each artery is summarized in Table 1. In each of these arterial segments, they quantified the degree of stenosis and measured the PVAT density summarized in Table 2, Table 3 and Table 4.

Table 1.
The table shows the inter-rater reproducibility, assessed using coefficient of reproducibility (CoR).
Table 2.
This table shows the mean values and the quartiles of the measured PVAT densities among all the arteries.
Table 3.
This table describes the distribution of the patients based on the different grades of stenosis of all the vessels.
Table 4.
This table describes the correlation between the different grades of stenosis of all the vessels and the different PVAT densities, using the Kruskal–Wallis test and the pairwise Mann–Whitney U test to characterize a statistically significant difference between the groups categorized by the degree of stenosis.
3.2. Artery Analysis
A correlation among all the arteries and the PVAT, using the Kruskal–Wallis test, a statistically significant difference was found (p < 0.001) among the groups categorized by the degree of stenosis, concerning PVAT density. Using the pairwise Mann–Whitney U test, a statistically significant difference was found between the groups categorized by the degrees of <25% and 25–50% of stenosis (adjusted p < 0.001), between the groups categorized by the degrees of <25% and 50–75% of stenosis (adjusted p < 0.001), between the groups categorized by the degrees of <25% and >75% of stenosis (adjusted p < 0.001), and between the groups categorized by the degrees of 25–50% and >75% (adjusted p = 0.002). The same analysis was performed among all the arteries of each side (right and left). More details are summarized in Table 2, Table 3 and Table 4.
3.3. Common Iliac Artery
For the CI artery, the median PVAT density was −89 HU (IQR −96 to −82), and using the Kruskal–Wallis test, a non-significant difference was found (p = 0.102) among the groups categorized by the degree of stenosis, concerning PVAT density.
For the left CI artery, the median PVAT density was −91 HU (IQR −96 to −82), while in terms of stenosis, the distribution within the 53-patient cohort was as follows: 17 patients (33%) exhibited <25% of stenosis; 22 patients (43%) had a stenosis of between 25% and 50%; 12 patients (23%) had a stenosis ranging from 50% to 75%; and 2 patients (4%) had a stenosis of >75%. Using the Kruskal–Wallis test, a non-significant difference was found (p = 0.349) among the groups categorized by the degree of stenosis, concerning PVAT density.
For the right CI artery, the median PVAT density was −92 HU (IQR −97 to −84), while in terms of stenosis, the distribution within the 53-patient cohort was as follows: 17 patients (32%) exhibited <25% of stenosis; 29 patients (55%) had a stenosis of between 25% and 50%; 5 patients (9%) showed a stenosis ranging from 50% to 75%; and 2 patients (4%) had a stenosis of >75%. Using the Kruskal–Wallis test, a non-significant difference was found (p = 0.300) among the groups categorized by the degree of stenosis, concerning PVAT density (further details are shown in Table 2, Table 3 and Table 4).
3.4. External Iliac Artery
For the EI artery, the median PVAT density was −90 HU (IQR −97 to −80), and using the Kruskal–Wallis test, a statistically significant difference was found (p = 0.003) among the groups categorized by the degree of stenosis, concerning PVAT density. Using the pairwise Mann–Whitney U test, a statistically significant difference was found between the groups categorized by the degrees of <25% of stenosis and 25–50% of stenosis (adjusted p = 0.043), and between <25% of stenosis and 50–75% of stenosis (adjusted p = 0.017).
For the left EI artery, the median PVAT density was −91 HU (IQR −99 to −84), while in terms of stenosis, the distribution within the 53-patient cohort was as follows: 33 patients (62%) exhibited less than 25% of stenosis; 14 patients (26%) had a stenosis between 25% and 50%; 1 patient (2%) had a stenosis of between 50% and 75%; 5 out of 53 (9%) had a stenosis of >75%. Using the Kruskal–Wallis test, a statistically significant difference was found (p = 0.011) among the groups categorized by the degree of stenosis, concerning PVAT density. In particular, the pairwise Mann–Whitney U test found a statistically significant difference (adjusted p = 0.041) between the groups categorized by the degrees of <25% of stenosis and 25–50% of stenosis, concerning PVAT density.
For the right EI artery, the median PVAT density was −90 HU (IQR −97 to −85), and while in terms of stenosis, the distribution within the 53-patient cohort was as follows: 31 out of 53 (58%) patients had less than 25% of stenosis; 16 out of 53 (30%) patients had a stenosis of between 25% and 50%; 2 out of 53 (4%) had a stenosis of between 50% and 75%; 4 out of 53 (8%) had a stenosis of >75%. Using the Kruskal–Wallis test, a statistically no-significant difference was revealed (p = 0.107) among the groups categorized by the degree of stenosis, concerning PVAT density.
3.5. Common Femoral Artery
For the CF artery, the median PVAT density was −87 HU (IQR −94 to −78), and using the Kruskal–Wallis test, a statistically significant difference was revealed (p = 0.020) among the groups categorized by the degree of stenosis, concerning PVAT density. Using the pairwise Mann–Whitney U test, a statistically significant difference was found (adjusted p = 0.020) between the groups categorized by the degrees of <25% of stenosis and 25–50% of stenosis, concerning PVAT density.
For the left CF artery, the median PVAT density was −87 HU (IQR −94 to −80), while in terms of stenosis, the distribution within the 53-patient cohort was as follows: 23 out of 53 (43%) patients had less than 25% of stenosis; 24 out of 53 (45%) had a stenosis of between 25% and 50%; 3 out of 53 (6%) had a stenosis between 50% and 75%; 3 out of 53 (6%) had a stenosis of >75%. Using the Kruskal–Wallis test, a statistically non-significant difference was revealed (p = 0.058) among the groups categorized by the degree of stenosis, concerning PVAT density.
For the right CF artery, the median PVAT density was −89 HU (IQR −94 to −84), while in terms of stenosis, the distribution within the 53-patient cohort was as follows: 23 out of 53 (43%) patients had less than 25% of stenosis; 26 out of 53 (49%) had a stenosis of between 25% and 50%; 1 out of 53 (2%) had a stenosis of between 50% and 75%; 3 out of 53 (6%) had a stenosis of >75%. Using the Kruskal–Wallis test, a statistically non-significant difference was revealed (p = 0.372) among the groups categorized by the degree of stenosis, concerning PVAT density.
3.6. Superficial Femoral Artery
For the SF artery, the median PVAT density was −88 HU (IQR −96 to −78), and using the Kruskal–Wallis test, a statistically significant difference was found (p <0.001) among the groups categorized by the degree of stenosis, concerning PVAT density. Using the pairwise Mann–Whitney U test, a statistically significant difference was found between the groups, categorized by the degrees of <25% of stenosis and >75% of stenosis (adjusted p < 0.001), and between 25% and 50% of stenosis and >75% of stenosis (adjusted p = 0.010).
For the left SF artery, the median PVAT density was −90 HU (IQR −96 to −80), while in terms of stenosis, the distribution within the 53-patient cohort was as follows: 21 out of 53 (40%) patients had less than 25% of stenosis; 16 out of 53 (30%) patients had a stenosis of between 25% and 50%; 3 out of 53 (6%) had a stenosis of between 50% and 75%; 13 out of 53 (25%) had a stenosis of >75%. Using the Kruskal–Wallis test, a statistically significant difference was found (p = 0.032) among the groups categorized by the degree of stenosis, concerning PVAT density. Using the pairwise Mann–Whitney U test, a statistically significant difference was found (adjusted p = 0.027) between the groups, categorized by the degrees of <25% of stenosis and >75% of stenosis, concerning PVAT density.
For the right SF artery, the median PVAT density was −89 HU (IQR −96 to −82), while in terms of stenosis, the distribution within the 53-patient cohort was as follows: 20 out of 53 (38%) patients had less than 25% of stenosis; 14 out of 53 (26%) patients had a stenosis of between 25% and 50%; 6 out of 53 (11%) had a stenosis of between 50% and 75%; 13 out of 53 (25%) had a stenosis of >75%. Using the Kruskal–Wallis test, a statistically significant difference was found (p = 0.002) among the groups categorized by the degree of stenosis, concerning PVAT density. Using the pairwise Mann–Whitney U test, a statistically significant difference was found between the groups categorized by the degrees of <25% of stenosis and >75% of stenosis (adjusted p = 0.002), and between 25% and 50% of stenosis and >75% of stenosis (adjusted p = 0.038).
3.7. Popliteal Femoral Artery
For the POP artery, the median PVAT density was −96 HU (IQR −103 to −89), and using the Kruskal–Wallis test, a statistically significant difference was found (p <0.001) among the groups categorized by the degree of stenosis, concerning PVAT density. Using the pairwise Mann–Whitney U test, a statistically significant difference was found (adjusted p = 0.004) between the groups categorized by the degrees of <25% stenosis and >75% stenosis, concerning PVAT density.
For the left POP artery, the median PVAT density was −97 HU (IQR −107 to −94), while in terms of stenosis, the distribution within the 53-patient cohort was as follows: 32 out of 53 (60%) patients had less than 25% stenosis; 13 out of 53 (25%) patients had a stenosis between 25% and 50%; 2 out of 53 (4%) had a stenosis between 50% and 75%; 6 out of 53 (11%) had a stenosis of >75%. Using the Kruskal–Wallis test, a statistically significant difference was found (p = 0.019) among the groups categorized by the degree of stenosis, concerning PVAT density.
For the right POP artery, the median PVAT density was −96 HU (IQR −103 to −89), while in terms of stenosis, the distribution within the 53-patient cohort was as follows: 29 out of 53 (55%) patients had less than 25% stenosis; 15 out of 53 (28%) patients had a stenosis between 25% and 50%; 3 out of 54 (6%) had a stenosis between 50% and 75%; 6 out of 53 (11%) had a stenosis of >75%. Using the Kruskal–Wallis test, a statistically significant difference was found (p = 0.013) among the groups categorized by the degree of stenosis, concerning PVAT density.
4. Discussion
In the current study, we evaluated a cohort of 53 consecutive patients who had undergone a CTA; the cohort was predominantly male (64%), with a median age of 69 years. Our aim was to explore the utility of PVAT density as an imaging biomarker [11] for assessing disease severity in peripheral arteries, based on the hypothesis that increased PVAT density correlates with a higher degree of stenosis. These findings are summarized in Table 1, Table 2, Table 3 and Table 4.
Among all the imaging modalities that could have been implemented, at the net of the advantages and disadvantages we decided to use CT as the modality of choice, supported by the study of R. Met et al. and M. Heijenbrok et al. [17,18], which highlighted the accuracy of the CT scan in the assessment of PAD in all regions of the lower extremity arteries. In fact, where CT allows the detection and evaluation of arterial stenosis, calcification, and plaque morphology, MRI lacks in the ability to determine calcifications, which is an element of particular interest in the PAD risk stratification.
Notably, we found a positive association between increased PVAT density and the degree of arterial stenosis, particularly in the left external iliac, superficial femoral, and popliteal arteries. This association aligned with the observations by Han et al. [13], who reported a similar distribution of disease, notably within the femoral artery segment, underscoring the potential of PVAT density as a marker of disease severity in PAD. Moreover, a more prominent correlation between the stenosis degree and PVAT density among the more distal arteries was found. Since these arterial vessels are thinner, among the arterial bundle considered in our study, the perivascular adipose tissue is more likely to induce a higher inflammatory condition proportionally.
In accordance with this, the CRISP study by Oikonomou et al. established a compelling link between perivascular adipose tissue (PVAT) inflammation in coronary arteries and an increased risk of atherosclerotic plaque rupture. This association underscored the importance of identifying high-risk patients for potential intervention with more intensive therapeutic strategies [9]. The significance of these findings was further corroborated using a histopathological examination, where lesions at a high risk of rupture demonstrated active inflammation, emphasizing the role of PVAT in cardiovascular risk stratification [7].
Aside from the histopathological examination, there are different humoral factors that have been identified as potential biomarkers for PAD severity assessment. In fact, X. Wang et al. [19,20] underlined how these factors, within CT angiography, can provide information about vascular and plaque calcification, which is crucial for risk stratification in PAD. In particular, they highlighted the elevated serum concentration of vascular endothelial growth factor C (VEGF-C) and interleukin-6 (IL-6) in patients with moderate/severe peripheral artery stenosis, aside from matrix metalloproteinases (MMPs) and lipoprotein-associated phospholipase A2 (Lp-PLA2).
Indeed, atherosclerosis is recognized as a systemic inflammatory condition, suggesting that its manifestations are not confined to a single vascular arterial vessel. This systemic nature is evident in patients with peripheral artery disease (PAD), who exhibit more extensive coronary atherosclerosis, highlighting the interconnectedness of vascular pathology across different regions [10,12].
Despite these promising results, our study encountered significant limitations, primarily due to its retrospective design, which may have introduced biases by relying on previously collected data, potentially affecting the robustness of our findings. Additionally, the relatively small sample size limited the generalizability of our results, as it may not have adequately represented the broader population affected by PAD, thereby constraining the statistical power to detect significant associations. Furthermore, the measurement of PVAT density was subjected to variability due to the manual placement of a 5 mm ROI adjacent to the vascular wall, introducing an element of operator dependency. Future research could benefit from adopting more objective methods, like the Fat Attenuation Index (FAI) used by Oikonomou et al. [9], to enhance measurement accuracy and reproducibility.
However, to our knowledge, this is the first study to correlate PVAT density with the severity of stenosis in patients with PAD. Given the substantial impact of PAD on mortality and morbidity, our findings offer a promising avenue for future large-scale studies, utilizing the FAI to validate PVAT density as a reliable biomarker of disease severity. Such research could pave the way for novel diagnostic and therapeutic strategies in managing PAD, ultimately improving patient outcomes.
Author Contributions
Conceptualization: M.A. and F.S.; methodology: M.A., F.S., C.P., A.F., M.C. and M.c.B.; formal analysis: M.A. and M.C.; investigation: C.P., A.F. and M.c.B.; data curation: M.A.; writing—original draft preparation: A.E.M., S.P., D.F., M.A., C.P., M.C. and A.F.; writing—review and editing, M.A. and F.S.; supervision, M.A. and F.S. All authors have read and agreed to the published version of the manuscript.
Funding
This research received no external funding.
Institutional Review Board Statement
The study was conducted in accordance with the Declaration of Helsinki and approved by the Ethics Committee of Fondazione IRCCS Ca’ Granda Ospedale Maggiore Policlinico (approval code 32_2021, approval on 2 February 2021).
Informed Consent Statement
Patient consent was waived due to the retrospective nature of the study.
Data Availability Statement
Data will be provided on request. Data are not publicly available due to the privacy policy of our center.
Conflicts of Interest
Marco Alì is a scientific advisor for Bracco Imaging S.p.A. The other authors declare that they have no financial interests.
References
- Voci, D.; Fedeli, U.; Valerio, L.; Schievano, E.; Righini, M.; Kucher, N.; Spirk, D.; Barco, S. Mortality rate related to peripheral arterial disease: A retrospective analysis of epidemiological data (years 2008–2019). Nutr. Metab. Cardiovasc. Dis. 2023, 33, 516–522. [Google Scholar] [CrossRef] [PubMed]
- Lin, J.; Chen, Y.; Jiang, N.; Li, Z.; Xu, S. Burden of Peripheral Artery Disease and Its Attributable Risk Factors in 204 Countries and Territories from 1990 to 2019. Front. Cardiovasc. Med. 2022, 9, 868370. [Google Scholar] [CrossRef] [PubMed]
- Aday, A.W.; Matsushita, K. Epidemiology of Peripheral Artery Disease and Polyvascular Disease. Circ. Res. 2021, 128, 1818–1832. [Google Scholar] [CrossRef] [PubMed]
- GBD 2019 Peripheral Artery Disease Collaborators Reject. The pictures were directly downloaded from the software so we cannot change the content of the labels. Global burden of peripheral artery disease and its risk factors, 1990–2019: A systematic analysis for the Global Burden of Disease Study 2019. Lancet Glob Health 2023, 11, e1553–e1565. [Google Scholar] [CrossRef] [PubMed]
- Golia, E.; Limongelli, G.; Natale, F.; Fimiani, F.; Maddaloni, V.; Russo, P.E.; Riegler, L.; Bianchi, R.; Crisci, M.; Palma, G.D.; et al. Adipose tissue and vascular inflammation in coronary artery disease. World J. Cardiol. 2014, 6, 539–554. [Google Scholar] [CrossRef] [PubMed]
- Akbay, E.; Akinci, S.; Uysal, I.; Adar, A.; Çoner, A.; Müderrisoğlu, I.H. Periaortic adipose tissue index: A new approach to the relationship between coronary stenosis severity/lesion complexity and periaortic adipose tissue. J. Exp. Clin. Med. 2022, 39, 822–828. [Google Scholar] [CrossRef]
- Szasz, T.; Bomfim, G.F.; Webb, R.C. The influence of perivascular adipose tissue on vascular homeostasis. Vasc. Health Risk Manag. 2013, 9, 105–116. [Google Scholar] [CrossRef] [PubMed]
- Saba, L.; Zucca, S.; Gupta, A.; Micheletti, G.; Suri, J.S.; Balestrieri, A.; Porcu, M.; Crivelli, P.; Lanzino, G.; Qi, Y.; et al. Perivascular Fat Density and Contrast Plaque Enhancement: Does a Correlation Exist? Am. J. Neuroradiol. 2020, 41, 1460–1465. [Google Scholar] [CrossRef] [PubMed]
- Oikonomou, E.; Marwan, M.; Desai, M.Y.; Mancio, J.; Alashi, A.; Centeno, E.H.; Thomas, S.; Herdman, L.; Kotanidis, C.; Thomas, K.E.; et al. Non-invasive detection of coronary inflammation using computed tomography and prediction of residual cardiovascular risk (the CRISP CT study): A post-hoc analysis of prospective outcome data. Lancet 2018, 392, 929–939. [Google Scholar] [CrossRef] [PubMed]
- Hussein, A.A.; Uno, K.; Wolski, K.; Kapadia, S.; Schoenhagen, P.; Tuzcu, E.M.; Nissen, S.E.; Nicholls, S.J. Peripheral arterial disease and progression of coronary atherosclerosis. J. Am. Coll. Cardiol. 2011, 57, 1220–1225. [Google Scholar] [CrossRef] [PubMed]
- Tuttolomondo, D.; Martini, C.; Nicolini, F.; Formica, F.; Pini, A.; Secchi, F.; Volpi, R.; De Filippo, M.; Gaibazzi, N. Perivascular Adipose Tissue Attenuation on Computed Tomography beyond the Coronary Arteries. A Systematic Review. Diagnostics 2021, 11, 1495. [Google Scholar] [CrossRef] [PubMed]
- Kaperonis, E.A.; Liapis, C.D.; Kakisis, J.D.; Dimitroulis, D.; Papavassiliou, V.G. Inflammation and Atherosclerosis. Eur. J. Vasc. Endovasc. Surg. 2006, 31, 386–393. [Google Scholar] [CrossRef] [PubMed]
- Poredoš, P.; Cevc, M.; Blinc, A. Characteristics of atherosclerosis in femoropopliteal artery and its clinical relevance. Atherosclerosis 2021, 335, 31–40. [Google Scholar] [CrossRef] [PubMed]
- Honold, S.; Wildauer, M.; Beyer, C.; Feuchtner, G.; Senoner, T.; Jaschke, W.; Gizewski, E.; Bauer, A.; Friedrich, G.; Stühlinger, M.; et al. Reciprocal communication of pericoronary adipose tissue and coronary atherogenesis. Eur. J. Radiol. 2021, 136, 109531. [Google Scholar] [CrossRef] [PubMed]
- Monti, C.B.; Capra, D.; Zanardo, M.; Guarnieri, G.; Schiaffino, S.; Secchi, F.; Sardanelli, F. CT-derived epicardial adipose tissue density: Systematic review and meta-analysis. Eur. J. Radiol. 2021, 143, 109902. [Google Scholar] [CrossRef] [PubMed]
- Monti, C.B.; Schiaffino, S.; Galimberti Ortiz, M.D.M.; Capra, D.; Zanardo, M.; De Benedictis, E.; Luporini, A.G.; Spagnolo, P.; Secchi, F.; Sardanelli, F. Potential role of epicardial adipose tissue as a biomarker of anthracycline cardiotoxicity. Insights Imaging. 2021, 12, 161. [Google Scholar] [CrossRef] [PubMed]
- Met, R.; Bipat, S.; Legemate, D.A.; Reekers, J.A.; Koelemay, M.J.W. Diagnostic Performance of Computed Tomography Angiography in Peripheral Arterial Disease. JAMA 2009, 301, 415–424. [Google Scholar] [CrossRef] [PubMed]
- Heijenbrok-Kal, M.H.; Kock, M.C.J.M.; Hunink, M.G.M. Lower extremity arterial disease: Multidetector CT angiography meta-analysis. Radiology 2007, 245, 433–439. [Google Scholar] [CrossRef] [PubMed]
- Kotanidis, C.P.; Antoniades, C. Perivascular fat imaging by computed tomography (CT): A virtual guide. Br. J. Pharmacol. 2021, 178, 4270–4290. [Google Scholar] [CrossRef] [PubMed]
- Wang, X.; Nai, Y.-H.; Gan, J.; Lian, C.P.L.; Ryan, F.K.; Tan, F.S.L.; Chan, D.Y.S.; Ng, J.J.; Lo, Z.J.; Chong, T.T.; et al. Multi-Modality Imaging of Atheromatous Plaques in Peripheral Arterial Disease: Integrating Molecular and Imaging Markers. Int. J. Mol. Sci. 2023, 24, 11123. [Google Scholar] [CrossRef] [PubMed]

Disclaimer/Publisher’s Note: The statements, opinions and data contained in all publications are solely those of the individual author(s) and contributor(s) and not of MDPI and/or the editor(s). MDPI and/or the editor(s) disclaim responsibility for any injury to people or property resulting from any ideas, methods, instructions or products referred to in the content. |
© 2024 by the authors. Licensee MDPI, Basel, Switzerland. This article is an open access article distributed under the terms and conditions of the Creative Commons Attribution (CC BY) license (https://creativecommons.org/licenses/by/4.0/).