Abstract
The sensitive and effective detection of microRNAs (miRNAs) is of great significance since miRNAs have been proven to have undeniable importance in participating in many biological processes. Herein, we present a novel, sensitive, label-free electrochemical miRNA detection method. Three signal amplification techniques are incorporated in this method, including the efficient conjugate of primer-modified polystyrene spheres (PS) with magnetic beads (MBs) triggered by target miRNA, template-free surface-initiated enzymatic polymerization (SIEP) on the primers, and the use of copper ions in square wave voltammetry (SWV) for detecting acidically depurinated primers. Cooperating with the electrochemical approach, this method was able to achieve a detection limit of 120 aM. With an attomole level of sensitivity and easiness of manipulation, this novel method is suitable for miRNA routine detection in both research and clinical aspects.
1. Introduction
MicroRNAs (miRNAs), a major class of noncoding RNAs, have been verified to play pivotal roles in numerous important biological processes in plants and animals [1]. The surge of interest in miRNAs has led to an increasing need for ultrasensitive qualitative and quantitative analysis of miRNAs [2,3]. The microRNA-27a (miR-27a) has been reported to play an important role in oncogenesis, cancer cell proliferation/metabolism, and chemotherapy resistance, which also shows novel functions in regulating epithelial-mesenchymal transition (EMT) and tumor immune response [4]. Recently, it was found that the expression of miR-27a was significantly higher in gastric cancer patients, and the miR-27a level in serum could be a predictive marker for lymph node metastasis [5]. Traditional methods for miRNA detection predominantly rely on northern blotting, microarray, and quantitative reverse transcriptase polymerase chain reaction (RT-qPCR). Northern blotting requires a large sample size and bears the drawback of poor sensitivity, particularly for low abundant miRNA detection [6]. Microarray is able to carry out miRNA expression profiling for thousands of small noncoding RNA simultaneously, yet requiring sophisticated probe design and instrumentation, which makes the cost of miRNA analysis high [7]. Despite the nature of the high sensitivity of RT-qPCR, even with the tiny amount of sample, expensive instruments for precise temperature control and complicated primer design/manipulation are unavoidable [8].
Electrochemical sensors bearing the feature of low cost and high sensitivity would be a good alternative for miRNA detection. Numerous electrochemical methods for miRNA analysis have been developed [9]. Despite their high sensitivity, labeling is essential for offering miRNA electroactivity during electrochemical analysis. By employing electrocatalytic tags or moiety, such as isoniazid-capped OsO2 nanoparticles, Ru(PD)2Cl2 (PD = 1,10-phenanthroline-5,6-dione), oxidation of hydrazine is catalyzed, and thus, achieve sensitive miRNA detection [10,11]. Different labeling methods from various materials have been developed for electrochemical detection systems [12]. The uses of gold nanoparticles [13,14,15], quantum dots [16,17], and polystyrene beads or carbon nanotubes as carriers are good examples [18,19,20]. Quantum dots, which are crystalline clusters consisting of a few hundred to a few thousand atoms, serve as an alternative for DNA labeling. With the CdS quantum dots-labeling DNA strategy employed, a detection limit of 100 fmol was achieved [21]. Furthermore, by loading carriers, such as carbon nanotubes (CNTs) with quantum dots, the signal is further amplified. It is found that each CNT contains around 500 CdS particles [22]. Even with quantum dot labeling, its electroactivity cannot be greatly enhanced. The capacity of quantum dots for nanocrystals is limited; for example, PbS quantum dots contain only around 3700 metal ions (by calculation) [23]. Tremendous attempts have been made to enhance the sensitivity by integrating nanomaterials with an isothermal nucleic acid amplification strategy, including rolling circle amplification (RCA) [24,25], strand displacement amplification (SDA) [26], hybridization chain reaction (HCR) [27,28,29], and DNA walker [30]. Due to the multiple signal amplification, these assays are extremely sensitive, but sophisticated probe design is still needed in the amplification process, limiting their widespread applications.
Free purine nucleobase, being electroactive, unlike DNA and RNA, could be directly detected using the electrochemical method, thereby achieving label-free detection [31]. By carrying out in situ polymerization of primer on vectors, e.g., polystyrene sphere (PS), followed by depurination, it is possible to achieve greater signal amplification. Here, we established an ultrasensitive electrochemical approach coupled with PS, magnetic beads (MBs), and template-free amplification for detecting the target miRNA, miR-27a. A huge amount of hairpin probe (HP) attached to the MBs’ surface provided selectivity to target miR-27a. Oligonucleotide primers, which were loaded on PS, were later tailed by thousands of adenines at their 3′ ends through template-free surface-initiated enzymatic polymerization (SIEP). Hybridization of hairpin probes appears upon the presence of target miR-27a, which is able to capture numerous polystyrene spheres to the surface of a magnetic particle. Followed by SIEP amplification, acidic depurination, and adsorptive chronopotentiometric stripping measurements of the free nucleobases in the presence of copper ions at a disposable pencil graphite electrode, the concentration of miR-27a can be measured. This method achieved an attomole level limit of detection at optimal experimental conditions and was applied to the direct detection of the miRNA concentrations in human serum samples, satisfying the need for rapid and easy methods for early cancer marker detection in clinical diagnostics.
2. Materials and Methods
Reagents and materials. MiRNAs were purchased from TaKaRa Biotechnology (Dalian, China) Co., Ltd. Synthetic single-stranded DNAs (ssDNAs) and DEPC-treated (DEPC = diethylpyrocarbonate) water were purchased from Shanghai Sangon Biological Engineering Technology and Services Co. Ltd. (Shanghai, China). The sequences of the used oligonucleotides are listed in Table 1. 1-Ethyl-3-(3-dimethylaminopropyl) carbodiimide hydrochloride (EDC) and N-hydroxysuccinimide (NHS) were obtained from Alfa Aesar (Tianjin, China). Magnetic beads (MB, carboxyl-coated, 1 μm in diameter) and polystyrene spheres (PS, carboxyl-coated, 0.6 μm in diameter) were obtained from Bangs Lab Co. Ltd. (Fishers, IN, USA). E. coli poly (A) polymerase (PAP), ATP, terminal transferase (TdT), and dATP were purchased from New England Biolabs (Beijing, China). Solid RNase scavenger and RNase inhibitors were obtained from BioTeke Corporation (Beijing, China). All other chemicals were of analytical grade. The coupling buffer prepared fresh before use was 100 mM EDC/NHS in 100 mM imidazole buffer (pH 7.0). The hybridization buffer was 10 mM Tris buffer (pH 7.4) with 500 mM NaCl. The buffer for electrochemical experiments was 0.2 M acetate buffer (pH 4.5). All solutions were prepared with DEPC-treated water to protect from RNase degradation. The human serum samples were collected and ethically approved by Nanfang Hospital of Southern Medical University.

Table 1.
The sequences of the oligonucleotides used in this work.
Preparation of HP-MB. Fifty–μL of carboxylated MB suspension was washed with 100 μL of 0.1 M imidazole buffer (pH 7.0) 3 times and was dispersed in 400 μL coupling buffer. Next, 1 OD of HP was added, followed by 100 μL of 0.1 M EDC/NHS solution. The mixture was then incubated at 50 °C for 2 h and mixing with vortex. Then, 10 μL of 1 mM 6-mercapto-1-hexanol (MCH) was added to the HP-MB conjugates and further reacted for 2 h. HP-MB conjugates were separated from the mixture by magnetic attraction. The desired product was washed with 2 × SSC buffer (pH 7.0, with 0.5% SDS) 3 times, followed by DEPC-treated water twice. The product was then stored in 200 μL hybridization buffer at 4 °C.
Preparation of SA/P-PS including SA/DP-PS and SA/RP-PS. Fifty–μL of carboxylated PS suspension was centrifuged at 13,000 rpm for 5 min and washed with 100 μL of 0.1 M imidazole buffer (pH 7.0) 3 times. The PS was dispersed in 455 μL coupling buffer (100 mM EDC/NHS in 100 mM imidazole buffer, pH 7.0) and was then added with 45 μL of 1 μM streptavidin (SA), 1 OD of DNA primer (DP) and 100 μL 0.1 M EDC/NHS solution. The mixture was incubated at 50 °C for 3 h with vortex mixing. The resultant streptavidin/DNA primer-functionalized PS (SA/DP-PS) were centrifuged at 13,000 rpm for 3 min. It was then washed 3 times with 2 × SSC buffer (pH 7.0, with 0.5% SDS) at room temperature, followed by 65 °C DEPC-treated water for 2 times. The resultant SA/DP-PS conjugates were stored in 200 μL hybridization buffer at 4 °C.
The preparation of streptavidin/RNA primer-functionalized PS (SA/RP-PS) was the same as above, except RNA primer was used.
Apparatus and measurements. Electrochemical measurements were carried out on a CHI 660C electrochemical workstation (Chenhua, Shanghai, China) equipped with a three-electrode system, which consisted of a pencil working electrode, a platinum wire auxiliary electrode, and an Ag/AgCl (saturated KCl) reference electrode. A Pentel pencil of model P205 (Japan) was used as a pencil lead holder. A metallic wire was soldered to the metallic part holding the lead inside the pencil in order to enable electrical contact. The pencil working electrode was then fixed vertically with 5 mm of pencil lead immersed into the solution. Stripping analyses involved an electrodeposition step at 0.30 V for 200 s and a stripping step from 0.75 to 1.40 V by square wave voltammetry (SWV) with a 4 mV potential step, a 15 Hz frequency, and a 25 mV amplitude. Stripping curves were treated with OriginPro 9 Peak Analyzer function for baseline correction. Transmission electron microscopy (TEM) micrographs were recorded on a JEOL JEM-2010 electron microscope operated at an accelerated voltage of 120 kV. Gel electrophoresis was carried out on a horizontal electrophoresis system at 100 V for 30 min in 1 × Tris-acetate EDTA (TAE) buffer (0.02 M Tris-acetate, 0.5 mM EDTA, pH 8.0) with GelRed staining. 6 μL of the extended product from the PAP or TdT reaction mixture was loaded into a 2% agarose gel. The gels were then imaged using the Alpha DigiDoc 1201 system (Alpha Innotech, San Leandro, CA, USA). Thermal denaturation profiles of hybrids formed by the molecular beacon were investigated with target miR-27a and mismatch ones, fluorescence of a 50-mL solution containing 125 nM MB, 500 nM oligonucleotide target, 20 mM Tris-HCl, and 1 mM MgCl2, pH 8 was monitored as a function of temperature. The temperature was increased from 4 to 80 °C by adding 1 °C per minute during the process. Fluorescence was monitored during each period using a fluorescence reader with a programmed temperature control (PE/ABI 7700; Applied Biosystems, Waltham, MA, USA).
PAP-SIEP assay. Five μL of HP-MB and 5 μL of SA/RP-PS were added to a 5 μL solution of synthetic target miR-27a at various concentrations. The mixture was then incubated at 37 °C for 60 min for hybridization. After magnetic separation, the desired product was washed with DEPC-treated water 3 times and was reacted at 37 °C for 2 h with a mixture of PAP (2.5 U μL−1), and 5 mM ATP in a reaction buffer of 20 mM Tris-HCl, 60 mM KCl, 4 mM MnCl2, 0.5 mM DTT (pH 7.1). PAP was inactivated by incubating at 65 °C for 20 min. The resultant MB was washed 3 times with 0.1 M PBS (pH 7.0) and added with 10 μL of 3 M H2SO4 solution for depurination. The final mixture was heated to dryness on a hot plate and re-dissolved in 500 μL EB for further stripping analysis.
TdT-SIEP assay. The procedure of the TdT-based assay was similar to that of the PAP-based assay, except that the involved SIEP was performed on SA/DP-PS triggered by TdT. After hybridization and isolation, the product was reacted at 37 °C for 2 h with a mixture of TdT (2.0 U μL−1) and 5 mM dATP in a reaction buffer composed of 100 mM potassium cacodylate, 1 mM CoCl2, and 0.2 mM DTT (pH 7.2). TdT was then inactivated by incubating at 70 °C for 10 min. The product was washed with 0.1 M PBS (pH 7.0) 3 times. Depurination was performed in the same way as described above.
SIEP assay with copper enhancement. The sensitivity of SIEP was enhanced by Cu2+ ions addition. The depurinated product solution was spiked with 2 mg L−1 Cu2+ prior to the electrochemical measurement. Oxidized pencil graphite electrode, Ag/AgCl electrode, and platinum wire auxiliary electrode were used as working electrode, reference electrode, and counter electrode, respectively. 0.3 V was applied to the stirring solution for 200 s, and the solution remained unstirred for 5 s. Electrochemical stripping analysis was performed from 0.75 to 1.40 V using SWV.
3. Results
3.1. Principle of Strategy
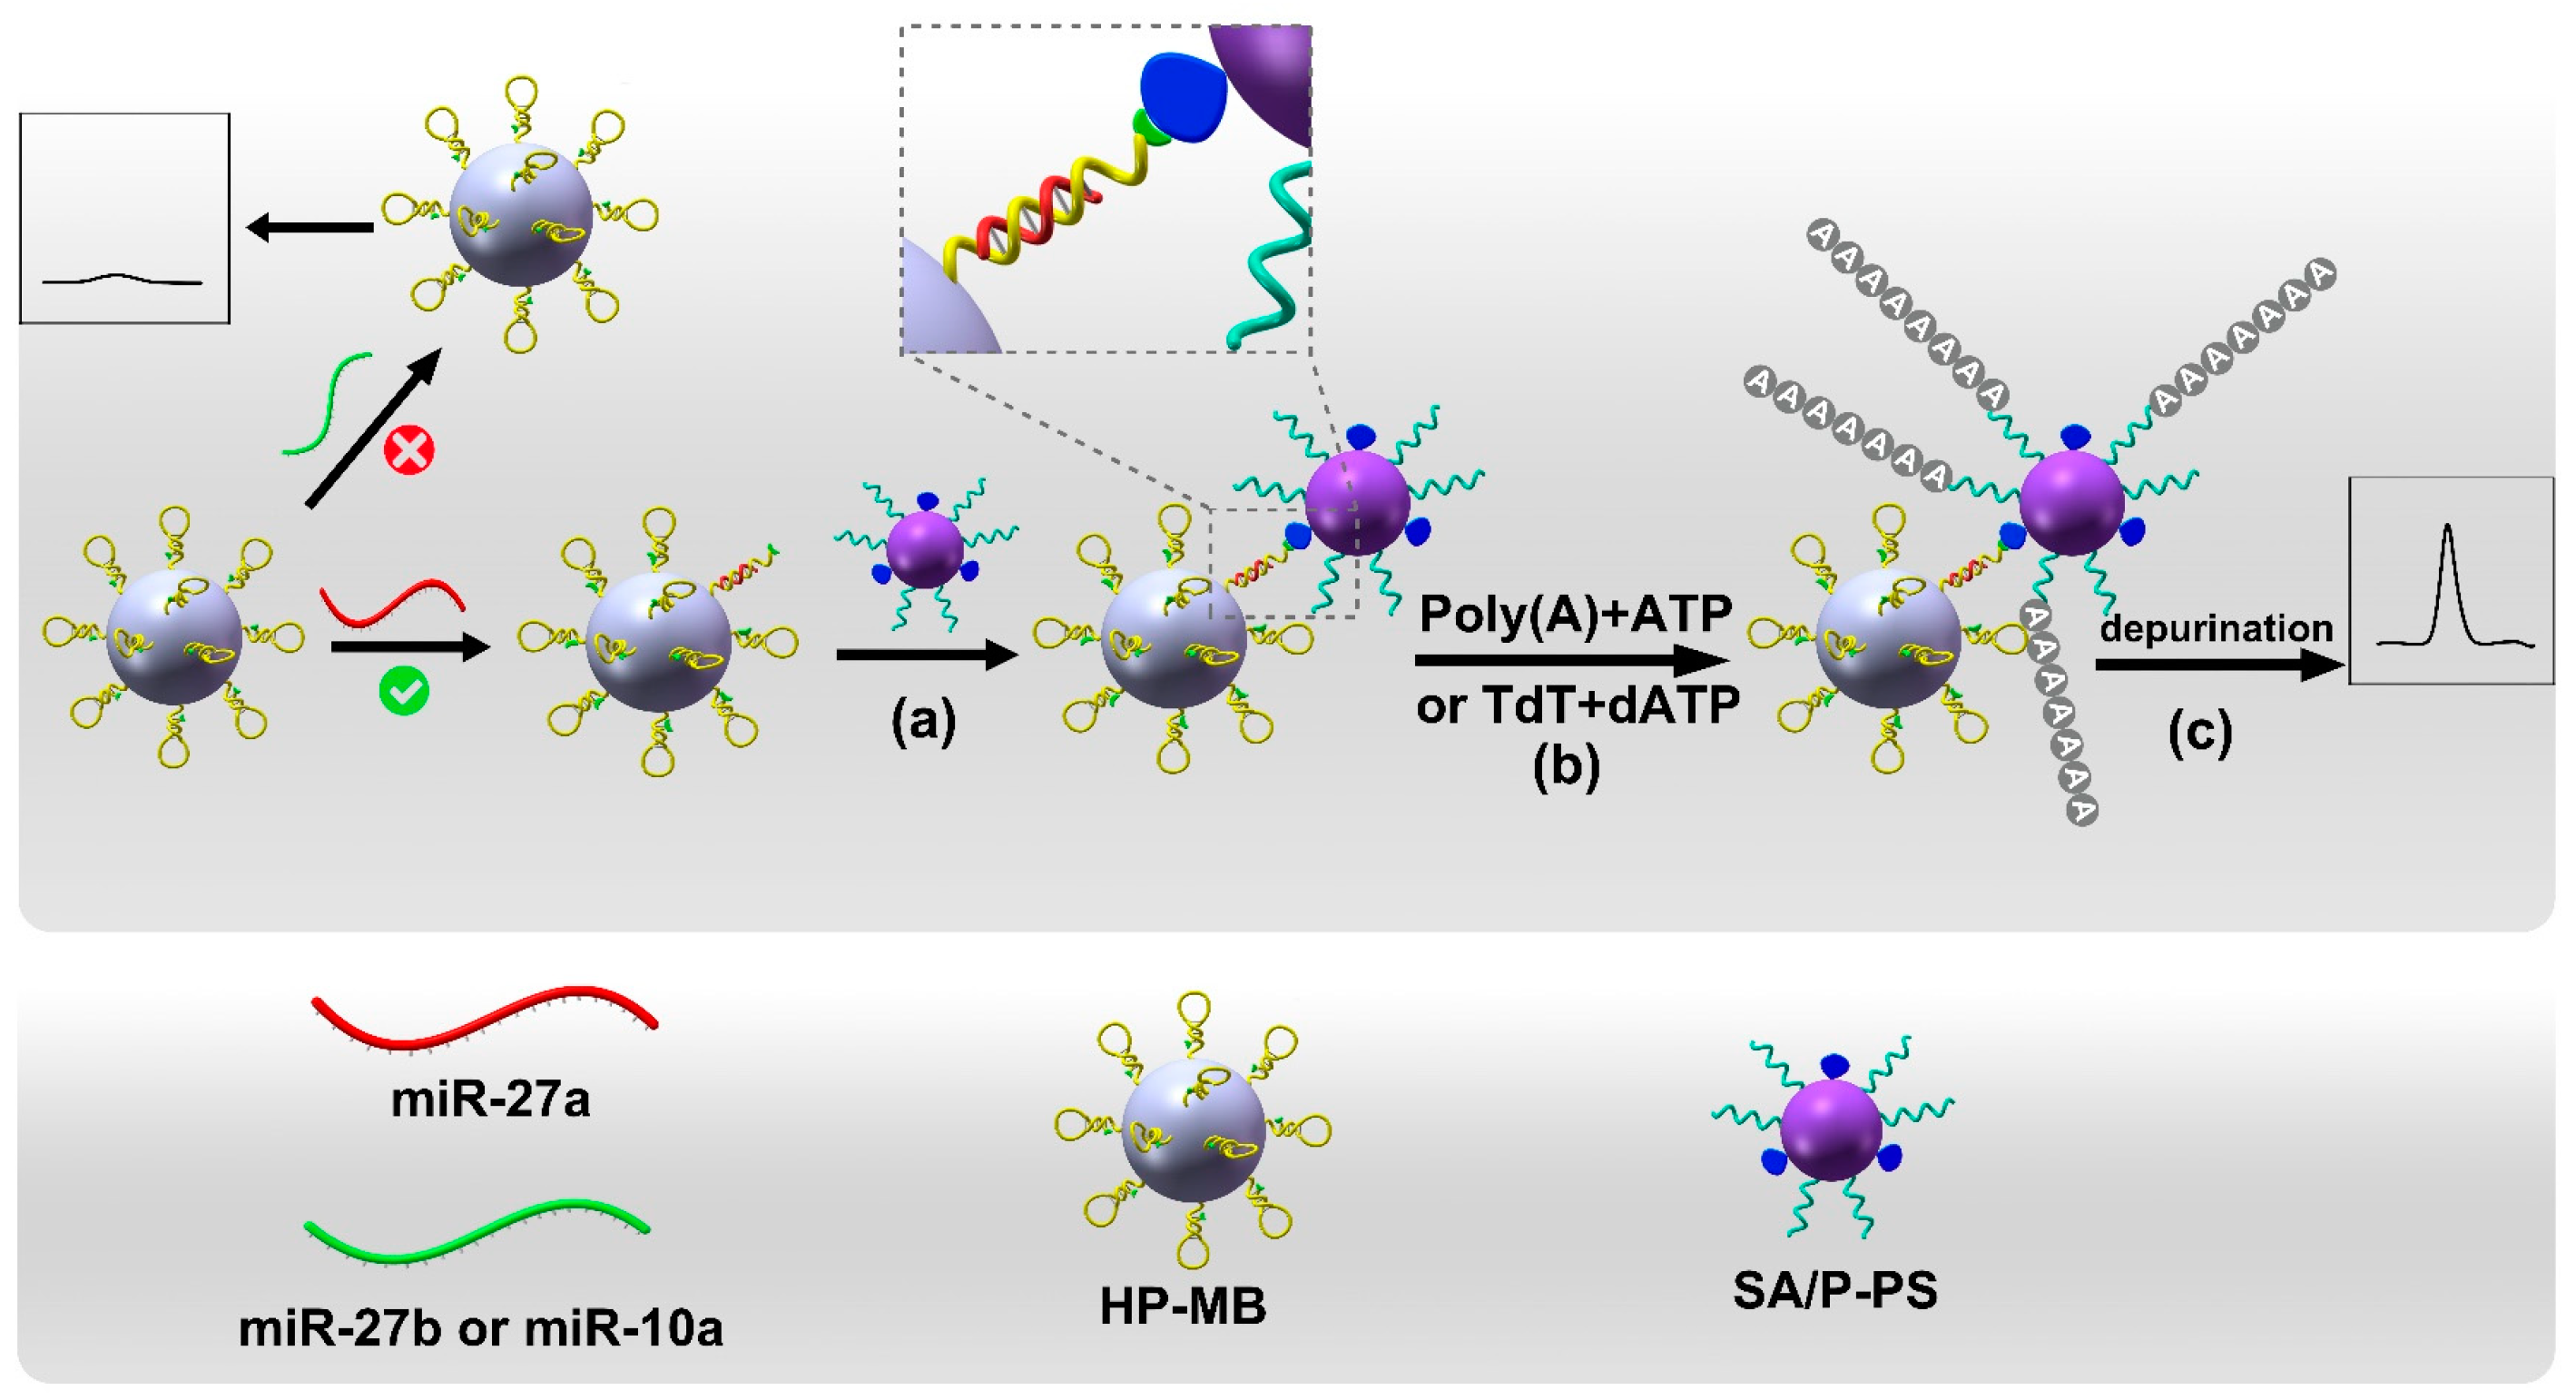
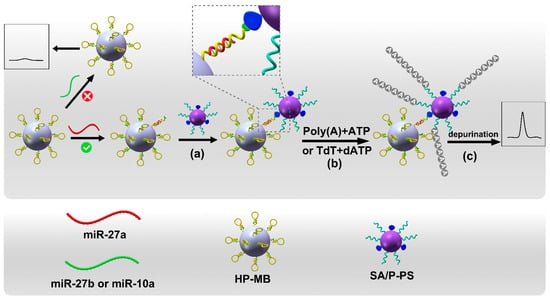
MiR-27a, which is a key biomarker of breast cancer, was selected as a target model of the experiment. The principle of the SIEP-based electrochemical approach for miRNA detection is shown in Scheme 1. Two kinds of particles are involved in this approach. One is the biotinylated HP-modified MB (HP-MB) to specifically capture and enrich the target miRNA, and the other is streptavidin- and primer-modified PS (SA/P-PS) to amplify the target signal. Samples are first incubated with HP-MB and SA/P-PS (step a). In the absence of miR-27a, the HP on MB retains its hairpin structure. The biotin group annealed at the 5′ end of HP has not been exposed for biotin–avidin interaction. When miR-27a exists, the hairpin structure is opened through hybridization with miR-27a, and the biotin group is exposed. Through biotin-avidin interaction, a conjugate of two particles is formed. After magnetic separation, the resultant conjugates are added with polymerase for SIEP (step b), followed by the addition of H2SO4 for depurination (step c). The electrochemical stripping analysis is then carried out in the presence of copper ions. A significant enhancement of the adenine signal can be obtained, which is related to the concentration of target miR-27a. In this work, a SIEP-based electrochemical approach was able to detect a specific miRNA, miR-27a, down to the attomolar level.
Scheme 1.
The principle of SIEP-based electrochemical approach for miRNA detection involved three steps: target miR-27a captured by HP-MB and linked with SA/P-PS (step a), SIEP on the primer P (step b), and stripping analysis carried out after acidic depurination of the amplification products (step c).
3.2. Characterization of Assay Process
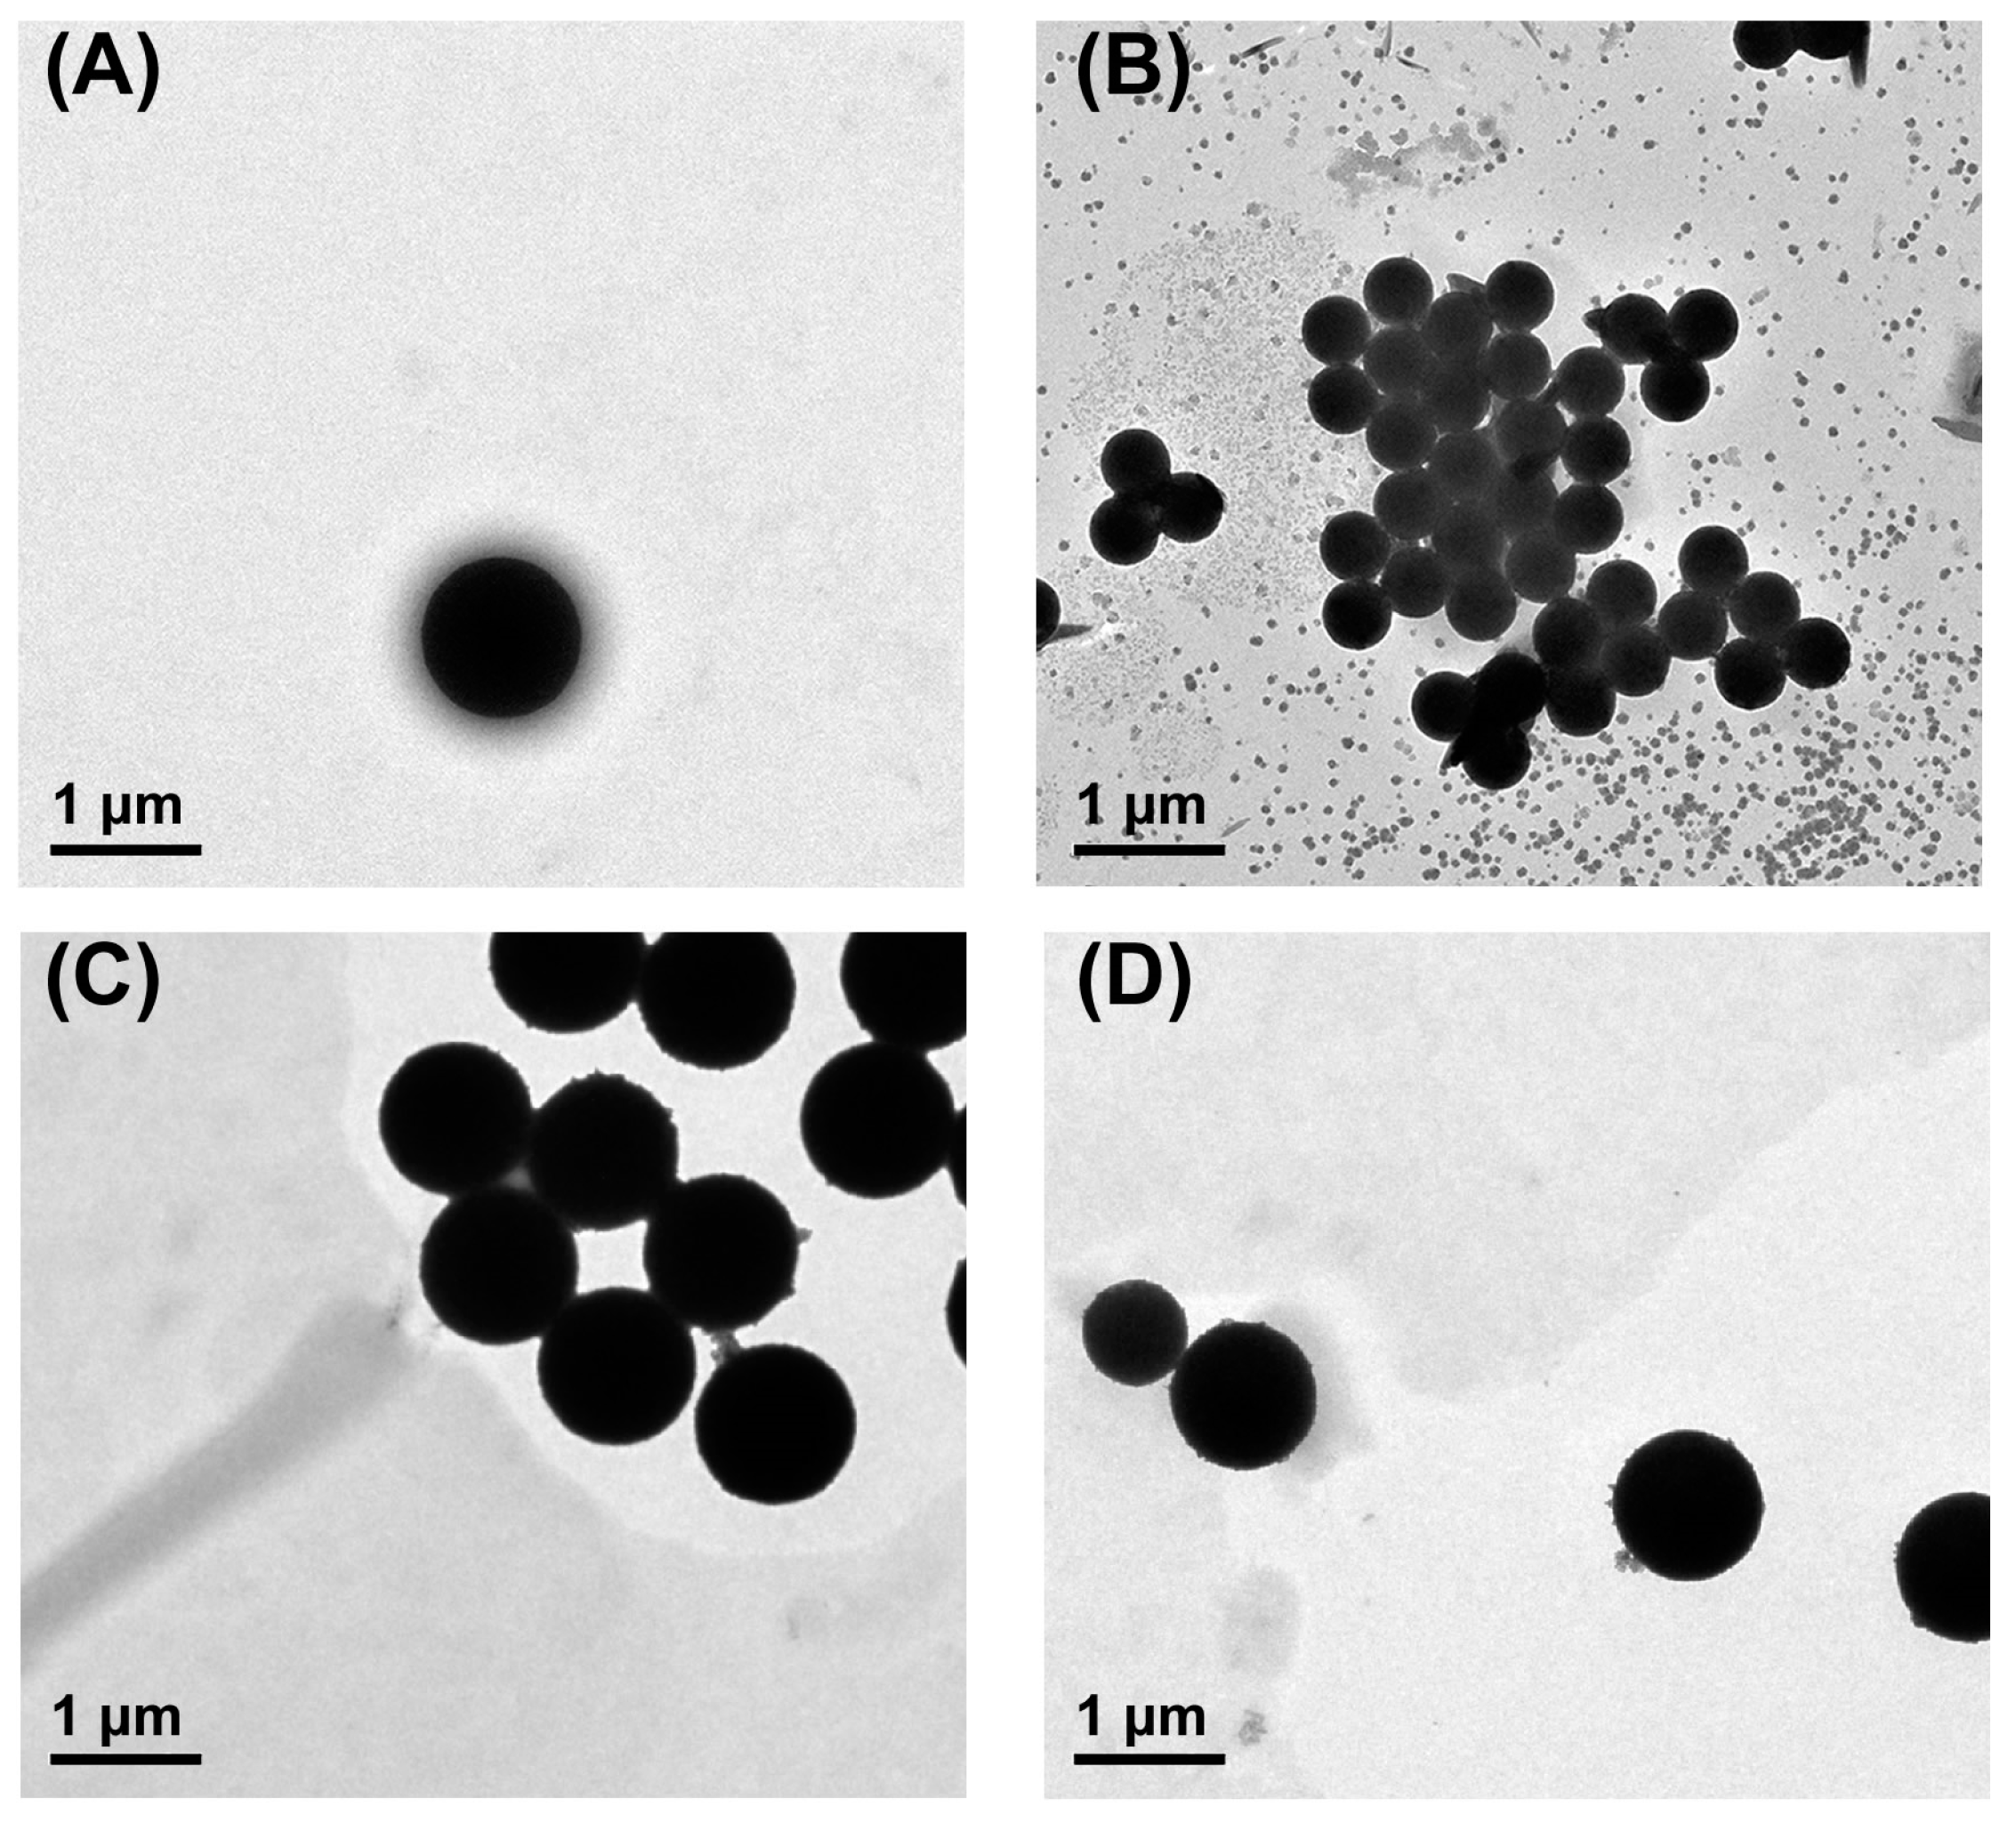
The efficient conjugate of HP-MB and SA/P-PS triggered by target miRNA is the key presupposition of the proposed assay. Thus, the formation of the conjugate was verified by TEM (Figure 1). As shown in Figure 1A, the prepared HP-MB was a microsphere with a diameter of 1 μm. Similarly, the prepared SA/P-PS showed a microsphere with an average diameter of 0.6 μm (Figure 1B). Since the miR-27 gene family primarily has two homologs, including miR-27a and miR-27b, a comparative analysis between miR-27a and miR-27b was performed to investigate the discrimination capability of the proposed platform towards this gene family. When 100 nM of miR-27b, which has a single-base difference with the target miR-27a, was incubated with HP-MB and SA/P-PS at 37 °C for 60 min and was analyzed, the final MBs showed only microspheres with a diameter of 1 μm after magnetic separation, indicating that no PS was joined to the MBs (Figure 1C). In comparison, when 1 nM of target miR-27a was analyzed, the collected MBs showed two different microspheres with diameters of 1 μm and 0.6 μm, respectively, revealing the successful ligation of PS onto the MBs (Figure 1D). The result clearly proves the efficient formation of HP-MB conjugates in the presence of miR-27a.
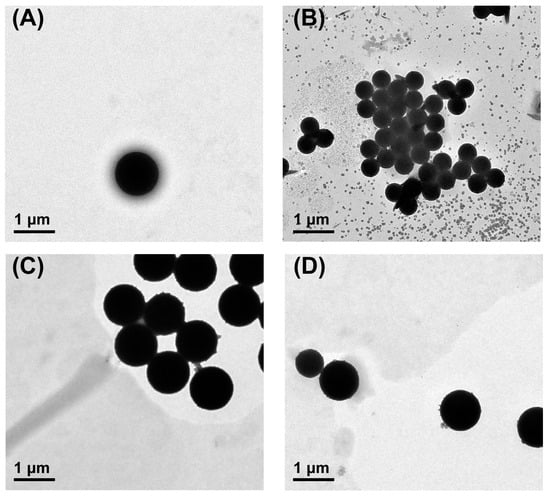
Figure 1.
TEM images of (A) HP-MB, (B) SA/P-PS, the magnetically separated product after incubating HP-MB and SA/P-PS with (C) 100 nM miR-27b, and (D) 1 nM miR-27a.
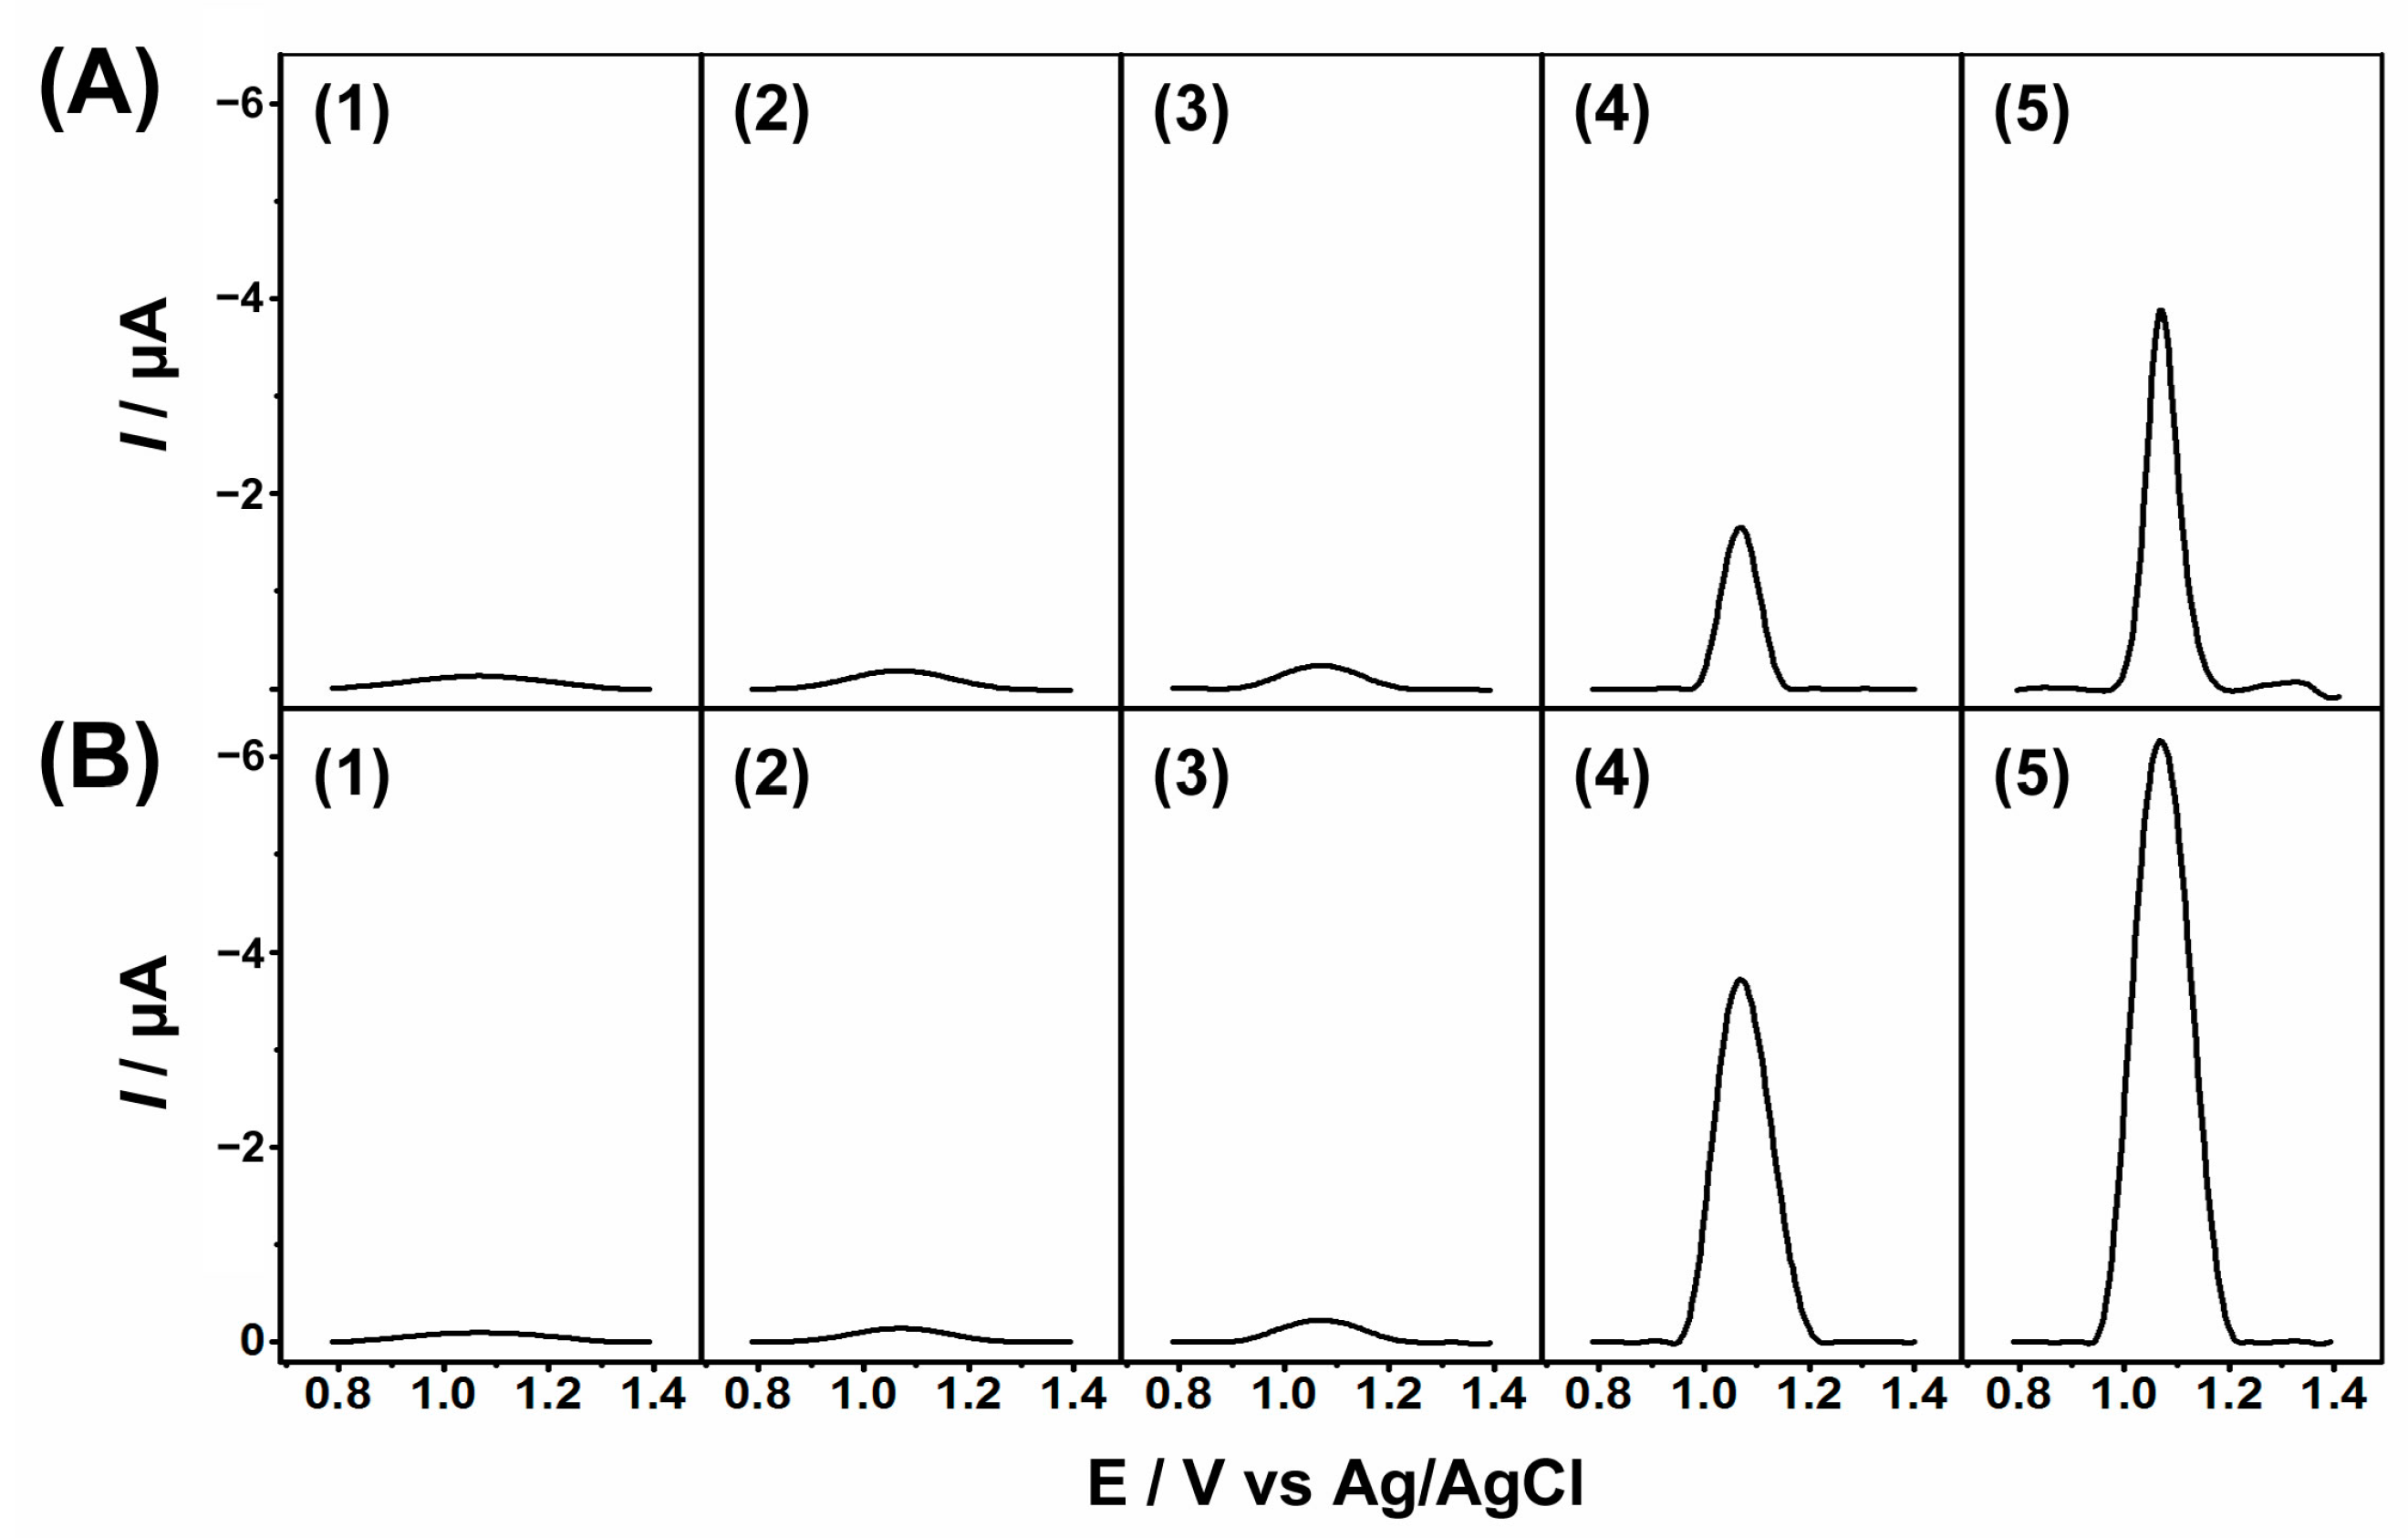
In order to further confirm that the conjugate of HP-MB and SA/P-PS was derived from target miR-27a rather than nonspecific adsorption, electrochemical stripping analysis was performed based on PAP-SIEP (Figure 2A), and TdT-SIEP (Figure 2B) due to its extremely high sensitivity. No response was observed for the blank (PBS) in both PAP-SIEP and TdT-SIEP methods (A1 and B1), indicating that nonspecific adsorptions of SA/RP-PS on HP-MB were efficiently minimized by magnetic separation. Negligible SWV signals were observed for the controls in the presence of 250 fM non-complementary (N.C.) miR-10a (A2 and B2). A similar result was shown in the presence of 250 fM miR-27b (A3 and B3). A clear SWV response of adenine at 1.14 V was observed when 120 fM miR-27a was measured (A4 and B4). When the concentration of miR-27a increased to 250 fM, a higher intensity of the SWV signal was observed (A5 and B5). The results showed that only target miR-27a could open the hairpin probe, resulting in a conjugate of PS and MB. Magnetic separation, SIEP, and depurination could then be carried out. By measuring the intensity of SWV response given by adenine, it was possible to quantify miR-27a.
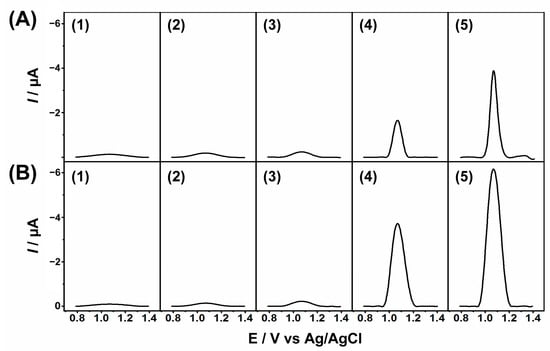
Figure 2.
SWVs based on (A) PAP-SIEP and (B) TdT-SIEP for PBS blank (1), 250 fM miR-10a (2), 250 fM miR-27b (3), 120 fM miR-27a (4) and 250 fM miR-27a (5).
3.3. Comparison of PAP- and TdT-Based SIEP
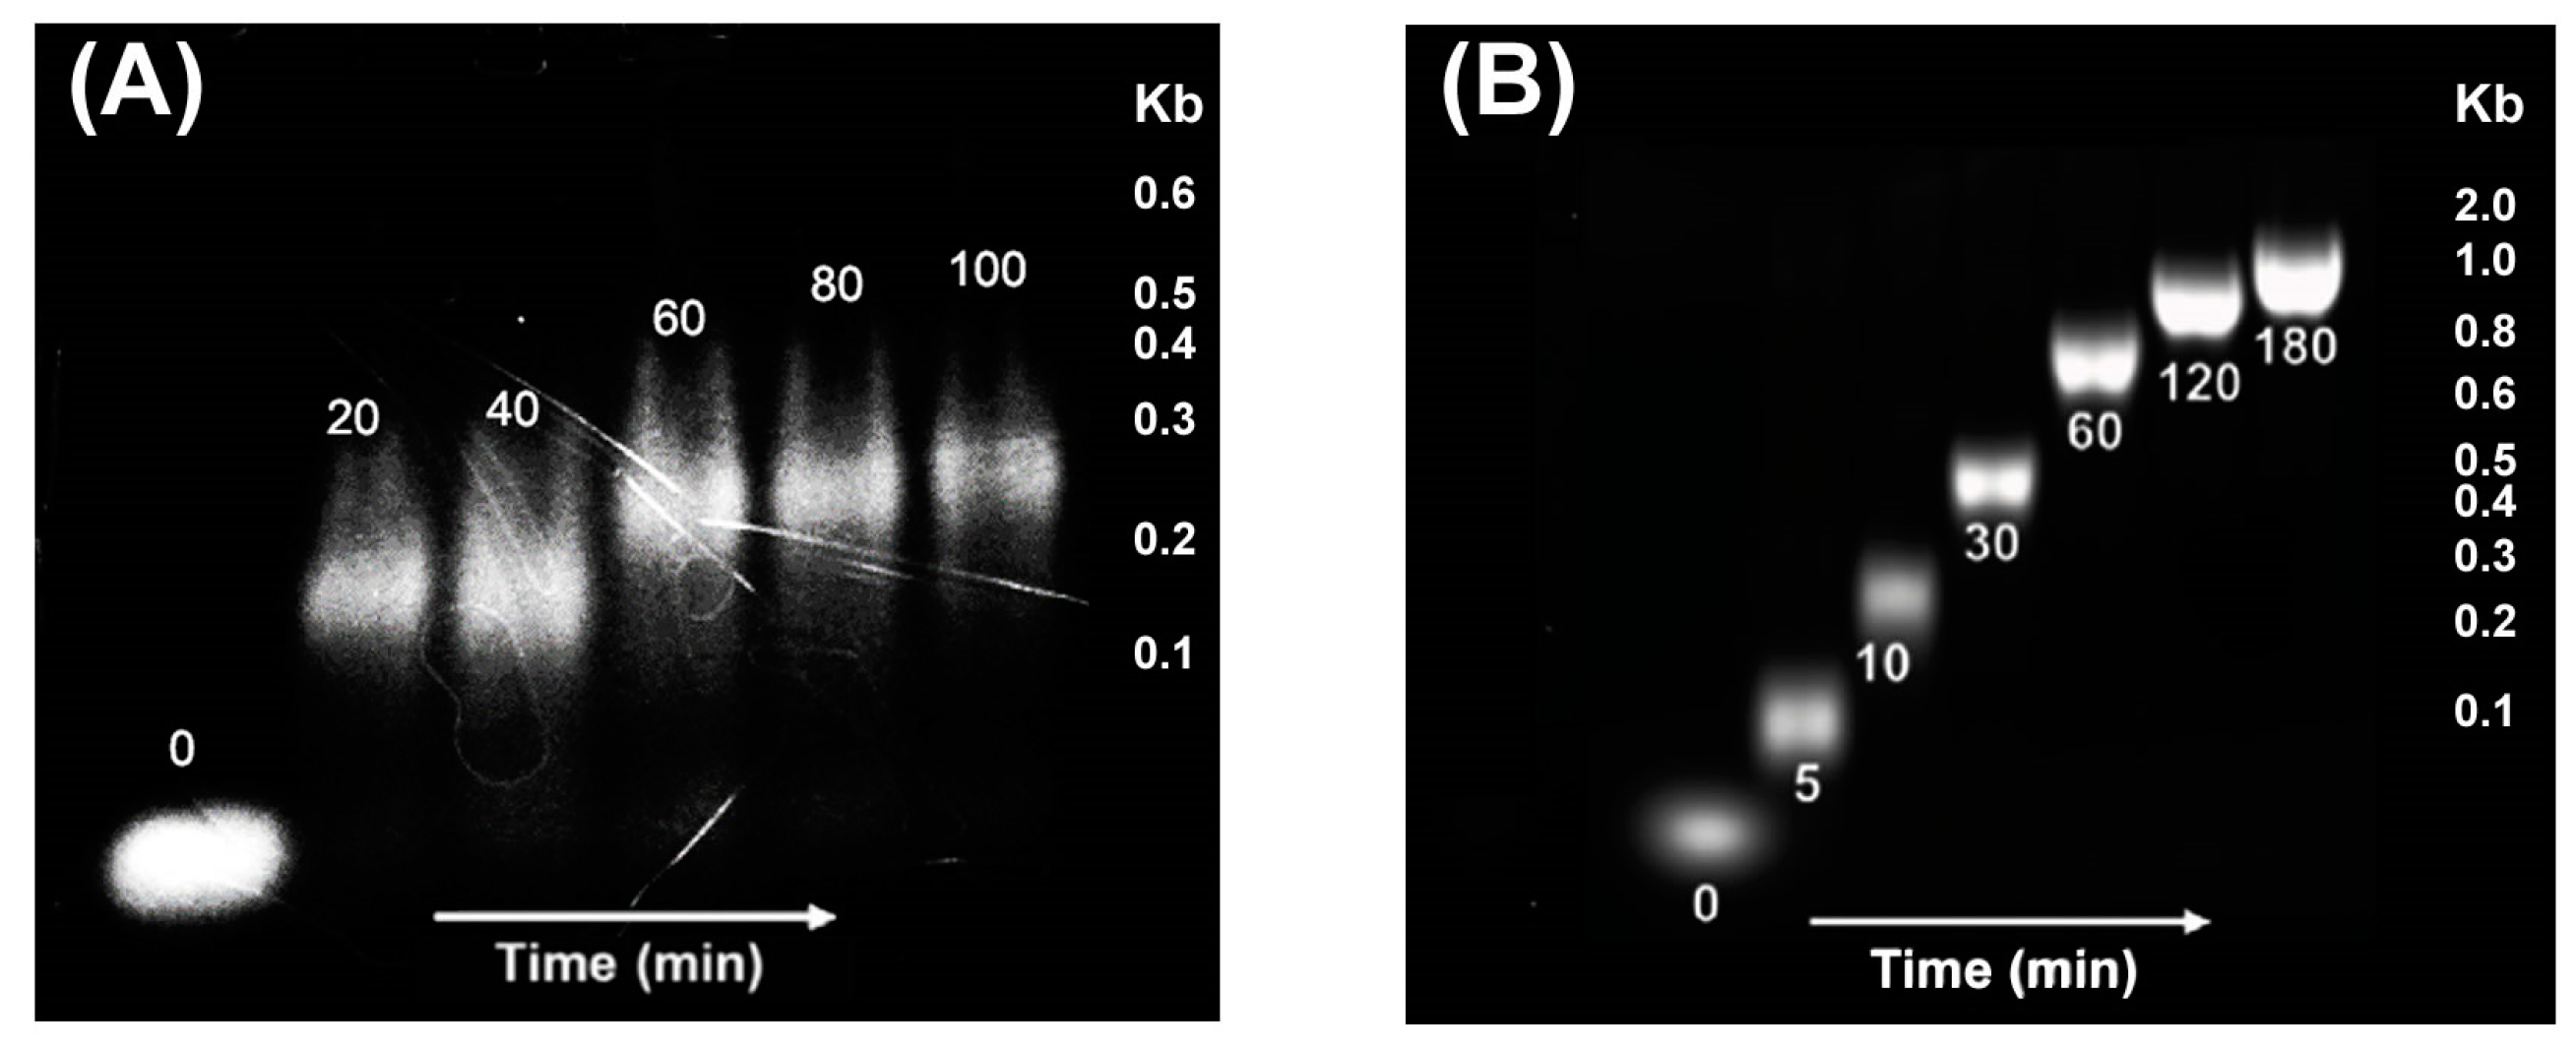
Both PAP and TdT are polymerases that allow the insertion of poly (A) tail to an oligonucleotide; however, TdT was chosen instead of PAP for this novel method. First, RNA primers are used for poly (A) tail synthesis using PAP, while DNA is used for TdT. Considering DNA is more stable than RNA, TdT would be a better choice in terms of thermostability. Second, TdT allows fast and long poly (A) tail insertion on primers compared with PAP, which was verified by gel electrophoresis. As shown in Figure 3A, RNA primer was extended to 180 nt using PAP after 20 min, while DNA primer was extended to 250 nt using TdT within 10 min (Figure 3B).
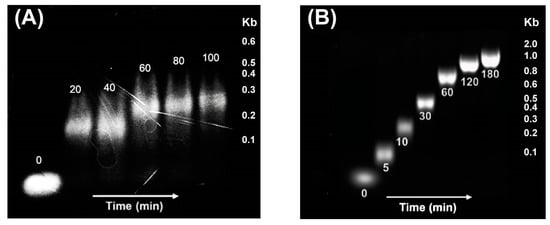
Figure 3.
Agarose gel electrophoresis shows the time-dependent growth of (A) RNA catalyzed by PAP and (B) DNA catalyzed by TdT at different times.
Moreover, the rate of polyadenylation in PAP-SIEP gradually became slower, and the length of RNA primers leveled off after 60 min, which was around 250 nt. In contrast, the length of DNA primers reached 800 nt at 60 min and kept growing. The length of DNA primers was around 1000 nt at 120 min, which was consistent with the previous report using TdT [32]. Third, the method based on TdT has a stronger electrochemical signal than PAP (Figure 2). After HP-MB incubated with SA/P-PS and 250 fM miR-27a, the resultant conjugates reacted with PAP or TdT for 120 min. The final SWV current of adenine using PAP and TdT for polyadenylation were −3.8 V and −6.1 V, respectively (A5 and B5 in Figure 2). The signal obtained using TdT as an enzyme was 1.6 times that of using PAP.
3.4. Optimization of Experimental Conditions
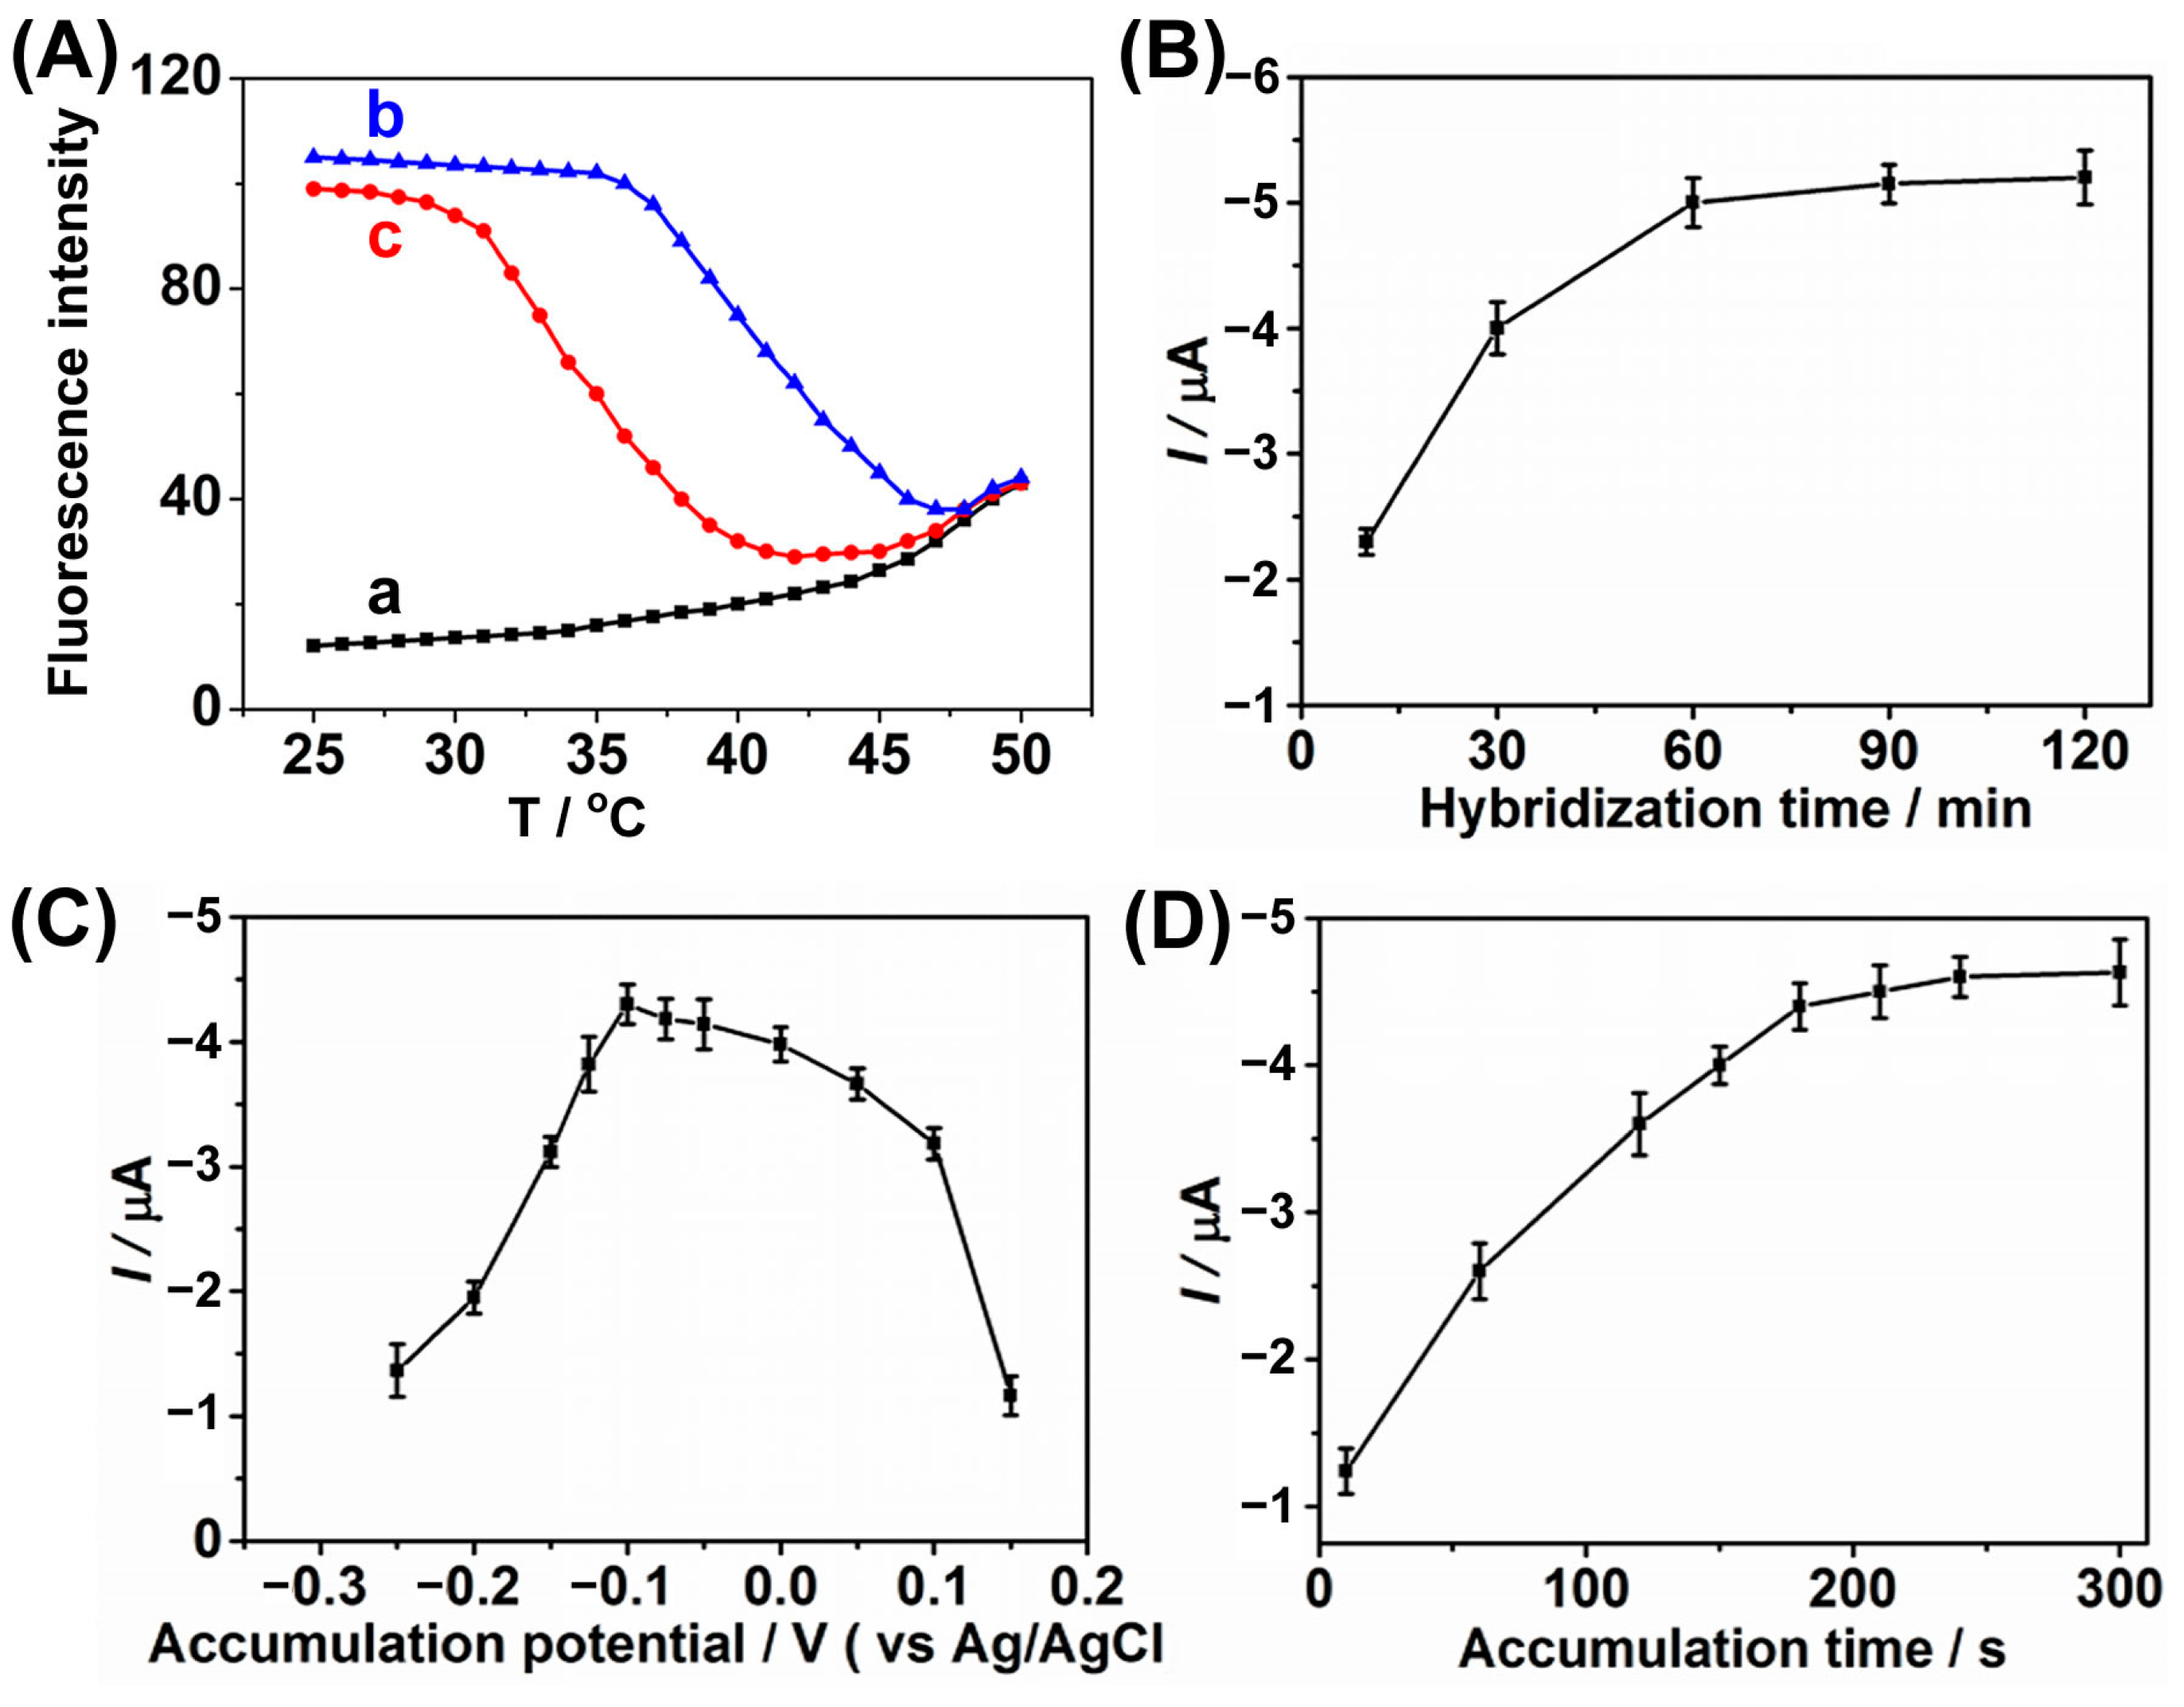
In order to achieve high sensitivity and specificity, the hybridization and parameters for SWV analysis during the analysis procedure were carefully optimized. The effect of hybridization temperature on the analysis performance of the proposed method was evaluated by using FAM-DABCYL labeled molecular beacon, which has the same sequence as the biotinylated-HP, and testing the fluorescence of the hybrid which was formed by FAM-DABCYL labeled molecular beacon and 250 fM miR-27a or miR-27b at various hybridization temperatures from 25 to 55 °C. As depicted in Figure 4A, the fluorescence of molecular beacon incubated in the absence of targets at different temperatures was first monitored (curve a). At lower temperatures, the molecular beacon was in a closed state and did not fluoresce due to a relatively close distance between the fluorophore and the quencher. However, the helical order of the stem turned to a random-coil configuration as temperatures rose, resulting in a separation of the fluorophore from the quencher and restoring fluorescence at about 50 °C. When 250 fM target miR-27a was analyzed, the strongest fluorescent signal occurred at low temperatures and diminished along with the increase in temperature, followed by an increase in fluorescence at the highest temperatures (curve b in Figure 4A). At low temperatures, the molecular beacon and target spontaneously hybridized, and thus, the molecular beacon was open and fluorescent. Whereas as the temperature rose, the molecular beacon–target duplexes became unstable, and the molecular beacon was released, returning to the closed conformation; thus, the fluorescence decreased. As the temperature rose, the closed molecular beacon melted into fluorescent random coils, which occurred at the same temperature (50 °C) as the curve without a target. When 250 fM target miR-27b (single-base mismatched target) was analyzed, similar changes in fluorescence were observed as the temperature rose (curve c in Figure 4A). However, the transition occurred at a significantly lower temperature (28 °C) than that in curve b (38 °C), suggesting a lower stability of molecular beacon–miR-27b duplexes that contained a mismatched base pair. Therefore, 37 °C was chosen as the hybridization temperature at which the target exhibited strong fluorescence while the mutant target did not.
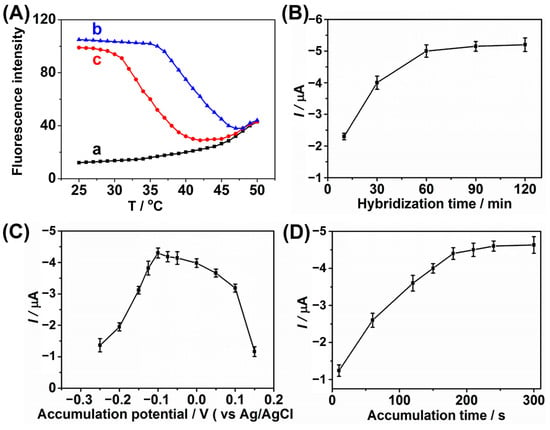
Figure 4.
(A) Thermal denaturation profiles of solutions containing FAM-DABCYL labeled molecular beacon in the absence of targets (curve a), 250 fM target miR-27a (curve b), and 250 fM mismatched miR-27b (curve c). Effects of (B) hybridization time, (C) accumulation potential, and (D) accumulation time on the SWV response.
The influence of hybridization time, accumulation potential, and accumulation time upon the SWV response was under investigation from the analysis of 250 fM miR-27a at 37 °C. The electrochemical signals of the adenine base increased rapidly with the increase in the hybridization time and leveled off at 60 min. Therefore, the hybridization procedure in the method was performed at 37 °C for 60 min (Figure 4B). The effect of accumulation potential on the current was investigated by testing 250 fM miR-27a under the deposition time of 300 s with various deposition potentials from –0.25 to 0.15 V in Figure 4C. The SWV peak current increased greatly from –0.25 to –0.1 V and reached its maximum value. The signal then gradually decreased until 0.0 V and suddenly dropped afterward. The drop of the signal after 0.0 V (vs. Ag/AgCl) was attributed to the reduction of Cu2+ to Cu+, which would participate in purine complex formation. The influence of the deposition time upon the analysis of 250 fM miR-27a was examined under the deposition potential of −0.1 V with various deposition times from 10 to 300 s in Figure 4D. The SWV current increased along with the deposition time prolonged to 200 s and leveled off after the deposition time longer than 200 s. Therefore, stripping analysis was carried out under −0.1 V with an accumulation time of 200 s.
3.5. Calibration Curves for MiRNAs Detection
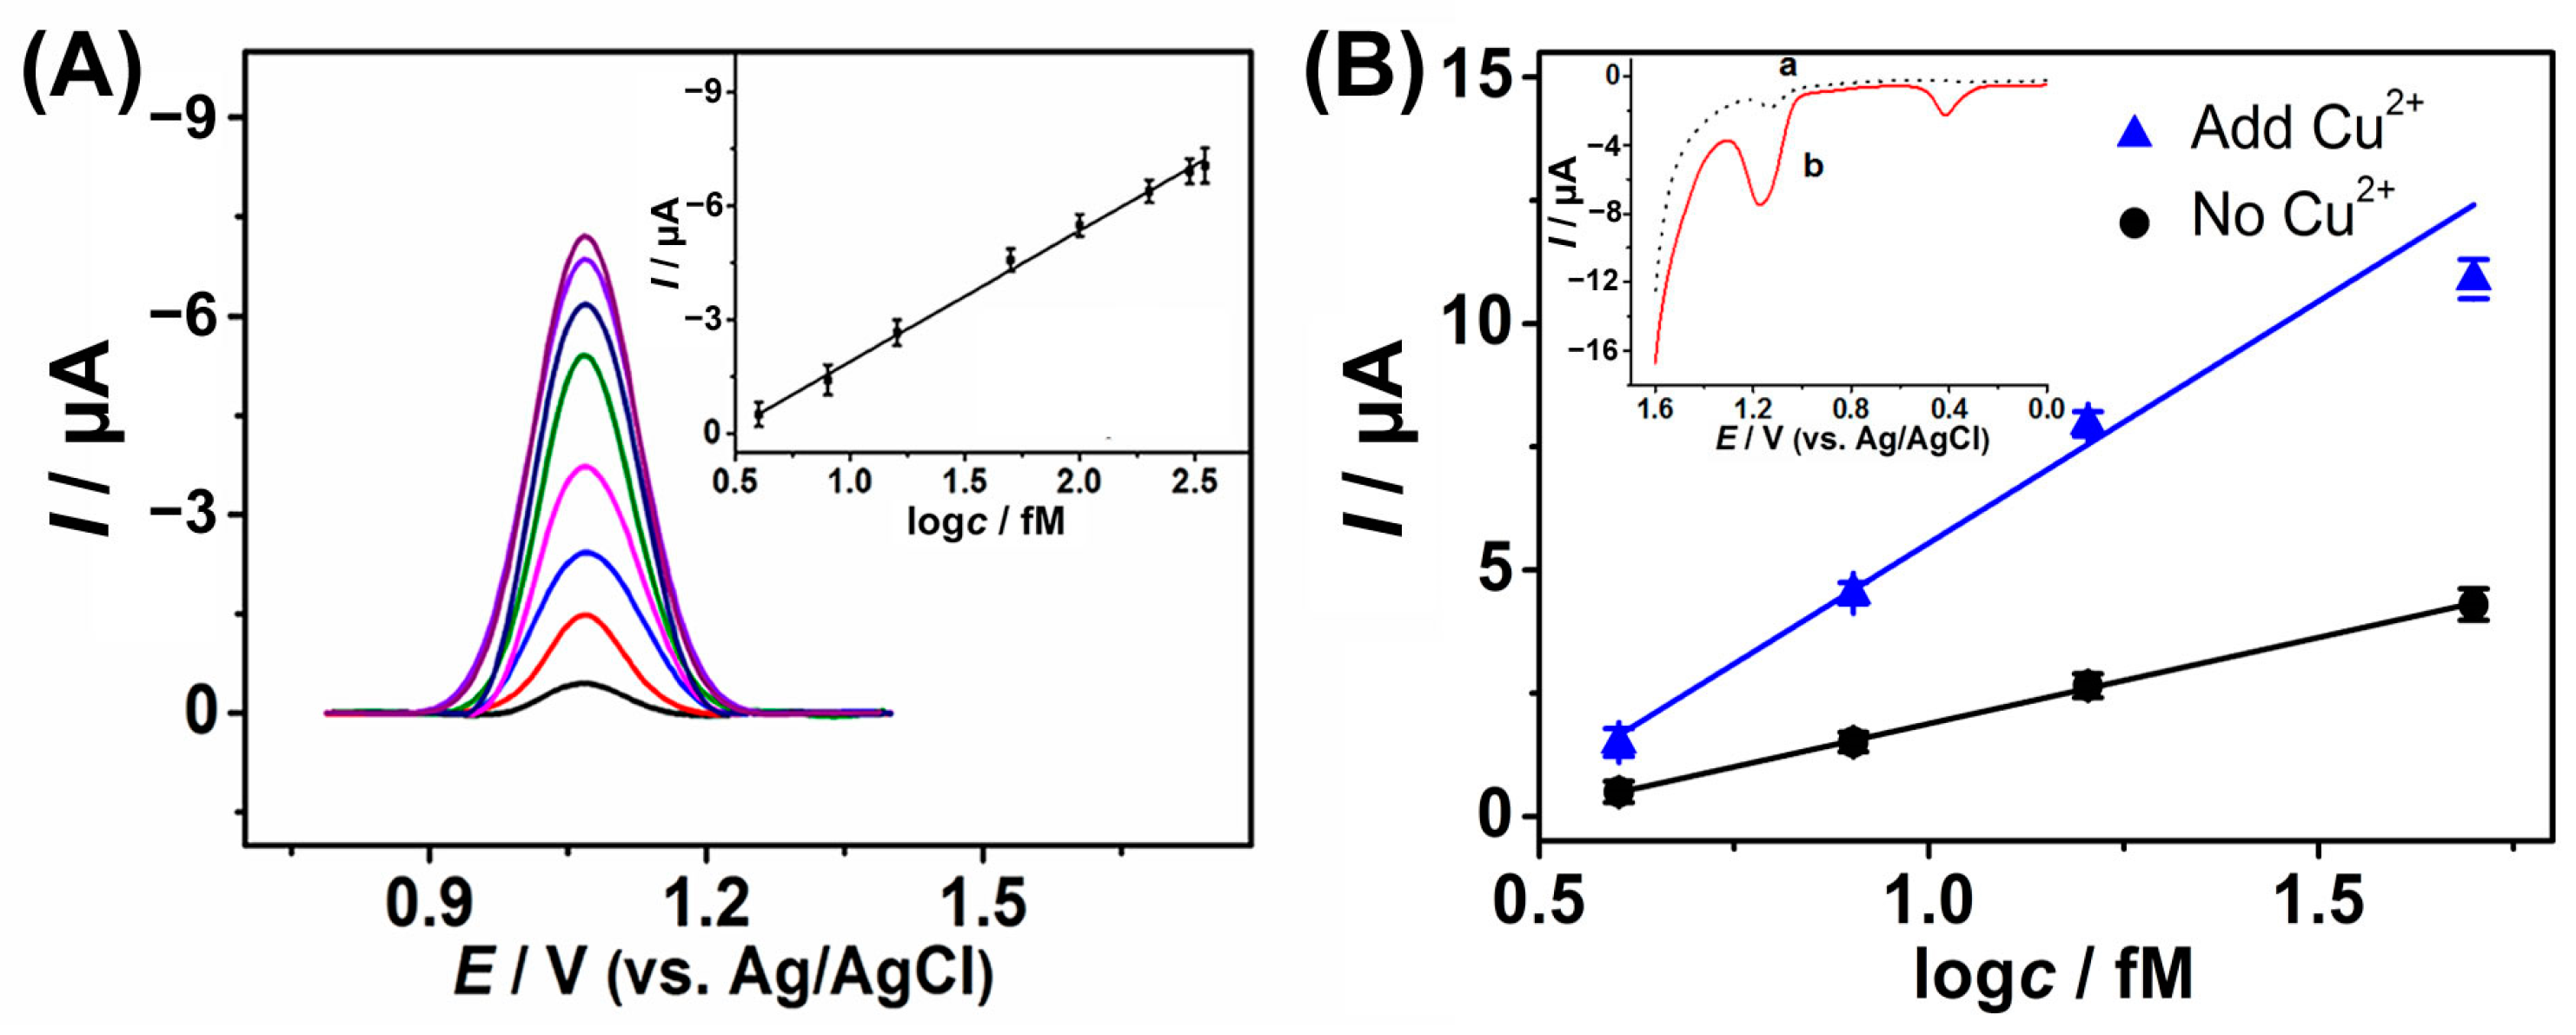
Under the optimal conditions, quantitative analysis of miRNAs was allowed by plotting the calibration curve of current (I) against the logarithm of the concentration of target miRNA (logc). As shown in Figure 5A, the greater the concentration of miRNA was, the higher the adenine stripping peak would be. The adenine signal increased linearly with increasing the logarithm of the concentration of target miRNA. The linear range was 4–350 fM with a linear regression equation of I (μA) = −3.46 logc (fM) + 1.57 (R2 = 0.996) and a limit of detection (LOD) of 800 aM (S/N = 3).
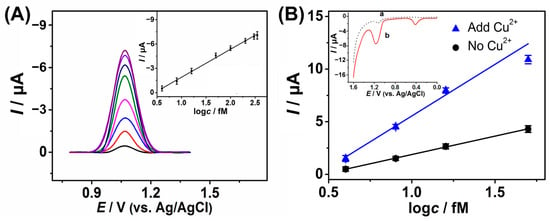
Figure 5.
(A) SWVs of miR-27a at concentrations of 4, 8, 16, 50, 100, 200, 300, and 350 fM (from 1 to 8). Inset is the linear relationship between peak current and the logarithm of concentration. (B) Plots of peak current of miR-27a at concentrations of 4, 8, 16, and 50 fM in the absence/presence of 2 mg L−1 Cu2+. Inset are DPVs of 16 fM miR-27a after TdT-based SIEP in the absence (a) and the presence (b) of 2 mg L−1 Cu2+.
It has been reported that the voltammetric response of free (monomeric) guanine and adenine nucleobases can be further enhanced upon the presence of copper (II) ions due to the accumulation of the copper(II)–purine complex [21]. The inset of Figure 5B showed the SWV responses at the pencil electrode for 16 fM miR-27a after the TdT-SIEP-based method in the absence/presence of Cu2+. The adsorptive accumulation of free adenine nucleobases resulted in small anodic peak formation at 1.1 V (inserted curve a), while substantial enhancement of the signal at 1.1 V was observed in the presence of Cu2+, forming Cu2+–purine complex at 0.35 V at the same time (inserted curve b). The peak current displayed a 6.6-fold signal enhancement in the presence of Cu2+. As a result, Cu2+ was added in order to increase the sensitivity of the detection method. As depicted in Figure 5B, when 2 mg L−1 Cu2+ was used, the peak current increased greatly with the concentration of miR-27a. The linear range was 4–50 fM with a linear regression equation of I (μA) = −9.81 logc (fM) + 4.26 (R2 = 0.992), and the LOD was down to 120 aM (S/N = 3). The detection performance was comparable to and even better than most reported nanomaterials-based electrochemical assays for miRNA detection (Table 2) [26,33,34,35,36,37] but without sophisticated electrode modifications. The high sensitivity of this method can be attributed to the three amplification strategies, including magnetic enrichment, enzymatic polymerization, and the use of Cu2+ ions in SWV.

Table 2.
Comparison of nanomaterials-based electrochemical detection for miRNA 1.
3.6. Precision and Recovery
The precision of the method was evaluated by the assays of samples for five replicate measurements. The RSDs% (relative standard deviations) were measured as 3.3%, 4.1%, and 3.9% for 8, 16, and 50 fM miR-27a, respectively. Furthermore, the testing recovery of the method was evaluated. The healthy human serum sample was diluted 10 times by hybridization buffer and first analyzed with the proposed method to test the potential interferences. The SWV signal for the diluted serum sample was similar to that for the PBS blank (data not shown), suggesting the absence of interferences. Then, the diluted serum sample was added with 16.0 fM and 50.0 fM miR-27a, respectively, to construct the artificial serum samples with low and high miR-27a levels. After the addition of two different concentrations of miR-27a (5.0 fM and 25.0 fM, respectively) in the artificial serum sample, the SWV responses for five replicate measurements were analyzed with the above linear regression equation to calculate the found concentration. The results demonstrate that the method can profile miRNAs in serum matrix with recoveries in the range of 91.9–100.9% (Table 3), indicating an acceptable accuracy and reliability.

Table 3.
Recovery values for the analysis of the miR-27a in human serum samples.
4. Conclusions
We have established an ultrasensitive three-fold amplification electrochemical approach for miRNA detection, which is able to achieve a detection limit of 120 aM after optimizing the experimental conditions. By taking advantage of electrochemical analysis (i.e., enabling low-cost, high sensitivity, and selectivity), this method is not only suited for research purposes but also can be applied in clinical aspects. With its high reproducibility and agreeable accuracy, it can be guaranteed that our newly developed method allows potential future clinical miRNA testing.
Author Contributions
Conceptualization, W.Z. and Z.D.; methodology, W.Z., Y.X., Y.Z., S.-Y.L., and Z.D.; investigation, W.Z., Y.X., and Z.D.; resources, X.Z.; data curation, W.Z., Y.X., and Y.Z.; writing—original draft preparation, W.Z. and Y.X.; writing—review and editing, Y.X. and Z.D.; supervision, Z.D. and X.Z.; project administration, Z.D. and X.Z.; funding acquisition, Y.X. and Z.D. All authors have read and agreed to the published version of the manuscript.
Funding
This research was funded by the National Natural Science Foundation of China (22274169), the Guangdong Natural Science Foundation (2023A1515012027), and the Guangdong Science and Technology Plan Project Grant (2020B1212060077). No APC was charged.
Institutional Review Board Statement
Not applicable.
Informed Consent Statement
Not applicable.
Data Availability Statement
All data generated or analyzed during this study are included in this published article or are available from the authors upon request.
Conflicts of Interest
The authors declare no conflict of interest.
References
- Yang, H.; Chen, J.; Yang, S.; Zhang, T.; Xia, X.; Zhang, K.; Deng, S.; He, G.; Gao, H.; He, Q.; et al. CRISPR/Cas14a-based isothermal amplification for profiling plant microRNAs. Anal. Chem. 2021, 93, 12602–12608. [Google Scholar] [CrossRef] [PubMed]
- Qian, Q.; Tang, Y.; Miao, P. Quantification of multiplex miRNAs by mass spectrometry with duplex-specific nuclease-mediated amplification. Anal. Chem. 2023, 95, 11578–11582. [Google Scholar] [CrossRef] [PubMed]
- Wang, N.; Zhang, J.; Xiao, B.; Sun, X.; Xie, R.; Chen, A. Recent advances in the rapid detection of microRNA with lateral flow assays. Biosens. Bioelectron. 2022, 211, 114345. [Google Scholar] [CrossRef] [PubMed]
- Zhang, J.; Cao, Z.; Yang, G.; You, L.; Zhang, T.; Zhao, Y. MicroRNA-27a (miR-27a) in solid tumors: A review based on mechanisms and clinical observations. Front. Oncol. 2019, 9, 893. [Google Scholar] [CrossRef]
- Kim, S.Y.; Jeon, T.Y.; Choi, C.I.; Kim, D.H.; Kim, D.H.; Kim, G.H.; Ryu, D.Y.; Lee, B.E.; Kim, H.H. Validation of circulating miRNA biomarkers for predicting lymph node metastasis in gastric cancer. J. Mol. Diagn. 2013, 15, 661–669. [Google Scholar] [CrossRef]
- Koscianska, E.; Starega-Roslan, J.; Sznajder, L.J.; Olejniczak, M.; Galka-Marciniak, P.; Krzyzosiak, W.J. Northern blotting analysis of microRNAs, their precursors and RNA interference triggers. BMC Mol. Biol. 2011, 12, 14. [Google Scholar] [CrossRef]
- Canning, A.J.; Chen, X.; Li, J.Q.; Jeck, W.R.; Wang, H.-N.; Vo-Dinh, T. miRNA probe integrated biosensor platform using bimetallic nanostars for amplification-free multiplexed detection of circulating colorectal cancer biomarkers in clinical samples. Biosens. Bioelectron. 2023, 220, 114855. [Google Scholar] [CrossRef]
- Luo, Z.; Zhang, S.; Feng, Q.; Zhou, Y.; Jin, L.; Sun, J.; Chen, Y.; Jia, K.; Chu, L. Target recognition initiated self-dissociation based DNA nanomachine for sensitive and accurate MicroRNA (miRNA) detection. Anal. Biochem. 2023, 662, 115014. [Google Scholar] [CrossRef]
- Tran, H.V.; Piro, B. Recent trends in application of nanomaterials for the development of electrochemical microRNA biosensors. Microchim. Acta 2021, 188, 128. [Google Scholar] [CrossRef]
- Gao, Z.; Yang, Z. Detection of microRNAs using electrocatalytic nanoparticle tags. Anal. Chem. 2006, 78, 1470–1477. [Google Scholar] [CrossRef]
- Gao, Z.; Yu, Y.H. Direct labeling microRNA with an electrocatalytic moiety and its application in ultrasensitive microRNA assays. Biosens. Bioelectron. 2007, 22, 933–940. [Google Scholar] [CrossRef]
- Shabaninejad, Z.; Yousefi, F.; Movahedpour, A.; Ghasemi, Y.; Dokanehiifard, S.; Rezaei, S.; Aryan, R.; Savardashtaki, A.; Mirzaei, H. Electrochemical-based biosensors for microRNA detection: Nanotechnology comes into view. Anal. Biochem. 2019, 581, 113349. [Google Scholar] [CrossRef]
- Labib, M.; Khan, N.; Ghobadloo, S.M.; Cheng, J.; Pezacki, J.P.; Berezovski, M.V. Three-mode electrochemical sensing of ultralow microRNA levels. J. Am. Chem. Soc. 2013, 135, 3027–3038. [Google Scholar] [CrossRef]
- Liu, L.; Xia, N.; Liu, H.; Kang, X.; Liu, X.; Xue, C.; He, X. Highly sensitive and label-free electrochemical detection of microRNAs based on triple signal amplification of multifunctional gold nanoparticles, enzymes and redox-cycling reaction. Biosens. Bioelectron. 2014, 53, 399–405. [Google Scholar] [CrossRef]
- Miao, P.; Wang, B.; Yu, Z.; Zhao, J.; Tang, Y. Ultrasensitive electrochemical detection of microRNA with star trigon structure and endonuclease mediated signal amplification. Biosens. Bioelectron. 2015, 63, 365–370. [Google Scholar] [CrossRef]
- Zhu, W.; Su, X.; Gao, X.; Dai, Z.; Zou, X. A label-free and PCR-free electrochemical assay for multiplexed microRNA profiles by ligase chain reaction coupling with quantum dots barcodes. Biosens. Bioelectron. 2014, 53, 414–419. [Google Scholar] [CrossRef] [PubMed]
- Akin, M.; Bekmezci, M.; Bayat, R.; Coguplugil, Z.K.; Sen, F.; Karimi, F.; Karimi-Maleh, H. Mobile device integrated graphene oxide quantum dots based electrochemical biosensor design for detection of miR-141 as a pancreatic cancer biomarker. Electrochim. Acta 2022, 435, 141390. [Google Scholar] [CrossRef]
- Tran, H.V.; Piro, B.; Reisberg, S.; Huy Nguyen, L.; Dung Nguyen, T.; Duc, H.T.; Pham, M.C. An electrochemical ELISA-like immunosensor for miRNAs detection based on screen-printed gold electrodes modified with reduced graphene oxide and carbon nanotubes. Biosens. Bioelectron. 2014, 62, 25–30. [Google Scholar] [CrossRef]
- Wu, X.; Chai, Y.; Yuan, R.; Zhuo, Y.; Chen, Y. Dual signal amplification strategy for enzyme-free electrochemical detection of microRNAs. Sensor. Actuat. B-Chem. 2014, 203, 296–302. [Google Scholar] [CrossRef]
- Gan, X.; Qiu, F.; Yuan, R.; Xiang, Y. Biobarcode and sequence-responsive DNA nanocapsules for label-free and sensitive electrochemical detection of circulating tumor cells. Sensor. Actuat. B-Chem. 2022, 368, 132207. [Google Scholar] [CrossRef]
- Wang, J.; Kawde, A.-N. Amplified label-free electrical detection of DNA hybridization. Analyst 2002, 127, 383–386. [Google Scholar] [CrossRef]
- Wang, J.; Liu, G.; Rasul Jan, M.; Zhu, Q. Electrochemical detection of DNA hybridization based on carbon-nanotubes loaded with CdS tags. Electrochem. Commun. 2003, 5, 1000–1004. [Google Scholar] [CrossRef]
- Moreels, I.; Lambert, K.; Smeets, D.; De Muynck, D.; Nollet, T.; Martins, J.C.; Vanhaecke, F.; Vantomme, A.; Delerue, C.; Allan, G.; et al. Size-dependent optical properties of colloidal PbS quantum dots. ACS Nano 2009, 3, 3023–3030. [Google Scholar] [CrossRef]
- Miao, P.; Wang, B.; Meng, F.; Yin, J.; Tang, Y. Ultrasensitive detection of microRNA through rolling circle amplification on a DNA tetrahedron decorated electrode. Bioconjugate Chem. 2015, 26, 602–607. [Google Scholar] [CrossRef] [PubMed]
- Yang, J.; Tang, M.; Diao, W.; Cheng, W.; Zhang, Y.; Yan, Y. Electrochemical strategy for ultrasensitive detection of microRNA based on MNAzyme-mediated rolling circle amplification on a gold electrode. Microchim. Acta 2016, 183, 3061–3067. [Google Scholar] [CrossRef]
- Zhou, H.; Zhang, J.; Li, B.; Liu, J.; Xu, J.-J.; Chen, H.-Y. Dual-mode SERS and electrochemical detection of miRNA based on popcorn-like gold nanofilms and toehold-mediated strand displacement amplification reaction. Anal. Chem. 2021, 93, 6120–6127. [Google Scholar] [CrossRef]
- Yuan, Y.-H.; Wu, Y.-D.; Chi, B.-Z.; Wen, S.-H.; Liang, R.-P.; Qiu, J.-D. Simultaneously electrochemical detection of microRNAs based on multifunctional magnetic nanoparticles probe coupling with hybridization chain reaction. Biosens. Bioelectron. 2017, 97, 325–331. [Google Scholar] [CrossRef]
- Cheng, H.; Li, W.; Duan, S.; Peng, J.; Liu, J.; Ma, W.; Wang, H.; He, X.; Wang, K. Mesoporous silica containers and programmed catalytic hairpin assembly/hybridization chain reaction based electrochemical sensing platform for microRNA ultrasensitive detection with low background. Anal. Chem. 2019, 91, 10672–10678. [Google Scholar] [CrossRef] [PubMed]
- Zhou, L.; Wang, Y.; Yang, C.; Xu, H.; Luo, J.; Zhang, W.; Tang, X.; Yang, S.; Fu, W.; Chang, K.; et al. A label-free electrochemical biosensor for microRNAs detection based on DNA nanomaterial by coupling with Y-shaped DNA structure and non-linear hybridization chain reaction. Biosens. Bioelectron. 2019, 126, 657–663. [Google Scholar] [CrossRef] [PubMed]
- Miao, P.; Tang, Y. Cascade strand displacement and bipedal walking based DNA logic system for miRNA diagnostics. ACS Cent. Sci. 2021, 7, 1036–1044. [Google Scholar] [CrossRef]
- Hasoň, S.; Fojta, M.; Ostatná, V. Label-free electrochemical analysis of purine nucleotides and nucleobases at disposable carbon electrodes in microliter volumes. J. Electroanal. Chem. 2019, 847, 113252. [Google Scholar] [CrossRef]
- Tjong, V.; Yu, H.; Hucknall, A.; Rangarajan, S.; Chilkoti, A. Amplified on-chip fluorescence detection of DNA hybridization by surface-initiated enzymatic polymerization. Anal. Chem. 2011, 83, 5153–5159. [Google Scholar] [CrossRef] [PubMed]
- Zhang, W.; Xu, H.; Zhao, X.; Tang, X.; Yang, S.; Yu, L.; Zhao, S.; Chang, K.; Chen, M. 3D DNA nanonet structure coupled with target-catalyzed hairpin assembly for dual-signal synergistically amplified electrochemical sensing of circulating microRNA. Anal. Chim. Acta 2020, 1122, 39–47. [Google Scholar] [CrossRef] [PubMed]
- Povedano, E.; Ruiz-Valdepeñas Montiel, V.; Gamella, M.; Serafín, V.; Pedrero, M.; Moranova, L.; Bartosik, M.; Montoya, J.J.; Yáñez-Sedeño, P.; Campuzano, S.; et al. A novel zinc finger protein–based amperometric biosensor for miRNA determination. Anal. Bioanal. Chem. 2019, 412, 5031–5041. [Google Scholar] [CrossRef] [PubMed]
- Luo, L.; Wang, L.; Zeng, L.; Wang, Y.; Weng, Y.; Liao, Y.; Chen, T.; Xia, Y.; Zhang, J.; Chen, J. A ratiometric electrochemical DNA biosensor for detection of exosomal MicroRNA. Talanta 2020, 207, 120298. [Google Scholar] [CrossRef]
- Zhu, D.; Liu, W.; Zhao, D.; Hao, Q.; Li, J.; Huang, J.; Shi, J.; Chao, J.; Su, S.; Wang, L. Label-free electrochemical sensing platform for microRNA-21 detection using thionine and gold nanoparticles Co-functionalized MoS2 Nanosheet. ACS Appl. Mater. Inter. 2017, 9, 35597–35603. [Google Scholar] [CrossRef]
- Tian, R.; Li, Y.; Bai, J. Hierarchical assembled nanomaterial paper based analytical devices for simultaneously electrochemical detection of microRNAs. Anal. Chim. Acta 2019, 1058, 89–96. [Google Scholar] [CrossRef]
Disclaimer/Publisher’s Note: The statements, opinions and data contained in all publications are solely those of the individual author(s) and contributor(s) and not of MDPI and/or the editor(s). MDPI and/or the editor(s) disclaim responsibility for any injury to people or property resulting from any ideas, methods, instructions or products referred to in the content. |
© 2023 by the authors. Licensee MDPI, Basel, Switzerland. This article is an open access article distributed under the terms and conditions of the Creative Commons Attribution (CC BY) license (https://creativecommons.org/licenses/by/4.0/).

