Article

Improved Production of Marandu Palisade Grass (Brachiaria brizantha) with Mixed Gelatin Sludge Fertilization

by
Eduardo André Ferreira
1,
Joadil Gonçalves de Abreu
2,
Wininton Mendes da Silva
1,*,
Danielle Helena Müller
1,
Dalilhia Nazaré dos Santos
1,
Cassiano Cremon
3,
Oscarlina Lúcia dos Santos Weber
2,
Aaron Kinyu Hoshide
4,5,
Daniel Carneiro de Abreu
5,6,
Maybe Lopes Gonçalves
7 and
José Advan Pereira Pedrosa Júnior
8
1
Empresa Mato-Grossense de Pesquisa, Assistência e Extensão Rural (EMPAER-MT), Centro Político Administrativo, Cuiabá 78049-903, MT, Brazil
2
Programa de Pós-Graduação em Agricultura Tropical, Universidade Federal de Mato Grosso, Cuiabá 78060-900, MT, Brazil
3
Solos e Nutrição de Plantas, Universidade do Estado de Mato Grosso, Rua São João, s/n., Caceres 78216-596, MT, Brazil
4
College of Natural Sciences, Forestry, and Agriculture, The University of Maine, Orono, ME 04469-5782, USA
5
AgriSciences, Universidade Federal de Mato Grosso, Sinop 78555-267, MT, Brazil
6
Instituto de Ciências Agrárias e Ambientais, Universidade Federal de Mato Grosso, Campus Universitário de Sinop, Avenida Alexandre Ferronato, 1200, Sinop 78555-267, MT, Brazil
7
Departamento de Química, Universidade Federal do Espírito Santo (UFES), Av. Fernando Ferrari, 514–Goiabeiras, Vitória 29075-910, ES, Brazil
8
Departamento de Agronomia, Universidade do Estado de Mato Grosso, Av. Tancredo Neves 1095, Cavalhada II, Caceres 78200-000, MG, Brazil
*
Author to whom correspondence should be addressed.
Grasses 2024, 3(2), 45-68; https://doi.org/10.3390/grasses3020005
Submission received: 27 February 2024 / Revised: 27 March 2024 / Accepted: 1 April 2024 / Published: 4 April 2024

Abstract

:
Gelatin industry residues are increasingly used as fertilizer and soil conditioner. However, correct residue dosage is critical for grass development and minimizing environmental impacts. This randomized block design study determined adequate dosage of mixed gelatin sludge (MGS) for Marandu grass production in wet/dry seasons in Brazil. Five MGS levels (0–200% of required nitrogen) were compared to mineral fertilizer. Agronomic/productivity characteristics, bromatological composition, macro/micronutrient composition of leaves, and soil chemical attributes were evaluated. Agronomic/productivity characteristics were influenced by MGS dose in both dry/rainy seasons, except for leaf blade pseudostem ratio and percentage of leaves/pseudostem. Bromatological composition was influenced by MGS doses in dry/rainy seasons except for dry/mineral material quantities. Marandu leaf tissue chemical composition was significantly influenced by MGS dose, except for potassium, boron, and iron. Chemical composition of four soil layers between 0 and 50 cm influenced MGS dose, except for pH, organic matter, magnesium, copper, manganese, and zinc. GMS dose for Marandu production should be 200% of nitrogen requirement. MGS application increased productivity/quality of Marandu grass. Macronutrients (nitrogen, phosphorus) and micronutrients (calcium, magnesium, sulfur, copper, and zinc) increased in Marandu grass and in the soil (calcium, sulfur, and sodium). The increased sodium level was not limiting.

1. Introduction

Increasing urbanization and industrialization result in an increasing volume of residuals from anthropic activities and industrial processes, making sustainable development more challenging. The large volume of wastewater produced by industries requires more than adequate policies, treatment technologies, management, and safe disposal [1]. The treatment of industrial wastewater produces solid residuals (or sludge) as a byproduct [2]. In 2017, the estimated production of industrial sludge was 45 million tons of dry mass [3]. Inadequate use of industrial sludge has been considered wasteful [4]. Human and animal wastes can be used as a source of energy and can also be used as a substrate for fertilization and soil correction, being rich in organic materials and nutrients [5,6].
Gelatin is an important industrial product, used in food items, cosmetics, pharmaceuticals, and photography and is produced via controlled hydrolysis of collagen from animal skin and bones. During this process, large quantities of organic waste are produced. The liquid residues from this process are sent to a sewage treatment station from which solid residuals (sludge) result, rich in organic material. The solid residuals are classified based on their treatment: the first is referred to as primary gelatin sludge (PGS). The second, after processing through anaerobic digestion and aeration pools, is called biological gelatin sludge (BGS); the mixture of these two materials is called mixed gelatin sludge.
Both PGS and BGS are composed of chemical elements that may or may not be nutrients for plants, which vary in their composition depending on the industrial process applied. Their use in agricultural soils is a promising alternative to the continued treatment and disposal of these residuals, for both environmental and economic reasons. This process promotes recycling, recuperating elements that are plant nutrients, and necessary correctives for agricultural soils, benefitting rural producers with decreased costs for fertilizers and lime, and also decreasing pressure on landfills [7].
Ribeiro 2007 highlights that sludge has a composition that is well suited to correct soil acidity, as it has a high pH, or to be used as a fertilizer, due to high levels of nitrogen and calcium [8]. Guimarães et al., 2012 evaluated the use of six doses of biological sludge from the gelatin industry in varying soil types, showed increases in pH, effective cation exchange capacity (CEC), phosphorus (P), calcium (Ca2+), sodium (Na+), and inorganic nitrogen (N) and reductions in levels of aluminum (Al3+) and hydrogen ions (H+) without altering levels of organic material in the soil [9]. A study evaluating the use of gelatin sludge in the production of Piatã grass, showed increases in Ca2+, P, and base saturation in the 0 cm (cm) to 5 cm soil layer, but no change in pH or base saturation at layers past 5 cm [10].
The results of the scientific literature suggest the potential of mixed gelatin sludge as a fertilizer, especially in improving soil chemical attributes; however, the presence of sodium in its composition demands practical limits for its application, in order to avoid risks to the development of plants and the local environment [7,11,12]. On the other hand, its responsible use as a fertilizer in agricultural production can favor an increase in crop productivity, especially in soils poor in fertility such as those found in the regional conditions of study.
Despite the positive results found by these studies, the elevated levels of sodium present in mixed gelatin sludge (MGS) suggest practical limits on its application, as this may cause serious risks to the development of plants or to the health of humans and animals [7]. Therefore, this type of sludge, like others, must be applied within previously established limits, as application without technical knowledge or in sensitive areas may cause contamination of soil or subsurface water [11,12,13,14,15]. On the other hand, the responsible use of MGS could increase livestock productivity, especially in tropical Brazil, where there are low-fertility soils and large expanses of degraded pasture. Furthermore, using MGS as fertilizer in livestock production areas guarantees a safer destination for this industrial waste compared to disposal in landfills. It can also contribute to the circular economy of livestock activity in the region by better integrating processed cattle waste with tropical grass forage (Figure 1). Currently, there is no conclusive published research on the use of MGS and its impacts on soil and forage plants. Therefore, the objective of this study is to determine the appropriate dose of MGS for use in the production of Marandu grass during both dry and rainy seasons in Brazil.

2. Materials and Methods
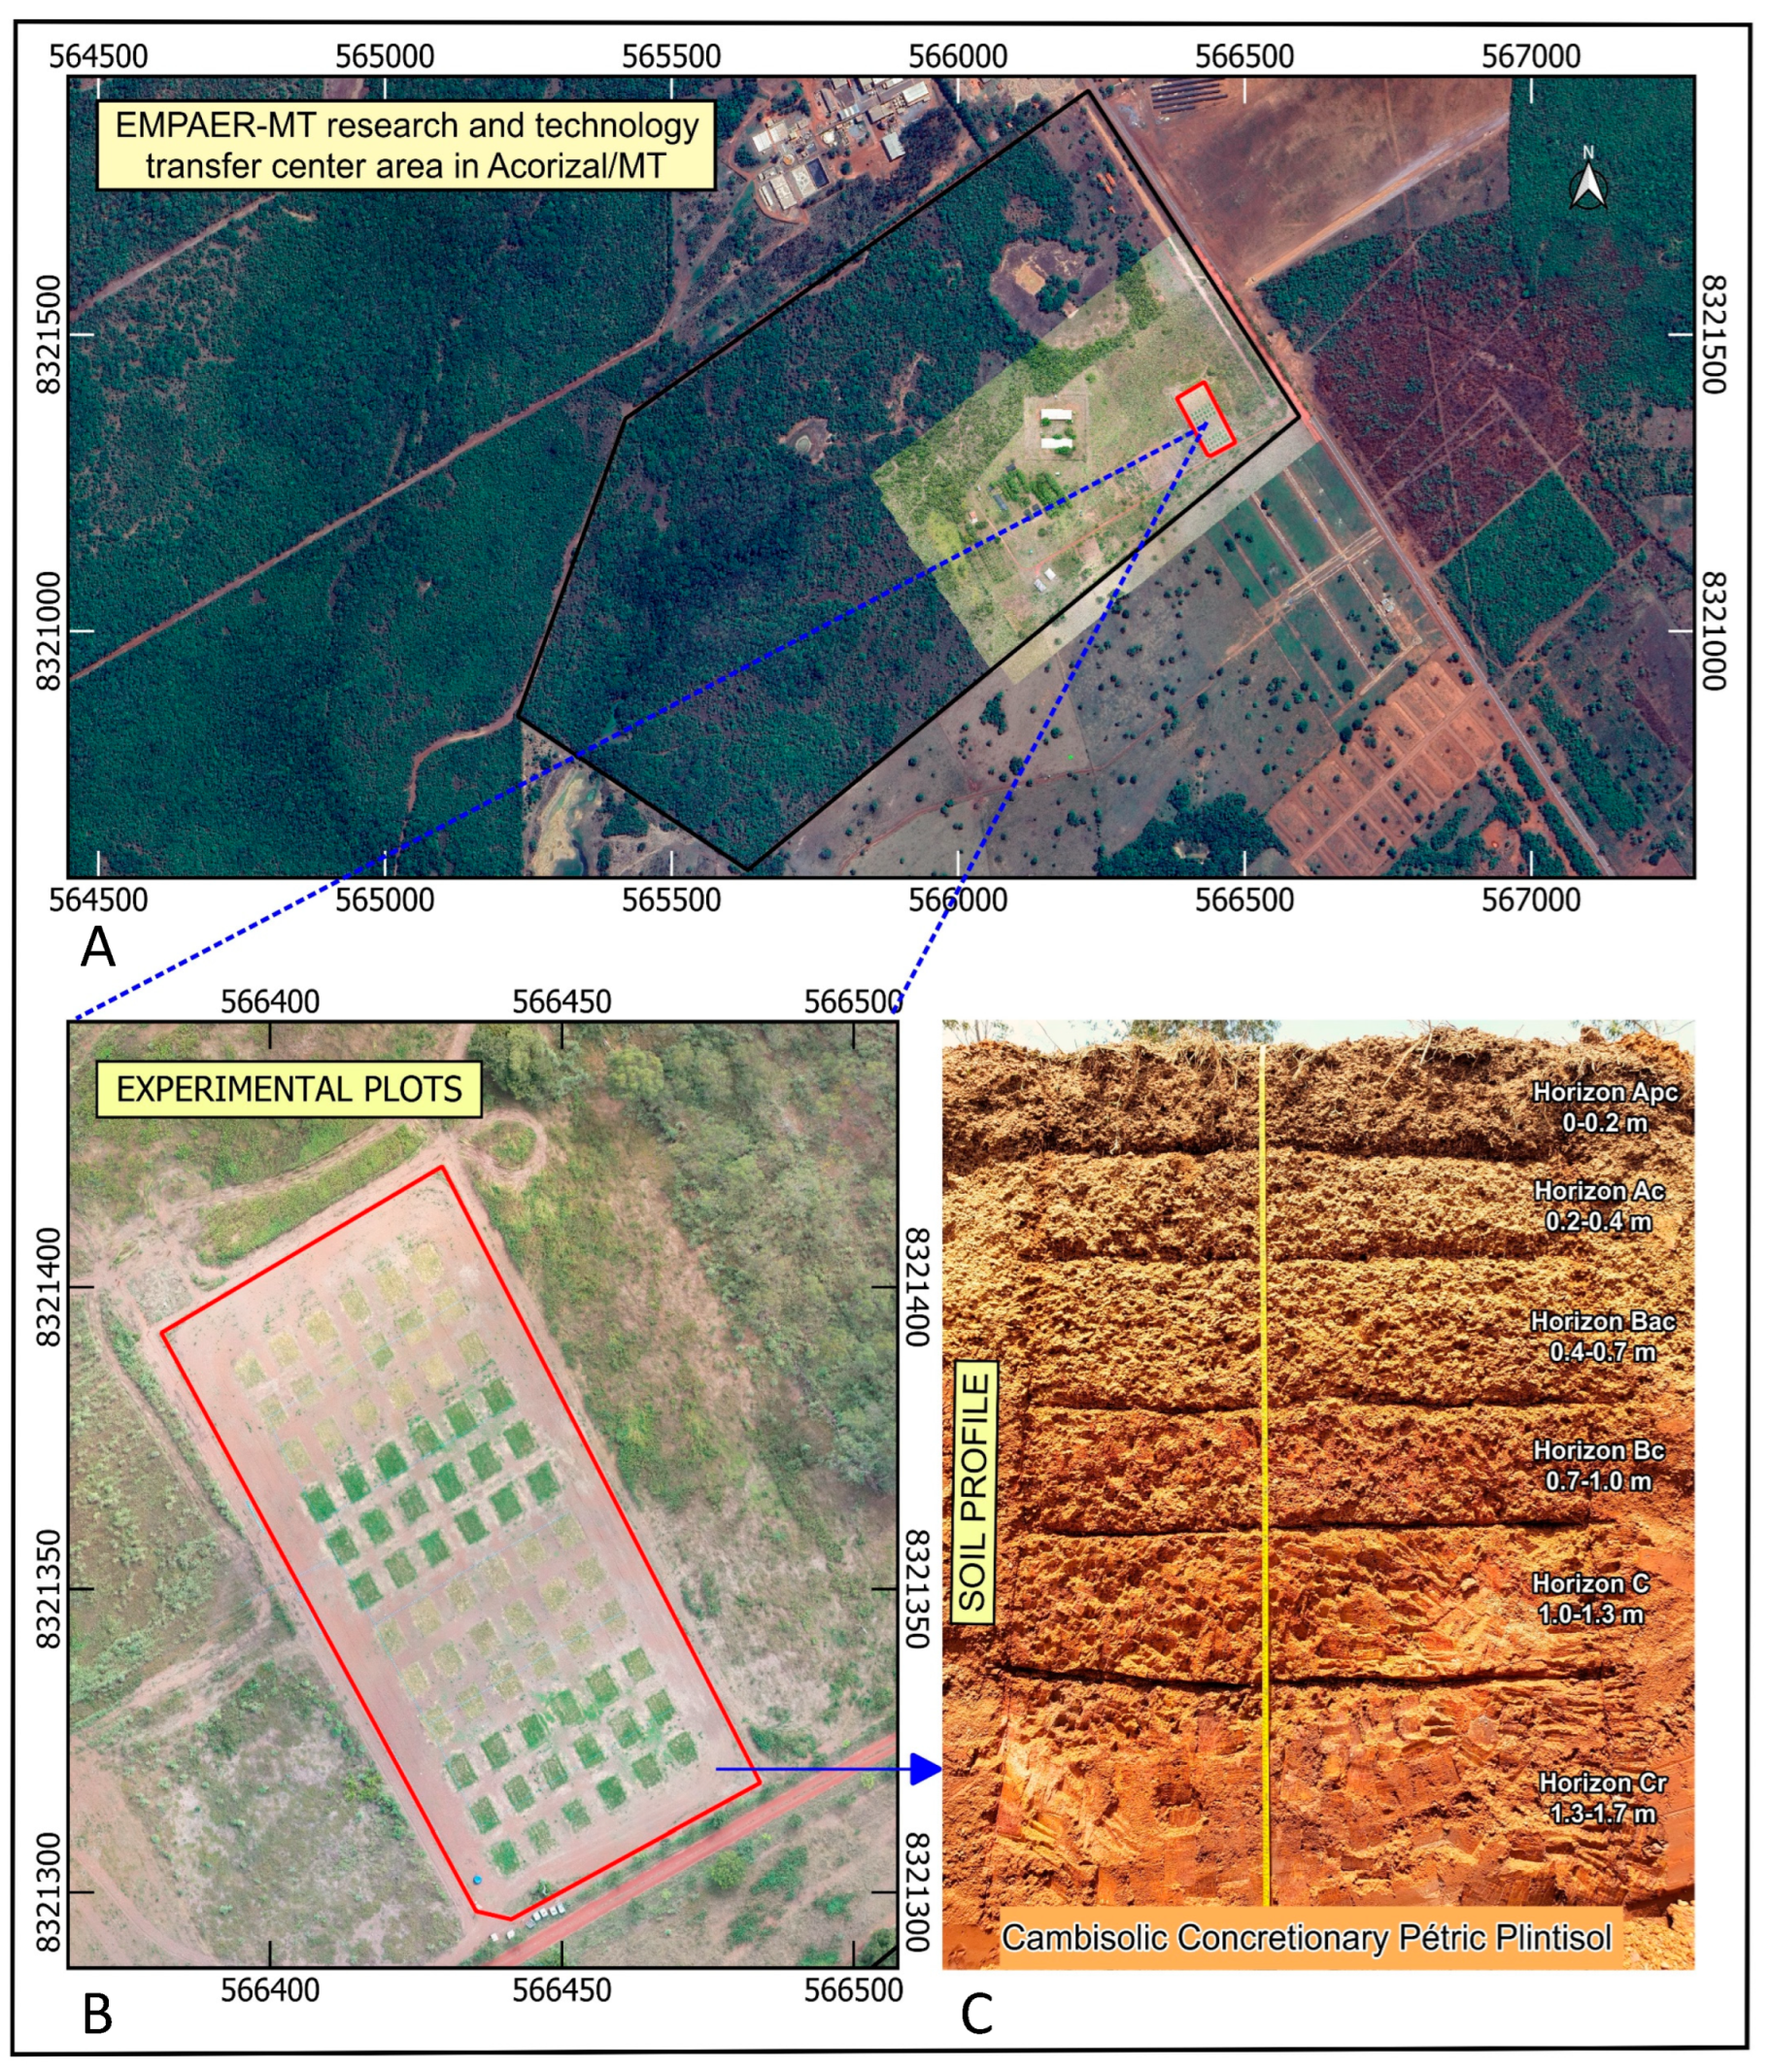
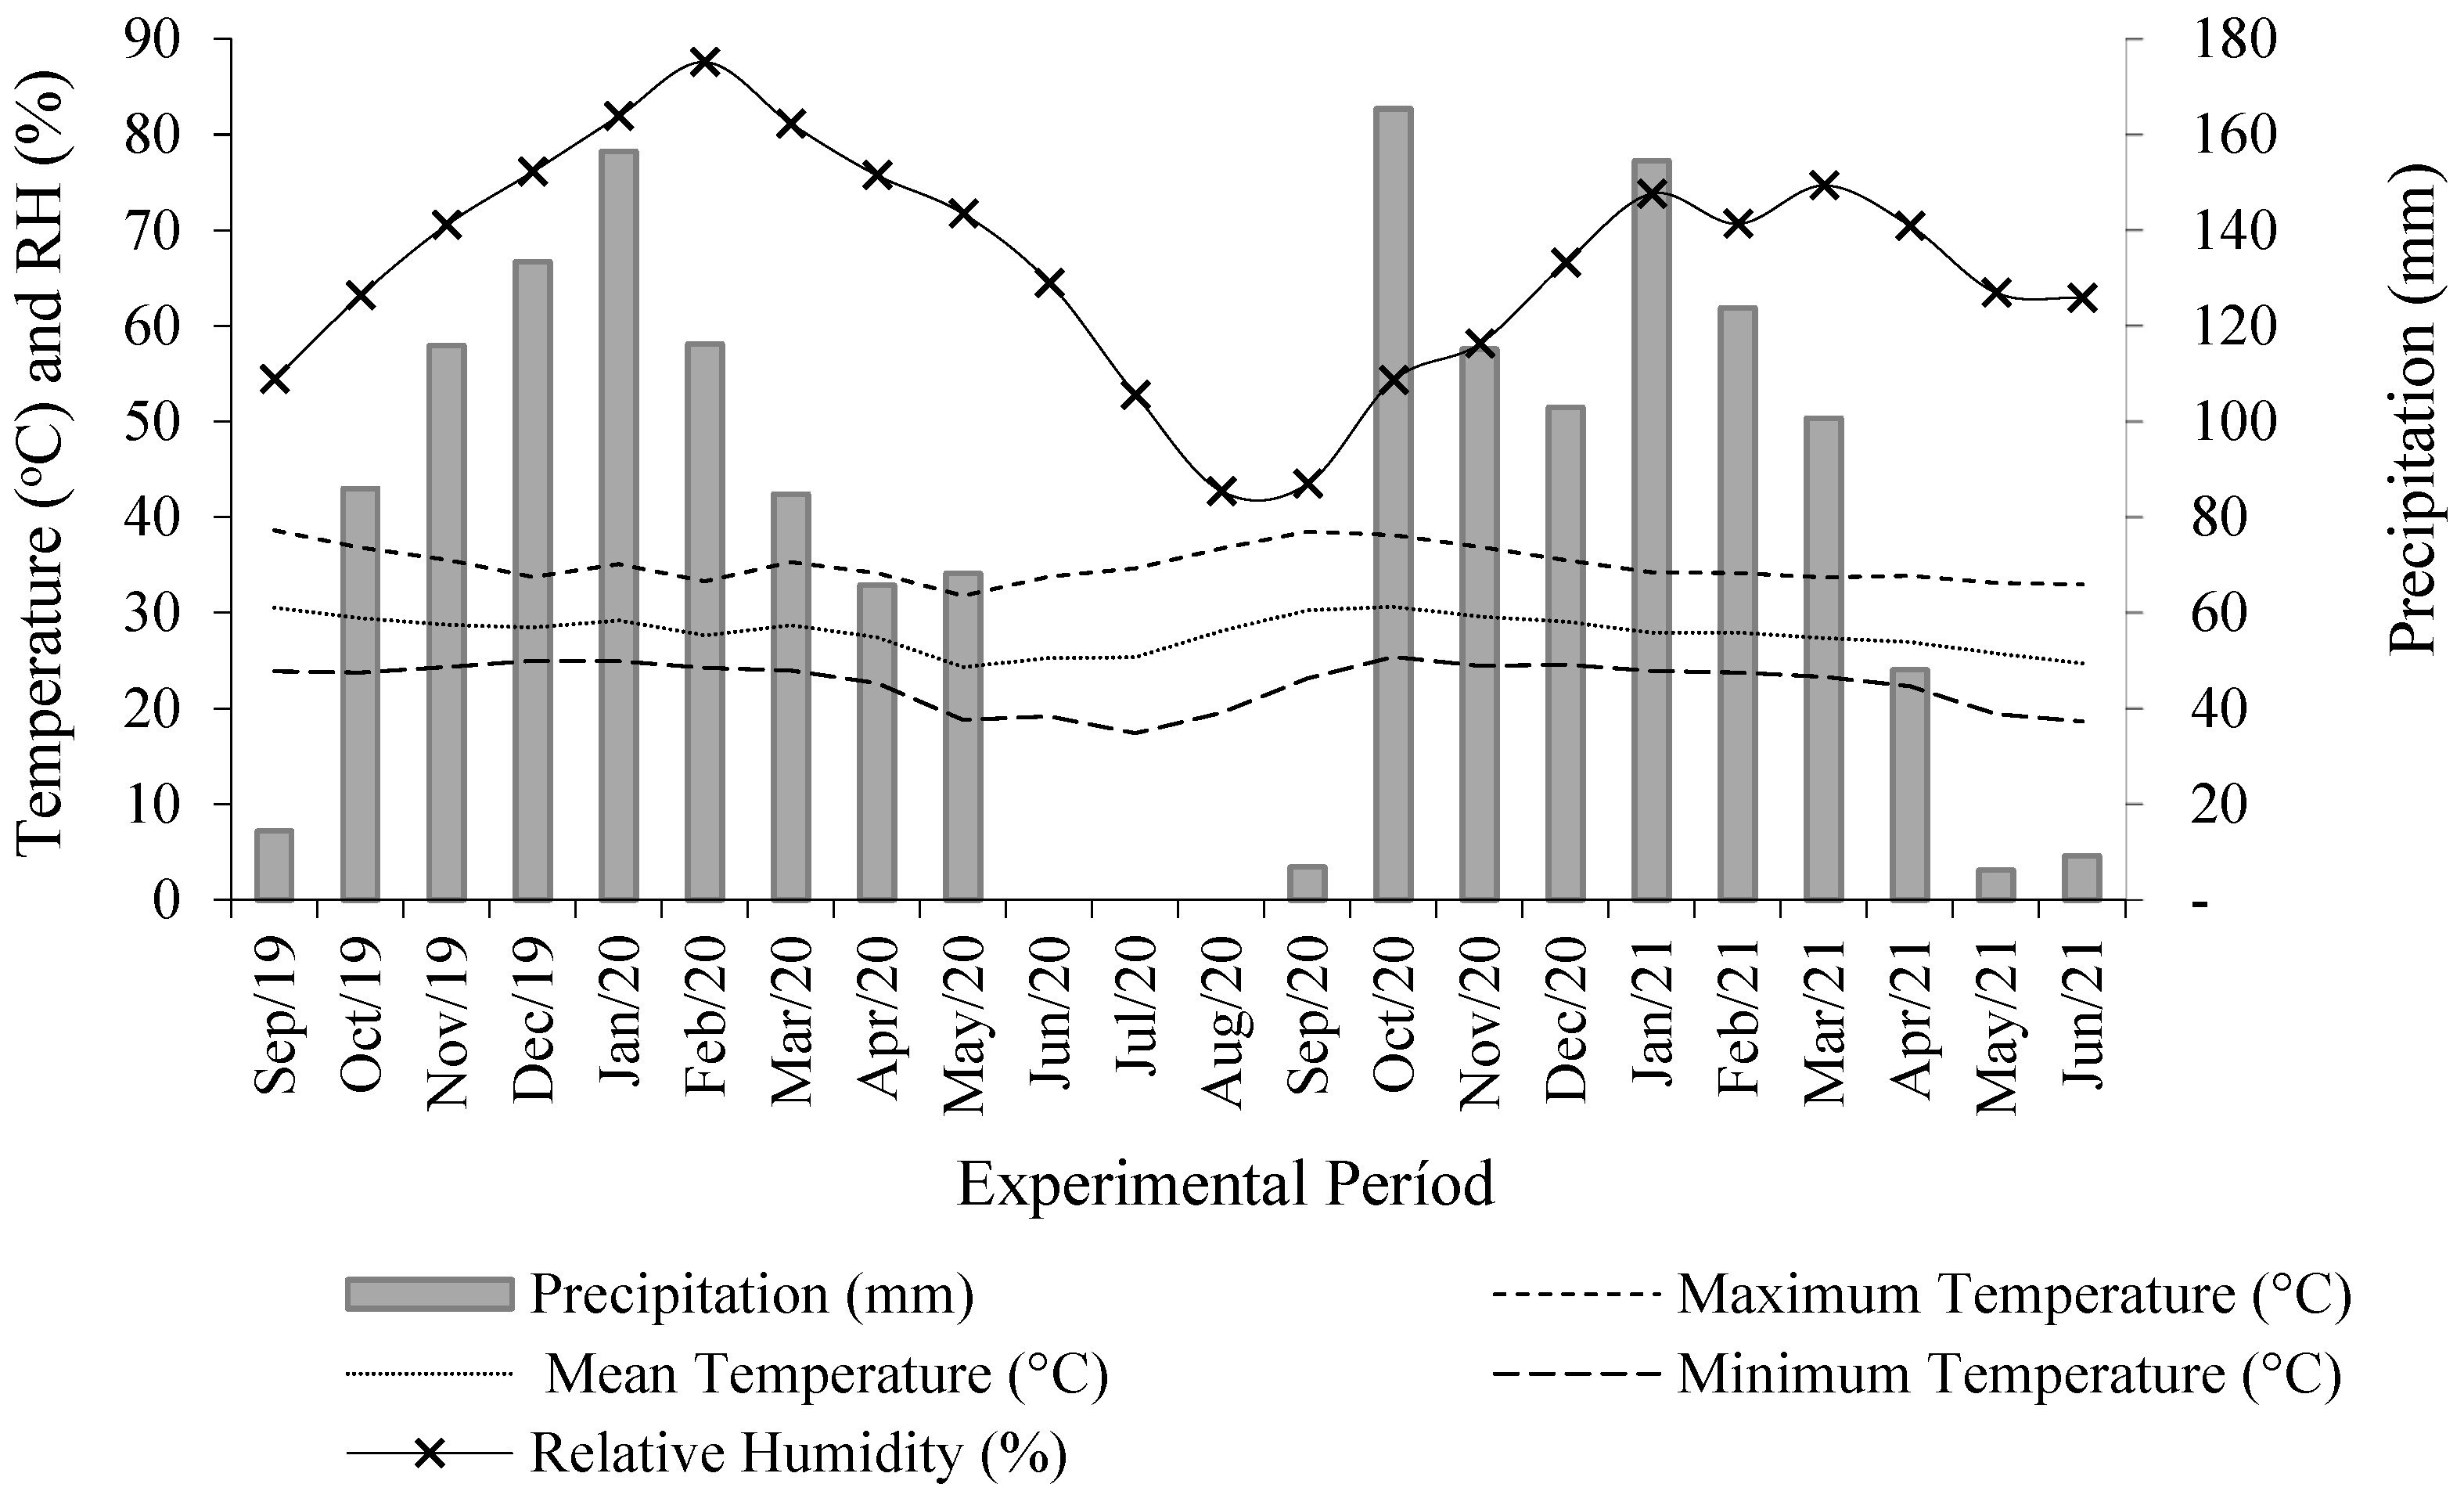
2.1. Study Site

The experiment was installed at the Research Station of the Empresa Mato-Grossense de Pesquisa, Assistência e Extensão Rural (Mato Grosso Business for Research, Assistance and Rural Extension—EMPAER-MT). This research station is located in the municipality of Acorizal, Mato Grosso (15°11.136″ S 56°23.059″ W) at 257 m altitude (Figure 2A,B). Field experiments were conducted between September 2019 and February 2021, with cutting cycles grouped by rainy season (October through May) and dry season (June through September) over both production years.
The climate of the region is tropical wet–dry or Köppen classification type Aw. This type of climate is characterized by two well-defined seasons: dry (June through September) and rainy (October through May). Climate data for the experimental period was obtained from Brazil’s National Institute of Meteorology or Instituto Nacional de Meteorologia (INMET) [16], where mean temperature varied between 24.35 °C and 30.67 °C with 1673.80 mm of rainfall (Figure 3). The soil of the experimental area (Figure 2C) was classified as a Cambisolic Concretionary Pétric Plintisol [17,18].

2.2. Materials Used for Experiment

Before installing the experiment, plant primary nutrient and chemical and granulometric characterization of the soil (Table 1) as well as plant secondary and micronutrient analyses (Table 2) were completed for all soil profile layers. The soil was corrected with lime (power of reactivity and total neutralization = 5%) in an effort to increase base saturation to 60%. After application of lime, corrections for phosphorus and potassium were completed, following the recommendations of Sousa and Lobato [19]. Specifically, 90 kg ha−1 of P2O5 and 60 kg ha−1 K2O were used as sources of single super phosphate and potassium chlorate. Seeding of Urochloa brizantha Marandu was completed in January of 2020. In March 2020, at 70 days after seeding, a leveling cut was made to experimental plots (Figure 2B) before evaluation. This was followed by fertilizing with mixed gelatin sludge (MGS) and mineral fertilizer following the establishment of experimental treatments. The forage Urochloa brizantha Marandu was chosen because it is the most planted forage species in the region and occupies large areas in Brazil. It is well adapted to the area in soils of medium and low fertility and it is resistant to pasture leafhopper (Deois flavopicta) [20]. Its forage production capacity can reach 20 t ha−1 yr−1 [21], supporting an animal productivity of 670 kg of live weight ha−1 yr−1 [22,23].
Mixed gelatin sludge (MGS) is a mixture of primary sludge and biological sludge from the gelatin industry. Both primary and biological sludge types result from the treatment of wastewater from the process of converting collagen in animal bones and skins into gelatin [24]. The MGS used in this study came from a gelatin industry treatment plant in Acorizal, Mato Grosso state, Brazil (Figure 4). Before application in soils, one sample of sludge was collected for chemical analysis in February 2020 and the quantities of each element applied in each treatment of the experiment are summarized in Table 3.
There is no scientific evidence of harmful substances from the use of mixed gelatin sludge that could cause harm to animals grazing. In this sense, the absence of Escherichia coli and viable helminth eggs in the analysis of sludge can guarantee greater safety in its use as fertilizer in pasture without the risk of subsequent contamination of animals. The E. coli most probable number (MPN) was <100 per gram (g) of total solids (TS) tested. For helminth eggs, this MPN was <0.06 eggs g−1 of TS tested.
Based on the nitrogen content of the mixed gelatin sludge (MGS) and considering the nitrogen (N) requirements of the specific culture proposed by Souza and Lobato [19], the dose of sludge to be applied was calculated following Equation (1):
Application   Rate = N   recommended   ( kg   ha 1 ) N   available   in   MGS   ( kg   t 1 )
where the N recommended is specific to Marandu grass; N available is the amount of N available in the MSG at the time of implementing the experiment.
The experiment was conducted using a randomized complete block design with three repetitions. The dimensions of each experimental field plot was 4 m × 5 m = 20 square meters. Six treatments were tested, including five doses of MGS (Table 4) based on percentages (0%, 50%, 100%, 150%, and 200%) of the recommended total yearly dose of nitrogen for irrigated Marandu grass production (300 kg ha−1 per year), and a sixth treatment was added that received exclusively mineral fertilizer representing the recommended fertilizer for the forage species in an intensive production system (50 kg of N ha−1 per cutting cycle for a total of six cuts per year). The morphological characteristics, bromatological composition, chemical composition, productivity of the forage Urochloa brizantha Marandu, and the chemical attributes in the study soil profile were evaluated.

2.3. Experimental Procedures

After a leveling cut, MGS was applied with doses manually weighed. Doses were diluted in water using a proportion of 1 L of water for each kilogram of residue in order to facilitate spraying. The diluted sludge was evenly mixed with a mechanical rotating mixer. After dilution and homogenization, the residue was placed in irrigators and manually sprayed on research plots.
Height, tillering, morphological composition, leaf blade-to-pseudostem ratio, and dry mass were measured when the 100% treatment reached the recommended pasture height of 35 cm (cm). These measurements were made within a 1 × 1 m metal frame, thrown randomly three times within each plot. Grass was cut to 20 cm from the soil surface upon collection to reflect the post-grazing height recommended for Marandu grass.
Samples collected were stored in paper bags, weighed, identified, and transported to the Forage Lab of the Federal University of Mato Grosso (Laboratório Forragicultura). In the laboratory, the morphological separation of the plants involved three parts: leaf, stem and sheath, and senescent material. The samples were then dried in a forced air oven at 55 °C until achieving constant mass and were weighed to determine the estimated aboveground dry mass, consistent with grazing.
To determine the bromatological composition of the grass, dried samples were ground in a Willey grinder, conditioned, and analyzed. Ground material was scanned to determine near-infrared reflectance using a EspectraAnalyzer manufactured by Zeutec Opto Elektronic Gmbh with 19 filters. Reflectance from 1100 and 2500 nanometers was reported as log1/R (reflectance) per wavelength. The variables estimated from the near-infrared (NIR) reflectance are dry matter (DM), mineral material (MM), crude protein (CP), neutral detergent fiber (NDF), and indigestible neutral detergent fiber (iNDF).
To determine the absorption of macronutrients and micronutrients by the grasses in each treatment, the mineral composition of the leaves was measured next, following the methodology of developed by researchers at Embrapa [25]. Based on this analysis, the recovery rate for each nutrient was determined. The recovery rate is calculated as the amount of a given nutrient extracted per unit applied, independent of whether the source is inorganic or mineralized from crop residue. This represents the fraction of the nutrient that is made available to the plants. The recovery rate was calculated for nitrogen (N), phosphorus (P), and potassium (K) following Equation (2):
Rec (%) = [(Fertilized Treatment − Control)/Residue]
in which “Fertilized Treatment” is the quantity of nutrients available in grass tissues in the treatments fertilized with residue. “Control” is the quantity of nutrients available in plants in plots without fertilization from crop residues. “Residue” is the quantity of nutrients applied by crop residues.
The extraction of N, P, and K were calculated using Equation (3):
Extraction (kg ha−1) = 0.001 DM × TN
where dry matter (DM) produced is measured in kg ha−1 and the total nutrient (TN) level in the plant is measured in g kg−1. The quantity of nutrients in grass within the unfertilized plots was used to estimate the supply of nutrients from the soil and atmosphere for nitrogen. The exchangeable sodium percentage was calculated based on Equation (4):
ESP (%) = (Na/CECtotal) × 100
where the exchangeable sodium percentage (ESP, %) is a function of the sodium (Na) concentration in the soil (cmolc dm−3) and the total cation exchange capacity (CECtotal) measured in cmolc dm−3.
Soil samples were collected in four soil layers: 0–10 cm (cm), 10–20 cm, 20–40 cm, and 40–60 cm. Each soil sample was tested to determine pH and the contents of primary and secondary macronutrients, micronutrients, and sodium. The soil analyses were carried out at the Solo Certo commercial laboratory in the city of Nova Mutum, Mato Grosso state, Brazil.

2.4. Statistical Methods

Kolmogorov–Smirnov and Levene tests were applied to the data to determine the homogeneity of variance and normality of errors. The data of the morphological, bromatological, and chemical characteristics of Marandu grass at different doses during both rainy season and dry season as well as soil chemical attribute data in each soil layer were analyzed using regression analysis. The best regression adjustment was defined by the significance of the equation parameters tested by regression analysis of variance using SPSS 20.0—Statistical Package for Social Sciences—from IBM Corp (2011) [26].

3. Results

3.1. Grass Morphology

Morphological characteristics of Marandu grass in this experiment are summarized in Table 5. These morphological characteristics were influenced by the dose of mixed gelatin sludge (MGS) during the dry and rainy seasons. The leaf blade-to-pseudostem ratio and the percentage of leaves and stems did not show significant effects during the periods evaluated (Table 5). The variables tillering and height show linear relationships with MGS dose during the dry season, with increments of 232 tillers per m2 and 11 cm, equivalent to increases of 32.91% and 35.19% for tillers and height of Marandu grass, respectively (Table 5). The greatest number of tillers were observed with the highest dose of MGS (Table 5). Tiller number positively impacts the composition of the grass canopy with an increase in apical buds.
Plant height also showed a linear correlation with MGS dose during the dry season with a maximum height observed of 42.26 cm for the maximum dose applied (Table 5). During the rainy season, no significant response to MGS dose was observed. The height of plants observed in the treatment fertilized with nitrogen, phosphorus, and potassium (NPK) was 12.51% higher during the rainy season, and 21.29% lower during the dry season. The lower values of plant height during the dry season are likely due to the water stress and high temperatures during this period that increase ammonia (NH3) volatility related to the use of urea [27].

3.2. Grass Nutritional Quality

Productivity of dry material also showed a significant linear response with increasing MGS dose for both the rainy season and dry season of 3.63 and 2.88 t ha−1, respectively. During the rainy season, increases of 35.55%, 87.28%, 130.12%, and 150.82% were observed for treatments of 50%, 100%, 150%, and 200% in comparison with the treatment that received no fertilization. During the dry season, increases of 31%, 73.47%, 79%, and 84.23% were observed for the same treatment levels when compared with no fertilization. It was expected that treatments with mineral fertilizer would show greater production of dry matter when compared to those fertilized with MGS, given that organic sources require more time for mineralization and availability to plants. However, this tendency was not observed in the present study, which further supports the potential for use of this residue as a pasture fertilizer.
A linear tendency was also observed in levels of crude protein (CP) with the increasing dosage of MGS during both observation periods (Table 5). The highest values observed were 486.92 kg CP ha−1 during the rainy season, and of 392.15 km CP ha−1 during the dry season. These values are 200.78% and 158.32% higher than those observed in the control treatment during the seasons in question. The 100% dose produced CP 53.13% and 68.72% higher than the mineral fertilizer treatment (NPK) during the rainy season and dry season, respectively. These results are similar to those observed in the production of dry matter. The increasing tendency of CP with increasing dose of MGS is promising, as it is reflected in animal weight gain and profitability of rural properties.

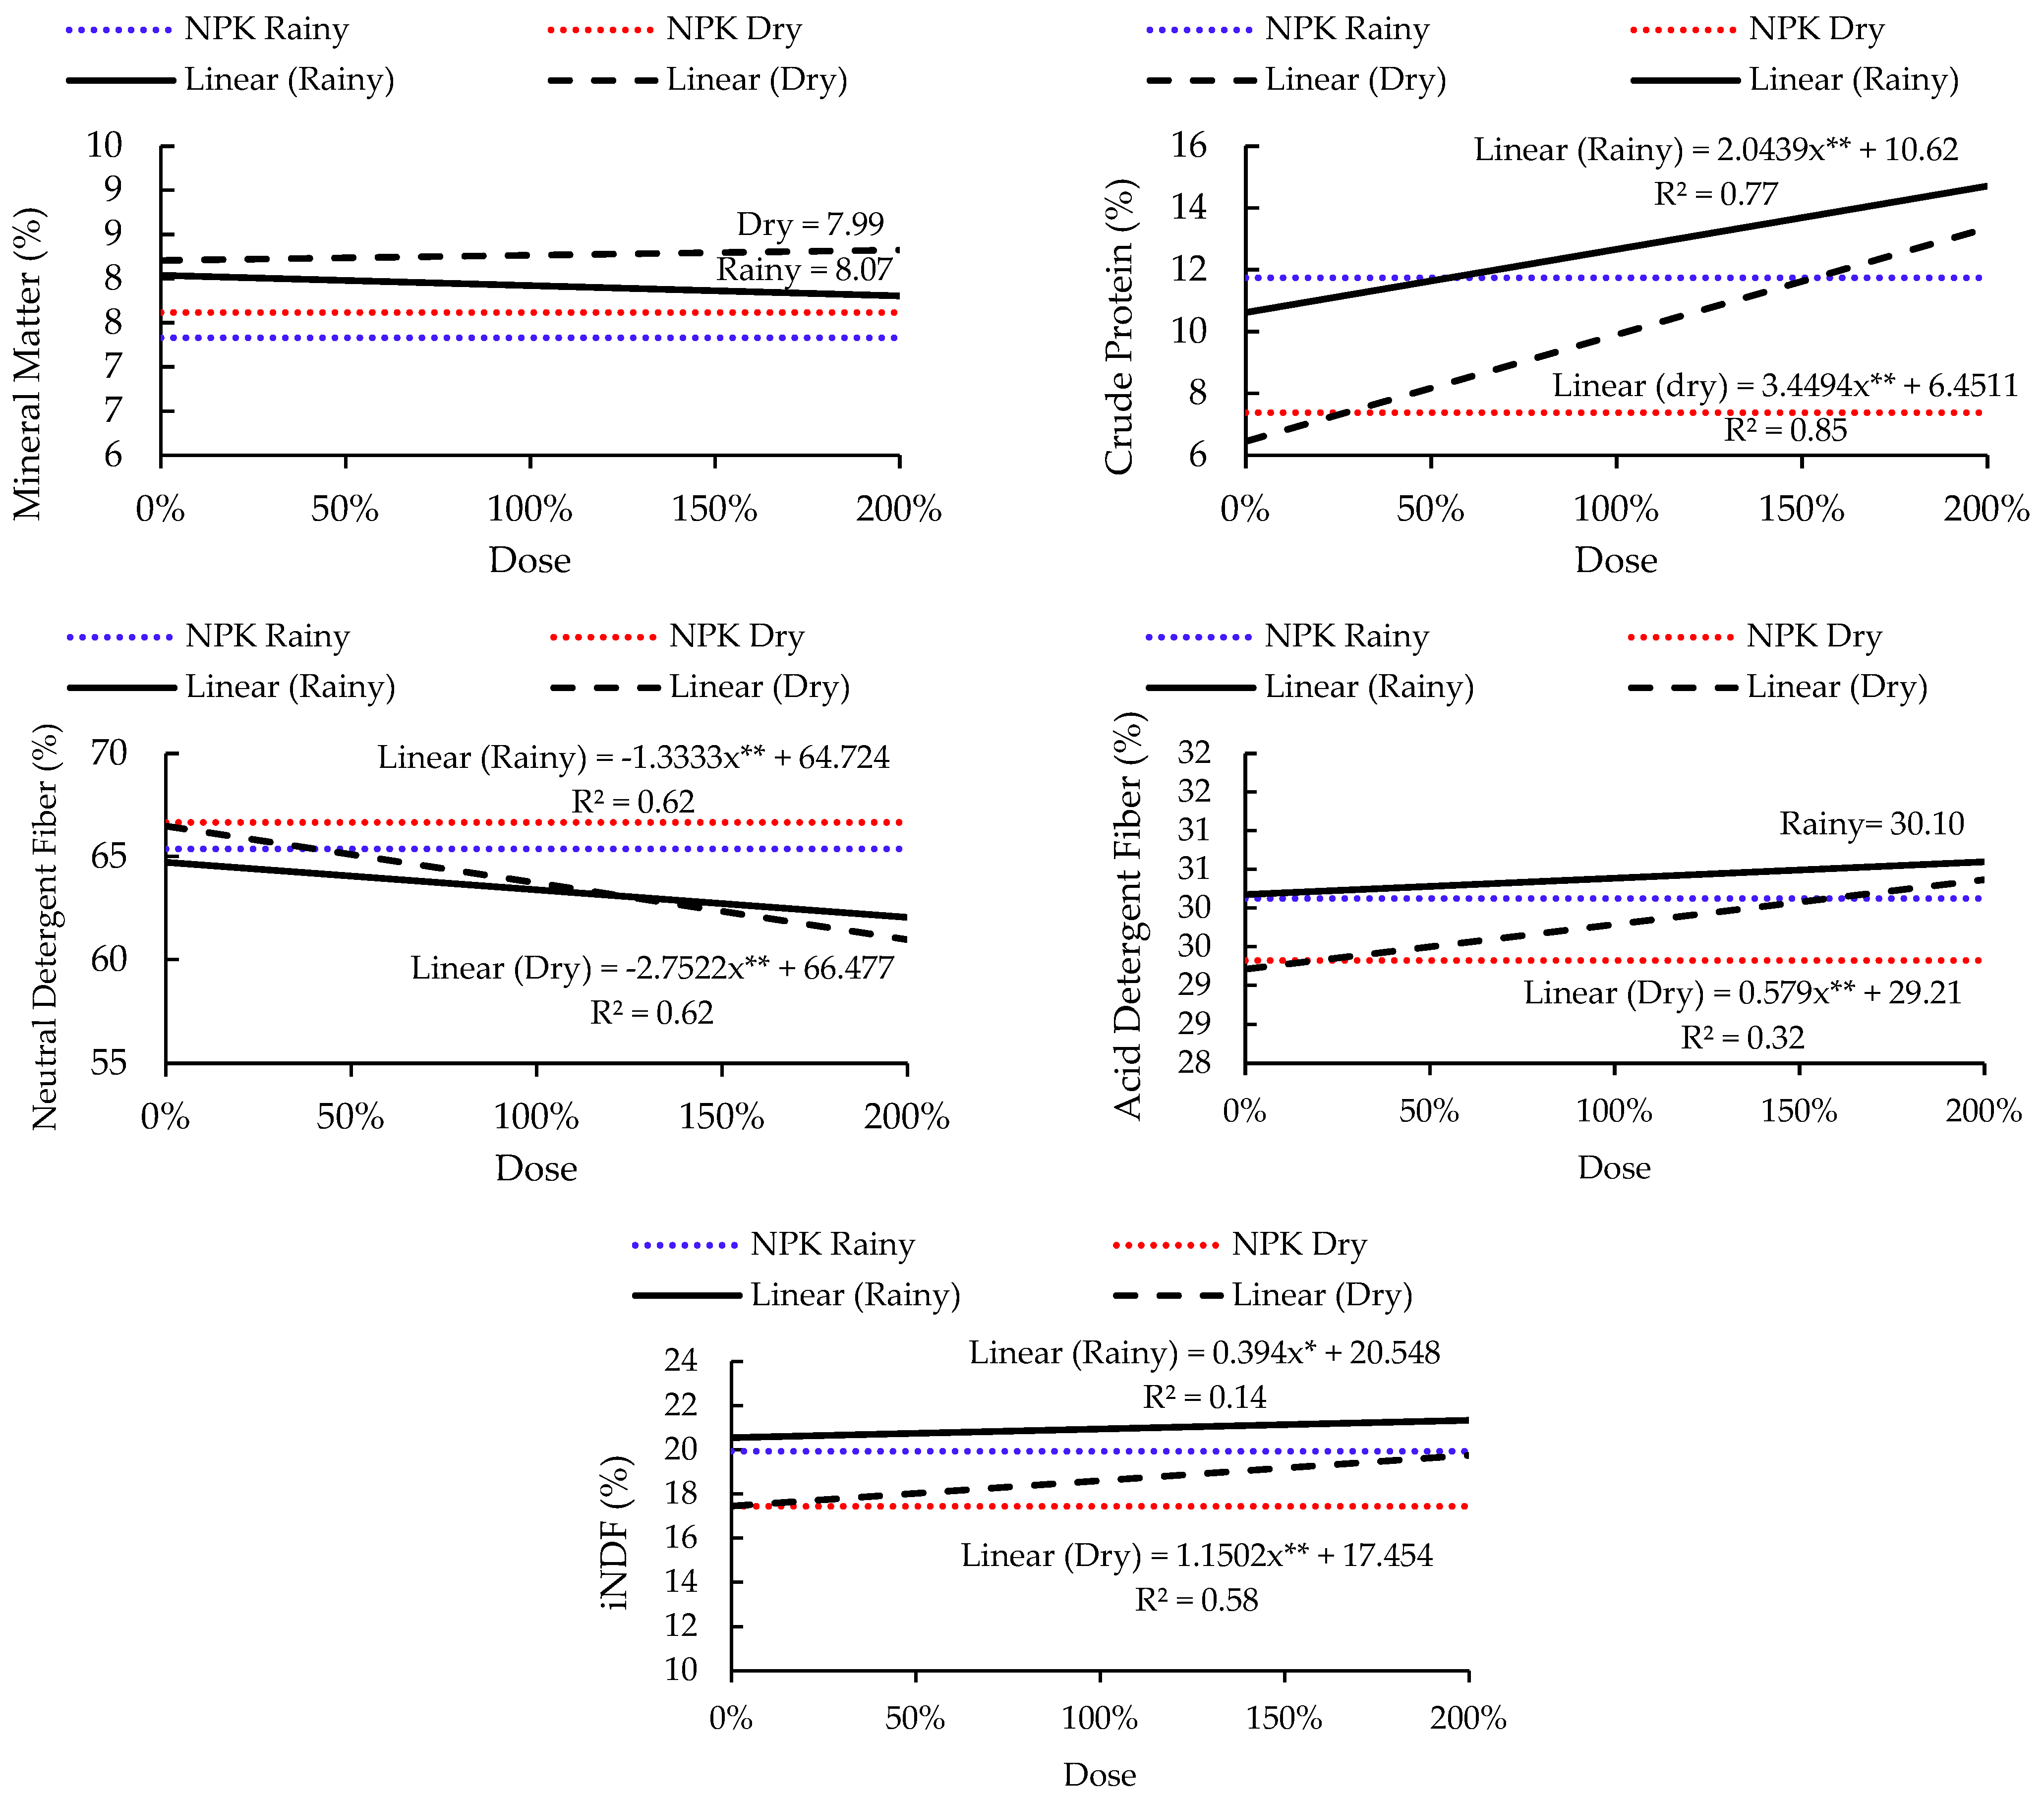
3.3. Bromatological Composition

Doses of MGS influenced the bromatological composition of Marandu grass, both during the wet and dry seasons, except for total dry material and mineral material (Figure 5). The levels of crude protein (CP) show a positive linear response to MGS dose, during both the rainy and dry season, with maximum levels of 14.62% and 13.25%, respectively, for the highest dose (200%). These levels represent an increase of 40.95% and 99.06% in CP of Marandu grass when compared with the treatment without fertilization. For CP, Marandu grass showed a consistent increase until the maximum dose of MGS tested, demonstrating that higher doses could be applied to verify the maximum obtainable.
The treatments fertilized with MGS showed higher levels of CP than those observed in the treatment fertilized with mineral fertilizer (urea), with values 1.41%, 11.11%, 16.93%, and 22.90% higher during the rainy season and 3.65%, 15.49%, 2.69%, and 5.95% higher during the dry season for treatments of 50%, 100%, 150%, and 200%, respectively. This result was unexpected, as mineral sources of fertilizer have greater solubility of nutrients, with higher levels of immediate availability to plants, while organic sources require more time for mineralization and availability of nutrients [28].
Levels of neutral detergent fiber (NDF) showed a negative linear relationship with increasing dose of SMG for both the dry and rainy seasons. The lowest values of NDF were 62.23% and 61.63% for the highest doses applied during the rainy and dry seasons, respectively (Figure 5). Acid detergent fiber was positively correlated with MGS dose during the dry season (Figure 5). Levels of indigestible neutral detergent fiber (iNDF) showed a positive linear relationship with MGS dose, with highest values at 21.35% and 19.65% for the rainy season and dry season, respectively (Figure 5).

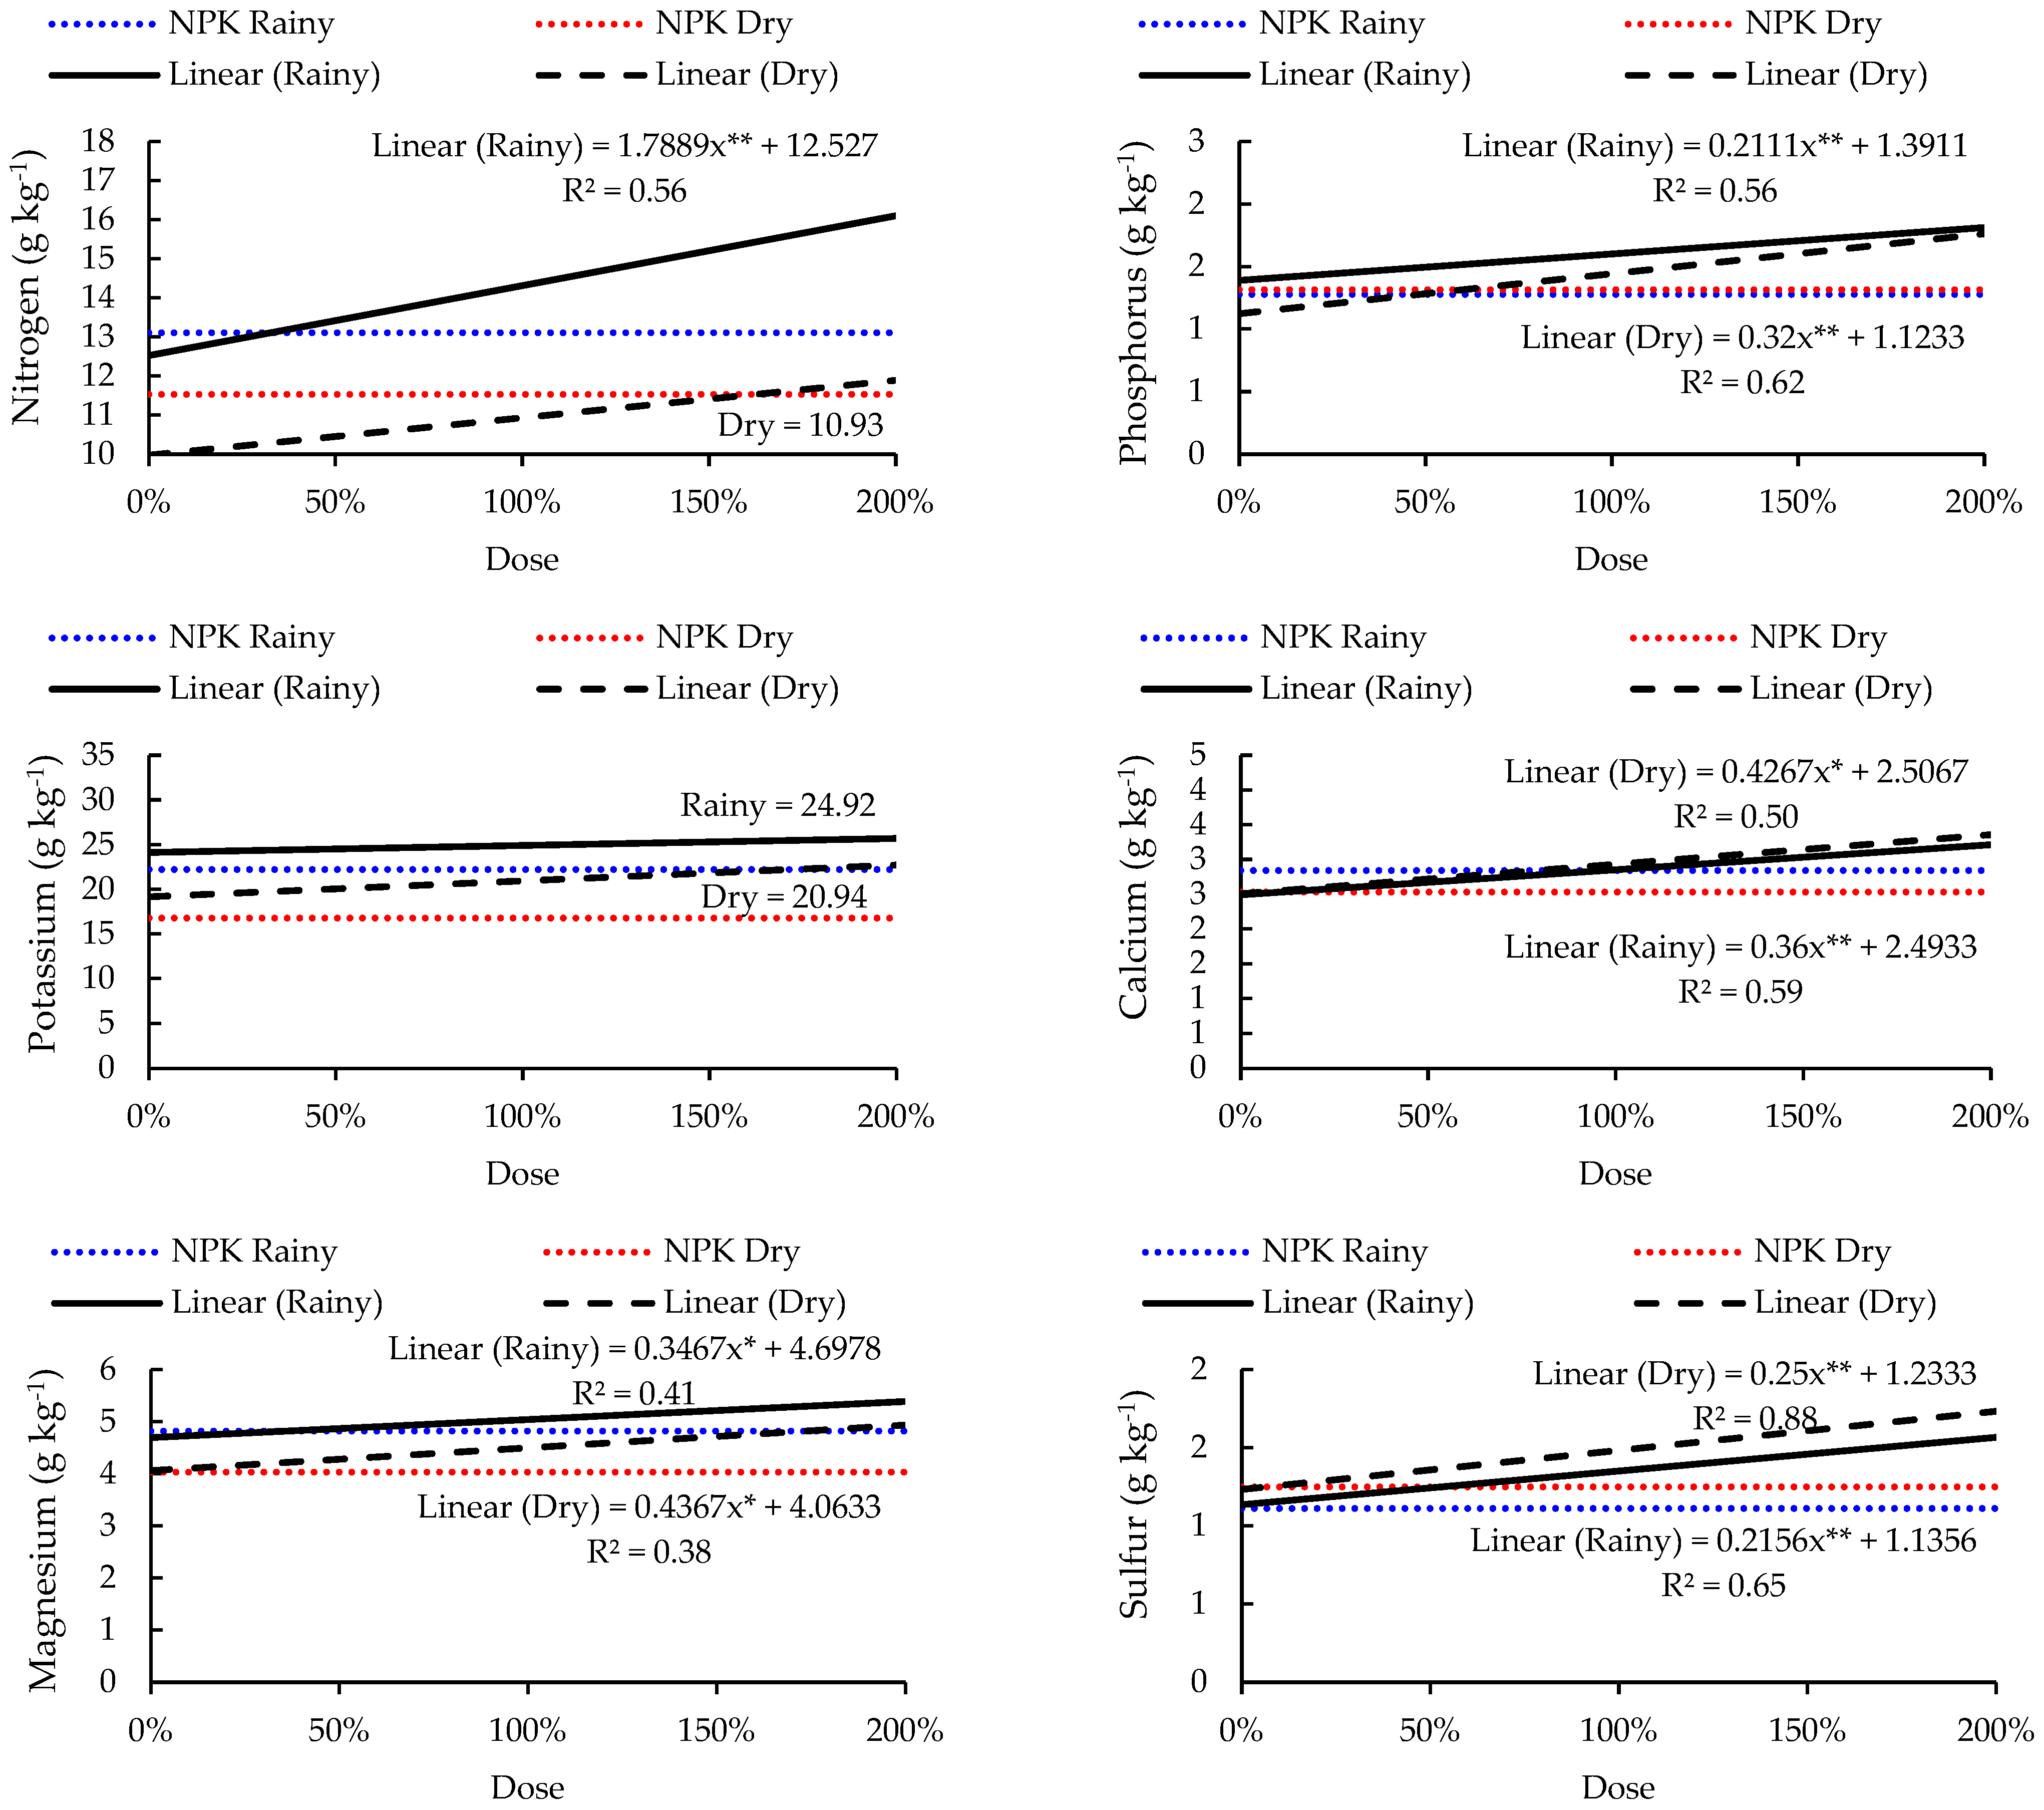
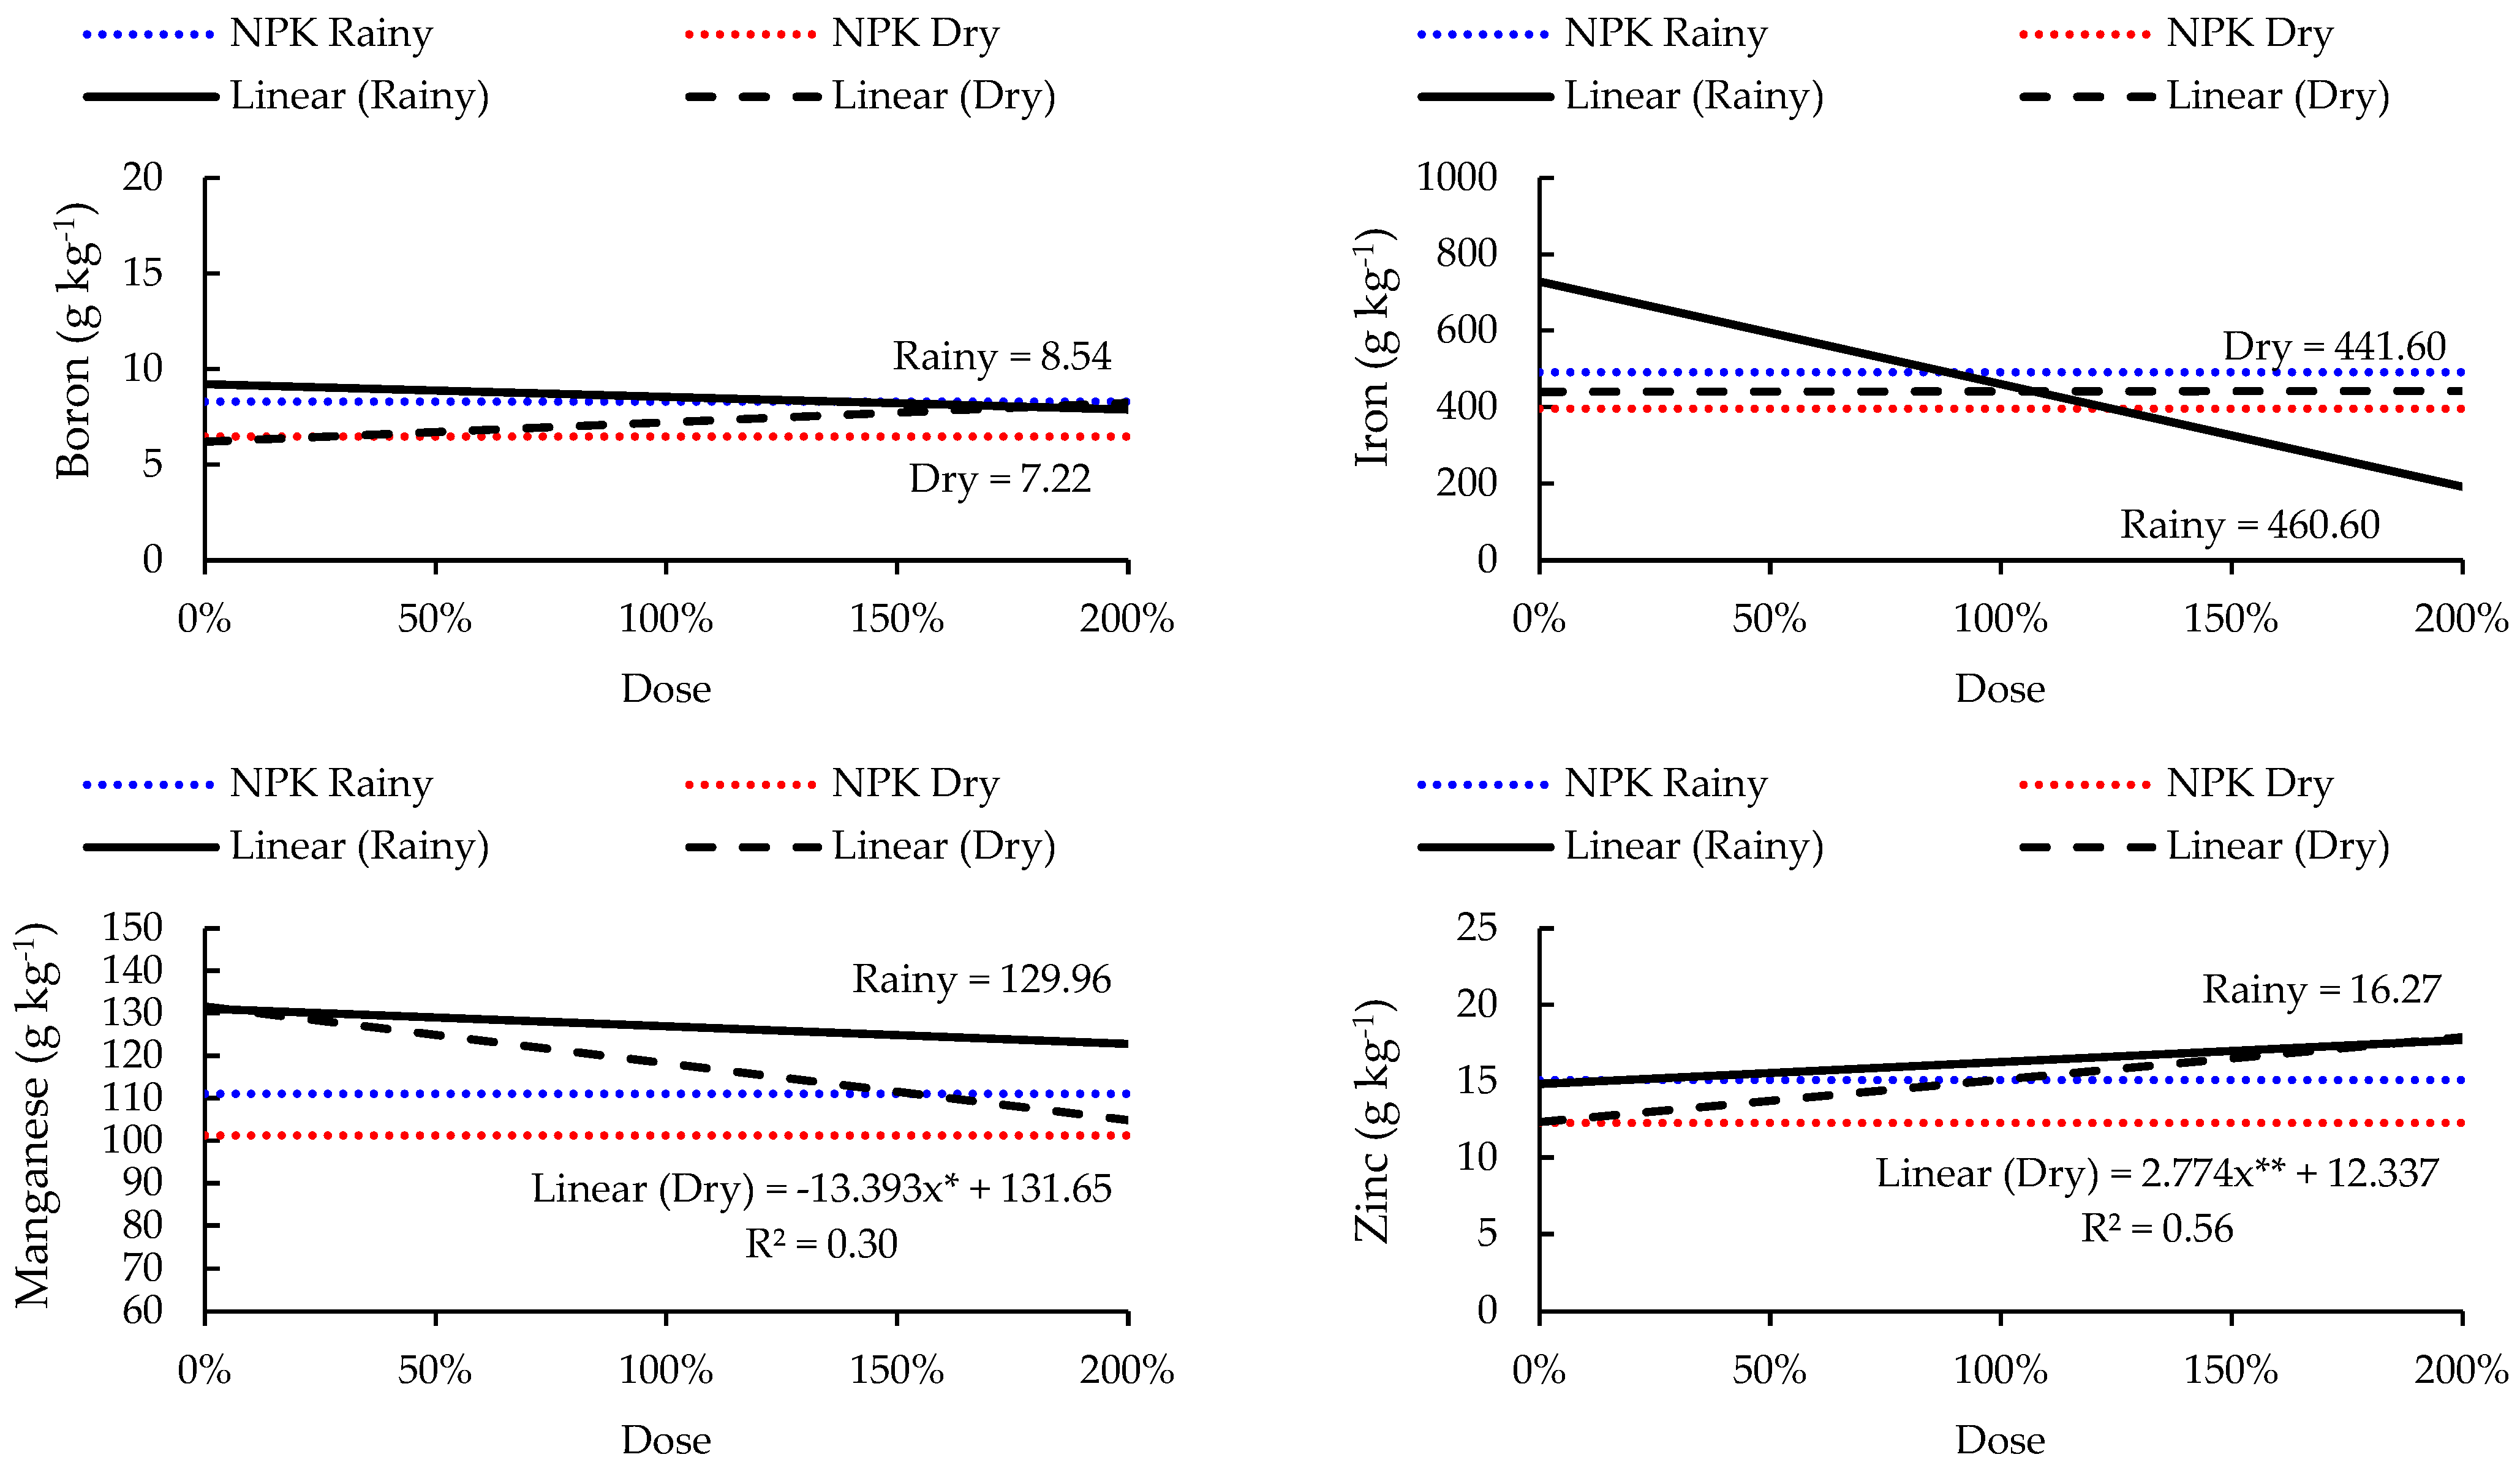
3.4. Plant Chemical Composition

The chemical composition of the plant tissue of Marandu grass was influenced by the dose of MGS, with the exception of potassium, boron, and iron, which did not show significant change. Significant response was shown to MGS dose for nitrogen, phosphorus, calcium, magnesium, sulfur, copper, manganese, and zinc in the leaf tissue of Marandu grass (Figure 6). Nitrogen (N) showed a positive linear response to increasing MGS dose during the rainy season. The highest value of N (15.89 g kg−1) in leaf tissue corresponded to the highest dose of MGS and was 27.83% higher than the unfertilized treatment.
The doses tested showed a positive linear effect on levels of phosphorus (P), with maximum values of 26.51 and 23.25 g kg−1 observed for the highest dose of MGS during the rainy season and dry season, respectively (Figure 6). The calcium levels also showed a positive linear relationship with increasing MGS dose. Maximum levels of 3.29 and 3.31 g kg−1 were found for rainy and dry seasons, respectively. The Mg levels within leaf tissue showed a positive linear relationship with increasing MGS dose with all values observed above the recommended amounts of 1.5 to 4.0 g kg−1 [29]. The levels of sulfur in leaf tissue showed a positive linear relationship with increasing dose of MGS for both seasons evaluated. Maximum values of 1.54 g kg−1 in the rainy season and 1.63 g kg−1 in the dry season were found for maximum doses of MGS (Figure 6). For micronutrients in all treatments, iron stands out, as it has levels above what is considered adequate at 50 to 250 mg kg−1 [29]. The micronutrients copper and zinc show significant linear relationships with increasing levels of MGS during the dry season, with maximum values of 5.10 and 18.13 mg kg−1, respectively, for the highest dose tested (Figure 6).

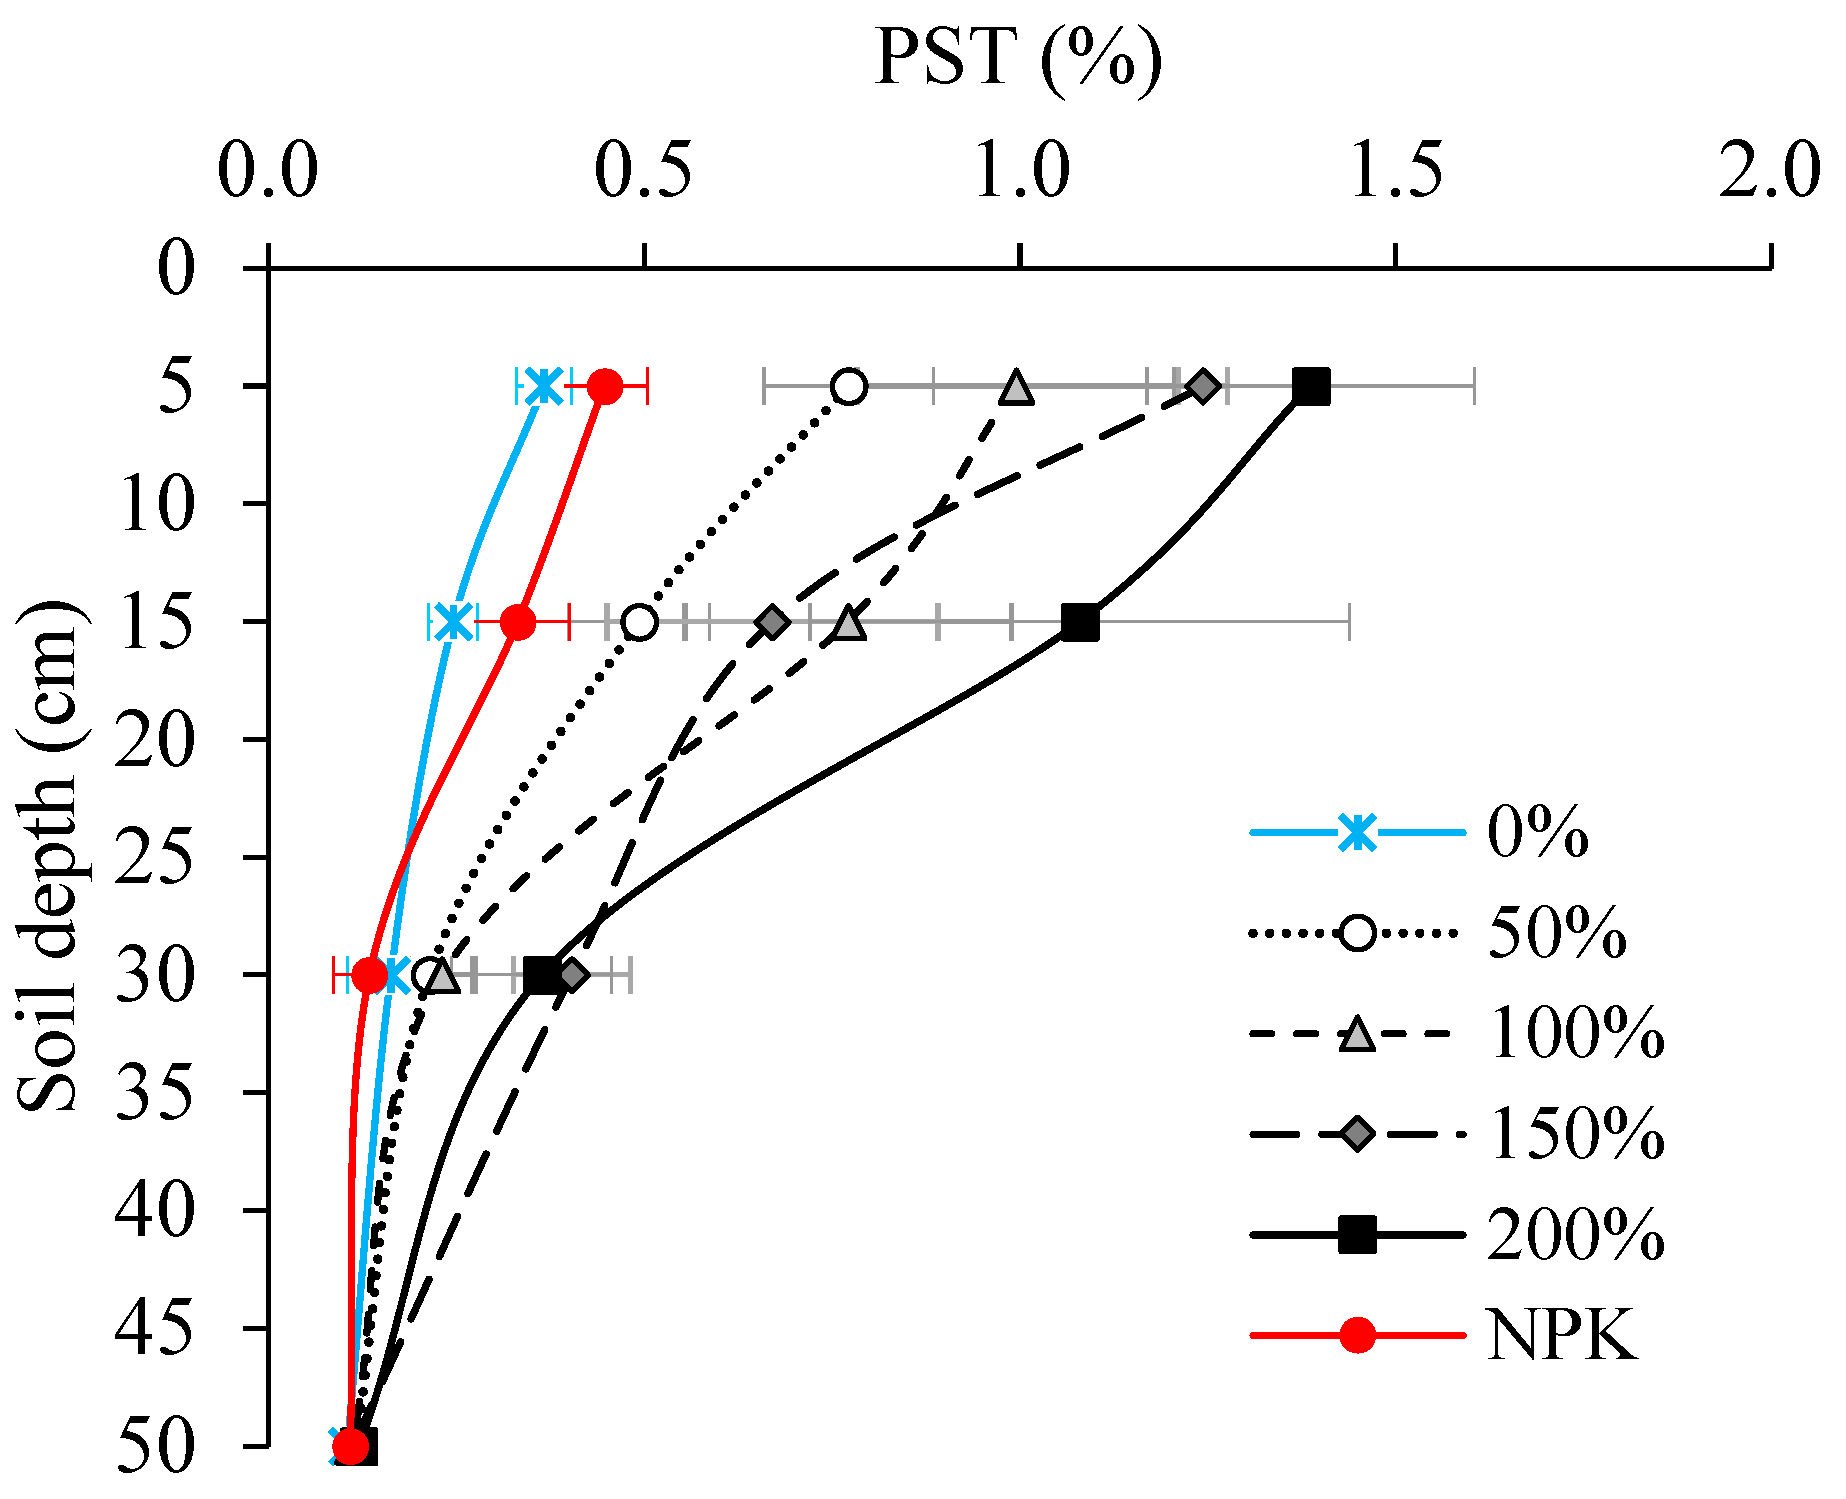
3.5. Soil Chemical Attributes

Soil chemistry was analyzed in four layers: 0–10 cm (cm), 10–20 cm, 20–40 cm, and 40–60 cm to determine the effect of MGS dose. Significant effects were found for nitrogen (N), phosphorus (P), potassium (K), calcium (Ca2+), sulfur (S), sodium (Na+), total cation exchange capacity (CEC), boron (B), and iron (Fe) as summarized in Table 6, Table 7 and Table 8. The level of N in the soil layer from 10–20 cm shows a negative linear relationship with increasing mixed gelatin sludge (MGS) dose, with values decreasing from 0.65 to 0.45 g kg−1 (Table 8). This may be explained by the linear increase in nitrogen absorption by the grass with increasing MGS dose, as this soil layer is where the highest root volume of forage grasses is concentrated. This indicates the use of fertilizers increases output of N from the 10–20 cm soil layer beyond the replenishment capacity of this layer.
This is based on the fact that N is an important component of proteins, maximizes production of dry matter in forage grasses, and is the primary nutrient for maintaining productivity [30]. When added to soil, it is assimilated by plants. Therefore, N is associated with carbon chains resulting in an increase in cell components. This leads to increases in the vigor of re-sprouting plants, the total production of dry mass given favorable climatic conditions [31], and greater nutrient absorption, as shown in the current study.
Due to the increased output of N to plants, there was a significant reduction in P and K in the 20–40 cm and 40–60 cm soil layers as the dose of MGS increased. In the soil layer from 20 to 40 cm, the levels of P increased from 3.3 to 2.8 mg dm−3, and in the soil layer from 40 to 60 cm, P increased from 2.2 to 2.7 mg dm−3. In the area treated with NPK mineral fertilizer, the lowest amount of P was found in the greatest layers. The level of K showed a negative linear effect with increasing dose of MGS for soil layers 0–10 cm, 10–20 cm, and 20–40 cm. In the 0–5 cm soil layer, the amount of K decreased from 66.7 to 43.7 mg dm−3 and in the 15–30 cm layer, the decrease was from 35.7 to 27.0 mg dm−3 (Table 6).
The decrease in K levels in the soil with increasing doses of MGS may occur due to the increase in N availability driving greater activity within the root systems, resulting in greater K absorption. A well-developed root system makes use of greater soil volume and tends to absorb more nutrients, which in turn benefits plant growth. The increase in dry matter production deriving from increased nutrient availability from MGS and absorption of N and K may have also stimulated absorption of P from the soil to plants.
Both Ca and S showed a positive linear relationship with increasing dose of MGS for the 0–10 cm soil layer. The greatest quantity of each was found for the highest dose of MGS at 3.2 and 7.7 cmolc dm−3, respectively (Table 8). There was a relative increase in Ca and S of 33.14% and 37.88% when compared to the treatment without fertilization, suggesting that these nutrients are introduced to the soil by MGS. The NPK treatment of mineral fertilizer showed levels of Ca equal to the 100% treatment, whereas S was 7.73% lower.
Within micronutrients, Fe level stands out, as it shows a negative linear relationship in the 0–5 cm layer, indicating a reduction in Fe with increasing dose of MGS (Table 6). The Fe in plants is related to metabolic activities, particularly enzyme production (catalase, peroxidase, cytochrome oxidase, and xanthine oxidase). It is also critical to the processes of respiration, photosynthesis, N2 fixation, and electron transfer between Fe2+ and Fe3+ [32,33]. Our present study shows the increase in nutrients by MGS, stimulating production of DM and increasing the demand for Fe from the soil, which also occurred in the NPK treatment. MGS has a considerable amount of available Fe, and the soil is also rich in Fe. We observe that the addition of fertilizers and the increase in photosynthetic plant material also causes the stimulation of absorption of Fe by forage grasses.
The total cation exchange capacity (CEC) showed a negative linear effect with increasing MGS dose in the 40–60 cm soil layer, decreasing from 4.2 to 3.7 cmolc dm−3 (Table 7). In the 0–40 cm soil layer, total CEC did not vary with MGS dose. This is likely related to balancing the base supply from MGS application and extraction with H+.
Sodium (Na+) showed a positive linear relationship with increasing doses of MGS in the upper three soil layers analyzed (0–40 cm; Table 8). The increases in sodium resulting from the highest dose of MGS were 74%, 76%, and 52% higher than the non-fertilized treatments for the 0–10 cm, 10–20 cm, and 20–40 cm layers, respectively. The absence of a significant linear effect in the 40–60 cm layer indicates that the sodium available in the MGS is concentrated in the upper soil layers.
To classify soils that are affected by salts, limiting conditions are based on measurements of soil water at saturation: electrical conductivity, exchangeable sodium percentage, sodium adsorption ratio, and pH (Table 9). The results of exchangeable sodium percentage (ESP) in soil are presented in Figure 7. The highest concentration of Na (18 mg dm−3) and the highest ESP (1.39%) were found for the highest dose of mixed gelatin sludge at the soil surface layer (0–10 cm), which significantly increased the ESP in all the fertilized plots. However, it is important to note that this ESP is well below the limit of 15% considered to indicate sodic soils [34,35].

4. Discussion

4.1. Comparisons to Previous Studies

Similar results compared to our study were where mixed gelatin sludge (MGS) was applied to Piatã grass with increases of 12.88% and 11.43% in tillers in the third and fourth evaluation cycles of treatments with the largest quantity of MGS applied compared to treatments without fertilization [37]. Santos et al., 2013 [38] also observed increases in tillering with increased doses of dairy residue to Mombaça grass. The increase in tillering with increased dose of MGS is likely related to the improved nutrition of the plant, taking into account the increase in organic matter in the soil resulting from the MGS applied.
One of the key elements responsible for the increased productivity of crude protein with increasing doses of MGS is nitrogen, which leads to increased leaf area and also stimulates the production of tillers [39]. Nitrogen is an essential component to biomolecules, such as enzymes, proteins, chlorophyll, nucleic acids, porphyrins, alkaloids, amino acids, and various other molecules. It also plays a crucial role in physiological plant processes, and as such is the most necessary to fertilization for pasture management [40].
Similar to the present study, past research showed increases up to 150% for crude protein (CP) in Brachiaria decumbens for the highest doses of liquid swine waste when compared to the control treatment without fertilization [28]. Santos et al., 2013 [38] tested liquid dairy residue in Mombaça and also observed linear increases in CP with increasing dose of residue. Another study that applied liquid meatpacking waste to Marandu grass saw smaller increases in CP, with levels of CP varying between 9.4% and 11.1% [41].
All treatments present in this study show levels of CP above limiting levels for pasture animals, which are between 6.0% and 8.5% to allow for better fermentation in the rumen [42]. For animals in the fattening phase, the value of CP should approach 10%, and for dairy cows with 15% or more, CP is suggested. Lower levels of CP reduce digestibility of grass and lower voluntary consumption due to the inadequate quantity of nitrogen for rumen microorganisms [43].
Our results corroborate with a prior study that showed neutral detergent fiber (NDF) between 64.2% and 69.7% for Brachiaria decumbens cut at 35 days and fertilized with varying doses of swine waste [28]. However, values shown in this study are lower than those presented by the same past study that showed levels of acid detergent fiber (ADF) in Brachiaria decumbens between 37.5% and 41.7%, though differences may be related to species-specific characteristics of the grasses studied [28]. These results have implications for pasture management since lower levels of fiber in grasses result in greater digestibility. The lower the level of ADF, the lower the lignin, and, consequently, the better the digestibility of the feed [44]. Despite the linear effect observed, the maximum doses of MGS do not cause modifications to the fibrous tissue of the forage. High rates of fiber in pasture grasses may alter the voluntary consumption by ruminant livestock, with lower rates of NDF related to higher grass consumption [45].
Previous research evaluated the effect of household waste water on forage and also found a linear increase in N capture with increasing dosage for all forage cuts [46]. These researchers observed that grasses Tifton 85 and Pojuca showed the greatest accumulation of N in their structure, whereas Marandu grass did not show significant change in N accumulation as household waste water applications increased. The largest increase was for Tifton 85 and is attributed to the higher nutritional needs of this species, which has higher nutritional value and a greater capacity to absorb nutrients [46].
Only doses of 150% and 200% during the rainy season showed mean values of N above adequate levels at 15.42 and 15.89 g kg−1, respectively. Other study treatments did not reach the minimum suggested level of 15 to 25 g kg−1 for both dry and wet seasons [47]. The lowest levels of N were observed during the dry season and are likely related to the lower production of dry matter, which varied from 2.42 to 2.00 t ha−1 during this period. This decreased production is related to edaphoclimatic factors, principally related to variation in temperature, light levels, and radiation.
Other studies tested nitrogen fertilization with urea and ammonium sulfate found varying effects on phosphorus. For example, Costa et al., 2009 [48] varied the nitrogen dose from 0 to 300 kg ha−1 yr−1 and found positive linear effects on nitrogen (N), potassium (K), and magnesium in the leaf tissue of Marandu grass, but a negative linear effect on phosphorus (P). Another past study varied the nitrogen dose from 0 to 800 kg ha−1 yr−1 and found positive linear effects on N and K, while for P and magnesium, there was a positive linear effect until 400 kg ha−1 yr−1 [49]. The levels of sulfur were within adequate levels (0.8 to 2.5 g kg−1) established by Werner et al. [29]. For sulfur (S), it is also necessary to consider the ratio of nitrogen to sulfur (N:S) in plant tissue [50]. In the current study, the N:S ratio in Marandu grass tissue varied between 6.6 and 13.9. Scott et al. 1983 [51] assert that N:S ratios above 14:1 induce S deficiency in plants and Batista 2002 [52] further affirms that Marandu grass dry matter productivity is sensitive to the balance between these nutrients.
In grasses, the absorption of iron (Fe) by roots is dependent on phytosiderophores, which are compounds with high affinity for iron that are secreted within the rhizosphere where they join with Fe3+ to form a chelate compound. This compound is carried within the cell by the specialized Yellow Stripe transporter [32,53]. The high availability of this element in the soil assists in absorption by the plant. Primavesi et al. [49] also observed a linear effect on the absorption of copper (Cu) and zinc (Zn) with an increase in nitrogen availability from urea and ammonium nitrate. In our experiment, the comparative increases in Cu and Zn between the highest dose of MGS and the treatment without fertilization are 44.07% and 56.83%, respectively, for the dry season. Compared to the mineral fertilization treatment, the increases were 44.07% and 47.51%, respectively, also for the dry season. The micronutrients Cu and Zn are critical to plant functions, as they are necessary in the structure of proteins and take part in the processes of photosynthesis, respiration, hormonal regulation, N fixation (indirectly), and metabolism of secondary compounds. For some plants, Cu also takes part in chlorophyll synthesis [54].
Previous studies on the effects of mixed gelatin sludge (MGS) and dairy waste showed positive linear relationships between dosage and soil P and K. For example, Araujo et al. [10] showed increasing levels of P and K with increasing doses of MGS, with maximum levels of 2.38 and 2.07 mg dm−3 for the maximum dose of MGS within the 0–10 cm and 10–20 cm soil layers, respectively. Santos et al. [38], also observed an increase in the level of P in the 0–20 cm soil layer with increasing dairy waste. This was attributed to the limited mobility of P that stays fixed in the surface layer of the soil. Araújo et al. [10] and Santos et al. [38] also found positive linear effects on Ca with increasing MGS dose and increasing dairy waste dose, respectively. However, Araújo et al. [10] observed a significantly higher maximum concentration of 4.41 cmolc dm−3. Similar to our study, Santos et al. [38] also did not see alterations in soil CEC when using more dairy waste.
Other results from the literature show that the sodium contained in the MGS applied is easily weathered to deeper soil layers due to low affinity for the exchange complex, principally remaining in the soil solution [34]. Increases in the concentration of Na in the soil were also reported by Guimarães et al. [9], working with sludge from gelatin production. According to Leal et al., an excess of salt in soils, principally sodium, increases both the salinity and sodicity and results in the deterioration of soil physical properties [34]. Together with the toxic and osmotic effects of this ion (Na+), high salt levels reduce crop production. While Araújo et al. [10] did not observe sodium in soils after fertilization with MGS, Santos et al. [38] observed increases in sodium with application of dairy waste with totals of 6.75 and 8.5 mg dm−3 in the 0–20 cm and 20–40 cm layers, respectively.

4.2. Gelatin Sludge Potential for Agricultural Applications

Increased tillering from mixed gelatin sludge (MGS) application in our experiment can allow for the grass to re-sprout more quickly, reduces the cycling time of the pasture, and allows for the pasture to be grazed more frequently per year. Sbrissia and Silva reinforce that the persistence and perpetuity of forage is based on the number of individual tillers present in its structure [55]. A greater quantity of tillers per area also allows for greater photosynthetic efficiency given increased light interception. This results in higher accumulation of photoassimilates that, in practice, reflect an increase in dry matter production [56].
The results obtained in this study show that increasing the dose of MGS promotes increased growth rates in plants for the same fallow period, potentially improving pasture management. The faster pastures re-sprout, the shorter the rotational grazing period, resulting in a greater frequency of grazing and higher productivity for a given area. This result was expected given that the nitrogen contained in MGS increases the formation of tiller tissues, increasing the rate of elongation and the number of tillers per plant [39].
However, it is important to note that the increase in tillering and height of plants resulting from the highest doses of MGS may be negated over time depending on management. Brachiaria spp. adapts to varying management. When managed to maintain taller grass, their tillers are heavier. However, when managed to maintain lower heights, the grass has an increase in number of tillers, but a decrease in tiller weight [55].
Our results demonstrate that MGS contributes to overall plant nutrition and is particularly promising as it increases productivity of Marandu grass compared to mineral fertilization. Other studies that evaluate the application of residue on pasture grasses have found similar results. Araújo 2016 applied MGS to Piatã grass and found similar tendencies of linear increases in the production of dry matter with increasing doses of MGS [37]. Past research showed increased dry matter production in Brachiaria decumbens with organic fertilizer when compared to mineral fertilizers, and these researchers believed this result was due to the increased mineralization of organic material present in the swine residue applied compared to mineral fertilizer [28].
Nitrogen deficiency causes limitations in protein synthesis and pigmentation of plant tissue, causing significant reductions in photosynthetic activity. This leads to diminished growth and affects the production and quality of biomass [57]. In nitrogen-limited environments, forage growth slows and plants are smaller, with fewer tillers, and insufficient crude protein to meet animal needs, compromising the sustainability of the plant–animal system [58]. In this way, the production of dry matter of tropical grasses is directly related to nitrogen fertilization.
Current results demonstrate the potential of MGS fertilization for Marandu grass during both the dry and rainy seasons, as it led to significant increases in dry matter productivity. It is important to note that no signs of phytotoxicity were observed. However, studies with longer durations are important to monitor the continuity of these observed trends.
Our results suggest that the combination of nutrients provided by MGS improved the bromatological composition of forage without compromising the quality of Marandu grass, instead resulting in a feed with greater nutritive value for animals. According to Develatti et al., higher levels of nitrogen fertilization promote increases in crude protein and proportional reductions in fiber [59]. Magalhães et al. further suggests that MGS promotes increases in nitrogen, calcium, phosphorus, potassium, and magnesium in soils, and stimulates new leaves, which are the components with the highest levels of crude protein in the plant [9].
Our results indicate that the use of MGS leads to increases in crude protein (CP), without impacting levels of fiber in Marandu grass. This is promising given that protein is a high-cost item in animal supplements. If protein levels are higher in the available pasture, the amount offered as supplement can be reduced, further reducing production costs. Analyzing morphological characteristics and bromatological composition of Marandu grass by way of CP production, it is estimated that the 200% treatment in our study had the best results, both increasing the productivity of Marandu grass and not compromising the quality of the forage.
Based on our results of chemical composition in leaf tissue, MGS has potential as a source of nutrients for Marandu grass, especially during the dry season, maintaining a nutritional balance between macro- and micronutrients essential for plant growth. It is important to highlight the effect of MGS in maintaining adequate levels of macronutrients in the soil even in the face of an increase in forage productivity of around 83% at an MGS dose of 200% compared to mineral fertilization in the rainy season and with an increase of 62% in the dry season. Our results demonstrate the importance of MGS as a low-cost fertilizer in recovering and maintaining soil fertility and promoting increased productivity in pastures. Although sodium levels are insufficient to indicate sodicity, it is necessary to evaluate the experiment over a period longer than two years to understand whether accumulation could become problematic for grass production or cause risks to the local environment under similar climatic conditions.

5. Conclusions

The experimental dose of mixed gelatin sludge (MGS) resulting in better productivity and quality of Marandu grass is 200% of the crop’s annual requirement for both the rainy and dry periods. This corresponds to an application of 60.4 metric tons of this sludge per hectare per year. The use of MGS in Marandu grass increased the production of dry matter and crude protein, reduced neutral detergent fiber, and increased the levels of nitrogen, phosphorus, calcium, magnesium, sulfur, copper, and zinc in this grass. The use of MGS increases the levels of calcium and sulfur on the surface, the amount of potassium and sodium in the 0 cm to 40 cm soil layer, and the nitrogen and phosphorus in the subsurface, demonstrating an important effect as a carrier of bases for the subsurface layers of the soil that will guarantee better root development for plants. Increasing sodium in the soil up to the doses used was harmful to neither the soil nor to plant growth. This suggests the need for future studies to evaluate the effect of higher doses of this type of sludge on tropical grass growth and maintenance of adequate levels of soil fertility both in Brazil as well as other geographic regions. Mixed gelatin sludge can be a promising organic fertilizer for the recovery of degraded pastures and as a conditioner of the chemical properties of the tropical soil studied, promoting an increase in the levels of macronutrients and micronutrients in a balanced way and maintaining their adequate levels in this soil even with increased forage productivity. The predominant soil in the Acorizal region has low natural fertility, which leads to low productivity and quality of pasture. Future research can focus on evaluating the effectiveness of MGS as a fertilizer for other forage grass species as well as for other soil types with different fertility levels. In this sense, the use of MGS as a low-cost organic fertilizer can result in increased pasture productivity and producer profitability, contributing to the circular economy of local family farming.

Author Contributions

Conceptualization, D.H.M., D.N.d.S., E.A.F. and W.M.d.S.; methodology, J.G.d.A. and W.M.d.S.; validation, E.A.F., M.L.G. and W.M.d.S.; formal analysis, W.M.d.S.; investigation, C.C., D.C.d.A., E.A.F., J.G.d.A., O.L.d.S.W. and W.M.d.S.; resources, A.K.H.; data curation, J.A.P.P.J.; writing—original draft preparation, E.A.F.; writing—review and editing, A.K.H.; visualization, D.C.d.A., D.H.M., D.N.d.S., J.A.P.P.J., M.L.G. and W.M.d.S.; supervision, C.C., J.G.d.A. and W.M.d.S.; project administration, W.M.d.S.; funding acquisition, M.L.G. and W.M.d.S. All authors have read and agreed to the published version of the manuscript.

Funding

This research received no external funding.

Institutional Review Board Statement

Not applicable.

Informed Consent Statement

Not applicable.

Data Availability Statement

Raw experimental data are available upon request to the corresponding author.

Acknowledgments

We are grateful for institutional support from the Federal University of Mato Grosso for Joadil Gonçalves de Abreu and Oscarlina Lúcia dos Santos Weber, the State University of Mato Grosso for Cassiano Cremon, and the team at the Soil and Nutrition Laboratory of Plants. We thank the Laboratório Solo Certo and director Aurino Junior Araújo for support in chemical analyses. We also thank the Fundação de Amparo a Pesquisa, Assistência e Extensão Rural-FUNDAPER for administrative support, as well as researchers and research assistants from Matogrossense Research, Assistance and Rural Extension Company—EMPAER—whose effort was critical to carrying out this work.

Conflicts of Interest

The authors declare no conflicts of interest.

References

  1. Syed-Hassan, S.S.A.; Wang, Y.; Hu, S.; Su, S.; Xiang, J. Thermochemical processing of sewage sludge to energy and fuel: Fundamentals, challenges and considerations. Renew. Sust. Energ. Rev. 2017, 80, 888–913. [Google Scholar] [CrossRef]
  2. Edwards, J.; Othman, M.; Crossin, E.; Burn, S. Anaerobic co-digestion of municipal food waste and sewage sludge: A comparative life cycle assessment in the context of a waste service provision. Bioresour. Technol. 2017, 223, 237–249. [Google Scholar] [CrossRef] [PubMed]
  3. Zhang, Q.; Hu, J.; Lee, D.; Chang, Y.; Lee, Y. Sludge treatment: Current research trends. Bioresour. Technol. 2017, 243, 1159–1172. [Google Scholar] [CrossRef] [PubMed]
  4. Fijałkowski, K.; Rorat, A.; Grobela, A.; Kacprzak, J. The presence of contaminations in sewage sludge—The current situation. J. Environ. Manag. 2017, 203, 1126–1136. [Google Scholar] [CrossRef] [PubMed]
  5. Kacprzak, M.; Neczaj, E.; Fijałkowski, K.; Grobelak, A.; Grosser, A.; Worwag, M.; Rorat, A.; Brattebo, H.; Almås, A.; Singh, B.R. Sewage sludge disposal strategies for sustainable development. Environ. Res. 2017, 156, 39–46. [Google Scholar] [CrossRef] [PubMed]
  6. Mawioo, P.M.; Garcia, H.A.; Hooijmans, C.M.; Velkushanova, K.; Simonič, M.; Mijatović, I.; Brdjanovic, D. A pilot-scale microwave technology for sludge sanitization and drying. Sci. Total Environ. 2017, 601–602, 1437–1448. [Google Scholar] [CrossRef] [PubMed]
  7. Araújo, V.S.; Silva, M.O.; Brito, A.S.; Sousa, I.L.; Nunes, F.C.; Souza, J.F.M.; Oliveira, I.V.; Silva, C.R.; Carvalho, F.I.M.; Silva, J.N.; et al. Lodo de esgoto e suas potencialidades agrícolas. Res. Soc. Dev. 2022, 11, e14711326200. [Google Scholar] [CrossRef]
  8. Ribeiro, F.L.M. Quantificação e Caracterização Química dos Resíduos da ETA de Itabirito—MG. Master’s Thesis, Universidade de Ouro Preto, Ouro Preto, MG, Brazil, 2007; pp. 1–115. Available online: https://www.repositorio.ufop.br/bitstream/123456789/2862/1/DISSERTA%C3%87%C3%83O_Quantifica%C3%A7%C3%A3oCaracteriza%C3%A7%C3%A3oQu%C3%ADmica.pdf (accessed on 6 February 2024).
  9. Guimarães, R.C.M.; Cruz, M.C.P.; Ferreira, M.E.; Taniguchi, C.A.K. Chemical properties of soils treated with biological sludge from gelatin industry. Rev. Bras. Ciênc. Solo 2012, 36, 653–660. [Google Scholar] [CrossRef]
  10. Araújo, A.S. Chemical characteristics of the use of gelatine sludge in soil cultivated as fertilizer. J. Agric. Sci. 2018, 10, 477–483. [Google Scholar] [CrossRef]
  11. Abreu, A.H.M.D.; Alonso, J.M.; Melo, L.A.D.; Leles, P.S.D.S.; Santos, G.R.D. Caracterização de biossólido e potencial de uso na produção de mudas de Schinus terebinthifolia Raddi. Eng. Sanit. Ambient. 2019, 24, 591–599. [Google Scholar] [CrossRef]
  12. Rigby, H.; Clarke, B.O.; Pritchard, D.L.; Meehan, B.; Beshah, F.; Smith, S.R.; Porter, N.A. A critical review of nitrogen mineralization in biosolids amended soil, the associated fertilizer value for crop production and potential for emissions to the environment. Sci. Total Environ. 2016, 541, 1310–1338. [Google Scholar] [CrossRef] [PubMed]
  13. Andreoli, C.V.; Von Sperling, M.; Fernandes, F. Lodo de Esgotos: Tratamento e Disposição Final, 2nd ed.; UFMG: Belo Horizonte, MG, Brazil, 2014; pp. 1–444. Available online: https://docs.ufpr.br/~rtkishi.dhs/TH029/TH029_15_Lodos.pdf (accessed on 18 February 2024).
  14. Alvarenga, P.; Mourinha, C.; Farto, M.; Santos, T.; Palma, P.; Sengo, J.; Morais, M.C.; Cunha-Queda, C. Sewage sludge, compost and other representative organic wastes as agricultural soil amendments: Benefits versus limiting factors. Waste Manag. 2015, 40, 44–52. [Google Scholar] [CrossRef]
  15. Petrie, B.; Barden, R.; Kasprzyk-Horden, B. A review on emerging contaminants in wastewaters and the environment: Current knowledge, understudied areas and recommendations for future monitoring. Water Res. 2015, 72, 3–27. [Google Scholar] [CrossRef] [PubMed]
  16. Instituto Nacional de Meteorologia (INMET). Meterological Data, National Institute of Meterology. Available online: https://portal.inmet.gov.br/ (accessed on 6 February 2024).
  17. Food and Agriculture Organization of the United Nations. Word Reference Base for Soil Resources 2014: International Soil Classification System for Naming Soils and Creating Legends for Soil Maps; World Soil Resources Reports 106; IUSS Working Group WRB: Rome, Italy, 2015; pp. 1–192. ISBN 978-92-5-108370-3. Available online: https://www.fao.org/3/i3794en/I3794en.pdf (accessed on 25 February 2024).
  18. Santos, H.G.; Jacomine, P.K.T.; Anjos, L.H.C.; Oliveira, V.A.; Lumbreras, J.F.; Coelho, M.R.; Almeida, J.Á.; Araujo Filho, J.C.; Oliveira, J.B.; Cunha, T.J.F. Sistema Brasileiro de Classificação de Solos, 5th ed.; Embrapa: Brasília, DF, Brazil, 2018; pp. 1–356. Available online: https://www.embrapa.br/en/busca-de-noticias/-/noticia/36491462/sistema-brasileiro-de-classificacao-de-solos-ganha-versao-eletronica-gratuita (accessed on 6 February 2024).
  19. de Souza, D.M.G.; Lobato, E. Adubação com Nitrogênio. In Cerrado: Correção do Solo e Adubação, 2nd ed.; de Souza, D.M.G., Lobato, E., Eds.; Embrapa Cerrados: Brasília, DF, Brazil, 2004; pp. 129–145. Available online: https://www.embrapa.br/en/busca-de-publicacoes/-/publicacao/555355/cerrado-correcao-do-solo-e-adubacao (accessed on 6 February 2024).
  20. do Valle, C.B.; Pagliarini, M.S. Biology, cytogenetics, and breeding of Brachiaria. In Genetic Resources, Chromosome Engineering, and Crop Improvement; Singh, R.J., Ed.; CRC Press: Boca Raton, FL, USA, 2009; Volume 5, pp. 103–151. [Google Scholar]
  21. do Valle, C.B.; Macedo, M.C.M.; Euclides, V.P.B.; Jank, L.; Resende, L.M.S. Gênero Brachiária. In Plantas Forrageiras; Fonseca, D.M., Martuscello, J.A., Eds.; Universidade Federal de Viçosa: Viçosa, MG, Brazil, 2010; pp. 30–77. [Google Scholar]
  22. do Valle, C.B.; Euclides, V.P.B.; Pereira, J.M.; Valério, J.R.; Pagliarini, M.S.; Macedo, M.C.M.; Leite, G.G.; Lourenço, A.J.; Fernandes, C.D.; Dias-Filho, M.B.; et al. O Capim-Xaraés (Brachiaria Brizantha cv. Xaraés) na Diversificação das Pasta-Gens de Braquiária; Documentos 149; Embrapa Gado de Corte: Campo Grande, MS, Brazil, 2004; pp. 1–36. [Google Scholar]
  23. Euclides, V.P.B.; Macedo, M.C.M.; do Valle, C.B.; Barbosa, R.A.; Goncalves, W.V. Produção de forragem e características da estruturado dossel de cultivares de Brachiaria brizantha sob pastejo. Pesq. Agropec. Bras. 2008, 43, 1805–1812. [Google Scholar] [CrossRef]
  24. Silva, R.S.G.; Bandeira, S.F.; Petry, F.C.; Pinto, L.A.A. Extração de gelatina a partir das peles de cabeças de carpa comum. Ciênc. Rural 2011, 41, 904–909. [Google Scholar] [CrossRef]
  25. de Santana do Carmo, C.A.F.; de Araújo, W.S.A.; de Campos Bernardi, A.C.; Saldanha, M.F.C. Métodos de Análise de Tecidos Vegetais Utilizados na Embrapa Solos; Empresa Brasileira de Pesquisa Agropecuária (EMBRAPA), Embrapa Solos: Rio de Janeiro, Brazil, 2000; pp. 1–41. Available online: https://ainfo.cnptia.embrapa.br/digital/bitstream/item/62212/1/Metodo-de-analise-de-tecido.pdf (accessed on 6 February 2024).
  26. Statistical Package for Social Sciences from IBM Corp. SPSS 20.0. 2011. Available online: https://www.ibm.com/support/pages/downloading-ibm-spss-statistics-20 (accessed on 6 February 2024).
  27. Frazão, J.J.; Silva, Á.R.; Silva, V.L.; Oliveira, V.A.; Côrrea, R.S. Fertilizantes nitrogenados de eficiência aumentada e uréia na cultura do milho. Rev. Bras. Eng. Agrícola Ambient. 2014, 18, 1262–1267. [Google Scholar] [CrossRef]
  28. Silva, A.A.; Lana, A.M.Q.; Lana, R.M.Q.; Costa, A.M. Fertilização com dejetos suínos: Influência nas características bromatológicas da Brachiaria decumbens e alterações no solo. Eng. Agríc. 2015, 35, 254–265. [Google Scholar] [CrossRef]
  29. Werner, J.C.; Paulino, T.V.; Cantarella, H.; Andrade, N.O.; Quaggio, J.A. Recomendação de Adubação e Calagem Para o Estado de São Paulo, 2nd ed.; Instituto Agronômico: Campinas, SP, Brazil, 1996; pp. 263–273. [Google Scholar]
  30. Dupas, E.; Buzetti, S.; Rabêlo, F.H.S.; Sarto, A.L.; Cheng, N.C.; Teixeira Filho, M.C.M.; Galindo, F.S.; Dinalli, R.P.; Gazola, R.N. Nitrogen recovery, use efficiency, dry matter yield, and chemical composition of palisade grass fertilized with nitrogen sources in the Cerrado biome. Aust. J. Crop Sci. 2016, 10, 1330–1338. [Google Scholar] [CrossRef]
  31. Galindo, F.S.; Buzetti, S.; Teixeira Filho, M.C.M.; Dupas, E.; Ludkiewicz, M.G.Z. Application of different nitrogen doses to increase nitrogen efficiency in Mombasa guinegrass (Panicum maximum cv. mombasa) at dry and rainy seasons. Aust. J. Crop Sci. 2017, 11, 1657–1664. [Google Scholar] [CrossRef]
  32. Guerinot, M.A.; Yi, Y. Iron: Nutritious, Noxious, and Not Readily Available. Plant Physiol. 1994, 104, 815–820. Available online: https://www.jstor.org/stable/4275695 (accessed on 7 February 2024). [CrossRef]
  33. Marrenco, R.A.; Lopes, N.F. Fisiologia Vegetal, 3rd ed.; UFV: Viçosa, MG, Brazil, 2009; pp. 1–486. [Google Scholar]
  34. Leal, R.M.P.; Firme, L.P.; Montes, C.R.; Melfi, A.J.; Piedade, S.M.S. Soil exchangeable cations, sugarcane production and nutrient uptake after wastewater irrigation. Sci. Agric. 2009, 66, 242–249. [Google Scholar] [CrossRef]
  35. Duarte, A.S.; Rolim, M.M.; Silva, Ê.F.F.; Pedrosa, E.M.R.; Albuquerque, F.S.; Magalhães, A.G. Alterações dos atributos físicos e químicos de um Neossolo após aplicação de doses de manipueira. Rev. Bras. Eng. Agrícola Ambient. 2013, 17, 938–946. [Google Scholar] [CrossRef]
  36. Richards, L.A. Diagnosis and Improvement of Saline and Alkali Soils. In Agriculture Handbook 60; U.S. Department of Agriculture: Washington, DC, USA, 1969; pp. 1–160. Available online: https://www.ars.usda.gov/pacific-west-area/riverside-ca/agricultural-water-efficiency-and-salinity-research-unit/docs/publications/handbook-no-60/ (accessed on 25 February 2024).
  37. Araújo, A.S. Aproveitamento do Lodo DAF da Indústria de Gelatina Como Alternativa de Adubação do Capim Piatã. Tese de Doutorado. Ph.D. Thesis, Universidade Federal do Tocantins, Araguaína, TO, Brazil, 2016. Available online: https://repositorio.uft.edu.br/handle/11612/529 (accessed on 6 February 2024).
  38. Santos, P.M.; Santos, A.C.; Silva, J.E.C. Resíduo de laticínio em pastagem de capim Mombaça: Atributos químicos da forragem e do solo. Semin. Ciênc. Agrár. 2013, 34, 377–390. [Google Scholar] [CrossRef]
  39. Bezerra, R.C.A.; Leite, M.L.M.V.; Almeida, M.C.R.; Lucena, L.R.R.; Simões, V.J.L.P.; Bezerra, F.J.S.M. Características Agronômicas de Urochloa Mosambicensis sob Diferentes Níveis de Fósforo e Nitrogênio. Magistra 2019, 30, 268–276. Available online: https://www3.ufrb.edu.br/magistra/index.php/magistra/article/view/738/393 (accessed on 18 May 2023).
  40. Cabral, C.E.A.; Cabral, L.S.; Silva, B.E.M.; Carvalho, K.S.; Kroth, B.E.; Cabral, C.H.A. Resposta da Brachiaria brizantha cv. Marandu a fertilizantes nitrogenados associados ao fosfato natural reativo. Comun. Sci. 2016, 7, 66–72. [Google Scholar] [CrossRef]
  41. Silva Neto, S.P.; Silva, J.E.C.; Santos, A.C.; Castro, J.G.D.; Dim, V.P.; Araújo, A.S. Características agronômicas e nutricionais do capim-Marandu em função da aplicação de resíduo líquido de frigorífico. Acta Sci. Anim. Sci. 2010, 32, 9–17. [Google Scholar] [CrossRef]
  42. Prado, R.M. Manual de Nutrição de Plantas Forrageiras; Funep: São Paulo, SP, Brazil, 2008; pp. 1–500. [Google Scholar]
  43. Costa, K.A.P.; Rosa, B.; Oliveira, I.P.; Custódio, D.P.; Silva, D.C. Efeito da estacionalidade na produção de matéria seca e composição bromatológica da Brachiaria brizantha cv. Marandu. Ciênc. Anim. Bras. 2005, 6, 187–193. Available online: https://revistas.ufg.br/vet/article/view/365/340 (accessed on 7 February 2024).
  44. Sniffen, C.J.; O’Connor, D.J.; Van Soest, P.J.; Fox, D.G.; Russell, J.B. A net carbohydrate and protein system for evaluating cattle diets: Carbohydrate and protein availability. J. Anim. Sci. 1992, 70, 3562–3577. [Google Scholar] [CrossRef] [PubMed]
  45. Gonçalves, M.S.; Ribeiro, W.R.; Reis, E.F.; Cóser, A.C. Bromatologia de gramíneas tropicais sob diferentes tensões de água no solo em ambiente protegido. Nativa 2018, 6, 415–421. [Google Scholar] [CrossRef]
  46. Nazário, A.A.; Garcia, G.O.; Reis, E.F.; Mendonça, E.S.; Melline, J.G.B. Acúmulo de nutrientes por forrageiras cultivadas em sistema de escoamento superficial para tratamento de esgoto doméstico. Rev. Ambient. Água 2014, 9, 97–108. [Google Scholar] [CrossRef]
  47. Malavolta, E.; Vitti, G.C.; Oliveira, S.A. Avaliação do Estado Nutricional das Plantas: Princípios e Aplicações, 2nd ed.; Potafos: Piracicaba, SP, Brazil, 1997; pp. 1–319. [Google Scholar]
  48. Costa, K.A.P.; Faquin, V.; de Oliveira, I.P.; da Costa Serveriano, E.; de Oliveira, M.A. Doses e Fonts se Nitrogênio na Nutrição Mineral do Capim-Marandu. Ciec. Anim. Bras. 2009, 10, 115–123. Available online: http://repositorio.ufla.br/bitstream/1/42917/1/ARTIGO_Doses%20e%20fontes%20de%20nitrog%C3%AAnio%20na%20nutri%C3%A7%C3%A3o%20mineral%20do%20capim-marandu.pdf (accessed on 25 February 2024).
  49. Primavesi, A.C.; Primavesi, O.; Corrêa, L.A.; Cantarella, H.; Primavesi, A.C.; Silva, A.G. Nutrientes na fitomassa de capim-marandu em função de fontes e doses de nitrogênio. Ciênc. Agrotecnologia 2006, 30, 562–568. [Google Scholar] [CrossRef]
  50. Monteiro, F.A.; Colozza, M.T.; Werner, J.C. Enxofre e Micronutrientes em Pastagens. In Simpósio Sobre Manejo da Pastagem; Annals; FEALQ: Piracicaba, Brazil, 2004; pp. 279–301. Available online: https://repositorio.usp.br/item/001416828 (accessed on 25 February 2024).
  51. Scott, N.M.; Watson, M.E.; Caldwell, K.S. Response of grassland to the application of sulphur at two sites in north-east Scotland. J. Sci. Food Agric. 1983, 34, 357–361. [Google Scholar] [CrossRef]
  52. Batista, K. Respostas do Capim-Marandu a Combinações de Doses de Nitrogênio e Enxofre. Master’s Thesis, Escola Superior de Agricultura “Luiz de Queiroz”, Piracicaba, SP, Brazil, 2002; pp. 1–91. Available online: https://www.teses.usp.br/teses/disponiveis/11/11140/tde-18022003-155114/publico/karina.pdf (accessed on 7 February 2024).
  53. Briat, J.; Curie, C.; Gaymard, F. Iron utilization and metabolism in plants. Plant Biol. 2007, 10, 276–282. [Google Scholar] [CrossRef] [PubMed]
  54. Taiz, L.; Zeiger, E.; Moller, I.M.; Murphy, A. Fisiologia e Desenvolvimento Vegetal, 6th ed.; Artmed: Porto Alegre, RS, Brazil, 2017; pp. 1–848. [Google Scholar]
  55. Sbrissia, A.F.; Silva, S.C. Compensação tamanho/densidade populacional de perfilhos em pastos de capim-marandu. R. Bras. Zootec. 2008, 37, 35–47. [Google Scholar] [CrossRef]
  56. Silva, L.V.; Cândido, M.J.D.; Pessoa, J.P.M.; Cavalcante, A.C.R.; Carneiro, M.S.S.; Silva, A.N. Componentes da biomassa e características estruturais em capim-aruana sob diferentes frequências e intensidades de desfolhação. Pesq. Agropec. Bras. 2015, 50, 1192–1200. [Google Scholar] [CrossRef]
  57. Skonieski, F.R.; Viégas, J.; Martin, T.N.; Nornberg, J.L.; Meinerz, G.R.; Tin, T.J.; Bernhard, P.; Frata, M.T. Effect of seed inoculation with Azospirillum brasilense and nitrogen fertilization rates on maize plant yield and silage quality. R. Bras. Zootec. 2017, 46, 722–730. [Google Scholar] [CrossRef]
  58. Hungria, M.; Nogueira, M.A.; Araújo, R.S. Inoculation of Brachiaria spp. with the plant growth-promoting bacterium Azospirillum brasilense: An environment friendly component in the reclamation of degraded pastures in the tropics. Agric. Ecosyst. Environ. 2016, 221, 125–131. [Google Scholar] [CrossRef]
  59. Delevatti, L.M.; Cardoso, A.S.; Barbero, R.P.; Leite, R.G.; Romanzini, E.P.; Ruggieri, A.C.; Reis, R.A. Effect of nitrogen application rate on yield, forage quality, and animal performance in a tropical pasture. Sci. Rep. 2019, 9, 7596. [Google Scholar] [CrossRef]
Figure 1. Mixed gelatin sludge circular economy in Brazil.
Grasses 03 00005 g001
Figure 2. Research Station of the Empresa Mato-Grossense de Pesquisa, Assistência e Extensão Rural. (A) Area, (B) plots, and (C) soil profile.
Grasses 03 00005 g002
Figure 3. Monthly means of minimum, mean, and maximum temperature (°C); relative humidity (%); and precipitation (mm) during the experimental period of September 2019 through June 2021 in Acorizal, Mato Grosso state, Brazil. Source: Inmet, 2023 [16].
Grasses 03 00005 g003
Figure 4. Experimental (A) application of mixed gelatin sludge to treatment plot and (B) close-up of applied gelatin sludge.
Grasses 03 00005 g004
Figure 5. Bromatological characteristics of Marandu grass under the effect of varying doses of mixed gelatin sludge during dry and rainy seasons. R2: Coefficient determination of the regression variance analysis. The * and ** indicate levels of significance of constants within regression models of 5% and 1%, respectively; NPK Rainy and NPK Dry were not considered in the regression model as it is the standard treatment studied (50 kg ha−1 of N). iNDF: indigestible neutral detergent fiber.
Grasses 03 00005 g005
Figure 6. Chemical characteristics of leaf tissue of Marandu grass under varying dosage of GMS and mineral fertilization during the rainy and dry seasons. R2: Coefficient determination of the regression variance analysis. * and ** indicate levels of significance of constants within regression models of 5% and 1%, respectively; NK Rainy and NPK Dry were not considered in the regression model as it is the standard treatment studied (50 kg ha−1 of N).
Grasses 03 00005 g006aGrasses 03 00005 g006b
Figure 7. Exchangeable sodium percentage ± standard deviation in different soil layers varying dosages of mixed gelatin sludge and mineral fertilization.
Grasses 03 00005 g007
Table 1. Primary nutrient, chemical, and granulometric analyses of soil layers prior to installing experimental design.
SampleProfilepHPKCa + Mg CaMgAlHM.O.SandSiltClaySBCECVSat AlNa
cmH2OCaCl2mg dm−3cmolc dm−3g dm−3g kg−1cmolc dm−3%mg kg−1
A10–206.45.76.371.73.312.400.9101.8821.3723562213.505.3865.1021.0
A220–405.24.51.937.40.940.650.290.452.7710.2690662441.044.2624.430.2
B140–705.04.21.223.20.850.600.250.682.579.75231173600.914.1621.942.822.0
B270–1004.84.00.922.20.660.450.210.752.7510.74561344100.724.2217.151.0
C1100–1304.74.00.626.30.570.400.171.322.5611.82901565540.644.5114.267.418.0
C2130–1704.74.11.224.20.470.300.171.052.9811.24561304140.534.5511.766.5
Table 2. Secondary nutrient and micronutrient analyses of soil layers for experiment prior to installing experimental design.
SampleProfile Saturation (%)ZnCuFeMnBSNFe2O3SiO2Al2O3P2O5TiO2
cmCaKMgHmg dm−3g kg−1
A10–2044.613.4616.9134.8512.42.0117162.30.487.10.8556.748.239.80.092.01
A220–4015.262.286.8165.142.51.123434.40.357.3
B140–7014.421.456.0161.782.00.613617.00.327.30.3369.159.662.50.053.66
B270–10010.661.374.9865.171.90.41289.80.197.7
C1100–1308.871.513.7756.651.30.51054.70.214.90.29132.1128.6136.80.062.49
C2130–1706.591.383.7465.381.70.71565.40.185.2
Table 3. Results of the chemical analysis of mixed gelatin sludge at the start and end of the experiment and doses applied to each treatment. Values below the lowest detectable quantity are labeled (LQ).
Elements in Mixed Gelatin Sludge (MGS) at
the Start and End of the Experiment
Doses of MGS by Treatment
(kg ha−1)
ElementUnitFeb/20Feb/21MeanCV (%)50%100%150%200%
pH (CaCl2) 7.17.17.10.1----
Nitrogen (NO3/NH4+)%4.04.24.13.159.1118.1177.2236.2
Phosphorus (H2PO4/H2PO4−2)%1.11.21.22.416.733.350.066.7
Potassium (K+)%0.70.10.497.66.012.118.124.1
Calcium (Ca2+)%4.76.75.724.282.0163.9245.9327.9
Magnesium (Mg2+)%0.10.10.132.60.91.92.83.7
Sulfur (SO4−2)%0.70.50.626.88.316.725.033.3
Sodium (Na+)%0.11.10.6122.48.517.125.634.2
Boron (B[OH]3/H3BO3)mg kg−143.130.236.725.00.10.10.20.2
Iron (Fe2+)mg kg−11283.61646.71465.117.52.14.26.38.4
Manganese (Mn2+)mg kg−120.733.727.233.6<LQ0.10.10.2
Copper (Cu2+)mg kg−115.620.017.817.6<LQ0.10.10.1
Zinc (Zn2+)mg kg−1104.775.790.222.70.10.30.40.5
Nickel (Ni2+)mg kg−10.13.21.6137.1<LQ<LQ<LQ<LQ
Cadmium (Cd2+)mg kg−1<LQ<LQ<LQ<LQ<LQ<LQ<LQ<LQ
Mercury (Hg2+)mg kg−1<LQ<LQ<LQ<LQ<LQ<LQ<LQ<LQ
Chromium (Cr2+)mg kg−112.68.710.626.0<LQ<LQ<LQ0.1
Organic carbong kg−114.816.815.89.0<LQ<LQ<LQ<LQ
Total carbong kg−1515.1473.9494.55.90.10.10.20.3
Cation exchange capacitycmolc kg−126.520.023.319.80.71.42.22.9
Total organic materialg kg−1888.0817.0852.55.933.466.8100.2133.6
Compostable
Organic material
g kg−125.628.927.38.61224.92449.73674.64899.4
Compost resistant
Organic material
g kg−1862.5788.2825.46.439.278.3117.5156.6
Soluble mineral residueg kg−1107.9173.4140.732.91185.82371.73557.54743.4
Insoluble mineral residueg kg−14.09.66.858.2202.1404.2606.3808.3
Total mineral residueg kg−1112.0183.0147.534.09.819.529.339.1
Total humidityg kg−1807.1809.8808.50.2211.9423.9635.8847.7
Grease oilsg kg−189.178.083.69.41161.62323.13484.74646.3
Carbon/nitrogen ratio-44,939.044,937.044,938.011.8----
Table 4. Mixed gelatin sludge applied (kg ha−1) per cycle and annually by treatment.
Treatment *Dose per Application Cycle
(kg ha−1 Per Cycle)
Annual Dose
(kg ha−1 Per Year)
0%00
50%2.60115.606
100%5.20231.212
150%7.80346.818
200%10.40462.424
* Considering a requirement of 50 kg N ha−1 per cycle for Marandu grass.
Table 5. Morphological characteristics and Marandu grass productivity under the effect of varying doses of GMS during dry and rainy seasons.
Marandu Grass
Morphological Characteristics
Dose
Season0%50%100%150%200%NPKRegression Equation RfR2
Tillering
(tillers m2)
Rainy637.86 546.91 619.34 701.23 640.74 562.14 ŷ = 629.22
Dry672.84 683.95 761.11 791.36 809.88 708.02 ŷ = 704.815 + 1.16x **0.49
Height (cm)Rainy37.03 38.57 43.15 44.91 44.05 37.75 ŷ = 37.468 + 0.041x **0.46
Dry28.71 32.57 35.09 35.57 37.25 27.65 ŷ = 31.258 + 0.055x **0.49
Leaves (%)Rainy73.60 73.03 72.04 74.57 75.05 74.73 ŷ = 73.66
Dry76.96 75.19 73.40 74.70 76.43 77.70 ŷ = 79.23
Pseudostem (%)Rainy26.40 26.97 27.96 25.43 24.95 25.27 ŷ = 26.34
Dry23.04 24.81 26.60 25.30 23.57 22.30 ŷ = 27.77
Leaf blade/pseudostem ratioRainy2.82 2.77 2.76 3.08 3.12 3.04 ŷ = 2.91
Dry3.37 3.23 2.93 2.98 3.33 3.53 ŷ = 3.94
Dry matter (t ha−1)Rainy1.41 1.90 2.63 3.23 3.52 1.92 ŷ = 1.427 + 0.011x **0.93
Dry1.36 1.79 2.37 2.44 2.51 1.55 ŷ = 0.878 + 0.010x **0.85
Crude protein
(kg ha−1)
Rainy161.88 239.82 367.97 440.81 486.92 240.30 ŷ = 169.268 + 1.702x **0.93
Dry151.81 223.95 325.05 382.42 392.15 198.55 ŷ = 57.902 + 1.574x **0.93
R2: coefficient of determination. ** Significance of model constants at 0.01. Rf Indicates that nitrogen, phosphorus, and potassium (NPK) were not considered in the regression model as it is the standard treatment studied (50 kg ha−1 of N).
Table 6. Chemical attributes by soil layer and by mixed gelatin sludge dose at the conclusion of the experiment for macronutrients and secondary nutrients for plants.
Chemical
Characteristics
Doses
Soil Layers (cm)0%50%100%150%200%NPKRegression
Equation Rf
R2
Nitrogen (N in g kg−1)
0–100.6 0.7 0.6 0.8 0.7 0.4 ŷ = 0.68
10–200.7 0.6 0.5 0.5 0.5 0.6 ŷ = 0.6467 − 0.001x *0.3
20–400.3 0.4 0.3 0.4 0.4 0.4 ŷ = 0.36
40–600.6 0.4 0.4 0.4 0.5 0.4 ŷ = 0.46
Phosphorus (P in mg dm−3)
0–1014.6 24.7 20.0 26.0 16.6 9.6 ŷ = 20.38
10–209.7 3.8 9.1 4.9 4.6 5.0 ŷ = 6.42
20–403.3 3.4 2.9 2.2 2.8 3.3 ŷ = 3.3633 − 0.0045x * 0.3
40–602.7 2.7 2.2 1.7 2.2 2.4 ŷ = 2.68 − 0.004x * 0.3
Potassium (K in g kg−1)
0–1066.7 54.0 55.3 39.3 43.7 43.0 ŷ = 63.933 − 0.1213x ** 0.4
10–2044.7 42.0 39.0 26.0 31.3 26.0 ŷ = 45.133 − 0.0853x * 0.3
20–4035.7 32.3 32.0 22.7 27.0 26.0 ŷ = 35.333 − 0.054x * 0.3
40–6028.7 22.0 29.0 27.3 27.3 23.3 ŷ = 26.86
Calcium (Ca2+ in cmolc dm−3)
0–102.6 2.1 3.0 3.4 2.9 3.0 ŷ = 2.4133 + 0.004x * 0,3
10–202.2 1.2 2.3 2.1 1.9 1.8 ŷ = 1.94
20–401.6 1.3 1.6 1.61.2 1.7 ŷ = 1.46
40–601.4 1.2 1.1 1.4 1.0 1.5 ŷ = 1.22
Magnesium (Mg2+ in cmolc dm−3)
0–101.0 0.9 0.9 0.8 0.8 1.1 ŷ = 0.88
10–200.7 0.6 0.6 0.5 0.6 0.5 ŷ = 0.60
20–400.5 0.4 0.5 0.4 0.4 0.4 ŷ = 0.44
40–600.6 0.4 0.5 0.5 0.5 0.4 ŷ = 0.50
Sulfur (S in mg dm−3)
0–105.7 5.8 6.4 8.1 7.3 5.1 aŷ = 5.596 + 0.0106x * 0.2
10–205.3 5.8 6.2 5.7 6.4 5.7 aŷ = 5.88
20–405.2 6.0 5.2 5.5 5.3 5.0 aŷ = 5.44
40–605.0 5.6 4.5 5.3 5.1 4.9 a ŷ = 5.10
R2: coefficient of determination; * and ** indicate the level of significance of constants within regression models of 5 and 1%, respectively. Rf indicates that nitrogen, phosphorus, and potassium (NPK) were not considered in the regression model as it is the standard treatment studied (50 kg ha−1 of N).
Table 7. Chemical attributes by soil layer and by mixed gelatin sludge dose at the conclusion of the experiment for soil quality measures.
Chemical
Characteristics
Doses
Soil Layers (cm)0%50%100%150%200%NPKRegression
Equation Rf
R2
pH
0–106.36.2 6.2 6.2 6.2 6.2 ŷ = 6.22
10–205.9 5.6 6.0 6.0 5.8 5.8 ŷ = 5.86
20–405.8 5.5 5.6 5.8 5.7 5.8 ŷ = 5.68
40–605.8 5.6 5.6 5.9 5.8 5.8 ŷ = 5.74
Organic matter (OM in dag kg−1)
0–101.7 1.9 1.8 1.8 1.8 2.0 ŷ = 1.80
10–201.5 1.6 1.5 1.3 1.6 1.3 ŷ = 1.50
20–401.1 0.9 1.1 1.0 0.8 1.1 ŷ = 0.98
40–600.9 0.7 0.8 0.7 0.7 0.8 ŷ = 0.76
Hydrogen+ Aluminum (H+Al cmolc dm−3)
0–101.9 1.9 1.9 1.91.9 2.1 ŷ = 1.9
10–202.4 2.5 2.6 2.4 2.7 2.4 ŷ = 2.52
20–402.3 2.4 2.6 2.2 2.6 2.1 ŷ = 2.42
40–602.2 2.2 2.3 1.9 2.1 1.9 ŷ = 2.14
Sum of Bases (SB in cmolc dm−3)
0–103.7 3.2 4.1 4.43.9 4.2 ŷ = 3.86
10–203.0 1.9 3.1 2.7 2.6 2.4 ŷ = 2.66
20–402.2 1.7 2.1 2.1 1.7 2.2 ŷ = 1.96
40–602.0 1.6 1.6 2.0 1.5 2.3 ŷ = 1.74
Total Cation Exchange Capacity (CEC in cmolc dm−3)
0–105.6 5.1 6.0 6.2 5.7 6.2 ŷ = 5.72
10–205.4 4.4 5.7 5.1 5.2 4.8 ŷ = 5.16
20–404.5 4.1 4.7 4.3 4.3 4.3 ŷ = 4.38
40–604.2 3.8 3.9 3.9 3.7 4.0 ŷ = 4.0707 − 0.0019x *0.3
Bases Saturation (V in %)
0–1066.9 63.8 68.6 70.2 67.5 66.7 ŷ = 67.4
10–2054.7 43.7 54.9 53.2 48.7 49.6 ŷ = 51.04
20–4049.9 41.5 45.1 48.4 39.5 49.5 ŷ = 44.88
40–6048.3 42.8 41.3 50.5 41.6 56.9 ŷ = 44.90
R2: coefficient of determination; * indicate the level of significance of constants within regression models of 5%. Rf indicates that nitrogen, phosphorus, and potassium (NPK) were not considered in the regression model as it is the standard treatment studied (50 kg ha−1 of N).
Table 8. Chemical attributes by soil layer and by mixed gelatin sludge dose at the conclusion of the experiment for micronutrients for plants.
Chemical
Characteristics
Doses
Soil Layers (cm)0%50%100%150%200%NPKRegression
Equation Rf
R2
Sodium (Na+ in mg dm−3)
0–104.7 9.0 13.7 17.7 18.0 6.3 ŷ = 5.5333 + 1.35x ** 0.9
10–203.0 5.0 10.0 8.0 12.3 3.7 ŷ = 3.3333 + 0.0433x ** 0.7
20–401.7 2.0 2.5 4.0 3.5 1.3 ŷ = 1.6 + 0.0113x ** 0.6
40–601.0 1.0 1.0 1.01.0 1.0 ŷ = 1.0
Boron (B in mg dm−3)
0–100.20.2 0.2 0.2 0.2 0.2 ŷ = 0.20
10–200.2 0.2 0.2 0.2 0.2 0.2 ŷ = 0.20
20–400.2 0.2 0.2 0.2 0.2 0.2 ŷ = 0.194 − 0.0002x *0.3
40–600.2 0.2 0.2 0.2 0.1 0.2 ŷ = 0.18
Copper (Cu in mg dm−3)
0–100.60.6 0.7 0.6 0.6 0.6 ŷ = 0.62
10–200.60.7 0.7 0.6 0.6 0.6 ŷ = 0.64
20–400.70.7 0.7 0.7 0.7 0.6 ŷ = 0.70
40–600.70.7 0.6 0.6 0.6 0.6 ŷ = 0.64
Iron (Fe in mg dm−3)
0–1080.0 90.5 53.0 41.3 59.0 53.5 ŷ = 83.00 − 0.1823x * 0.3
10–2090.0 120.0 70.3 63.0 73.3 57.5 ŷ = 83.32
20–4077.0 78.7 83.7 66.0 71.3 36.5 ŷ = 75.34
40–6067.7 75.3 70.3 58.7 86.7 51.3 ŷ = 71.74
Manganese (Mn in mg dm−3)
0–1061.9 61.1 67.5 65.3 63.7 62.9 ŷ = 63.90
10–2048.8 38.0 54.9 48.5 48.8 37.2 ŷ = 47.8
20–4034.7 26.4 39.5 32.3 23.2 26.8 ŷ = 31.22
40–6024.8 19.2 22.1 24.0 25.9 15.6 ŷ = 23.2
Zinc (Zn in mg dm−3)
0–101.0 1.3 1.1 1.1 1.0 0.9 ŷ = 1.10
10–200.8 0.7 0.7 0.6 0.6 0.7 ŷ = 0.68
20–400.4 0.3 0.4 0.4 0.3 0.3 ŷ = 0.36
40–600.3 0.2 0.3 0.3 0.3 0.5 ŷ = 0.28
R2: coefficient of determination; * and ** indicate the level of significance of constants within regression models of 5 and 1%, respectively. Rf indicates that nitrogen, phosphorus, and potassium (NPK) were not considered in the regression model as it is the standard treatment studied (50 kg ha−1 of N).
Table 9. Criteria and limits for the classification of normal, saline, sodic, and saline–sodic soils.
Criteria (Unit)Types of Soils
NormalSalineSodicSaline–Sodic
Electrical conductivity (dS m−1 a 25 °C) 1<4>4<4>4
Exchangeable sodium percentage (%)<15<15>15>15
Sodium adsorption ratio 2<13<13>13>13
pH<8.5<8.5>8.5>8.5
1 Electrical conductivity of paste solution extracted at saturation. 2 Sodium adsorption ratio = Na/(Ca + Mg)1/2. Source: Richard 1969 [36].
Disclaimer/Publisher’s Note: The statements, opinions and data contained in all publications are solely those of the individual author(s) and contributor(s) and not of MDPI and/or the editor(s). MDPI and/or the editor(s) disclaim responsibility for any injury to people or property resulting from any ideas, methods, instructions or products referred to in the content.

