Abstract
Arid and semi-arid areas are highly productive ecosystems that have a great diversity of species, among which grasses stand out. These species have ecological, environmental, and economic importance. The objective was to identify the ecological descriptors of 15 native species of grasses and diversity patterns through multivariate analysis techniques (principal component analysis, PCA, and cluster analysis, CA), in addition to identifying potential distribution areas (current and future) and regions of high and low diversity from 3841 accessions and 21 climatic variables. Among the main results, the extreme values, coefficient of variation, and median for each species could be determined. PCA determined that, with 10 variables, it was possible to explain 54.36% of the variation between the analyzed species. CA resulted in the formation of four statistically significant groups, with specific climatic characteristics. Regarding potential distribution areas and climate change, a reduction in distribution is expected (2050) on most of the current surface, with a possible opportunity zone in the north of the country. Finally, two hotspots (high diversity areas) and four coldspots (low diversity areas) were identified among the analyzed species. These results can be used to create strategies for sustainable use and the conservation of these resources.
1. Introduction
At a global level, 17 countries are considered to have the greatest biological diversity; Mexico is ranked number five, after Brazil, Colombia, China, and Indonesia. These countries cover 10% of the Earth’s surface and are estimated to host around 70% of the planet’s biodiversity, of which Mexico is home to around 12% [1].
In particular, and when trying to classify diversity considering ecological zones delimited by types of vegetation, climate, and biogeographical aspects, Mexico presents six zones: (1) tropical warm–humid, (2) tropical warm–subhumid, (3) temperate humid, (4) temperate subhumid, (5) arid and semiarid, and (6) flood zone or sea–land transition zone [2,3]. In Mexico, arid and semi-arid areas occupy approximately 54% of the surface and are inhabited by a little more than 40% of the national population [4]. These ecosystems are characterized as environments with low water availability due to low precipitation and high evaporation, extreme temperatures, and low availability of soil nutrients [4,5]. However, despite their appearance, these ecosystems present high biological diversity and provide resources and environmental services to a third of humanity, highlighting livestock food, food, and medicinal products, biodiversity conservation, provision of fresh water, production of energy, tourism, and recreation, among others [6].
Although there is the idea that they are unproductive sites and there are few works related to quantifying biomass and energy flow, existing studies on the subject in Mexican arid regions demonstrate that the aerial and underground biomass is greater than average compared to other deserts in the world [5].
Another aspect to highlight about these ecosystems is that they are the center of origin and diversification of species of the following botanical families: Cactaceae, Crassulacease, and Poaceae, among others. Arid and semi-arid areas are the ecosystemswith the highest percentage of endemic species [7].
Among the uses and services provided by these regions, the most important is the use of forage species or grasses as a source of food, both for domestic livestock and wild fauna [5]. Due to the above, it is important to know the ecogeographic conditions in which these species develop, providing favorable conditions for their development, which may lead to their use as a food source for extensive livestock farming.
In relation to the Poaceae family (Poaceae) or grasses, Davila et al. (2018) [8] reported that, for Mexico, there are 11 subfamilies, 205 genera, and 1216 species, of which 1062 are native, and 154 are introduced species. The subfamilies with the largest number of species are Panicoideae (482 species), Chloridoideae (348), and Pooideae (260), of which 10 genera stand out: Muhlenbergia, Bouteloua, Festuca, Paspalum, Panicum, Eragrostis, Sporobolus, Aristida, Digitaria, and Setaria. The species of these genera contribute more than 42% of the total species existing in the country (514). However, the first three genera (Muhlenbergia, Bouteloua, and Festuca) gain importance due to the high percentage of endemic species found in the arid and semi-arid areas of Mexico [9,10,11].
According to Semarnat [12], 95% of arid and semiarid regions in Mexico present overgrazing and soil erosion. This situation generates repercussions for the different services it offers, such as the production of cattle for meat production, problems in water infiltration, the recharge of aquifers, soil stability, and carbon capture, among others [13].
On the other hand, the expected impacts due to climate change (extreme climate events, habitat loss, and prolonged droughts, among others) have also affected the development, adaptation, and diversity of many of these species, so identifying and addressing this problem is essential to understand the diversity and distribution of native grass populations. These actions will allow sustainable use and conservation of these resources, by identifying specimens with possible tolerances to extreme biotic and abiotic factors in order to identify possible core collections, which are the keys to collecting, protecting, and evaluating genetic diversity, and thus avoiding erosion, loss of important genes, morphotypes, and ecotypes.
Regarding these actions, in recent years, morphological characterization studies have been carried out with the objective focusing on selecting ecotypes of native grasses, such as blue grama grass (Bouteloua gracilis), green sprangletop grass (Leptochloa dubia), Arizona cottontop grass (Digitaria californica), large-spike bristlegrass (Setaria macrostachya), side-oats grama grass (Bouteloua curtipendula), and lobero grass (Muhlenbergia phleoides), with the purpose of finding genotypes that adapt to local climatic conditions and with greater probabilities of being used in grassland rehabilitation programs [14,15,16,17,18,19,20,21,22,23,24].
It is worth mentioning that, at the moment, there are only a few studies about the diversity, richness, and distribution of some forage species (especially species with high forage production and adaptation to field establishment) in the arid and semi-arid zones of Mexico, but there are no ecogeographic studies that show the climatic characteristics of native grass species in these areas of Mexico.
For this reason, the objective of this work was to determine the ecological descriptors, patterns of diversity, adaptation, and current and potential geographical distribution under climate-change scenarios of 15 native grass species from the arid and semi-arid regions of Mexico.
2. Materials and Methods
2.1. Database
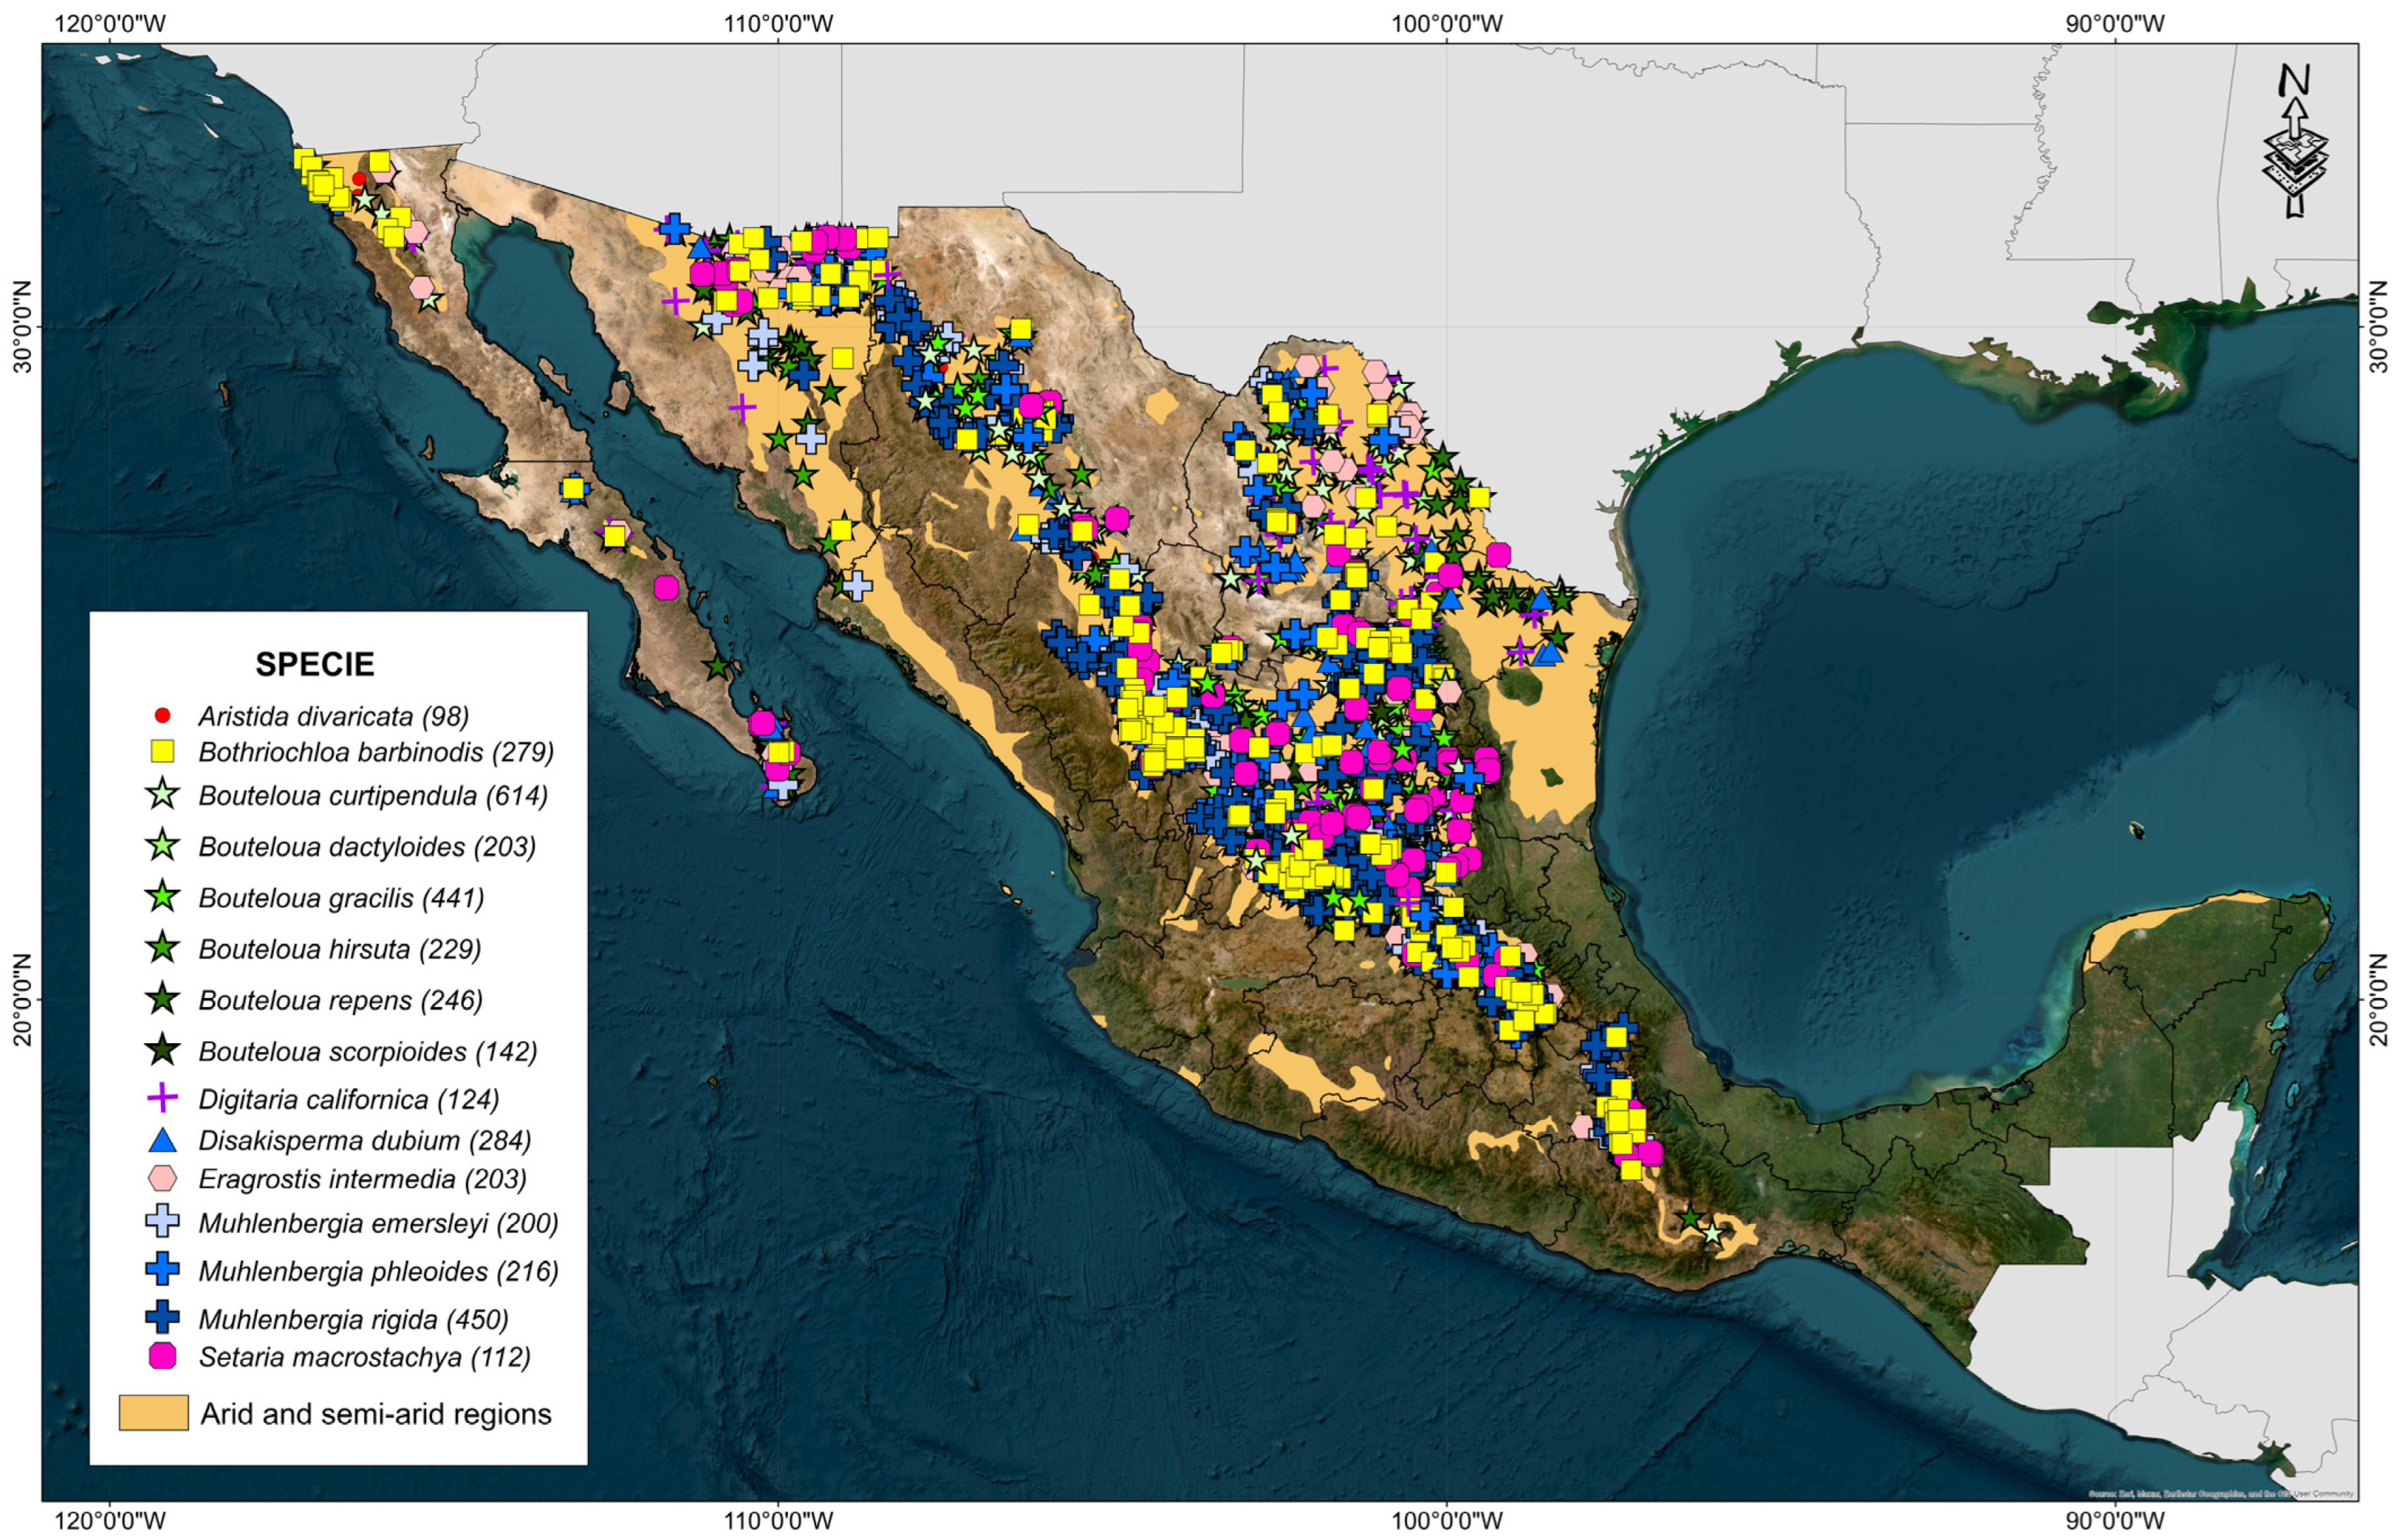
To address this work, a database was compiled with passport data of georeferenced accessions of 15 species of native forages from arid and semi-arid regions of Mexico (Table 1). Passport data were obtained from georeferenced coordinates taken on field trips and a search in the Global Biodiversity Information Facility webpage for each species [24,25,26,27,28,29,30,31,32,33,34,35,36,37,38].

Table 1.
Characteristics of 15 species of native forages from arid and semi-arid regions of México.
A total of 19,764 accessions were identified, to which several actions were applied for review: (1) the accessions belonging to the arid and semi-arid regions in Mexico, (2) errors in taxonomic classification, and (3) errors in the geographical accuracy of the accessions.
To ensure that the accessions belonged to the chosen study area, a filter was carried out, taking into account the regions identified as arid (BS0) and semi-arid (BW) proposed by García in 1990 [39]. Likewise, the annual precipitation was identified, and all those accessions with annual precipitation values greater than 600 mm accumulated were eliminated. It was frequently identified that some geographic coordinates were associated with different species in the concentrated database. Therefore, to avoid problems in the taxonomic classification, all the accessions that presented this inconsistency were eliminated. Finally, repeated passport data and accessions with little geographical precision (less than 3 decimal places) were eliminated, concentrating a total of 3841 accessions (Figure 1).
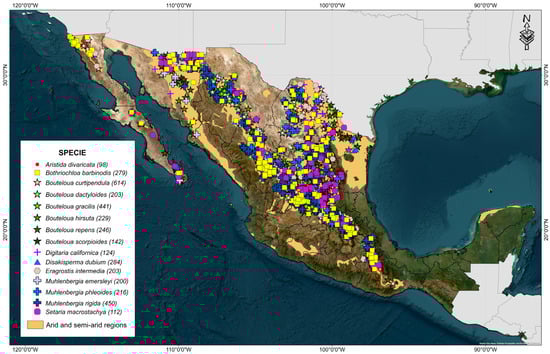
Figure 1.
Arid and semi-arid regions of Mexico and geographical distribution of 15 forage grasses from the arid and semi-arid regions of Mexico.
2.2. Environmental Variables
The passport data was analyzed with 21 variables in raster format with 1 km2 spatial resolution. Bioclimatic variables belong to WorldClim version 2.1, corresponding to the period of 1970–2000 [40]: Bio1 (annual mean temperature, °C), Bio2 (mean diurnal range, °C), Bio3 (Isothermality), Bio4 (temperature seasonality), Bio5 (maximum temperature of warmest month, °C), Bio6 (minimum temperature of coldest month, °C), Bio7 (temperature annual range, °C), Bio8 (mean temperature of wettest quarter, °C), Bio9 (mean temperature of driest quarter, °C), Bio10 (mean temperature of warmest quarter, °C), Bio11 (mean temperature of coldest quarter, °C), Bio12 (annual precipitation, mm), Bio13 (precipitation of wettest month, mm), Bio14 (precipitation of driest month, mm), Bio15 (precipitation seasonality), Bio16 (precipitation of the wettest quarter, mm), Bio17 (precipitation of the driest quarter, mm), Bio18 (precipitation of the warmest quarter, mm), and Bio19 (precipitation of the coldest quarter, mm), altitude [40] and annual evapotranspiration (ET, mm) [41].
2.3. Ecological Descriptors and Statistical Analysis
As a first step, and in order to identify high linear dependence (collinearity) among more than two variables, a selection of variables was carried out using the Pearson correlation coefficient, eliminating one of those two variables with absolute coefficients greater than 0.90.
Ecological descriptors were calculated using the methodology proposed by Steiner and Greene [42] and widely used in different species [43,44,45,46,47,48]. In order to determine ecological descriptors, it was necessary to create a vector of points with the geographic coordinates of each accession, and the values of each variable were determined with the Spatial Analyst Tools of ArcGIS (software GIS) version 10.3, ESRI Inc., Redlands, California [49]. The information obtained was concentrated and processed in an Excel spreadsheet, where the extreme values (minimum and maximum), median, and coefficient of variation (CV = [Q/Med] × 100, where Q = [Q3 − Q1]/2(interquartile range), and Med = median) of each accession were identified [44].
Likewise, climatic type was considered according to Beck et al. (2023) [50], where each species is distributed to identify the frequency and diversity of climates in which each species is established. This is to obtain more information about the climatic aspects of the collection sites, in addition to their humidity regime (species identified as coming from arid and semi-arid areas).
Regarding statistical analysis in this article, the following were carried out. (1) A principal component analysis (PCA) with a correlation matrix was performed with the selected variables. Eigenvalues, eigenvectors, and the contribution of the variables for each principal component for the corresponding figures were obtained with the packages FactoMineR [51] and Factoextra [52]. (2) A cluster analysis (CA) with Euclidean distances and Ward’s lower variance clustering method was run to identify similar accessions by physiographic provinces. The clustering tendency was verified with the Hopkins (H) statistic with the clustertend package [53]. Values greater than or equal to 0.5 indicate that they are very close, and the data are uniformly distributed. So, clustering does not make sense; values close to 0 are evidence in favor of clustering of the data. The best algorithm for clustering was calculated with the clValid package [54]. The selection of the optimal number of clusters was determined with the NbClust package [55]. Finally, a comparison test of means was carried out to identify the significance of the variables that characterize each cluster. All graphics and tests were elaborated in RStudio version 4.3.3 [56].
2.4. Potential Distribution under Actual and Future Climatic Conditions
The potential distribution model under actual and future conditions (2050 scenario) was determined with MaxEnt model V. 3.4.4 [57], based on the principle of maximum entropy to estimate a set of functions that relate the suitability of the environment to environmental variables and determine the potential distribution of a species [58]. The Maxent model has been recognized for its efficiency in handling complex interactions between predictor variables and response variables [43,59,60].
Regarding the model parameters, the occurrence data (accessions of all species studied in this article) were randomly divided into training data (50%) and test data (50%) in order to test the fit and statistical significance of the model [61]. The model outputs were presented as the ensemble model of 10 replicates by cross-validation. To evaluate the model performance, the AUC (area under the curve) was estimated from plots of receiver operating characteristics [62]. AUCs greater than 0.7 are acceptable and perform well, considering that AUC is a useful statistic to evaluate the goodness of selection of suitable versus unsuitable distribution areas [43,63].
The resulting ensemble models were presented as binomial (presence/absence) maps by choosing the threshold value of environmental fitness by selecting the threshold value (fixed cumulative value 1, minimum training presence, 10 percentile training presence, and maximum training sensitivity plus specificity) that guarantees the lowest omission rate (known areas of predicted occurrence/absence) at a maximum logistic value [43].
2.5. Diversity and Hotspot Analysis
For hotspot analysis, critical zones of species abundance and areas with a high concentration of diversity were identified using the “Spatial Statistics Tools” of ArcGis. Species density maps were constructed by identifying all accessions within 1 km of each other. This distance was chosen based on previous studies of diversity [45,48,64,65,66].
3. Results
3.1. Ecological Descriptors
As a result of the first process, collinearity between the 21 climatic variables was identified with the aim of ensuring the statistical reliability of the results. Those that presented high linear dependence were eliminated, using only the following variables for all the statistical analyses: Bio1, Bio2, Bio3, Bio6, Bio8, Bio10, Bio11, Bio12, Bio14, Bio17, Bio18, altitude, and annual evapotranspiration.
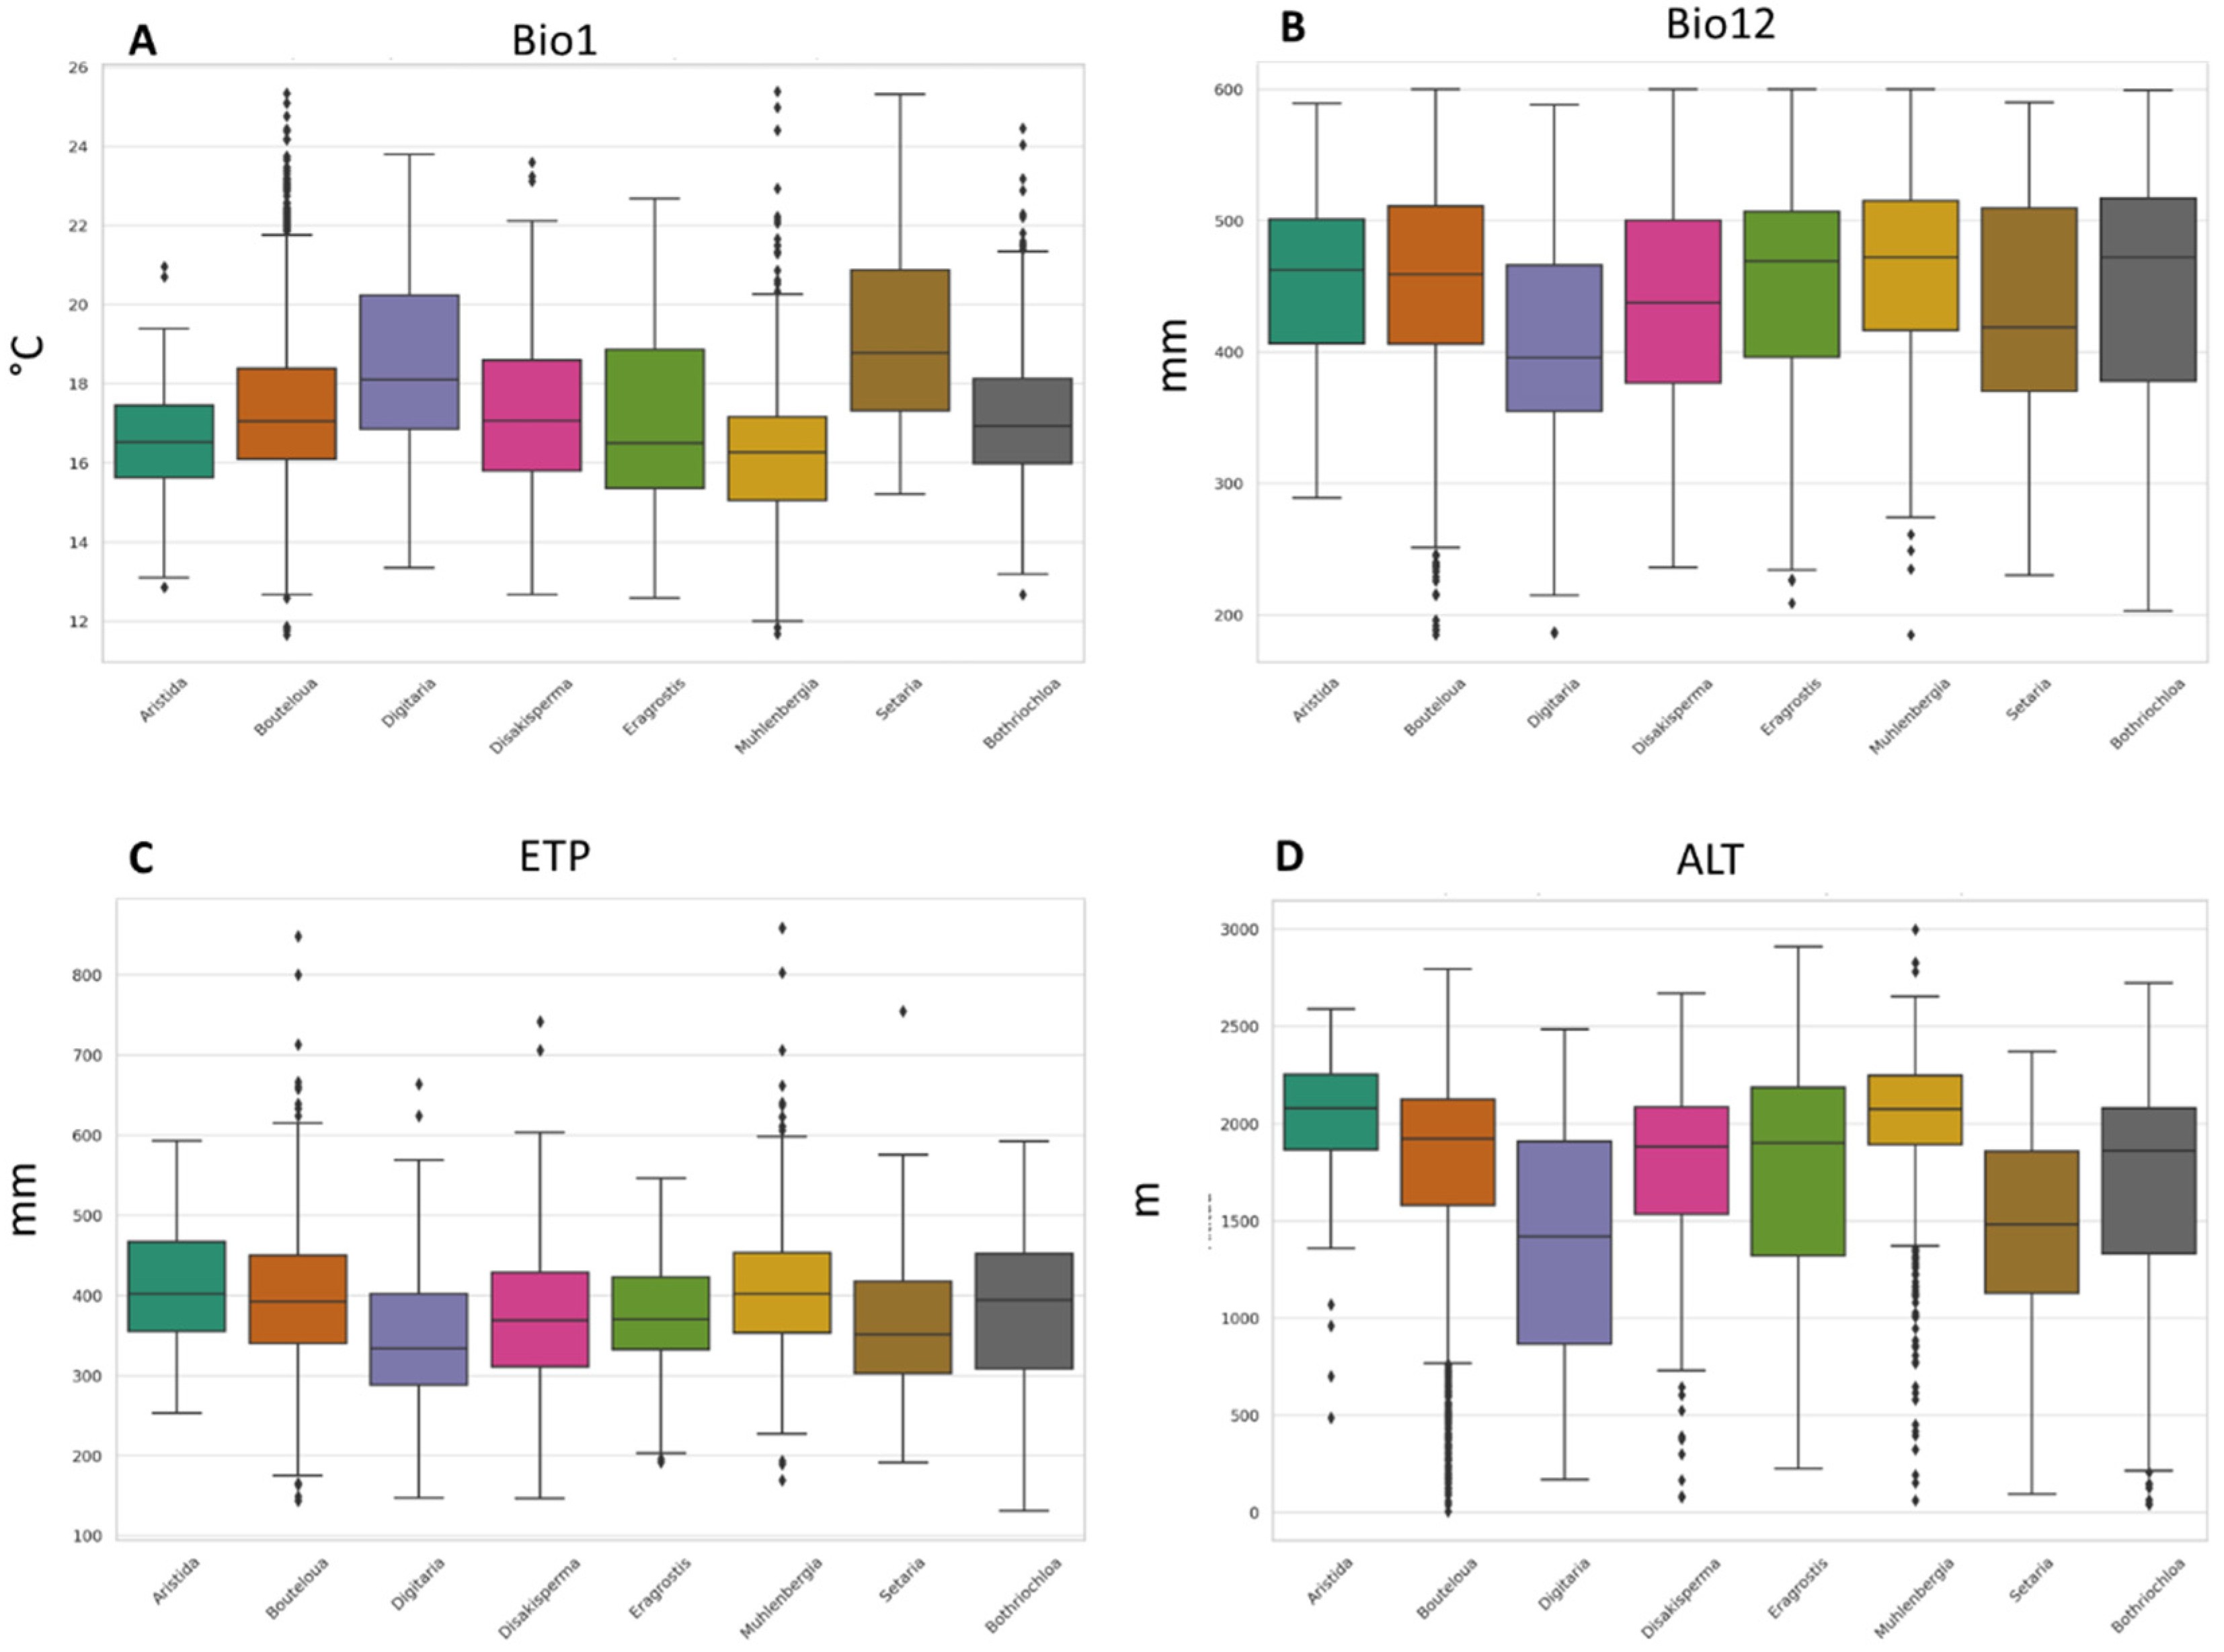
Table 2 shows the median, minimum, maximum, and coefficient of variation (CV) for the selected variables for each species. Among the main results, it can be observed that the species are found in the range of 16.3 to 18.5 °C of the mean annual temperature. Among the species, S. macrostachya, B. curtipendula, B. repens, and M. emersleyi are the species that reported the highest Bio1 value (>25 °C), while B. gracilis, B. repens, and M. rigida presented 11.7, 11.8, and 11.7 °C as the minimum values, respectively.
Table 2.
Ecological descriptors of 15 native forage grasses from the arid and semiarid regions of Mexico. MED = median, CV = coefficient of variation, MIN = minimum, MAX = maximum. Bio1 = annual mean temperature (°C), Bio2 = mean diurnal range (°C), Bio3 = isothermality, Bio8 = mean temperature of wettest quarter (°C), Bio10 = mean temperature of warmest quarter (°C), Bio11 = mean temperature of coldest quarter (°C), Bio12 = annual precipitation (mm), Bio14 = precipitation of driest month (mm), Bio17 = precipitation of the driest quarter (mm), Bio18 = precipitation of the warmest quarter (mm), Alt = altitude (m), ETP = annual evapotranspiration (mm).
When analyzing Bio12 (annual precipitation), it was found, by selection criterion, that the maximum value that could be presented among the species in relation to the restriction of arid and semi-arid areas, was 600 mm per year. Regarding the species that presented the minimum Bio12 values, B. curtipendula, B. gracilis, B. repens, D. californica, and M. phleoides were found with values less than 200 mm of annual precipitation. Another variable also provides information on the water balance of the areas associated with the accessions is the annual evapotranspiration (ETP). In this regard, it was identified that the maximum annual evapotranspiration values reported among the species were 859, 848, and 800 mm (M. rigida, B. hirsuta, and B. dactyloides, respectively).
Finally, regarding altitude, it was identified that the analyzed species recorded an average value between 1411 to 2133 m. When considering extreme altitude values, B. repens was the species that was located in the sites with the lowest altitude (7 m), while M. phleoides was located at a maximum altitude of 2999 m. The boxplots in Figure 2 show the distribution and comparison between the nine genera of the 15 species. The selected variables are considered to be the most important for the distribution of any species [44,45,48]. An aspect to highlight in these graphs is the presence of outliers in the variables, especially in the average annual temperature and altitude, mainly in the genera Bouteloua and Muhlenbergia.

Figure 2.
Boxplots of four climatic variables for 8 genera of forage grasses from arid and semi-arid regions of Mexico. (A) Mean annual temperature (°C), (B) annual precipitation (mm), (C) altitude (m), and (D) annual evapotranspiration (mm).
Regarding the information by genus, you can see the variability in the climatic conditions that are optimal for the different botanical genera. Among the main findings, it was identified that the climatic requirements of the species are broad. However, it is observed that the species studied, although they belong to different genera, share common adaptation and tolerance characteristics, which is reflected in the abundance and distribution of species, making it possible to find more than one species in a site. Performing this type of analysis allows us to better understand climate adaptability at a broader taxonomic level, which is of great importance for research in biodiversity, conservation, and potential response to climate change.
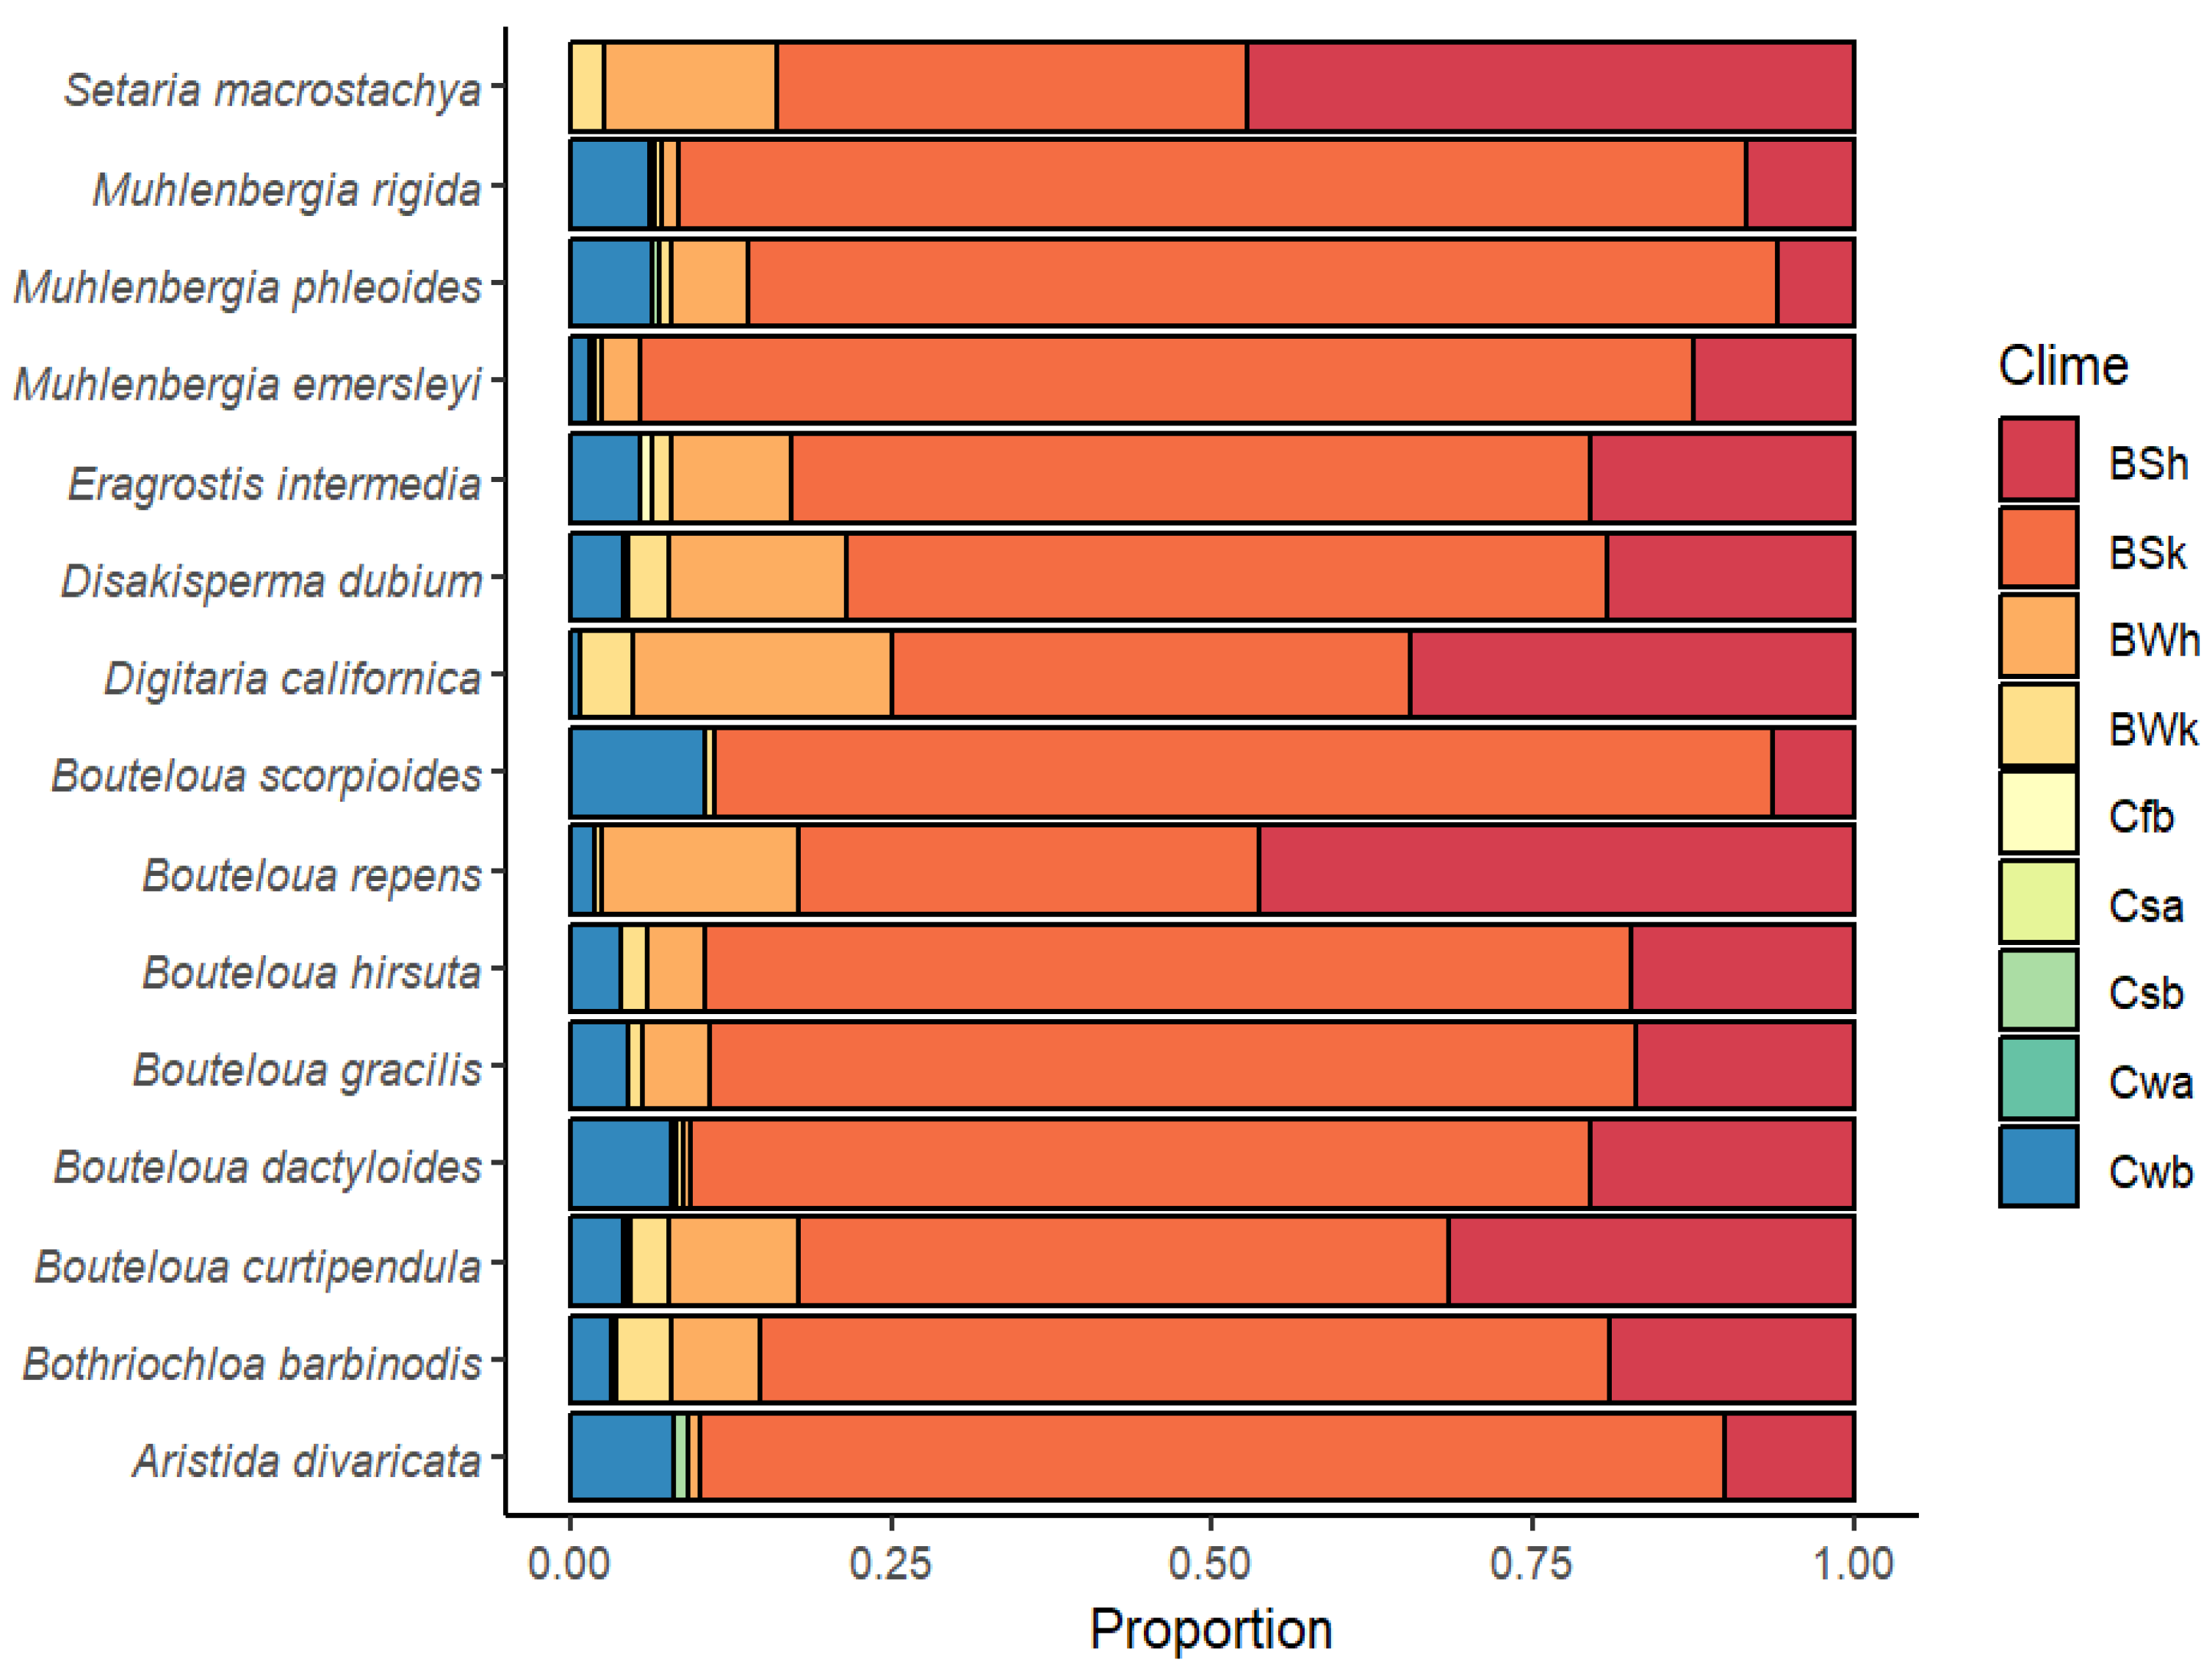
Regarding climatic diversity, Figure 3 shows the distribution and frequency of the predominant climates. It can be seen that climate type “B” is predominant: BSh (arid, steppe, hot), BSk (arid, steppe, cold), and BWh (arid, desert, hot). However, with the exception of Setaria macrostachya, the rest of the species have specimens that are located in temperate or type “C” climates to a lesser extent: Cfb (temperate, no dry season, warm summer), Csa (temperate, dry and hot summer), Csb (temperate, dry and warm summer), Cwa (temperate, dry winter, hot summer), and Cwb (temperate, dry winter, cold summer). In general, the most predominant climate for most species (except S. macrostachya and Bouteloua repens, where the most predominant climate was BSh) was the arid, steppe, cold (BSk) type. This information is a small sample of the genetic diversity contained in these species and represents the possibility of finding genes with a tolerance or resistance to adverse factors for use in genetic breeding programs, with the aim of developing varieties adapted to specific climatic conditions.
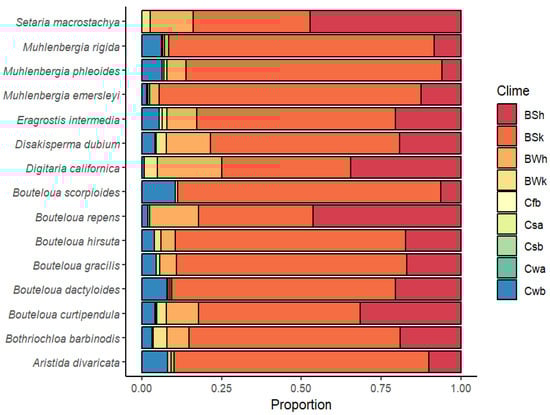
Figure 3.
Climatic diversity and climatic type proportion for 15 forage grasses from the arid and semiarid region of Mexico. BSh (arid, steppe, hot), BSk (arid, steppe, cold), BWh (arid, desert, hot), BWk (arid, desert, cold), Cfb (Temperate, no dry season, warm summer), Csa (temperate, dry and hot summer), Csb (temperate, dry and warm summer), Cwa (temperate, dry winter, hot summer), and Cwb (temperate, dry winter, cold summer).
3.2. Statistical Analysis (PCA and CA)
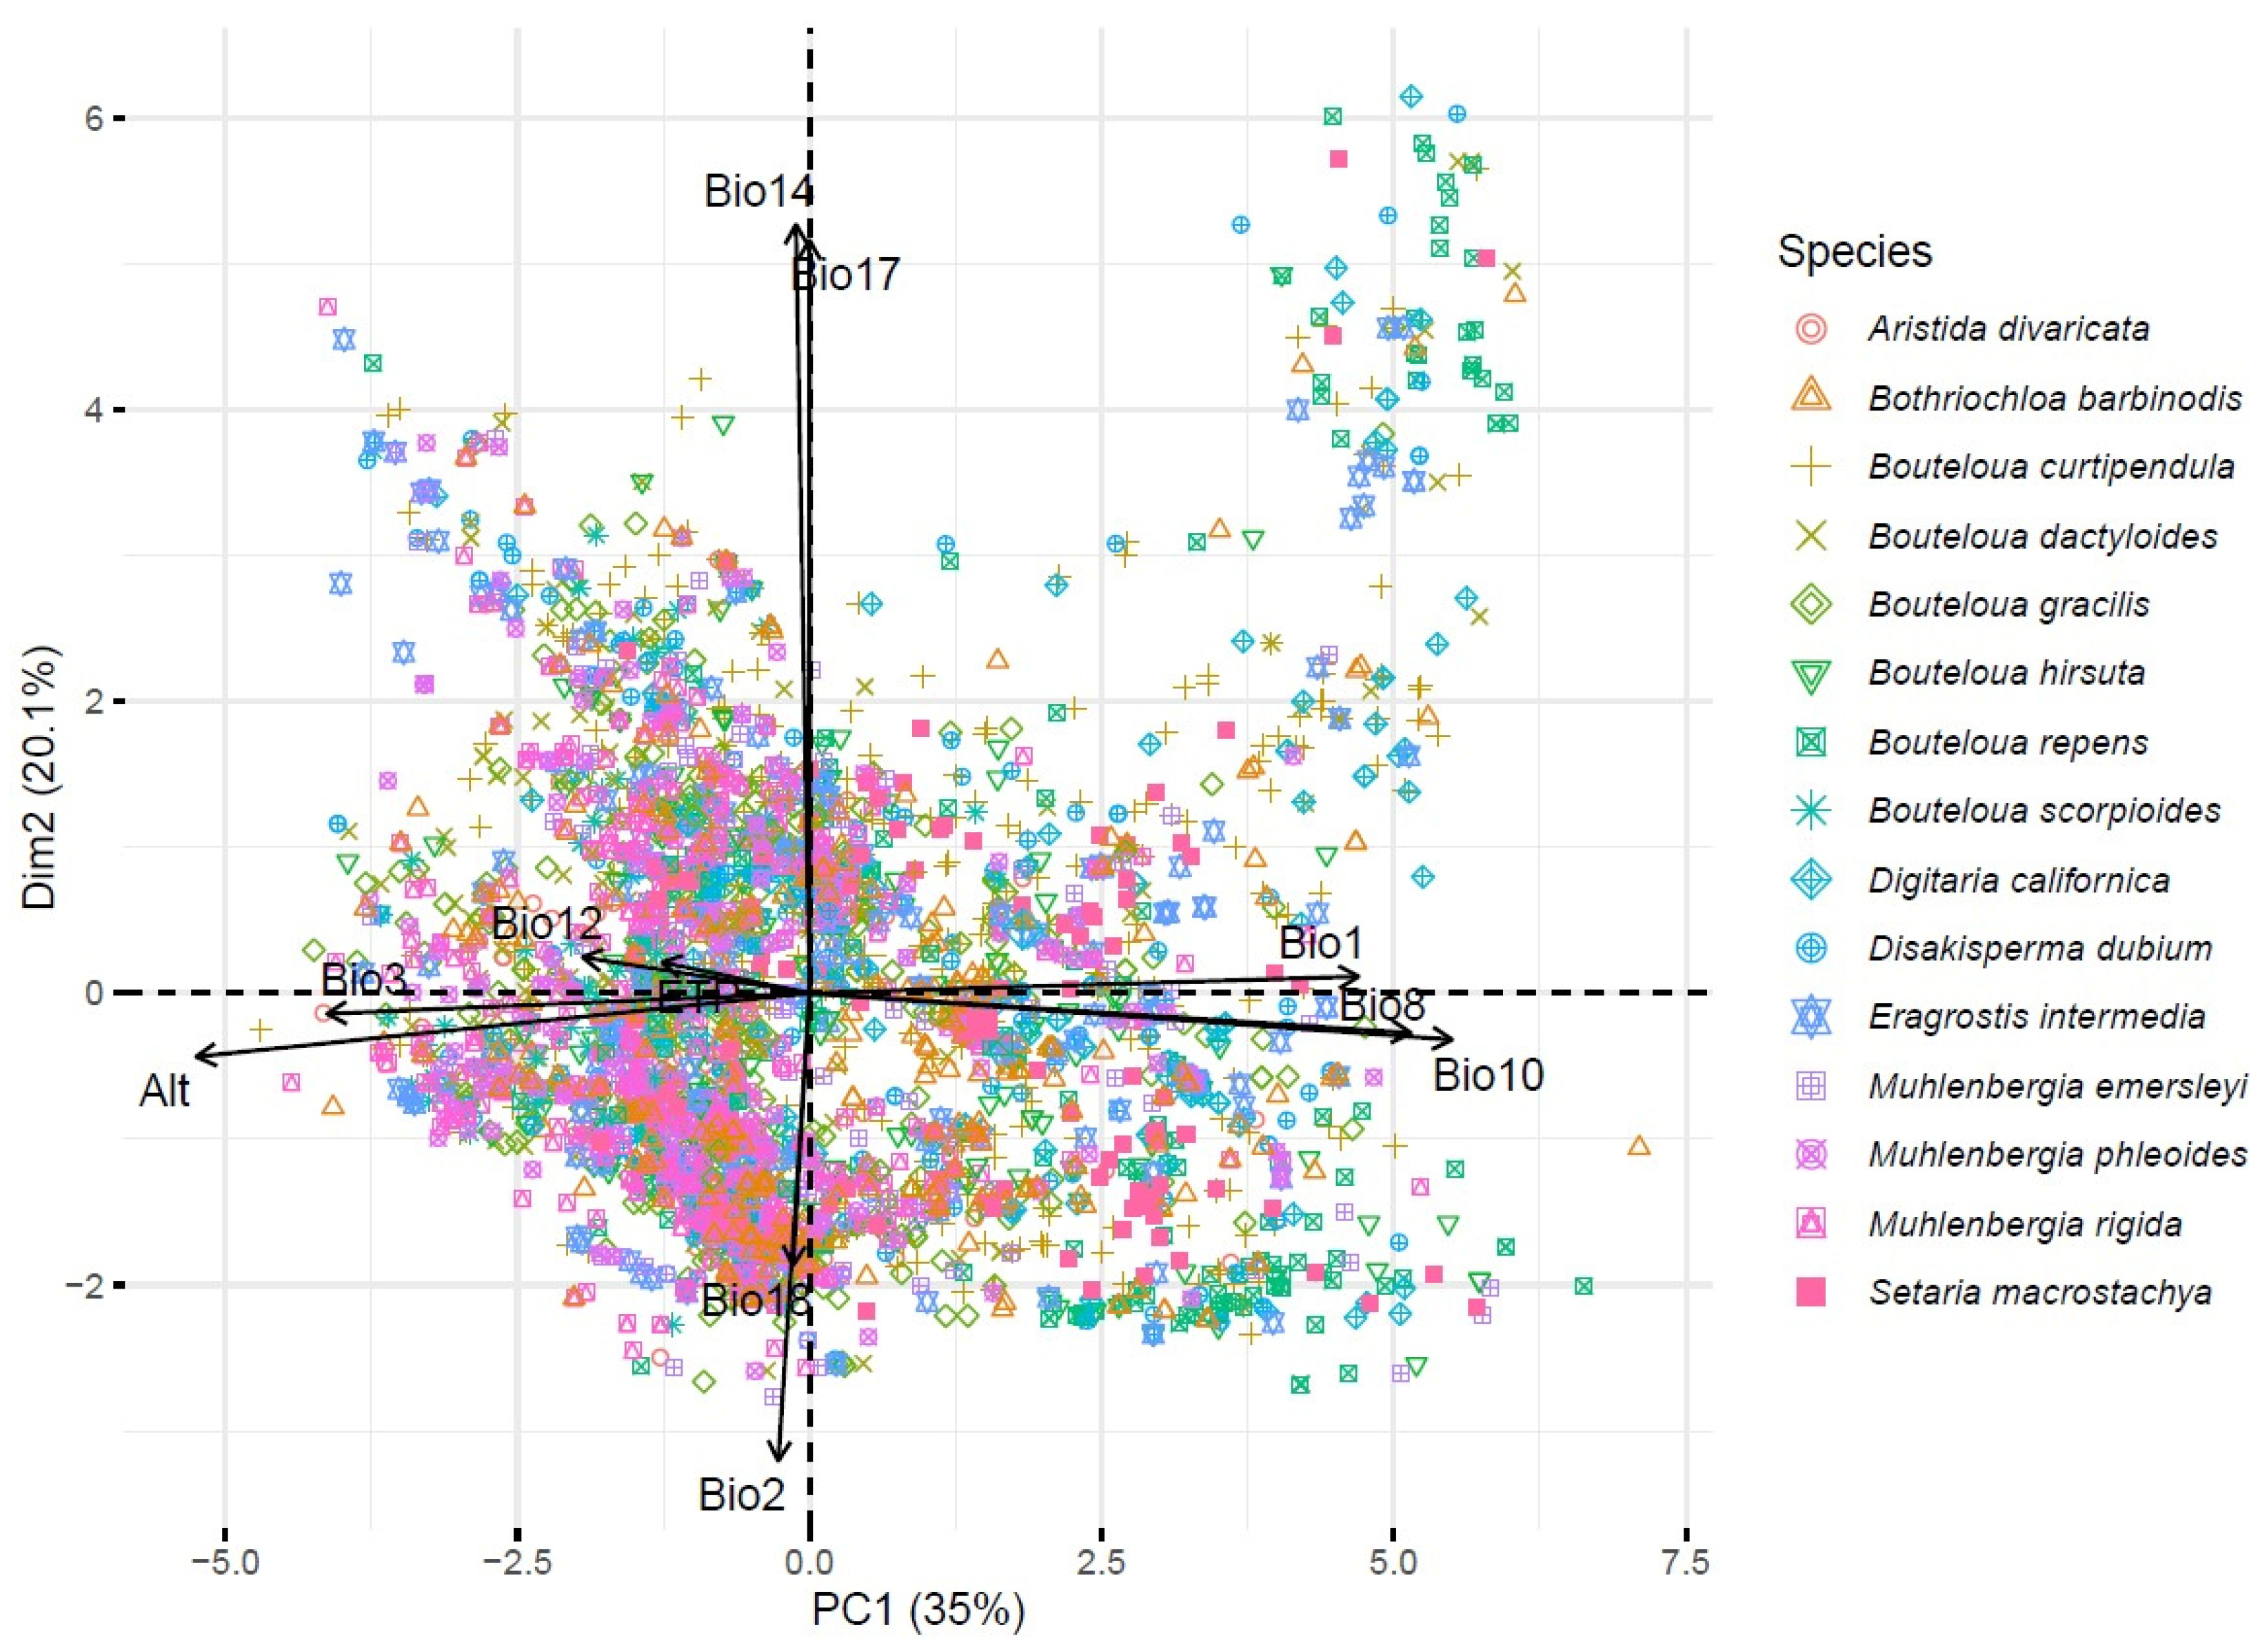
Regarding the principal component analysis (PCA), the first two principal components contributed 54.36% of the total variance (principal component 1 with 34.8% and principal component 2 with 9.6%). Principal component 1 was made up of the variables Bio10, Bio1, ALT, and Bio8. The second principal component was made up of the variables Bio6, Bio11, Bio3, ETP, Bio2, and Bio12. In summary, PC1 appears to be primarily associated with a temperature and altitude gradient, while PC2 appears to capture variations in cold or dry conditions and the diurnal range of temperature. These interpretations can help understand the adaptations of species to their environment, especially in terms of temperature and humidity.
Figure 4 shows the spatial distribution of the species with respect to the spatial distribution of the variables.
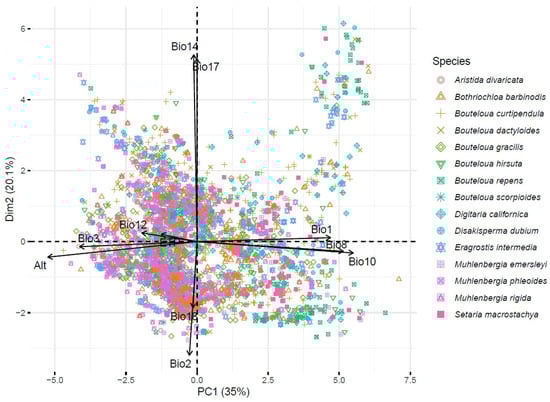
Figure 4.
Biplot based on 13 climatic variables and 3841 accessions of forage grasses from arid and semiarid regions of Mexico. Bio1 = annual mean temperature (°C), Bio2 = mean diurnal range (°C), Bio3 = isothermality, Bio8 = mean temperature of wettest quarter (°C), Bio10 = mean temperature of warmest quarter (°C), Bio11 = mean temperature of coldest quarter (°C), Bio12 = annual precipitation (mm), Bio14 = precipitation of driest month (mm), Bio17 = precipitation of the driest quarter (mm), Bio18 = precipitation of the warmest quarter (mm), Alt = altitude (m), and ETP = annual evapotranspiration (mm).
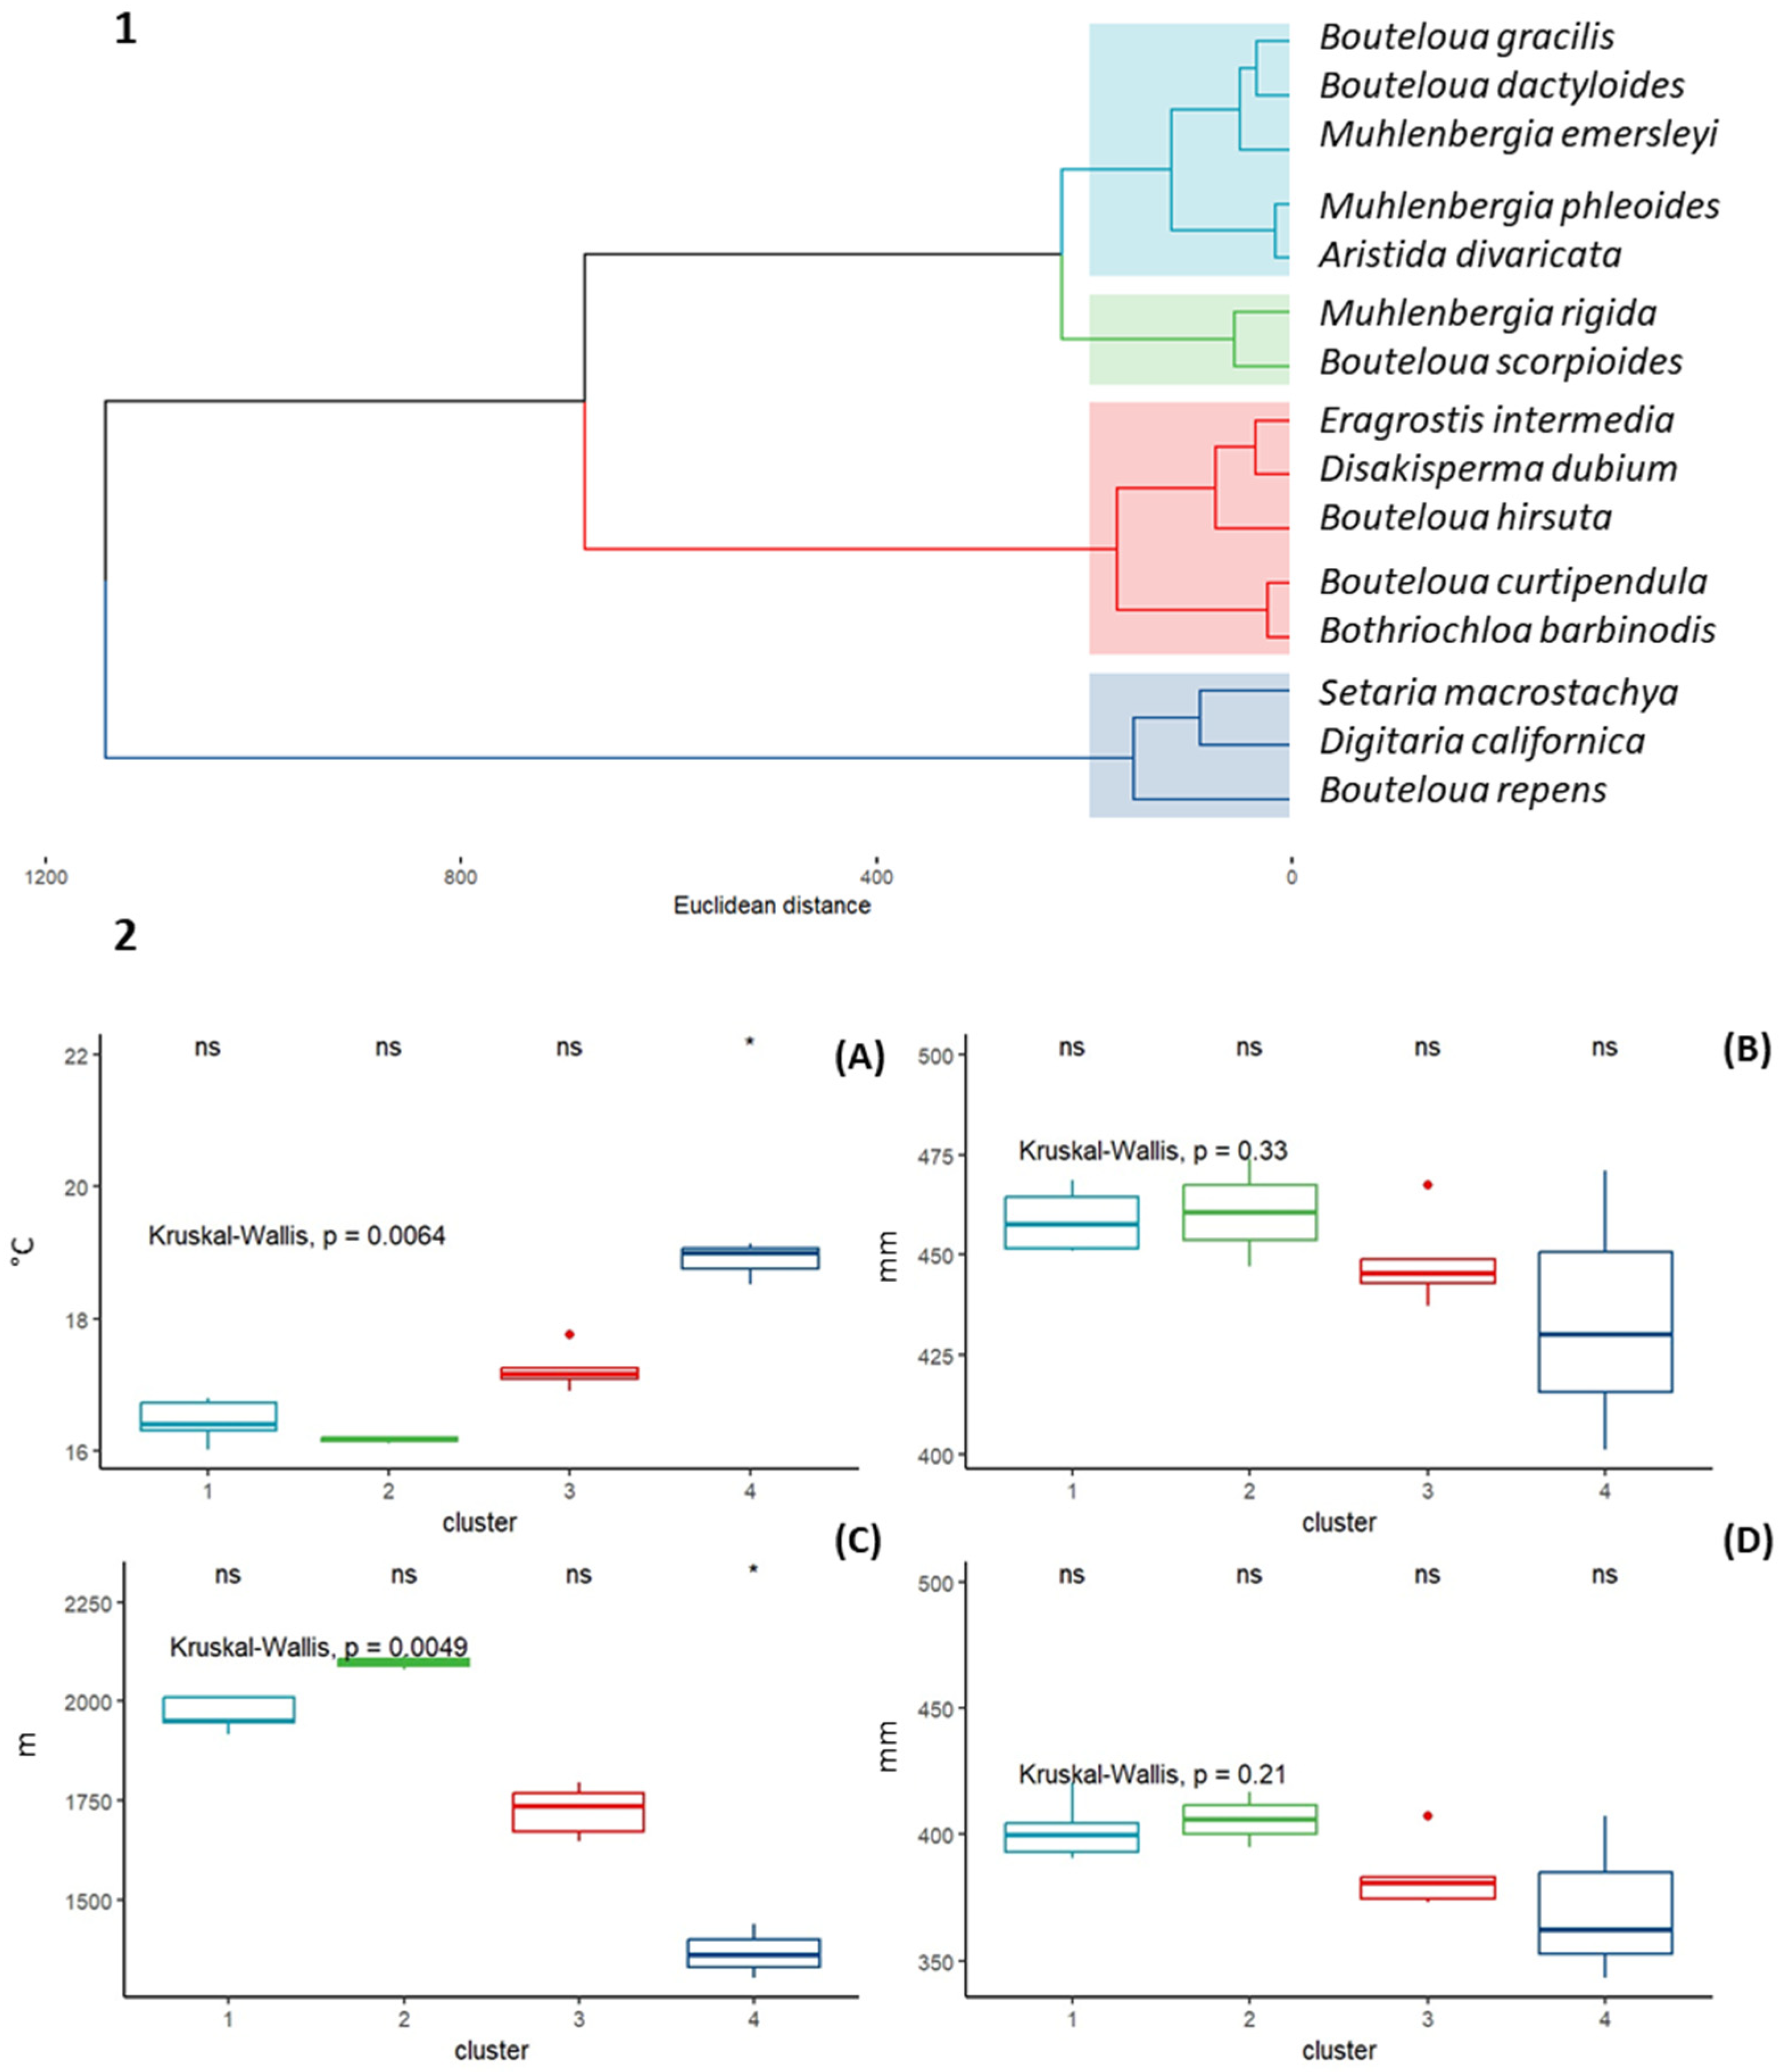
A cluster analysis (CA) was carried out with the purpose of identifying whether there is a grouping among the 15 species of forage grasses due to their similarity between the 13 climatic variables used. Hopkins statistics showed that the data have a tendency to be grouped (H = 0.35). Nbclust determined that the optimal number of groups is four (Figure 5). The species composition and characteristics of each identified cluster are described below (Figure 5).
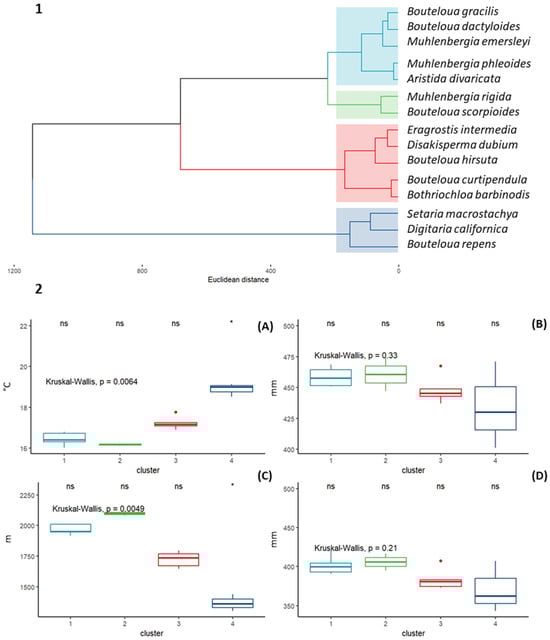
Figure 5.
1. Cluster dendrogram with Euclidean distance and Ward’s clustering method. 2. Boxplots of four climatic variables for clusters identified in CA with the Kruskal–Wallis test. (A) Mean annual temperature (°C), (B) annual precipitation (mm), (C) altitude (m), and (D) annual evapotranspiration (mm).
Cluster 1 is Bouteloua gracilis, Bouteloua dactyloides, Muhlenbergia emersleyi, Muhlenbergia phleoides, and Aristida divaricata. The average annual mean temperature of the group is 16.3 °C. Regarding the annual precipitation, the range is 457 to 474 mm per year, and the average annual evapotranspiration is 398 mm. Regarding altitude, the species in this group develop from 1980m to 2080 m, with an average value of 2030 m.
Cluster 2 is Muhlenbergia rigida and Bouteloua scorpioides. The climatic requirements of this group are slightly higher (Bio12, ALT, and ETP) than those reported by the species in group 1. Regarding the average annual temperature, the species in this group present an average annual value of 16.4 °C, an annual precipitation of 457 mm, an altitude of 2119 m, and an annual evapotranspiration of 399 mm.
Cluster 3 is Eragrostis intermedia, Disakisperma dubium, Bouteloua hirsuta, Bouteloua curtipendula, and Bothriochloa barbinodis. This group is characterized by having an average annual average temperature (16.9 °C), which is slightly higher than Cluster 1 and 2. Regarding the rest of the variables analyzed, this group of species presented an average annual precipitation of 461 mm, an average annual evapotranspiration of 384 mm, and an altitude average of 1879 m.
Cluster 4 is Setaria macrostachya, Digitaria californica, and Bouteloua repens. This group formed by three species is the most contrasting with the clusters previously described. The average altitude is 1436 m (the lowest recorded for all species). Regarding the average annual temperature of the group, the highest recorded among all species, an average value of 18.4 °C was recorded. Finally, for the variables that describe water availability among these species, the highest average precipitation and evapotranspiration values were reported (432 and 363 mm, respectively).
3.3. Potential Distribution
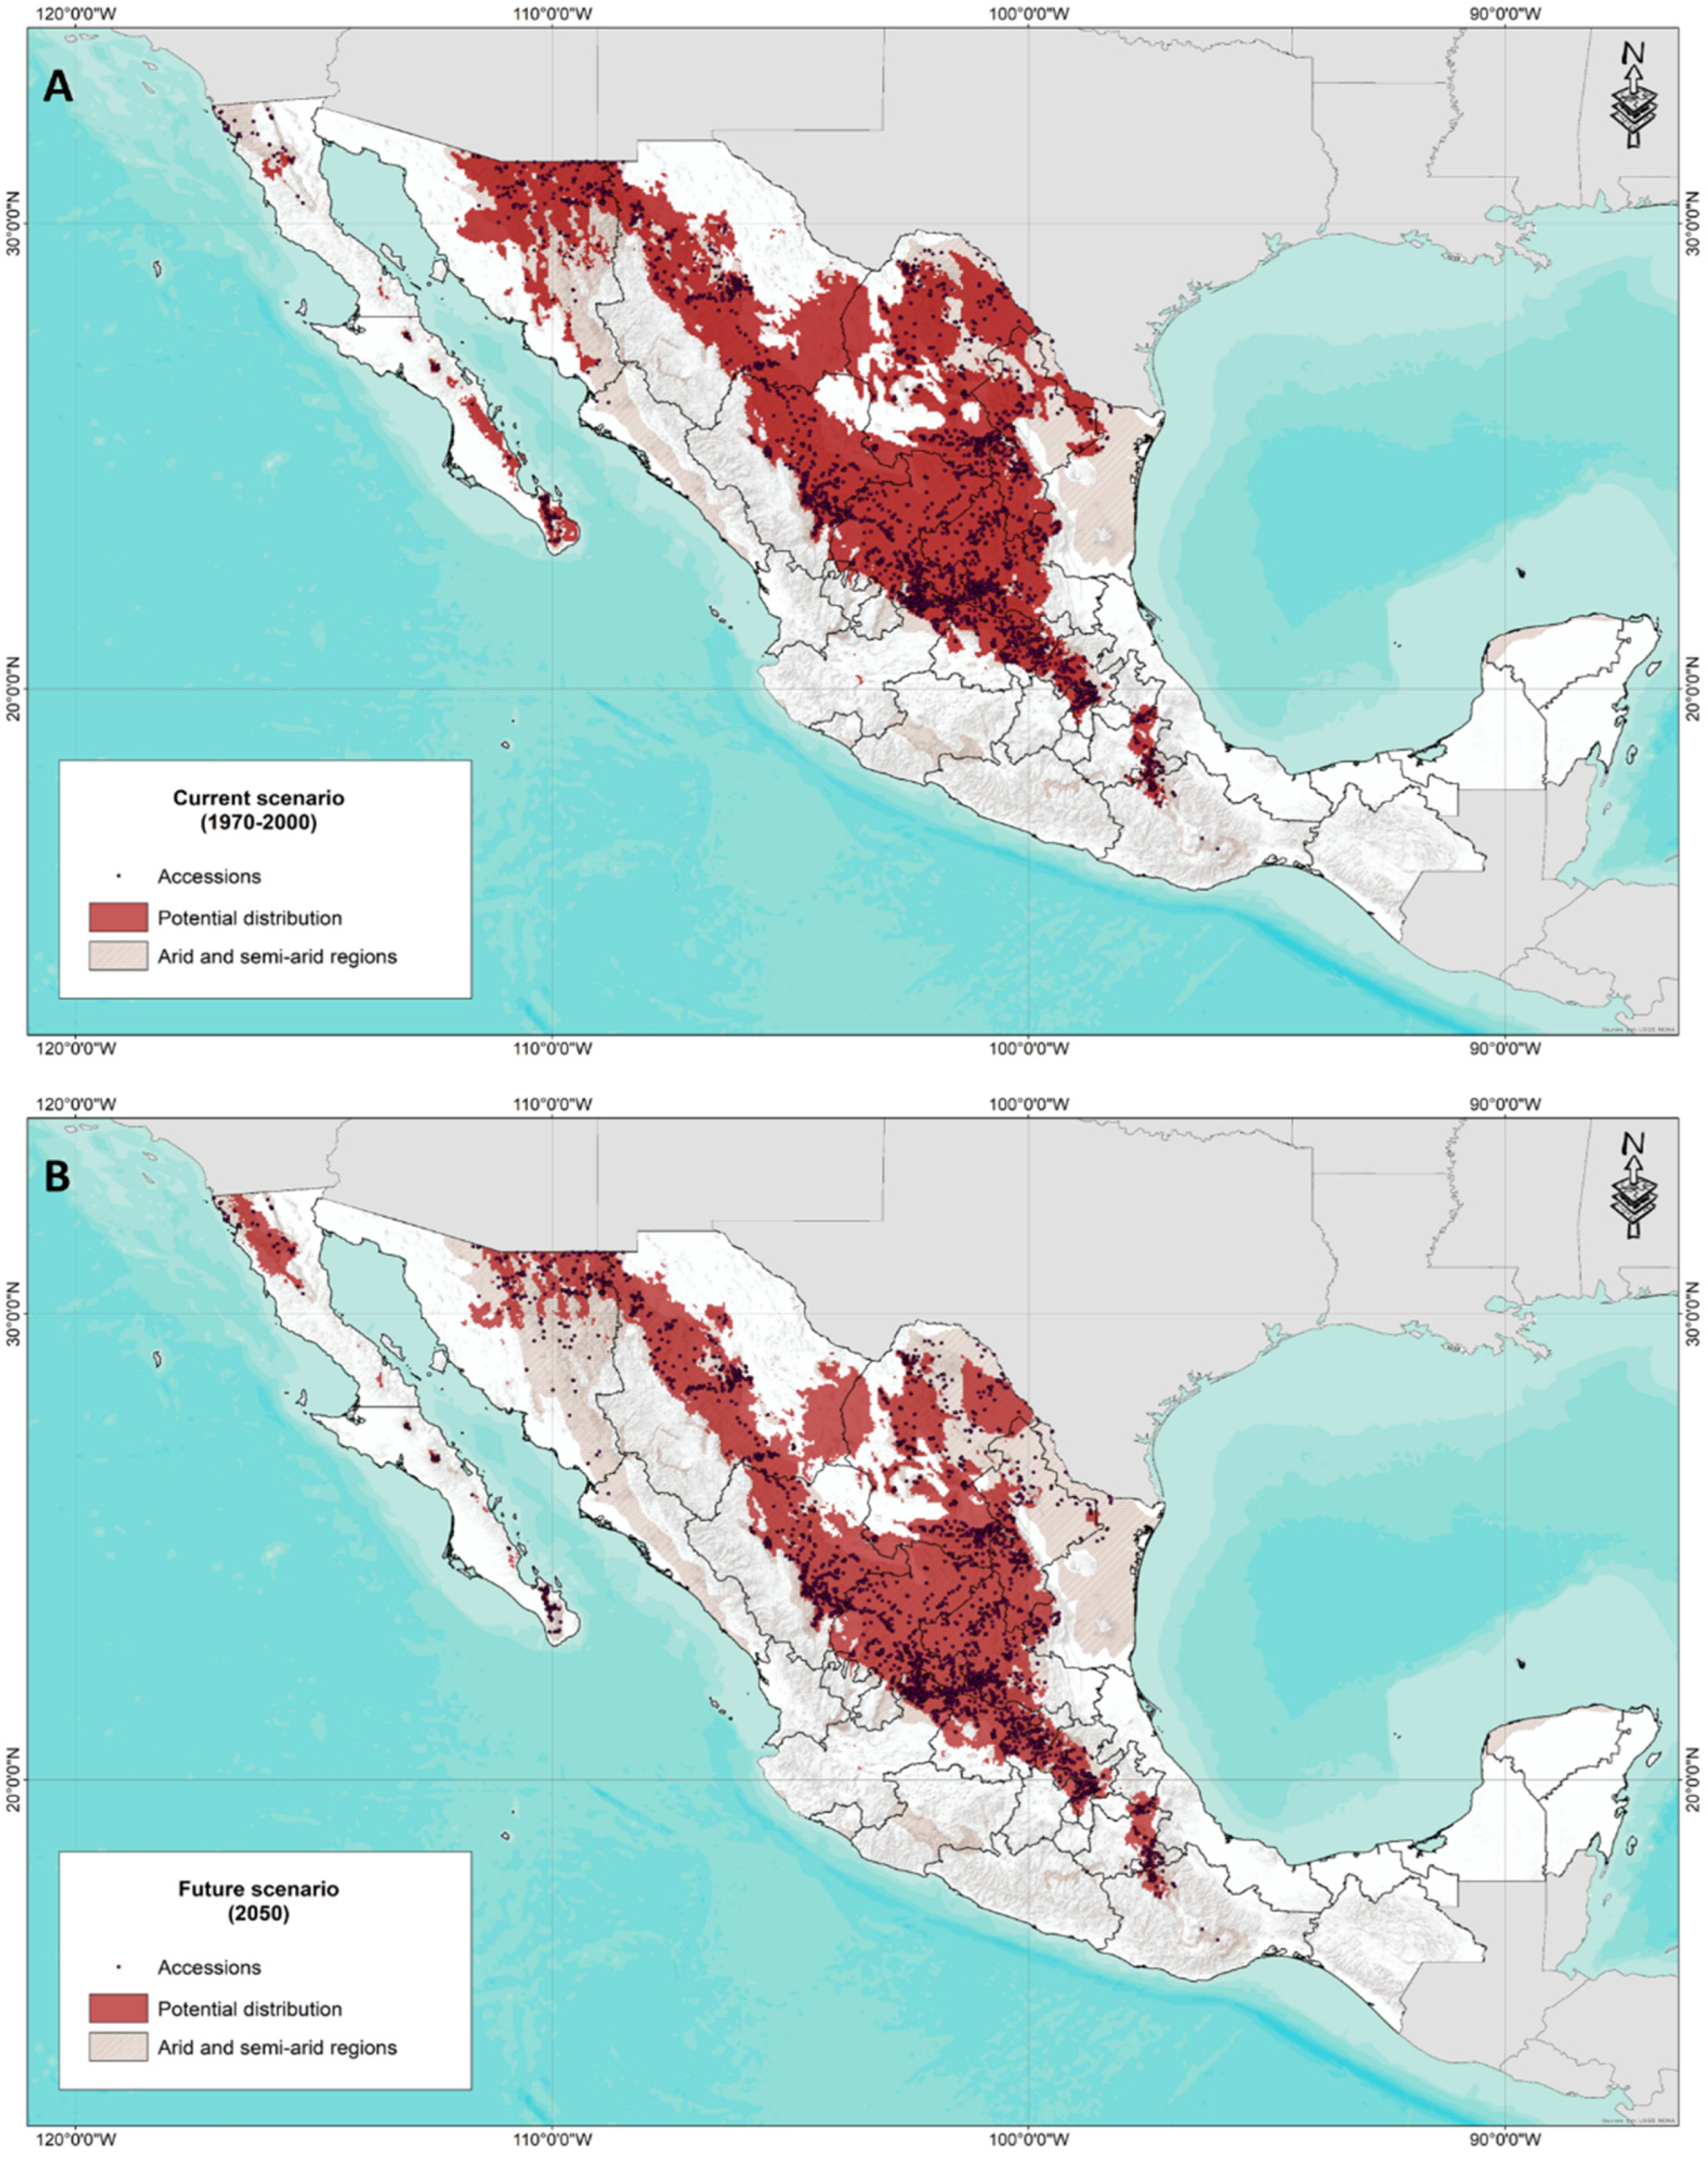
Figure 6 shows the result of the ensemble model for the potential distribution of forage grasses in arid and semi-arid areas of Mexico for the current scenario and the 2050 climate change scenario. In general, it can be observed that the potential distribution coincides in some areas with the areas determined as arid. It was also possible to identify that there are areas with distribution potential and that they correspond to unexplored areas that are also not considered regions with arid or semi-arid climates.
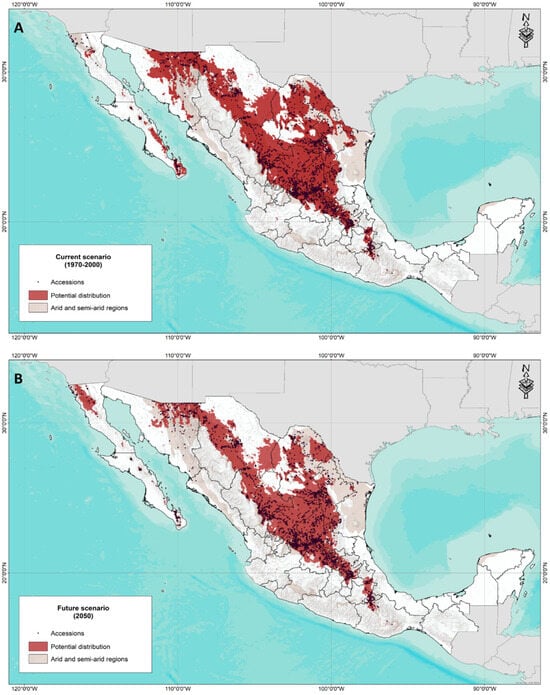
Figure 6.
(A) Assembly model of the current potential distribution of forage species in arid and semi-arid areas of Mexico (1970–2000). (B) Assembly model of the future potential distribution (2050) of forage species in arid and semi-arid areas of Mexico.
Regarding the potential distribution for the year 2050, a notable reduction in distribution is seen, especially in the State of Sonora and Baja California Sur, in contrast to a potential area in the northern region of Baja California.
3.4. Hotspot Analysis
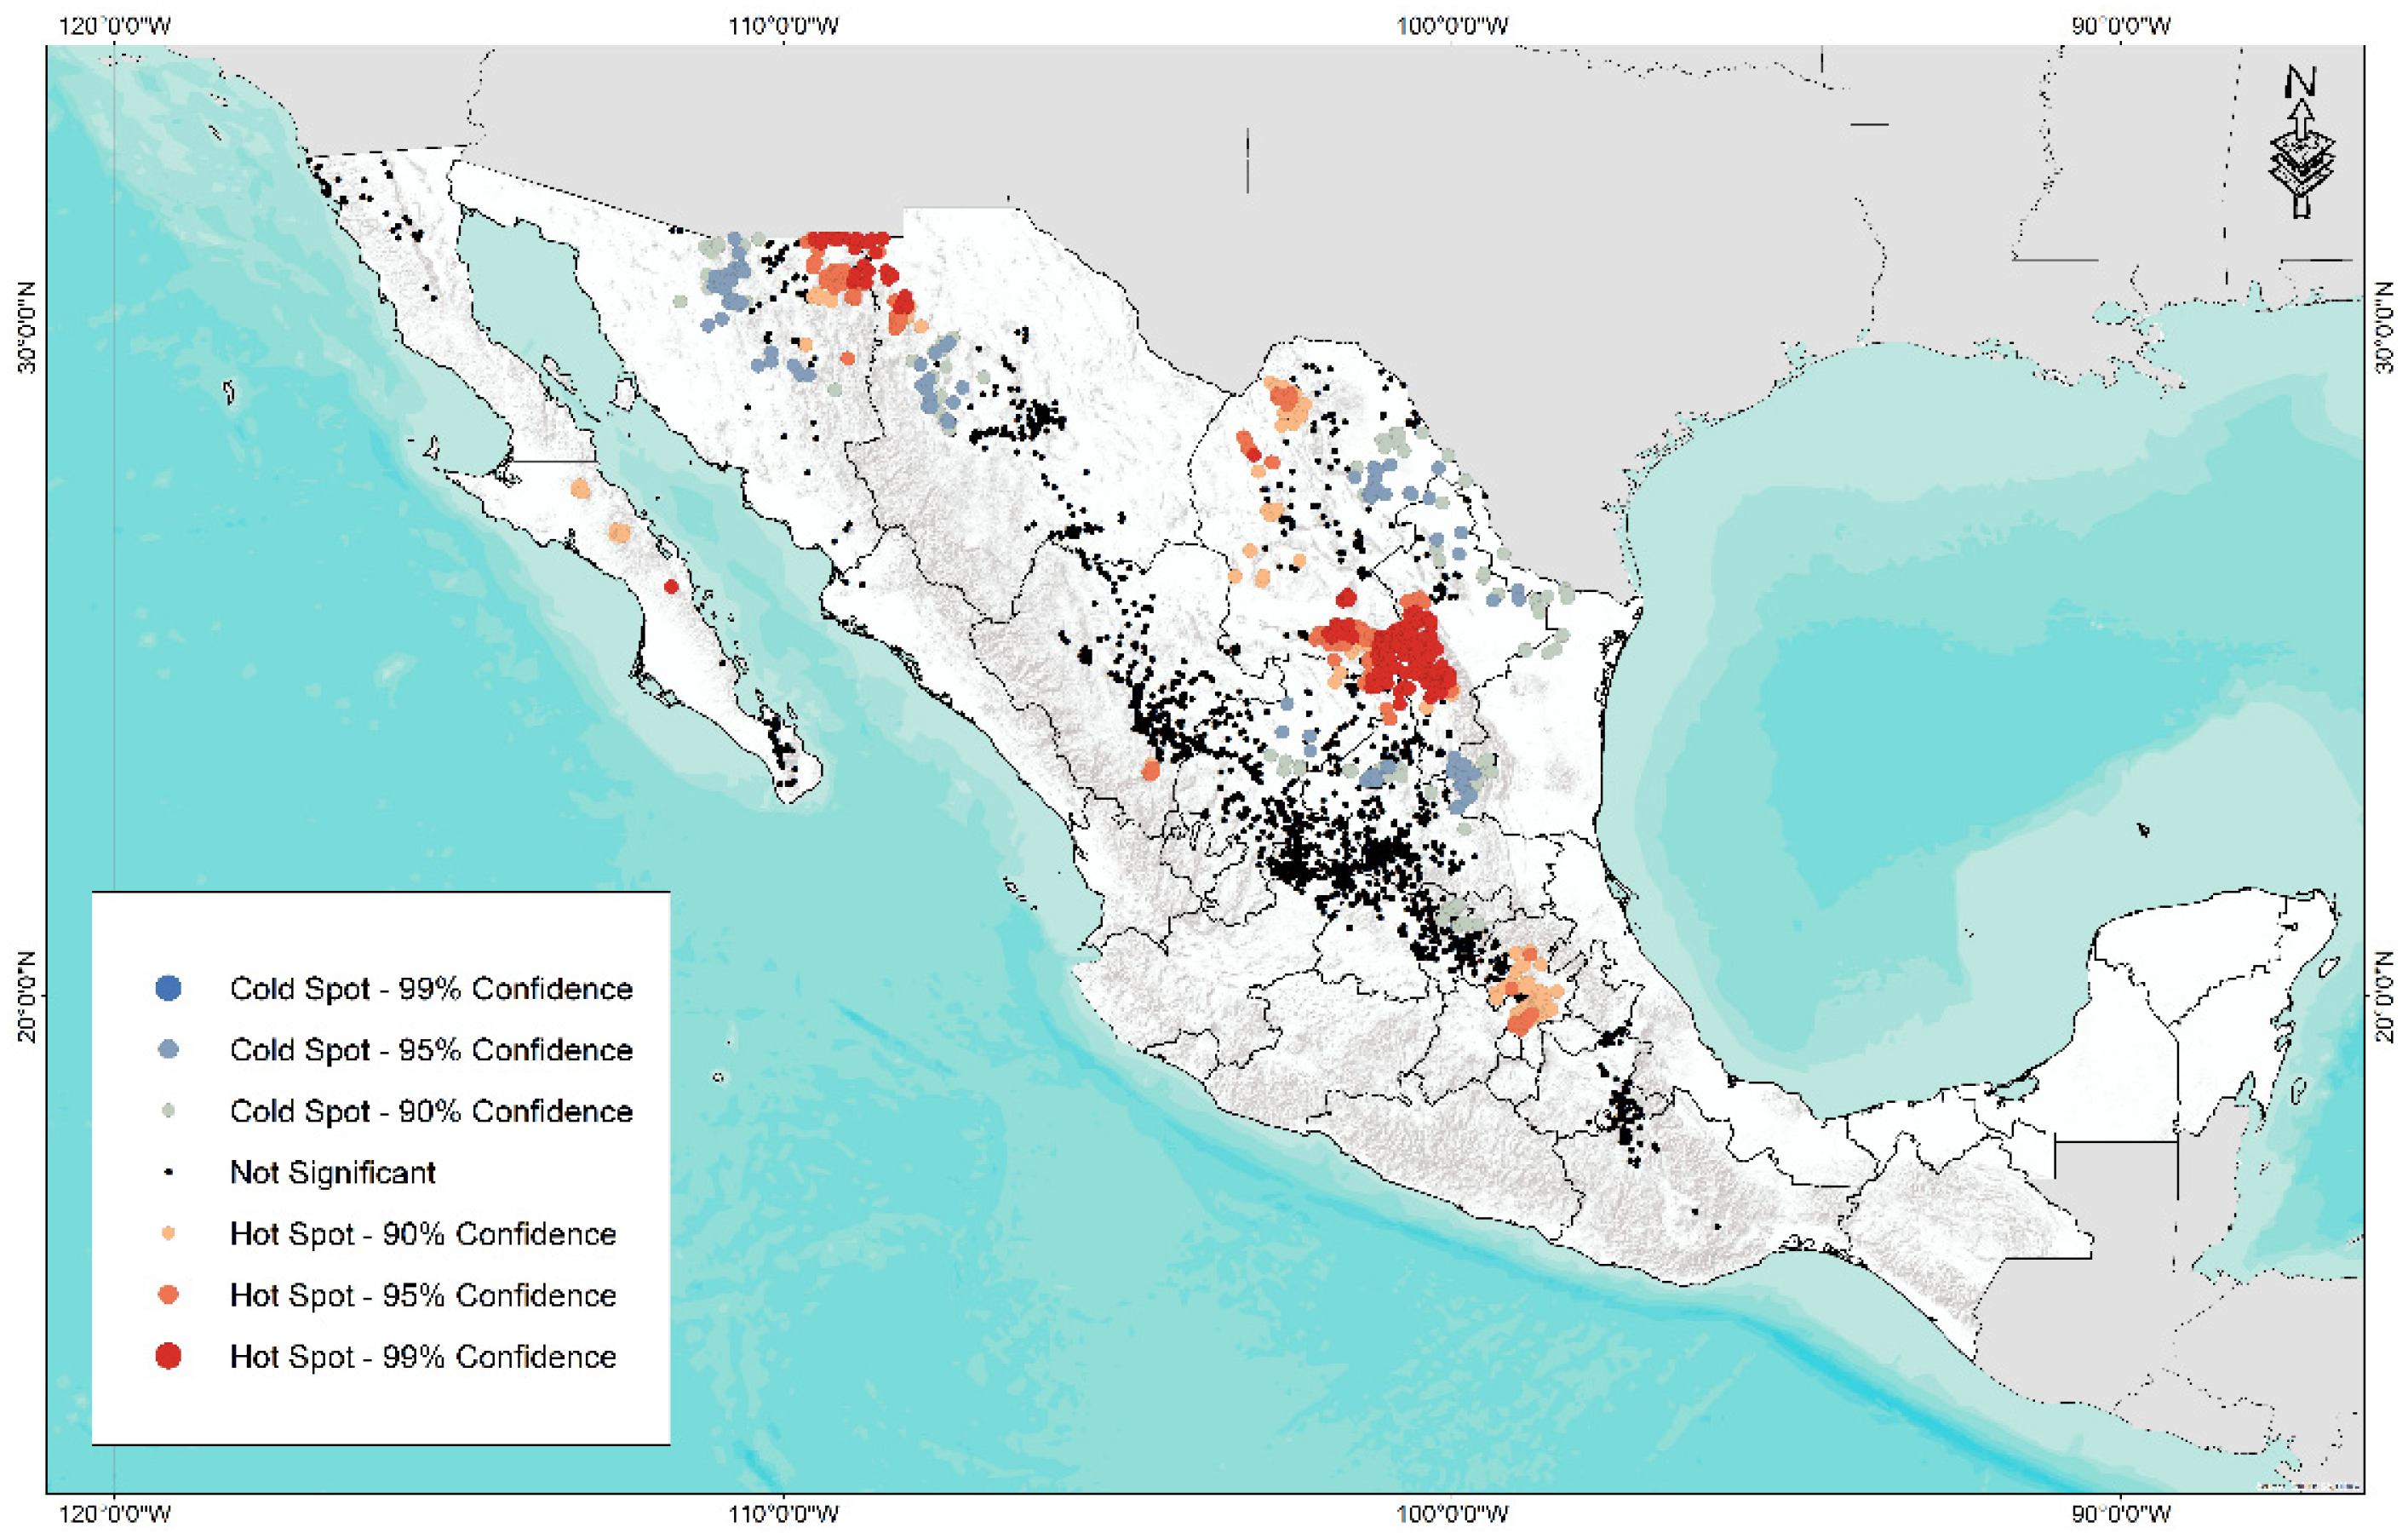
A hotspot analysis (Figure 7) identified two sites of high abundance (99% confidence), one in the north of the country in the border region between Sonora and Chihuahua and another in the south of the border zone of Coahuila and Nuevo León. Regarding cold or low diversity points (99% confidence), four areas were identified: north of Sonora, the central area of Chihuahua, north of Coahuila and Nuevo León, and the southern area of Tamaulipas bordering San Luis Potosí.
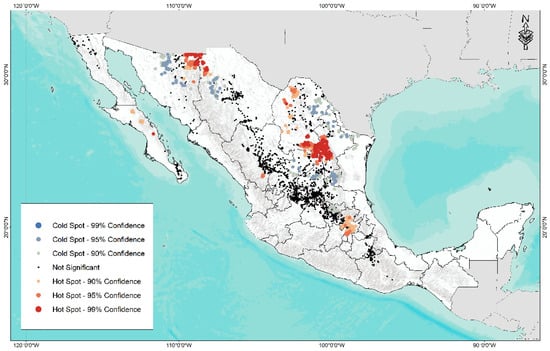
Figure 7.
Abundance map of hotspot (red) and coldspot (blue) for 3841 accessions of forage grasses from the arid and semi-arid region of Mexico.
The result of this analysis helps to identify areas of high and low diversity of forage species related to grazing sites and degraded soils. Likewise, this information is of great relevance to identify possible areas of collection and conservation of species due to high diversity and sites with low diversity of species. This constitutes the first step to carry out improvement programs (collect, evaluate, and select) for various uses in ecological rehabilitation or restoration, such as forage production, soil conservation strategies, development of drought-resistant ecotypes, among other key factors to reestablish the ecosystem services of these areas.
4. Discussion
One of the main contributions of this article is the identification of the ecological descriptors of the most representative native species of the arid and semi-arid regions of Mexico. To date, there are some studies where some morphological characteristics of the species of forage interest are mentioned in detail but not specific climatic data [67,68,69,70,71] that help identify accessions for conservation purposes (because they are tolerant to specific adverse factors) and use (species with desirable characteristics to incorporate in genetic breeding programs).
Regarding the statistical analyses, PCA showed acceptable performance in explaining the climatic diversity associated with the accessions of the 15 species studied. It is worth mentioning that similar studies in other species have had better statistical performance [44,45,48]. These results may be due to the lack of certainty in the taxonomic classification of the species found in electronic repositories. The first floristic studies of these areas were carried out in the decades from 1950 to 1970, describing only the floristic composition of the arid and semi-arid zones but not specific characteristics of the accessions sites and the associated climatic conditions [72].
A recurring problem in the classification of these species is the difficulty of identification due to the size of the reproductive structures and distinctive characteristics, such as the number of awns, spikelets, flowering characteristics, and growth habits, to mention some attributes that allow for the differentiation of the species. Although there are identification guides, the training and experience of taxonomists are important. In Mexico, there are few taxonomists specialized in the identification of grasses. However, in the last decade, researchers from INECOL have delved into the classification of these species with the support of molecular markers, so their study is based on phylogenetic relationships [18,70,73,74].
By analyzing the variables and structure of each main component, we can identify that the variables that make up the first component are related to temperature, while the second component is made up of variables related to water availability and variations in temperature.
It is important to consider that the success of this type of ecosystem lies in the fact that the species that inhabit them have been able to establish themselves in hostile and stressful environments, developing specific morphological, genetic, and physiological characteristics [75]. An example of this is their stomatal anatomy, as well as their density and arrangement, allowing them to present a faster response and greater efficiency in the use of water, making them tolerant to drought [76]. In addition to this, the type and arrangement of the leaves [77], the photosynthetic type in most of these species (C4) [78,79,80], and adaptations in roots [81,82,83] are characteristics that have contributed to the establishment and survival of these species, providing greater efficiency in carbon concentration, which reduces photorespiration, improves water-use efficiency, and, thereby, improves drought tolerance.
Regarding the results obtained in the AC, the algorithms used resulted in the formation of four statistically significant groups. However, when observing the average values of some variables, it could be more convenient to integrate only three groups, more clearly following their tendency to occupy more specific and contrasting gradients between them. This adjustment in classification could be very relevant for future research and for practical applications in the selection and management of species within the genetic improvement and environmental conservation programs.
However, it is important to consider that, although statistical analyses simplify the interaction between accession data and climate variables, allowing significant patterns to be visualized, the findings must be interpreted with caution, taking into account aspects such as biology, ecology, and the distribution of the species.
According to Arredondo (2005) [70], the semiarid grasslands of Mexico are distributed in a strip from the north to the southeast of the country, from Sonora to Guanajuato, while the arid shrublands extend widely from Baja California to Oaxaca. According to the results obtained, the current potential distribution generally agrees with what is reported in the literature, although it can be observed (Figure 6A) that not all areas considered arid or semi-arid [72] are suitable sites for the presence and establishment of the forage species analyzed.
It is worth mentioning that in addition to the climate-change impact (Figure 6B), which is expected to reduce the distribution of these species, there are situations, such as overgrazing and soil degradation, that threaten the security of these ecosystems. In general, climate change is expected to affect grasslands by directly and much more dramatically decreasing the productivity and contribution of environmental services of the grasslands and shrublands of Northern Mexico. This will impact the carrying capacity of grasslands, with reductions in meat production, loss of biodiversity, decrease in carbon-capture capacity, and effects on the hydrological cycle of these ecosystems [20,23,68,69]. It is important to emphasize that there are many studies worldwide on the ecology of grasslands. Specifically for Mexico, research on this type of ecosystem has been scarce. An example of this is the limited technology for seed production, with Mexico being one of the main seed-importing countries (for tropical areas, seed from Brazil is used, while for arid and semi-arid areas, it is mainly imported from the US), although for several decades, species from Africa and Asia were introduced to Mexico.
The deterioration of grasslands has generated the need to seek conservation strategies for the germplasm of forage genetic resources to search among them for alternatives that stabilize both the ecosystems and the economy of grasslands in Mexico [70]. In this regard, the result of the hotspot analysis constitutes a first approach to the areas of high and low diversity, where strategies for the use and conservation of these resources can begin to be applied. Among the species of greatest interest, B. curtipendula and B. gracilis (native to Mexico), Eragrostis superba and Pennisetum ciliare (introduced species) stand out due to the potential for dry matter and seed production, being species easy to propagate and establish, and tolerance of a wide diversity of climatic conditions, such as drought and high temperatures, as well as being able to establish itself in highly eroded soils. In this regard, in recent years, collections of vegetative material have been carried out, and the morphological, productive, and genetic attributes of native grasses have been evaluated.
One of the species that has been studied the most in Mexico is side-oats grama (Bouteloua curtipendula), where a wide genetic, morphological, and productive diversity has been reported. In species from a collection carried out in 13 states, from Sonora to Guerrero, gains in dry matter were recorderfrom 13.7 g to 1213 g DM plant-1 [71,84]. Another study conducted by Morales-Nieto et al. (2008) [84] pointed out that morphological diversity between genotypes may be due to differences in the environmental conditions of the site of origin. However, despite the relationship between the environmental conditions of origin and the formation of the groups. Within these, they found genotypes collected from different environmental conditions.
Another species that has been studied in detail is Bouteloua gracilis (blue grama). In this regard, a great genetic diversity has been found within this species [73], which is assumed to be due to the fact that the center of origin of this species is located in Central Mexico [72].
In relation to the study and conservation of genetic resources, various researchers have collected and evaluated more than 1200 ecotypes of native and introduced grasses [85], generating so far, only eight varieties of banderita grass (B. curtipendula), eight varieties of buffel grass (Pennisetum ciliare), and one of each of the navajita grasses (B. gracilis), weeping grass (Eragrostis curvula), and tick grass (Eragrostis superva) [86]. The selection and evaluation of these ecotypes for the generation of varieties were conducted considering the agronomic attributes (soil preparation, sowing time, amount of seed per ton, percentage of emergence, and establishment potential, among others) and forage attributes (leaf production and regrowth, among others). However, climate change is already affecting grasslands, directly and much more dramatically decreasing the productivity and contribution of environmental services of the grasslands and shrublands of Mexico. This will impact the carrying capacity of the grasslands, with reductions in meat production, loss of biodiversity, decrease in carbon-capture capacity, and effects on the hydrological cycle of these ecosystems [23].
Despite these findings, to date, there is no ecogeographic study that shows the environmental and adaptive ranges of these species, so this research constitutes a consultation document that will help in the generation of management, conservation, and sustainable-use programs for these resources.
5. Conclusions
Grasslands are highly productive ecosystems that have been little studied in Mexico and the world. The processes of evolution and adaptation of the species that inhabit these ecosystems have allowed them to have a wide distribution, with anatomical, physiological, and genetic changes, which have allowed them to face problems related to biotic and abiotic factors.
Despite the ecological, biological, and economic importance of these species (15 native species studied, Table 1), they have been little described, and to date, many aspects relevant to them are unknown.
This research provides relevant information on the most significant environmental characteristics that allow us to know the distribution, adaptation, and diversity patterns associated with the forage species studied. Likewise, the information generated is essential for the development of conservation and sustainable-use program strategies.
Regarding the identification of sites susceptible to conservation and according to the results obtained, the states with areas of high (hotspot) and low (diversity (coldspot) are concentrated in the states of Sonora, Chihuahua, Nuevo León, Tamaulipas, and San Luis Potosí. It is important to highlight that, in these areas and due to the climatic conditions of each site, the species have had to develop a series of morphotypes that are adapted to tolerate or resist specific conditions, such as extreme temperatures and low precipitation, which are representative characteristics of arid and semi-arid regions.
In addition to the areas of high and low diversity identified, it is necessary to consider the impact of climate change on the distribution of these species. Therefore it is required to pay close attention to the population dynamics and diversity patterns of the species that inhabit the states of Sonora and Baja California.
In relation to the species with the greatest potential for use, conservation, genetic diversity, and ecological importance, B. gracilis, B. curtipendula, B. dactiloydes, D. dubia, and M. phleoides stand out. These species are characterized by having high nutritional value for livestock (being one of the pillars in extensive livestock production) and good dry matter production, in addition to being species with the potential for seed production due to rapid dispersion and dissemination in the environment. In addition to the above, another outstanding characteristic of these species is their resilience to establish themselves in eroded or rocky places.
However, it is necessary to take into account the limitations regarding the availability of information and its veracity; to do this, it is necessary to develop strategies that allow greater certainty regarding the available information.
Author Contributions
Conceptualization, G.R.-O., E.R.-S., L.Á.B.-G. and A.V.-G.; methodology, G.R.-O. and L.Á.B.-G.; software, G.R.-O. and L.Á.B.-G.; validation, E.R.-S.; formal analysis, G.R.-O. and L.Á.B.-G.; data curation, G.R.-O.; writing—original draft preparation, G.R.-O.; writing—review and editing, G.R.-O., E.R.-S., L.Á.B.-G. and A.V.-G. All authors have read and agreed to the published version of the manuscript.
Funding
This research received no external funding.
Institutional Review Board Statement
Not applicable.
Informed Consent Statement
Not applicable.
Data Availability Statement
All data sources supporting accessions and climatic information used are mentioned in the Methodology section: (GBIF, https://www.gbif.org, accessed on 13 March 2024) and WorldClim, https://www.worldclim.org/, accessed on 13 March 2024) and references [24,25,26,27,28,29,30,31,32,33,34,35,36,37,38,40,41]. If more information is necessary, please contact the corresponding author Gabriela Ramírez-Ojeda (gabramirezo@gmail.com).
Conflicts of Interest
The authors declare no conflicts of interest.
References
- Comisión Nacional de Áreas Naturales Protegidas. Available online: https://www.gob.mx/conanp/articulos/mexico-megadiverso-173682 (accessed on 10 April 2024).
- Toledo, V.M.; Ordóñez, M. The biodiversity scenario of Mexico: A review of terrestrial habitats. In Ramamoorthy: Biological Diversity of Mexico: Origins and Distribution; Ramamoorthy, T.P., Bye, R., Lot, A., Fa, Y.J., Eds.; Oxford University Press: New York, NY, USA, 1993; pp. 739–755. [Google Scholar]
- Neyra, G.L.; Durand, S.L. Recursos Naturales. In La Diversidad Biológica de México, Estudio de País; Comisión Nacional para el Conocimiento y Uso de la Biodiversidad: Tlalpan, Mexico, 1998; pp. 62–96. [Google Scholar]
- Montaño, N.M.; Ayala, F.; Bullock, S.H.; Briones, O.; García-Oliva, F.; García-Sánchez, R.; Maya, Y.; Perroni, Y.; Siebe, C.; Tapia-Torres, Y.; et al. Almacenes y flujos de carbono en ecosistemas áridos y semiáridos de México: Síntesis y perspectivas. Terra Latinoam. 2016, 34, 39–59. [Google Scholar]
- Briones, O.; Búrquez, A.; Martínez-Yrízar, A.; Pavón, N.; Perroni, Y. Biomasa y productividad en las zonas áridas mexicanas. Madera Bosques 2018, 24, e2401898. [Google Scholar] [CrossRef]
- White, R.P.; Nackoney, J. Drylands, People, and Ecosystem Goods and Services: A Web-Based Geospatial Analysis; World Resources Institute: Washington, DC, USA, 2003; p. 58. [Google Scholar]
- Flores, O.M.H. Las Zonas Áridas y Semiáridas de MÉXICO, Las Menos Explotadas; Boletín UNAM-DGCS-763; Universidad Autónoma de México: Mexico City, Mexico, 2011; Available online: https://www.dgcs.unam.mx/boletin/bdboletin/2011_763.html (accessed on 15 April 2024).
- Dávila, P.; Mejia-Saulés, M.T.; Soriano-Martínez, A.M.; Herrera-Arrieta, Y. Conocimiento taxonómico de la familia Poaceae en México. Bot. Sci. 2018, 96, 462–514. [Google Scholar] [CrossRef]
- Dávila, A.P.; Mejía-Saulés, M.T.; Gómez-Sánchez, M.; Valdés-Reyna, J.; Ortíz, J.J.; Morín, C.; Castrejón, J.; Ocampo, A. Catálogo de Gramíneas de México; México, D.F., Ed.; Universidad Nacional Autónoma de México: Coyoacán, Mexico; Comisión Nacional para el Conocimiento y Uso de la Biodiversidad: Tlalpan, Mexico, 2006; 436p. [Google Scholar]
- Soreng, R.J.; Peterson, P.M. Revision of Poa L. (Poaceae, Pooideae, Poeae, Poinae) in Mexico: New recods, re-evaluation of P. ruprechtii, and two new species, P. palmeri and P. wendtii. PhytoKeys 2012, 15, 1–104. [Google Scholar] [CrossRef] [PubMed]
- Soreng, R.J.; Peterson, P.M.; Romaschenko, K.; Davidse, G.; Zuloaga, F.O.; Judziewicz, E.J.; Filgueiras, T.S.; Davis, J.I.; Morrone, O. A worldwide phylogenetic classification of the Poaceae (Gramineae). J. Syst. Evol. 2015, 53, 117–137. [Google Scholar] [CrossRef]
- Secretaría de Medio Ambiente y Recursos Naturales (Semarnat). Informe de la Situación Del Medio Ambiente en México. Compendio de Estadísticas Ambientales. México. 2015. Available online: https://apps1.semarnat.gob.mx:8443/dgeia/informe15/tema/pdf/Informe15_completo.pdf (accessed on 24 February 2024).
- Chaplot, V.; Dlamini, P.; Chivenge, P. Potential of grassland rehabilitation through high density-short duration grazing to sequester atmospheric carbon. Geoderma 2016, 271, 10–17. [Google Scholar] [CrossRef]
- Álvarez-Holguín, A.; Morales-Nieto, C.R.; Corrales-Lerma, R.; Avendaño-Arrazate, C.H.; Rubio-Arias, H.O.; Villarreal-Guerrero, F. Caracterización estomática, concentración de clorofila y su relación con producción de biomasa en Bouteloua curtipendula. Agron. Mesoam. 2018, 29, 251–261. [Google Scholar] [CrossRef]
- Morales, C.R.; Avendaño-Arrazate, C.; Melgoza-Castillo, A.; Martínez-Salvador, M.; Jurado-Guerra, P. Caracterización morfológica y molecular de poblaciones de zacate tempranero (Setraria macrostachya) en Chihuahua, México. Rev. Int. De Botánica Exp. 2015, 84, 190–200. [Google Scholar]
- Morales, C.R.; Avendaño, C.; Melgoza, A.; Gil, K.; Quero, A.; Martínez, M. Caracterización morfológica y molecular de poblaciones de pasto banderita (Bouteloua curtipendula) en Chihuahua, México. Rev. Mex. Cienc. Pecu. 2016, 7, 455–469. [Google Scholar] [CrossRef]
- Morales, C.R.; Madrid, L.; Melgoza, A.; Martínez, M.; Arévalo, S.; Quintín, R.C.; Jurado, P. Análisis morfológico de la diversidad del pasto navajita [Bouteloua gracilis (Willd. Ex Kunth) Lag. Ex Steud], en Chihuahua, México. Técnica Pecu. Mex. 2009, 47, 245–256. [Google Scholar]
- Morales, C.R.; Melgoza, C.A.; Jurado, G.P.; Martínez, S.M.; Avendaño, A.C. Caracterización fenotípica y molecular de poblaciones de zacate punta blanca (Digitaria californica (Benth.) Henr.). Rev. Mex. Cienc. Pecu. 2012, 3, 171–184. [Google Scholar]
- Morales, C.R.; Rivero, O.; Melgoza, A.; Jurado, P.; Martínez, M. Caracterización morfológica y molecular de Leptochloa dubia (Poaceae) en Chihuahua, México. Polibotánica 2013, 36, 79–94. [Google Scholar]
- Quero-Carrillo, A.R.; Miranda-Jiménez, L.; Villanueva-Ávalos, J.F. Recursos genéticos de gramíneas para el pastoreo extensivo. Condición actual y urgencia de su conservación ante el cambio climático. Av. Investig. Agropecu. 2017, 21, 63–85. [Google Scholar]
- Morales-Querol, D.; Rodríguez-Hernández, R.; López-Vigoa, O.; Ojeda-García, F.; Camejo-Rodríguez, D.; García-Sánchez, F.; Fundora-Fernández, L. Evaluación química y organoléptica de ensilajes de Sorghum bicolor (L.) Moench y pulpa de Citrus sp. Pastos Forrajes 2022, 45, e17. [Google Scholar]
- Márquez-Godoy, J.N.; Corrales-Lerma, R.; Álvarez-Holguín, A.; Villarreal-Guerrero, F.; Santellano-Estrada, E.; Pinedo-Álvarez, A.; Morales-Nieto, C.R. Diversidad morfológica y nutricional de poblaciones de pasto lobero (Muhlenbergia phleoides [Kunth] Columbus) en Chihuahua, México. Acta Univ. 2022, 32, e3404. [Google Scholar]
- Jurado-Guerra, P.; Velázquez-Martínez, M.; Sánchez-Gutiérrez, R.A.; Álvarez-Holguín, A.; Domínguez-Martínez, P.A.; Gutiérrez-Luna, R.; Garza-Cedillo, R.D.; Luna-Luna, M.; Chávez-Ruiz, M.G. Los pastizales y matorrales de zonas áridas y semiáridas de México: Estatus actual, retos y perspectivas. Rev. Mex. Cienc. Pecu. 2021, 12 (Suppl. S3), 261–285. [Google Scholar] [CrossRef]
- GBIF.org. Aristida divaricata. Available online: https://www.gbif.org/occurrence/download/0085605-240229165702484 (accessed on 13 March 2024).
- GBIF.org. Bouteloua gracilis. Available online: https://www.gbif.org/occurrence/download/0084790-240229165702484 (accessed on 13 March 2024).
- GBIF.org. Boutelous dactyloides. Available online: https://www.gbif.org/occurrence/download/0084841-240229165702484 (accessed on 13 March 2024).
- GBIF.org. Bouteloua hirsuta. Available online: https://www.gbif.org/occurrence/download/0084882-240229165702484 (accessed on 13 March 2024).
- GBIF.org. Bouteloua curtipendula. Available online: https://www.gbif.org/occurrence/download/0084920-240229165702484 (accessed on 13 March 2024).
- GBIF.org. Bouteloua repens. Available online: https://www.gbif.org/occurrence/download/0085250-240229165702484 (accessed on 13 March 2024).
- GBIF.org. Bouteloua scorpioides. Available online: https://www.gbif.org/occurrence/download/0085274-240229165702484 (accessed on 13 March 2024).
- GBIF.org. Digitaria californica. Available online: https://www.gbif.org/occurrence/download/0085320-240229165702484 (accessed on 13 March 2024).
- GBIF.org. Muhlenbergia phleoides. Available online: https://www.gbif.org/occurrence/download/0085408-240229165702484 (accessed on 13 March 2024).
- GBIF.org. Muhlenbergia rigida. Available online: https://www.gbif.org/occurrence/download/0085427-240229165702484 (accessed on 13 March 2024).
- GBIF.org. Disakisperma dubium. Available online: https://www.gbif.org/occurrence/download/0085459-240229165702484 (accessed on 13 March 2024).
- GBIF.org. Bothriochloa barbinodis. Available online: https://www.gbif.org/occurrence/download/0085504-240229165702484 (accessed on 13 March 2024).
- GBIF.org. Eragrostis Intermedia. Available online: https://www.gbif.org/occurrence/download/0085528-240229165702484 (accessed on 13 March 2024).
- GBIF.org. Setaria macrostachya. Available online: https://www.gbif.org/occurrence/download/0085557-240229165702484 (accessed on 13 March 2024).
- GBIF.org. Muhlenbergia emersleyi. Available online: https://www.gbif.org/occurrence/download/0085583-240229165702484 (accessed on 13 March 2024).
- García, E. ‘Rangos de Humedad’, Extraido de Climas: IV.4.10. Atlas Nacional de México, Vol II. Escala 1: 4000000; Instituto de Geografia UNAM: Mexico City, Mexico, 1990. [Google Scholar]
- Fick, S.E.; Hijmans, R.J. WorldClim 2: New 1km spatial resolution climate surfaces for global land areas. Int. J. Climatol. 2017, 37, 4302–4315. [Google Scholar] [CrossRef]
- Trabucco, A.; Zomer, R.J. Global high-resolution soil-water balance. Figshare Fileset 2019, 10, m9. [Google Scholar] [CrossRef]
- Steiner, J.J.; Greene, S.L. Proposed ecological descriptors and their utility for plant germplasm collections. Crop. Sci. 1996, 36, 439–451. [Google Scholar] [CrossRef]
- Sánchez-González, J.; Ruiz-Corral, J.A.; García-Medina, G.; Ramírez-Ojeda, G.; Larios, L.D.L.C.; Holland, J.B. Ecogeography of teosinte. PLoS ONE 2018, 13, e0192676. [Google Scholar] [CrossRef] [PubMed]
- Ramírez-Ojeda, G.; Peralta, I.E.; Rodríguez-Guzmán, E.; Chávez-Servia, J.L.; Sahagún-Castellanos, J.; Rodríguez-Pérez, J.E. Climatic diversity and ecological descriptors of wild tomato species (Solanum sect. Lycopersicon) and close related species (Solanum sect. Juglandifolia y sect. Lycopersicoides) in Latin America. Plants 2021, 10, 855. [Google Scholar] [CrossRef] [PubMed]
- Ramírez-Ojeda, G.; Peralta, I.E.; Rodríguez-Guzmán, E.; Sahagún-Castellanos, J.; Chávez-Servia, J.L.; Medina-Hinostroza, T.C.; Rijalba-Vela, J.R.; Vásquez-Núñez, L.P.; Rodríguez-Pérez, J.E. Edaphoclimatic descriptors of wild tomato species (Solanum sect. Lycopersicon) and closely related species (Solanum sect. Juglandifolia and Sect. Lycopersicoides) in South America. Front. Genet. 2021, 12, 748979. [Google Scholar] [CrossRef] [PubMed]
- Ruiz-Corral, J.A.; Durán-Puga, N.; Sánchez-González, J.J.; Ron-Parra, J.; González-Eguiarte, D.R.; Holland, J.B.; Medina-García, G. Climatic adaptation and ecological descriptors of 42 Mexican Maize (Zea mays L.) races. Crop. Sci. 2008, 48, 1502–1512. [Google Scholar] [CrossRef]
- Cerda-Hurtado, I.M.; Mayek-Pérez, N.; Hernández-Delgado, S.; Muruaga-Martínez, J.S.; Reyes-Lara, M.A.; Reyes-Valdés, M.H.; González-Prieto, J.M. Climatic adaptation and ecological descriptors of wild beans from Mexico. Ecol. Evol. 2018, 8, 6492–6504. [Google Scholar] [CrossRef]
- Ramírez-Ojeda, G.; Rodríguez-Pérez, J.E.; Rodríguez-Guzmán, E.; Sahagún-Castellanos, J.; Chávez-Servia, J.L.; Peralta, I.E.; Barrera-Guzmán, L.Á. Distribution and Climatic Adaptation of Wild Tomato (Solanum lycopersicum L.) Populations in Mexico. Plants 2022, 11, 2007. [Google Scholar] [CrossRef] [PubMed]
- ArcGis, Version 10.3; Environmental Systems Research Institute, Inc.: Redlands, CA, USA, 2010.
- Beck, H.E.; McVicar, T.R.; Vergopolan, N.; Berg, A.; Lutsko, N.j.; Dufour, A.; Zeng, Z.; Jiang, X.; van Dijk, A.I.J.M.; Miralles, D.G. High-resolution (1 km) Köppen-Geiger maps for 1901–2099 based on constrained CMIP6 projections. Sci. Data 2023, 10, 724. [Google Scholar] [CrossRef] [PubMed]
- Lê, S.; Josse, J.; Husson, F. FactoMineR: An R package for multivariate analysis. J. Stat. Softw. 2008, 25, 1–18. [Google Scholar] [CrossRef]
- Kassambara, A. Practical Guide to Principal Component Methods in R, 1st ed.; CreateSpace Independent Publishing Platform: Scotts Valley, CA, USA, 2017; p. 29. Available online: https://payhip.com/b/shrk (accessed on 24 February 2024).
- Yilan, L.; Rutong, Z. Clustertend: Check the Clustering Tendency, R Package Version 1.4. 2015. Available online: https://CRAN.R-project.org/package=clustertend (accessed on 24 February 2024).
- Brock, G.; Pihur, V.; Datta, S.; Datta, S. clValid: An R Package for Cluster Validation. J. Stat. Softw. 2008, 25, 1–22. [Google Scholar] [CrossRef]
- Charrad, M.; Ghazzali, N.; Boiteau, V.; Niknafs, A. NbClust: An R package for determining the relevant number of clusters in a data set. J. Stat. Softw. 2014, 61, 1–36. [Google Scholar] [CrossRef]
- R Core Team. R: A Language and Environment for Statistical Computing; R Foundation for Statistical Computing: Vienna, Austria, 2020. [Google Scholar]
- Phillips, S.J.; Dudík, M.; Schapire, R.E. Maxent Software for Modeling Species Niches and Distributions (Version 3.4.1). Available online: http://biodiversityinformatics.amnh.org/open_source/maxent/ (accessed on 24 February 2024).
- Phillips, S.J.; Anderson, R.P.; Schapire, R.E. Maximum entropy modeling of species geographic distributions. Ecol. Model. 2006, 190, 231–259. [Google Scholar] [CrossRef]
- Elith, J.; Phillips, S.J.; Hastie, T.; Dudík, M.; Chee, Y.E.; Yates, C.J. A statistical explanation of MaxEnt for ecologists. Divers. Distrib. 2011, 17, 43–57. [Google Scholar] [CrossRef]
- Fourcade, Y.; Engler, J.O.; Rödder, D.; Secondi, J. Mapping species distributions with MaxEnt using a geographically biased sample of presence data: A performance assessment of methods for correcting sampling bias. PLoS ONE 2014, 9, e97122. [Google Scholar] [CrossRef] [PubMed]
- Avila, C.A.; Villavicencio, G.R.; Ruiz Corral, J.A. Distribución potencial de Pinus herrerae Martínez en el Occidente del estado de Jalisco. Rev. Mex. Cien. For. 2014, 5, 92–108. [Google Scholar] [CrossRef]
- Hanley, J.A.; McNeil, B.J. The meaning and use of the area under a receiver operating characteristic (ROC) curve. Radiology 1982, 143, 29–36. [Google Scholar] [PubMed]
- Soberón, J.; Peterson, T. Ecological niche shifts and environmental space anisotropy: A cautionary note. Rev. Mex. Biodivers. 2011, 82, 1348–1355. [Google Scholar]
- Hijmans, J.R.; Spooner, D.M. Geographic distribution of wild potato species. Am. J. Bot. 2001, 88, 2101–2112. [Google Scholar] [CrossRef] [PubMed]
- Spooner, D.M.; Gavrilenko, T.; Jansky, S.H.; Ovchinnikova, A.; Krylova, E.; Knapp, S.; Simon, R. Ecogeography of ploidy variation in cultivated potato (Solanum sect. Petota). Am. J. Bot. 2010, 97, 2049–2060. [Google Scholar] [CrossRef] [PubMed]
- Getis, A.; Ord, J.K. The analysis of spatial association by use of distance statistics. Geogr. Anal. 1992, 24, 189–206. [Google Scholar] [CrossRef]
- Morales-Nieto, C.R.; Corrales-Lerma, R.; Álvarez-Holguín, A.; Villarreal-Guerrero, F.; Santellano-Estrada, E. Caracterización de poblaciones de pasto banderita (Bouteloua curtipendula) deméxico para seleccionar genotipos con potencial para producción de semilla. Rev. Fitotec. Mex. 2017, 40, 309–316. [Google Scholar] [CrossRef]
- Liu, M.; Dries, L.; Huang, J.; Min, S.; Tang, J. The impacts of the eco-environmental policy on grassland degradation and livestock production in Inner Mongolia, China: An empirical analysis based on the simultaneous equation model. Land Use Policy 2019, 88, 104167. [Google Scholar] [CrossRef]
- Hu, Y.; Huang, J.; Hou, L. Impacts of the Grassland Ecological Compensation Policy on Household Livestock Production in China: An Empirical Study in Inner Mongolia. Ecol. Econ. 2019, 161, 248–526. [Google Scholar] [CrossRef]
- Arredondo, M.T.; Huber-Sannwald, E.; García, M.E.; García, H.M.; Aguado, S.G.A. Selección de germoplasma de zacate navajita con diferente historial de uso en Jalisco, México. Tec. Pecu Mex. 2005, 43, 371–385. [Google Scholar]
- Morales-Nieto, C.; Quero, A.; Le-Blanc, O.; Hernández, A.; Pérez, J.; González, S. Caracterización de la diversidad del pasto nativo Bouteloua curtipendula Michx. Torr. mediante marcadores de AFLP. Agrociencia 2006, 40, 711–720. [Google Scholar]
- Rzedowski, J. Vegetación de México, 1st ed.; Comisión Nacional para el Conocimiento y Uso de la Biodiversidad: Tlalpan, Mexico, 2006; 505p. [Google Scholar]
- Morales-Nieto, C.R.; Álvarez-Holguín, A.; Villarreal-Guerrero, F.; Corrales-Lerma, R.; Pinedo-Álvarez, A.; Salvador, M.M. Phenotypic and genetic diversity of blue grama (Bouteloua gracilis) populations from Northern Mexico. Arid Land Res. Manag. 2019, 34, 83–98. [Google Scholar] [CrossRef]
- Avendaño-González, M.; Morales-Domínguez, J.F.; Siqueiros-Delgado, M.E. Genetic structure, phylogeography, and migration routes of Bouteloua gracilis (Kunth) Lag. ex Griffiths (Poaceae: Chloridoideae). Mol. Phylogenetics Evol. 2019, 134, 50–60. [Google Scholar] [CrossRef] [PubMed]
- Scheffer, M.; Hirota, M.; Holmgren, M.; Van Nes, E.H.; Chapin, F.S., 3rd. Thresholds for boreal biome transitions. Proc. Natl. Acad. Sci. USA 2012, 109, 21384–21389. [Google Scholar] [CrossRef] [PubMed]
- Lawson, T.; Vialet-Chabrand, S. Speedy stomata, photosynthesis and plant water use efficiency. New Phytol. 2019, 221, 93–98. [Google Scholar] [CrossRef] [PubMed]
- Drake, P.L.; de Boer, H.J.; Schymanski, S.J.; Veneklaas, E.J. Two sides to every leaf: Water and CO2 transport in hypostomatous and amphistomatous leaves. New Phytol. 2019, 222, 1179–1187. [Google Scholar] [CrossRef] [PubMed]
- Schubert, M.; Grønvold, L.; Sandve, S.R.; Hvidsten, T.R.; Fjellheim, S. Evolution of cold acclimation and its role in niche transition in the temperate grass subfamily Pooideae. Plant Physiol. 2019, 180, 404–419. [Google Scholar] [CrossRef] [PubMed]
- Pardo, J.; VanBuren, R. Evolutionary innovations driving abiotic stress tolerance in C4 grasses and cereals. Plant Cell 2021, 33, 3391–3401. [Google Scholar] [CrossRef] [PubMed]
- Marks, R.A.; Farrant, J.M.; Nicholas McLetchie, D.; VanBuren, R. Unexplored dimensions of variability in vegetative desiccation tolerance. Am. J. Bot. 2021, 108, 346–358. [Google Scholar] [CrossRef]
- Grossman, J.D.; Rice, K.J. Evolution of root plasticity responses to variation in soil nutrient distribution and concentration. Evol. Appl. 2012, 5, 850–857. [Google Scholar] [CrossRef] [PubMed]
- Bulgarelli, D.; Schlaeppi, K.; Spaepen, S.; Ver Loren van Themaat, E.; Schulze-Lefert, P. Structure and functions of the bacterial microbiota of plants. Annu. Rev. Plant Biol. 2013, 64, 807–838. [Google Scholar] [CrossRef] [PubMed]
- Postma, J.A.; Schurr, U.; Fiorani, F. Dynamic root growth and architecture responses to limiting nutrient availability: Linking physiological models and experimentation. Biotechnol. Adv. 2014, 32, 53–65. [Google Scholar] [CrossRef] [PubMed]
- Morales-Nieto, C.R.; Quero, A.; Pérez, J.; Hernández, A.; Le-Blanc, O. Caracterización morfológica de poblaciones nativas de pasto banderita [Bouteloua curtipendula (Michx.) Torr.] en México. Agrociencia 2008, 42, 767–775. [Google Scholar]
- Beltrán, L.S.; García, D.C.A.; Hernández, J.A.; Loredo, O.C.; Urrutia, M.J.; González, L.A. “ Banderilla Diana” Bouteloua curtipendula (Michx.) Torr., nueva variedad de pasto para zonas áridas y semiáridas. Rev. Mex. Cienc. Pecu. 2013, 4, 217–221. [Google Scholar]
- Servicio Nacional de Inspección y Certificación de Semillas (SNICS). Catálogo Nacional de Variedades Vegetales. Available online: https://datastudio.google.com/u/0/reporting/5b7206ba-e190-48fe-9696-73523bfccf58/page/itBWB (accessed on 7 July 2023).
Disclaimer/Publisher’s Note: The statements, opinions and data contained in all publications are solely those of the individual author(s) and contributor(s) and not of MDPI and/or the editor(s). MDPI and/or the editor(s) disclaim responsibility for any injury to people or property resulting from any ideas, methods, instructions or products referred to in the content. |
© 2024 by the authors. Licensee MDPI, Basel, Switzerland. This article is an open access article distributed under the terms and conditions of the Creative Commons Attribution (CC BY) license (https://creativecommons.org/licenses/by/4.0/).