Abstract
Air pollution is a leading cause of death in the United States and is associated with adverse health outcomes, including increased vulnerability to coronavirus disease 2019 (COVID-19). The AirBeam2 was used to measure particulate matter with a diameter of 2.5 μm or smaller (PM2.5) to investigate differences between indoor and ambient levels at seven private homes in New York during and after the COVID-19 lockdown. Measurements taken in 2020 fall, 2021 winter, and 2022 fall showed that at 90% of the sites, indoor PM2.5 levels exceeded outdoor levels both during and after the COVID-19 lockdown, p = 0.03, possibly exceeding safety levels. Higher indoor PM2.5 levels attributed to little or no ventilation in the basement and kitchens from cooking and smoke were greater in fall than in winter. Higher ambient PM2.5 levels were attributed to vehicular traffic at a street-facing sampling site. PM2.5 sources identified in this study may help in devising control strategies to improve indoor air quality (IAQ) and consequently alleviate respiratory health effects. These findings may be used as a basis for in-house modifications, including natural ventilation and the use of air purifiers to reduce exposures, mitigate future risks, and prevent potential harm to vulnerable residents.
1. Introduction
Poor air quality is associated with adverse health outcomes and is a leading cause of death in the U.S. [1,2,3]. Since air pollutants are ubiquitous, many studies have investigated indoor and outdoor air quality, as human activities and emission sources vary both in outdoor and indoor environments, such as vehicular emissions, thermal power plants, solid fuel combustion, food grilling, and frying [4]. Particulate matter (PM) is one of the major pollutants known to degrade air quality and is categorized by size fractions. Coarse particles, referred to as PM10, have an aerodynamic diameter of 10 μm or less; they are produced mainly from construction sites, mines, dirt roads, and natural sources, such as forest fires, and can irritate the eyes, nose, and throat. Fine particles that measure 2.5 μm or less in diameter, referred to as PM2.5, include a subcategory, or ultrafine particles less than 1 micron in diameter [4]; these pose a greater health risk because they can reach deep into the lungs and enter the bloodstream. PM2.5 is usually found in smoke from fires, power plants, and motor vehicles, and has been linked to chronic and acute respiratory, cardiovascular, and nervous system illnesses that can result in mortality, even at concentrations below the 24 h national ambient air quality standard (NAAQS) of 35 µg/m3 [4,5].
The association between PM2.5 and respiratory infections is a serious concern that heightened after COVID-19 was declared by the World Health Organization (WHO) as a public health emergency [6]. Indoor air pollution (IAP) remains a concern; however, data on IAP during the pandemic are lacking. IAP has been classified as one of the top five environmental health hazards [7], and recent studies have found that it exceeded ambient levels [8]. Since most Americans spend more than 90% of their time indoors, a healthy indoor environment is very important [9]. While compulsory lockdown during the COVID-19 pandemic apparently contributed to improved ambient air quality in most cities, exposure to IAP was significant [10]. IAQ issues are generally caused by household energy conservation, a lack of adequate ventilation, and the use of cleaning products and disinfectants, which intensified during the COVID-19 pandemic. Higher IAP is also attributed to the absence of meteorological influence, particularly wind speed, which is known to dilute air pollutant concentrations outdoors [11]. Recent scientific evidence has shown that indoor air can be more seriously polluted than outdoor air in urban areas, including the largest and most industrialized cities in the world [9]. With no IAQ health standards, high IAP levels imply greater health risks among vulnerable residents, especially children, the elderly, and individuals suffering from chronic respiratory and cardiovascular diseases [9].
During the COVID-19 pandemic lockdown, restrictions on business and transportation resulted in a dramatic reduction in air pollution levels in most cities around the world; however, the apparent improvement in air quality did not necessarily reduce exposure to IAP and presumably, vulnerability to respiratory health effects. As most people utilized online sources for work and shopping, this change, in reality, raised the question of whether the risk of exposure to PM2.5 in homes increased with more time spent indoors. Air quality in homes could be worse because pollutants in such environments are restricted by walls and ceilings, which are absent in outdoor spaces. Exposure to PM2.5 could result in an elevated risk for acute or chronic respiratory infections and disease, susceptibility, and exacerbation of inflammatory stimuli in young and even healthy individuals [12]. PM exposure has also been associated with increased medical visits and hospitalizations [13]. Wu et al. (2020) found that an increase of only 1 μg/m3 in long-term average PM2.5 levels was associated with a significant increase of 15% in the COVID-19 death rate [14].
Cooking is a major contributor to indoor air pollution because the different types of foods prepared may produce a variety of volatile organic compounds (VOCs) and PM, which may cause detrimental health effects [15]. Approximately 3.8 million people worldwide die every year from illnesses attributable to the harmful indoor air from cookstoves and fuel [16]. Additionally, kitchens are regularly characterized by a micro-climate due to food preparation processes with higher temperatures and humidity [17]. Generally, most adults spend over 10% of their time in kitchen areas to prepare meals, eat, or clean up after meal preparation [18]. Harmful compounds and particles are produced from incomplete combustion of biomass at fireplaces, open fires, and stoves due to an insufficient supply of oxygen [18]. IAQ problems also result from the use of solid fuels in stoves for household heating and cooking, especially from stir-frying and deep-frying methods and smoking in homes [19]. The basement is also a microenvironment where dust, mold, and high relative humidity may persist due to limited ventilation and stored items such as unused furniture, lacquers, paints, and gasoline contribute to an odor called the “basement smell” mainly due to putrefaction processes and the growth of microorganisms [18]. Such biological air pollution may cause serious health effects. Even under normal conditions, infiltration of PM2.5 through ventilation systems could further degrade IAQ. Outdoor air tends to enter and leave buildings by natural or mechanical ventilation through open windows or unsealed cracks in doors; IAQ can also be influenced by ambient temperature and humidity [17,20]. Depending on the weather conditions, people tend to open or close their windows and operate air conditioning systems, humidifiers, and heaters. Through these processes, outdoor air moves indoors at a rate of replacement termed the air exchange rate which, when low, contributes to an increase in air pollutant levels [4].
This pilot study aimed to provide a simple uncomplicated way to determine PM2.5 levels indoors for comparison with ambient levels and identify the potential risks of exposure to indoor emission sources that can be targeted for reduction or removal through increased ventilation or supplemental filtration for improved IAQ. This study does not intend to discuss or draw conclusions about the health impacts of measured PM2.5 concentrations. The complexity of identifying health risks, personal health status, level of exposure, and other environmental factors; however, is noteworthy, as it is not possible to fully understand potential health impacts or risks solely by detecting PM2.5 levels using low-cost technology, such as the AirBeam2.
2. Materials and Methods
2.1. Study Sites
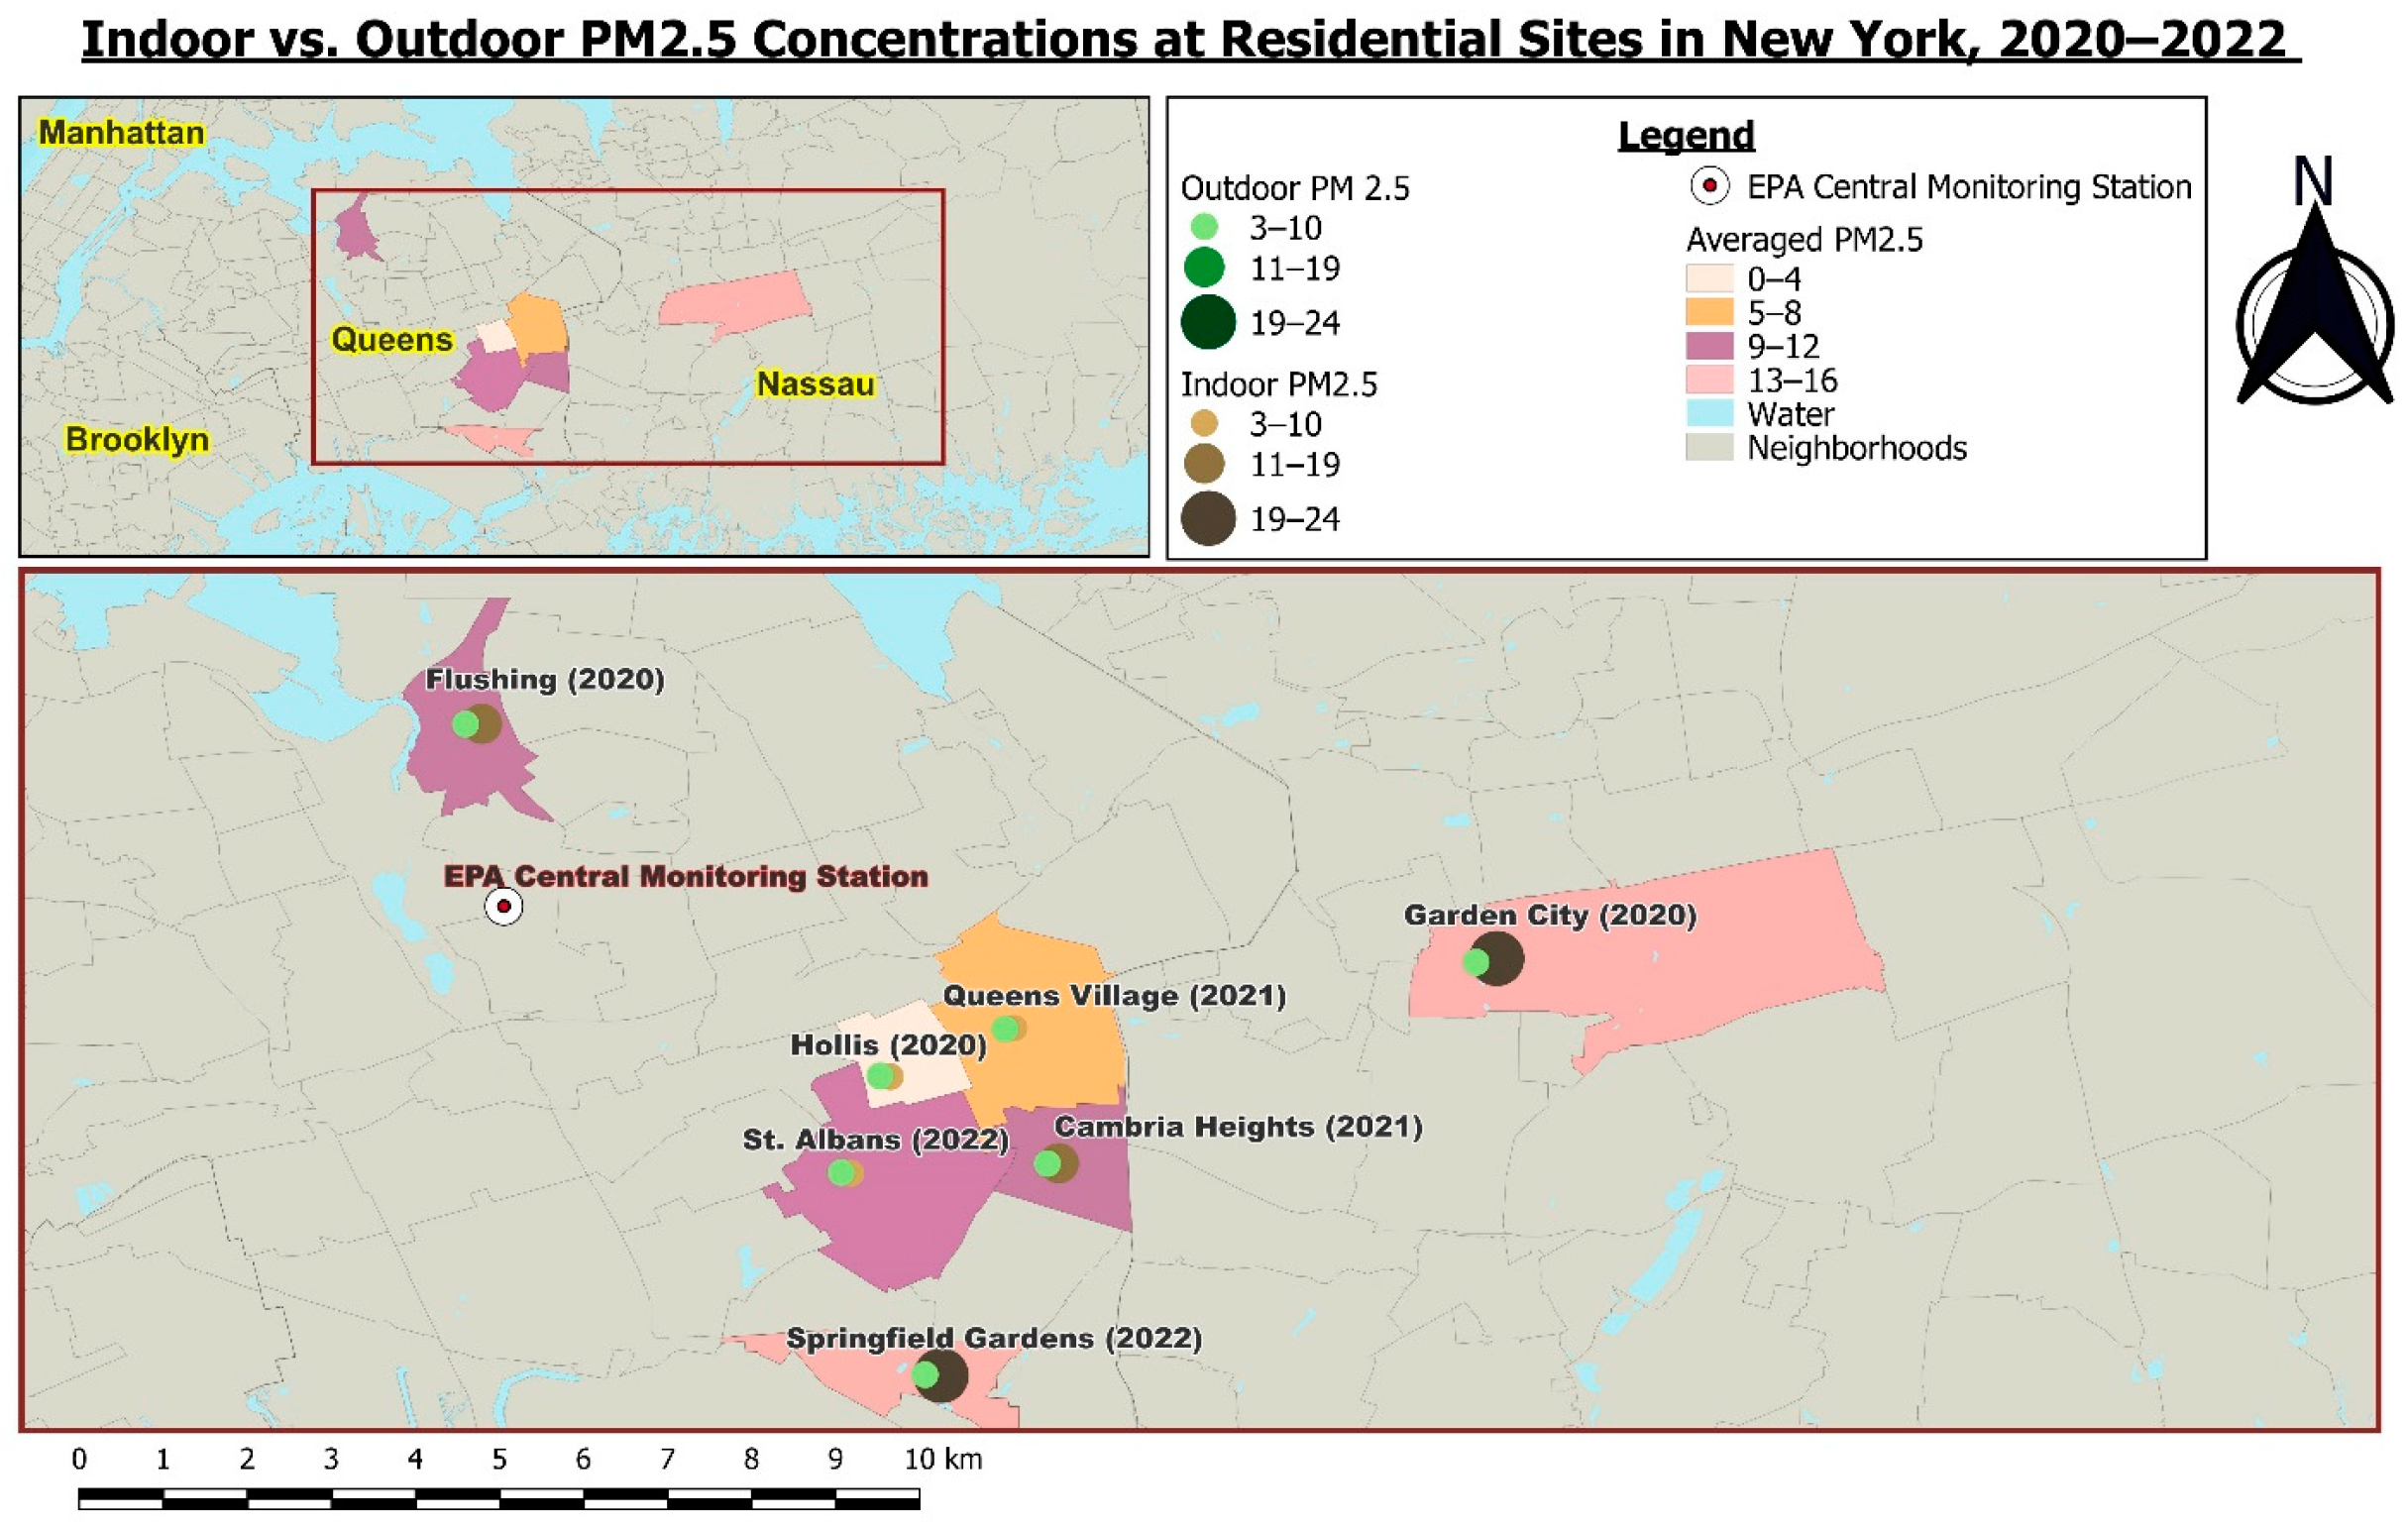
This study was conducted at seven (7) residential homes in New York (Figure 1) using two AirBeam2 concurrently: one for indoor and another for outdoor sampling at each location. “The phases of the pandemic: during and after the lockdown are arranged temporally (days and months), seasonally (winter and fall), by sampling duration and site description for both indoor and outdoor PM2.5 sampling at each home (Table 1). In New York, the government response to the COVID-19 pandemic began with a full emergency lockdown in March 2020, followed by less-stringent lockdown and reopening phases, which we have put into five phases. During the emergency lockdown or Phase I of the pandemic (March through September 2020), no measurements were taken. Therefore, Phase I is not shown on the table. PM2.5 sampling for this study commenced during Phase II of the lockdown in fall 2020 (October and November), then in phase III of the lockdown in winter 2021 (February), followed by a reopening or Phase IV in fall 2022 (September through November)”. PM2.5 samples were taken indoors and outdoors for approximately 2–6 h during and after the COVID-19 pandemic lockdown and reopening phases; however, the time spent on a daily basis in the different microenvironments indoors varied from home to home. Indoor samples were collected in the living room at Home 1 in Queens Village; the kitchen of Home 2 in Cambria Heights; the living room of Home 3 in Flushing; the living room and basement of Home 4 in Hollis; the kitchens of Home 5 in Garden City, Home 6 in Springfield Gardens, and Home 7 in St. Albans. After each sampling session, the data were downloaded, and STATA version 15 was used to perform statistical analysis. Daily concentrations of ambient PM2.5 levels in this study were compared to those obtained from the EPA regulatory/central monitoring station in Queens, NY, during the same period [21].
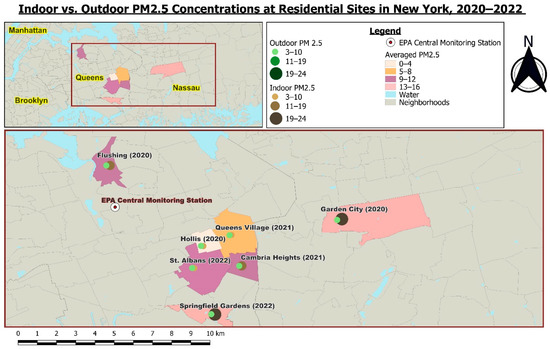
Figure 1.
Map of residential sites in New York.

Table 1.
PM2.5 sampling locations during phases of the COVID-19 lockdown, 2020–2022.
2.2. Suitability of AirBeam2 for PM2.5 Air Quality Monitoring
The AirBeam2 used in this study is a portable palm-sized device that collects PM2.5 while paired with a BLU Android cellular phone. It uses a light scattering method to measure PM1, PM2.5, and PM10, as air is drawn through a sensing chamber and light from a laser scatters particles in the airstream [22]. A record of the measurement is sent each second to the Aircasting mobile app to permit real-time visualization, and pooled data can be crowdsourced on an AirCasting air quality map. The AirBeam2 is among low-cost sensors approved by the United States Environmental Protection Agency (USEPA) [23] used to measure indoor and outdoor PM concentrations [17,24,25,26]. It provides a simple and quick way to determine spatial and temporal PM2.5 levels, informing possible actions that may be taken to reduce unacceptable levels of exposure. Therefore, data quality and performance of the air sensor can help to advance IAQ management and improve our understanding of total exposure to particle pollutants in the home environment. The device can also provide greater insights into the potential benefits and limitations of applying the sampled data to improve IAQ, including the need to monitor other pollutants besides PM and assess their impacts on human health. Future studies that include larger sample sizes would be considered for the correlation between PM levels and health risks in homes.
3. Results
3.1. Comparison of PM2.5 Levels in 2020, 2021, and 2022
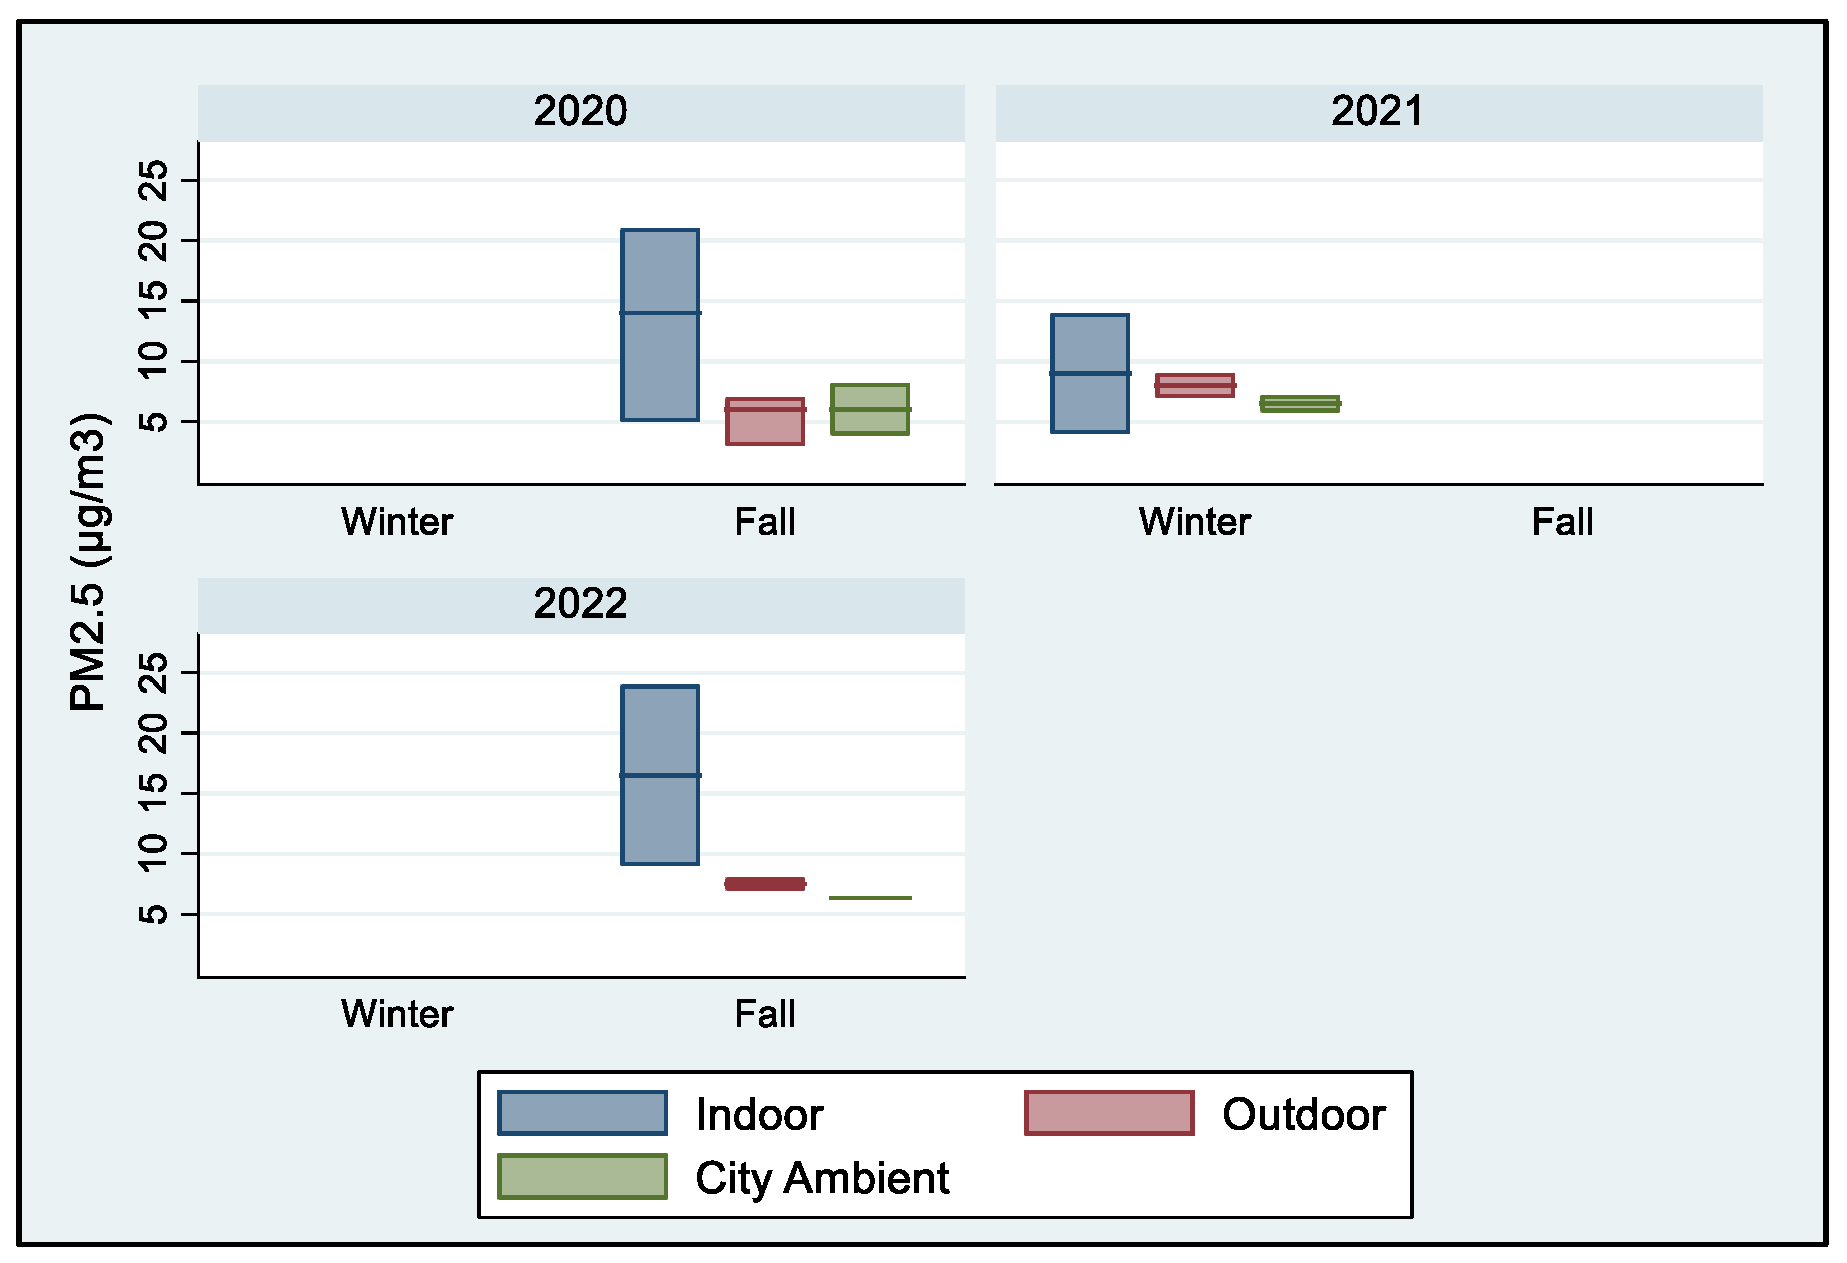
There was no significant difference in indoor, outdoor, and ambient PM2.5 measurements across the three years (fall 2020, winter 2021, fall 2022). Data for the same study periods obtained from the nearest central monitoring station were compared to the sampled outdoor PM2.5 concentrations. In 2020, 2021, and 2022, average indoor PM2.5 levels were higher than average outdoor levels at 13.33 µg/m3, 9.0 µg/m3, and 16.5 µg/m3, respectively (Table 2). The city ambient PM2.5 levels, on the other hand, were found to be the lowest over the three-year period. In 2020 and 2021, there was an increase in indoor PM2.5 levels, whereas there was a decrease in outdoor and city ambient levels of PM2.5. In 2022, indoor concentrations of PM2.5 increased, whereas the concentrations for outdoor and city ambient decreased.
Table 2.
Comparison of PM2.5 levels by year.
As shown in Figure 2, there were no significant changes in PM2.5 measurements indoors versus outdoors in the fall season and sampled outdoor PM2.5 levels in the fall versus city ambient levels were recorded at the regulatory monitoring station.
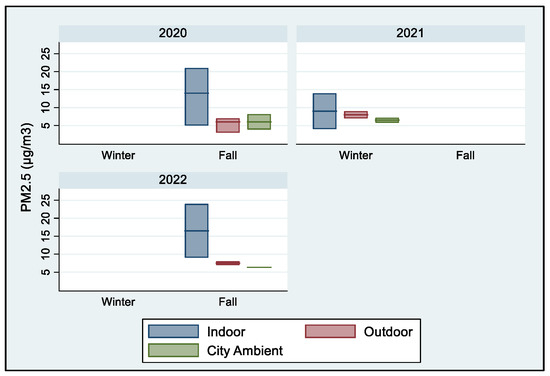
Figure 2.
Comparison of PM2.5 levels by year.
3.2. Comparison of PM2.5 Levels by Season
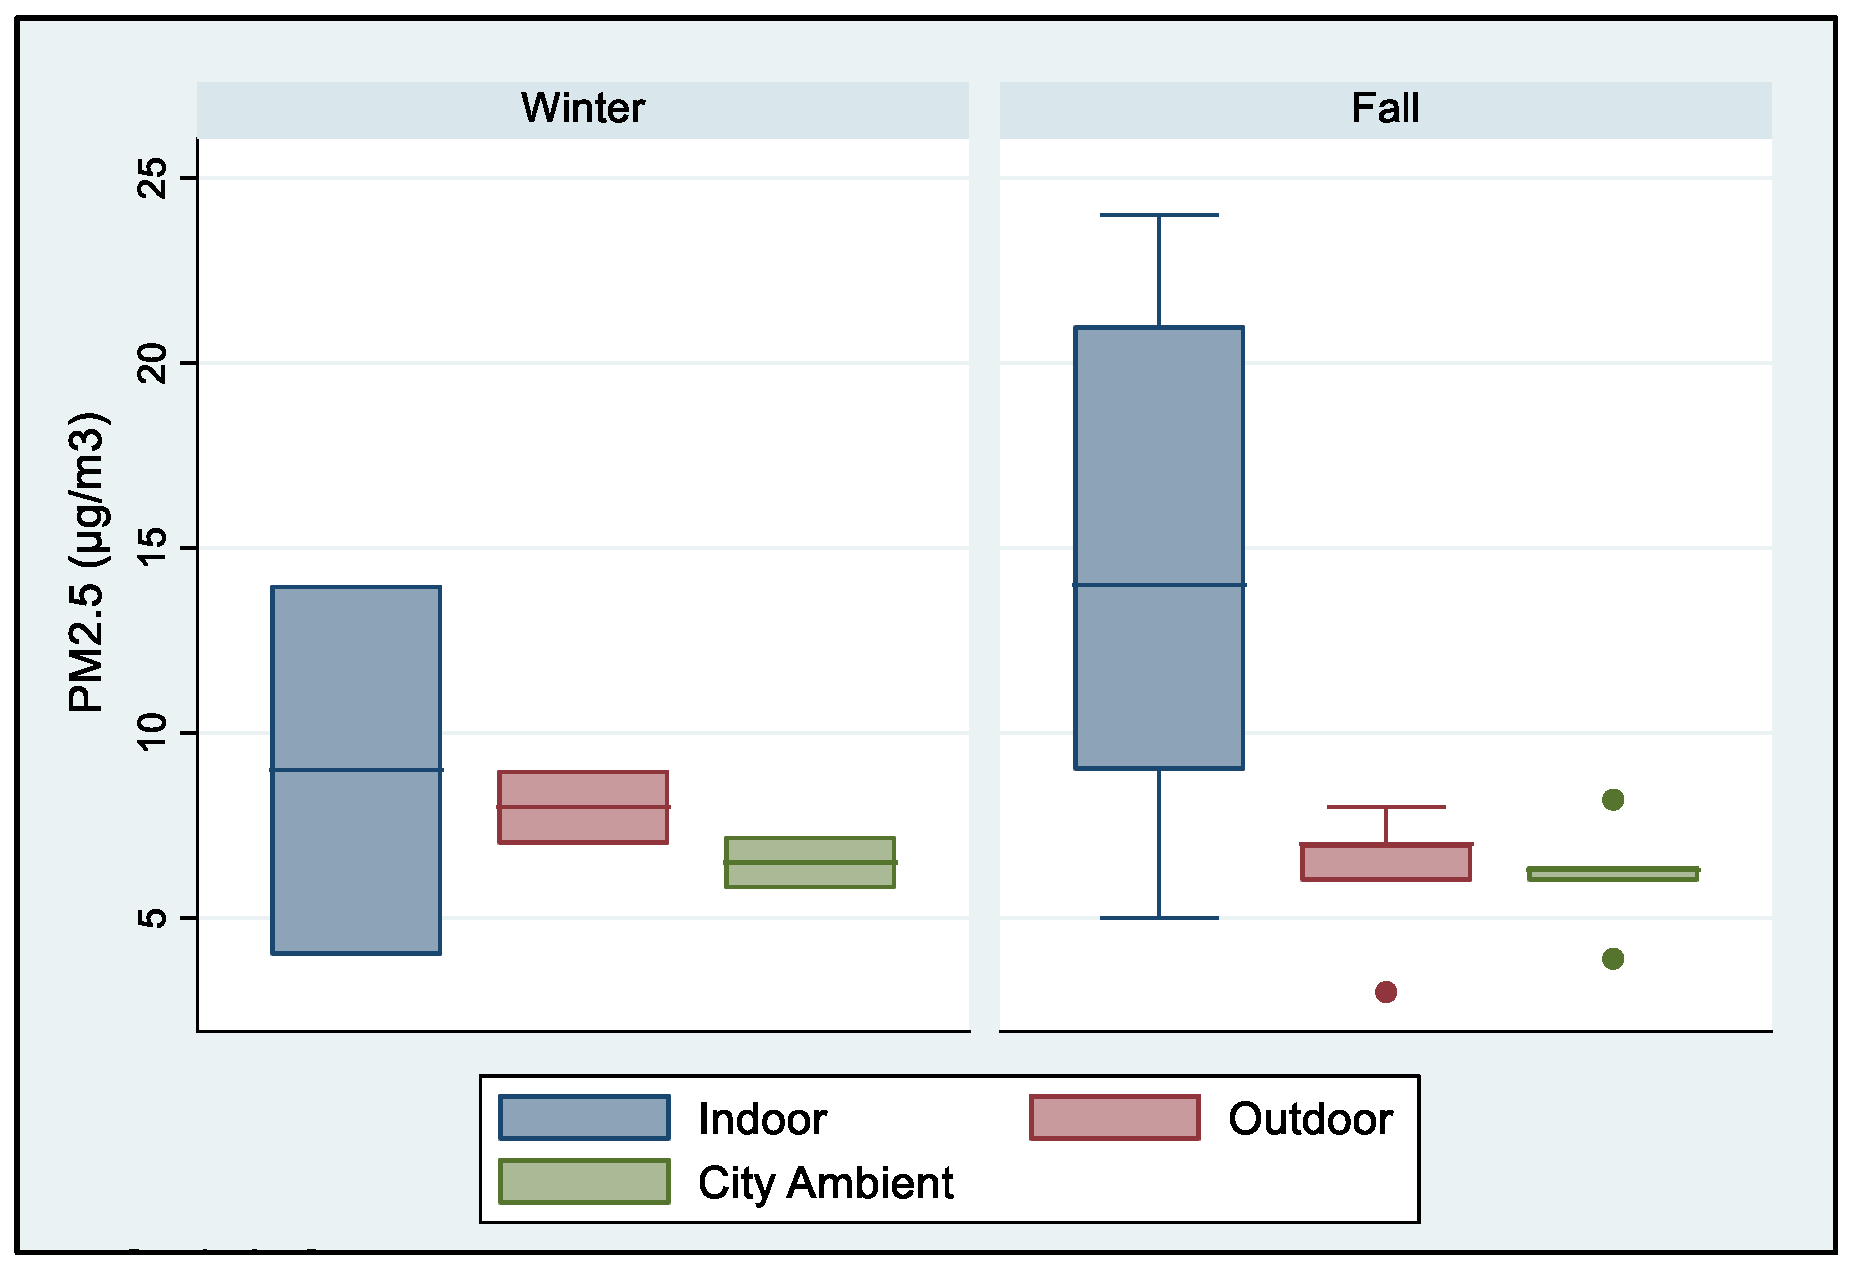
Indoor PM2.5 levels were consistently high in both winter and fall, even though they were not statistically significant (p = 0.42); indoor PM2.5 levels were higher than sampled outdoor and city ambient levels in the winter (Table 3). Additionally, indoor PM2.5 levels in the fall were higher than outdoor and city ambient levels with values of 14.6 µg/m3, 6.2 µg/m3, and 6.16 µg/m3, respectively. Overall, indoor PM2.5 levels during the fall were significantly greater than indoor winter levels (Figure 3). Indoor PM2.5 levels in the fall were also higher than the measured outdoor and city ambient levels. These results are further discussed in Section 4.3 and Section 4.4.
Table 3.
Comparison of PM2.5 levels by season.
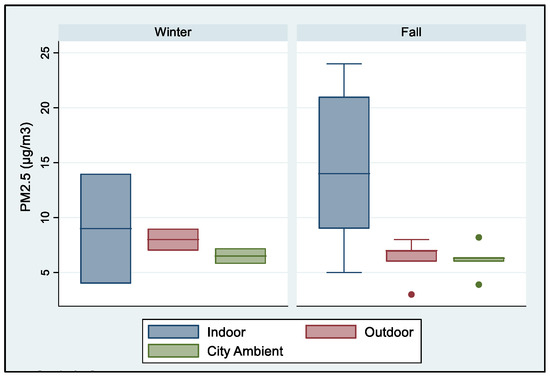
Figure 3.
Comparison of PM2.5 levels by seasons.
The mean PM2.5 levels for indoors and outdoors were the same (p = 0.03), and the sampled outdoor PM2.5 levels were comparable to the city ambient levels. Conversely, indoor PM2.5 concentrations exceeded outdoor concentrations at 90% (1 out of 7) of the homes (Table 4). Additionally, approximately 50% of the time, indoor PM2.5 concentrations exceeded 8.75 µg/m3 over the 6 h period, and 100% of outdoor levels were within the safety levels (35 µg/m3). The average indoor PM2.5 level for Home 1 was 4 µg/m3, and sampling was conducted in the living room in February 2021 for four weeks (27 days). Higher PM2.5 levels were recorded at Homes 2 and 3, averaging 14 µg/m3. At Home 2, samples were measured in the kitchen in February 2021 for two weeks (14 days) while at Home 3, samples were measured for one week (7 days) in the living room in October 2020. At Home 4, the average PM2.5 indoor level was 5 µg/m3, and the samples were collected in the basement at the end of October 2020 to November 2020 for one week (7 days).
Table 4.
Seasonal comparison between indoor and outdoor PM2.5 levels.
The average indoor PM2.5 level for Homes 5 and 6 was 21 µg/m3 and 24 µg/m3, respectively, and samples were collected in the kitchen at both homes. PM2.5 was measured for one week (7 days) at Home 5 in November 2020, and at Home 6, samples were collected for almost two weeks (12 days) from late September 2022 to early November 2022. Finally, the average PM2.5 level at Home 7 was 9 µg/m3, and samples were collected in the kitchen for almost three weeks (18 days) in late October 2022 and early November 2022. The outdoor PM2.5 levels for Home 1, Home 3, and Home 6 were 7 µg/m3, respectively. Home 4 had the lowest PM2.5 levels, while Home 2 had the highest level of 9 µg/m3. Overall, the data obtained showed that outdoor PM2.5 concentrations were 1.8 times greater in the winter than in the fall.
4. Discussion
4.1. Temporal Variations of Indoor PM2.5 Levels
In this study, higher indoor PM2.5 levels both during and after the COVID-19 lockdown suggested a combination of emissions from indoor activities and outside sources [27,28]. Indoor PM2.5 levels were mostly influenced by human activity and smoke [29]; especially from cooking, as meal preparation by frying, toasting, and boiling may release PM2.5 with various compositions, including saturated and unsaturated fatty acids [18,30]. Extended exposure times in confined spaces of residential homes substantially affect air quality because they often lack proper ventilation; hence, PM2.5 levels tend to be higher than outdoor levels [31]. Fuel oil and natural gas were used in most residential homes in this study, and only a few stoves were furnished with vents to extract fumes while cooking during sampling, potentially increasing PM2.5 levels [17]. Indoor gas stove use for cooking is associated with an increased risk of asthma among children and is prevalent in 35% of households in the US. Pollutants released by combustion in homes with range hoods may not vent outdoors or be removed effectively [32]. Source reduction and control is the most effective solution to indoor air pollution, although ventilation, supplemental filtration, and air cleaning can help to remove PM2.5 and other pollutants.
4.2. Temporal Variations of Outdoor PM2.5
Previous studies have reported greater variability in ambient PM levels than indoor levels due to local meteorological conditions, road traffic, power generation plants, industries, etcetera [33]. Restrictions in human activities and the consequent dramatic decrease in ambient air pollution occurred during the COVID-19 lockdown, as most people stayed at home at the onset of the pandemic [34]. The lowest ambient PM2.5 levels were measured in 2020 but increased in 2021 and 2022, and city ambient measurements from the central monitoring station in NYC also reflected a slight increase (Table 1). Similarly, ground-based observations of PM2.5 and other air pollutants showed reductions in metropolitan cities in South and East Asia, Europe, and North America during the COVID-19 lockdown, which accounted for 67% of anthropogenic emissions and 5% from the transportation sector [35]. Higher ambient PM2.5 levels were only recorded at one sampling site facing a street with moderate vehicular traffic. Similarly, a study conducted at 39 schools in Barcelona, Spain, reported that school playgrounds in close proximity to road traffic exhibited higher levels of PM2.5 than other areas [22]. In Po Valley, Italy, poor air quality pre-lockdown was a result of a large population, industrial activities, geographical factors, and weather conditions. But, although most anthropogenic activities halted during the lockdown, there was no significant decrease in PM during the lockdown compared to 2019 [11]. This suggested that meteorological factors could have a greater influence on PM levels than emissions from traffic [11].
4.3. Seasonal Variations of Indoor PM2.5
PM2.5 was measured up to 6 h and was higher than ambient levels, and the standard of 35 µg/m3 for a 24 h period could be exceeded if similar conditions persist within 24 h periods; adverse health effects known to occur with such exposure might be expected (Table 2). During the winter and fall seasons, people typically keep their windows and doors closed to conserve energy; however, this could result in less air circulation, gas exchange, and increased indoor PM2.5 levels. During the winter, particles are usually resuspended in the air from daily indoor activities because of poor ventilation but reduce in the summer season when air exchange rates are higher, as people open their windows and doors [36]. A major contributing factor to higher PM2.5 levels could be cooking. Marc et al. (2018) observed that food preparation in the kitchen could create a specific micro-climate because of high temperatures and humidity [18]. Previous studies have reported a negative correlation between atmospheric temperature and PM concentrations [37]. Relative humidity could lead to the deposition of larger particles as they become moisture laden [38] and smaller particles remain suspended in indoor air for longer periods. With no meteorological influence indoors to disperse particles, PM2.5 increased; however, there is no national standard for indoor air quality to which the measurements could appropriately be compared.
4.4. Seasonal Variations of Outdoor PM2.5
The samples obtained in this study showed that outdoor PM2.5 levels were 1.8 times greater in the winter than in the fall, as seen in Table 2. Previous studies have shown that during the winter season, anthropogenic emissions can influence outdoor PM2.5 levels via multiple sources and processes, including the increased use of passenger vehicles and meteorological effects [39]. Seasonal variations affect outdoor air quality when combined with factors such as fossil fuel combustion for the heating of buildings and automobile operation, which contribute to higher PM2.5 during the winter season [40]. The phenomenon of temperature inversion can also affect densely populated industrialized areas and prevent the dispersion of pollutants in cold weather and cloudless skies, thus increasing the concentration of pollutants in countries such as China, with health implications from PM2.5 pollution in the winter [41]. Jiang et al. (2022) observed two air pollution episodes, one mainly affected by air masses in which increased levels of water-soluble ions led to increased PM2.5 [42].
4.5. Health Implications of Higher Indoor PM2.5 Levels during COVID-19
Before the COVID-19 pandemic, ambient PM2.5 levels were much higher during the same months that the COVID-19 lockdown occurred [8]; however, being indoors during the COVID-19 pandemic lockdown seemed not to reduce exposure to PM2.5. In other words, levels of indoor PM2.5 from fall 2020 to fall 2022 may have increased rather than reduced exposure to PM2.5. Previous studies have shown that inhalation of particle pollution was related to the prevalence of mortality due to COVID-19 [43]. Many pre-existing conditions that increased the morbidity of COVID-19 were the same as those that affected individuals due to long-term exposure to air pollution. Wu et al. (2020) found that 1 µg/m3 of PM2.5 was linked to 15% of COVID-19 deaths with a magnitude that was 20 times greater than what was observed for PM2.5 and other mortalities [14]. Biological particles that can suspend in the air have the ability to attach themselves usually lead to coarser PM; however, they can also attach to PM2.5, allowing them to directly transport into the respirable regions, causing serious respiratory and circulation illnesses [44,45]. Further, PM2.5 can upregulate the ACE-2 receptor of the SARS-CoV-2 virus, increasing the chance of the viral RNA entering the lungs and potentiating the risk of COVID-19 symptoms [46]. Although there is no robust evidence that short-term PM2.5 exposure could increase the chance of dying from COVID-19, the risk increases with long-term exposure [45]. Additionally, the use of ethanol-based and other disinfectants increased during the COVID-19 pandemic to eliminate SARS-CoV-2 on surfaces, and indoor spaces could have changed the chemical composition of the air and increased PM concentrations after initial use [30]. A pilot study utilized the Foobot®, a low-cost consumer air monitor, to assess air quality in offices and households in South Texas before the COVID-19 pandemic (May–July 2019) and during the pandemic (June–September 2020) while employees worked from home. PM2.5, air temperature, and relative humidity were collected at 5 min intervals to assess the health outcomes of participants before and during the COVID-19 pandemic. The study found that for all participants, PM2.5 levels in households were significantly higher than those measured in offices (p < 0.05), and the PM2.5 levels in all households also exceeded the health-based annual mean standard of 12 µg/m3. Conversely, 90% of the offices studied were in compliance with the health standard [7]. This finding suggests that there could be a higher health risk for residents in their homes than at their places of work.
5. Conclusions
This study provided insights into the potential increased risk of PM2.5 exposure in micro-environments and micro-climates of residential homes in urban environments. We found that sampled PM2.5 levels indoors exceeded outdoor levels at most private homes, potentially due to insufficient ventilation, cooking, smoke, and the absence of meteorological influence. Sampled PM2.5 levels outdoors were comparable to city ambient PM2.5 levels and were below the acceptable ambient standard, unlike indoor PM2.5 levels. The link between PM2.5 and COVID-19 in previous studies suggests that high indoor PM2.5 in this study could potentially have posed greater respiratory health effects on residents than ambient PM2.5 concentrations. Although there are currently no widely accepted performance criteria used to standardize how measurements are made by low-cost air pollutant monitors or what threshold limits should be used to determine health effects indoors, this study may initiate an alert to such cues. The findings in this study are valuable in the absence of widely accepted indoor PM2.5 health-based standards or thresholds for comparison. To ensure that indoor environments are safe and healthy in the meantime; however, air purifiers with filtration technologies, particularly high-efficiency particulate air (HEPA) filters and systems based on the principle of electrostatic precipitation, are two of the most common indoor air purification technologies that can reduce PM2.5 concentrations indoors. Additionally, natural ventilation with open windows is a common and economical approach that can help to dilute indoor PM. Future studies should consider establishing a network of two or more monitors to compare pollutant levels in different spaces and at different times: before, during, and after activities such as cooking. Additionally, stricter limits than the current national ambient air quality standards should be considered for indoor environments; larger sample sets would better assess seasonal variations of PM2.5, and the health status of residents should be surveyed to explain the potential health impacts of indoor PM2.5 exposure.
Author Contributions
Investigation, literature review, methodology, writing—original draft preparation, and editing to completion, J.H.; conceptualization, writing—original draft preparation, methodology, review, and editing to completion, D.R.-S.; literature review, writing, GIS mapping and visualization, methodology, and formatting, J.J.; methodology, formal analysis, validation, and review, A.A.; writing, literature review, methodology, review, and editing, K.J. All authors have read and agreed to the published version of the manuscript.
Funding
This research received no external funding.
Institutional Review Board Statement
This study neither involved human subjects nor required identifiable information to be used, studied, analyzed, or generated.
Informed Consent Statement
Not applicable.
Data Availability Statement
All data discussed in this study are contained within the article.
Acknowledgments
We thank the Environmental Health Science (EHS) students who assisted with data collection, including data for the EHS 351: Fundamentals of Air Pollution course project.
Conflicts of Interest
The authors declare no conflict of interest.
References
- Caiazzo, F.; Ashok, A.; Waitz, I.A.; Dong, G.H.; Barrett, S.F. Air pollution and early deaths in the United States. Part I: Quantifying the impact of major sectors in 2005. Atmos. Environ. 2013, 79, 198–208. [Google Scholar] [CrossRef]
- NIEHS. Air Pollution. National Institute of Environmental Health Science. 2018. Available online: https://www.niehs.nih.gov/health/topics/agents/air-pollution/index.cfm (accessed on 14 March 2023).
- Manisalidis, I.; Stavropoulou, E.; Stavropoulos, A.; Bezirtzoglou, E. Environmental and Health Impacts of Air Pollution: A Review. Front. Public Health 2020, 8, 14. [Google Scholar] [CrossRef] [PubMed]
- US EPA. Particulate Matter (PM). US EPA. 2022. Available online: https://www.epa.gov/pm-pollution/particulate-matter-pm-basics (accessed on 13 February 2023).
- Jones, E.; Laurent, J.G.C.; Young, A.S.; MacNaughton, P.; Coull, B.A.; Spengler, J.D.; Allen, J.G. The effects of ventilation and filtration on indoor PM2.5 in office buildings in four countries. Build. Environ. 2021, 200, 107975. [Google Scholar] [CrossRef] [PubMed]
- Sohrabi, C.; Alsafi, Z.; O’Neill, N.; Khan, M.; Kerwan, A.; Al-Jabir, A.; Iosifidis, C.; Agha, R. World Health Organization declares global emergency: A review of the 2019 novel coronavirus (COVID-19). Int. J. Surg. 2020, 76, 71–76. [Google Scholar] [CrossRef] [PubMed]
- Roh, T.; Moreno-Rangel, A.; Baek, J.; Obeng, A.B.; Hasan, N.T.; Carrillo, G. Indoor Air Quality and Health Outcomes in Employees Working from Home during the COVID-19 Pandemic: A Pilot Study. Atmosphere 2021, 12, 1665. [Google Scholar] [CrossRef]
- Ferreira, A.; Barros, N. COVID-19 and Lockdown: The Potential Impact of Residential Indoor Air Quality on the Health of Teleworkers. Int. J. Environ. Res. Public Health 2022, 19, 6079. [Google Scholar] [CrossRef]
- Indoor Air Quality. US EPA. 2021. Available online: https://www.epa.gov/report-environment/indoor-air-quality (accessed on 6 December 2022).
- Domínguez-Amarillo, S.; Fernández-Agüera, J.; García, S.C.; González-Lezcano, R.A. Bad Air Can Also Kill: Residential Indoor Air Quality and Pollutant Exposure Risk during the COVID-19 Crisis. Int. J. Environ. Res. Public Health 2020, 17, 7183. [Google Scholar] [CrossRef]
- Pala, D.; Casella, V.; Larizza, C.; Malovini, A.; Bellazzi, R. Impact of COVID-19 lockdown on PM concentrations in an Italian Northern City: A year-by-year assessment. PLoS ONE 2022, 17, e0263265. [Google Scholar] [CrossRef]
- Kyung, S.Y.; Kim, H.S. Particulate-Matter Related Respiratory Diseases. Tuberc. Respir. Dis. 2020, 83, 116. [Google Scholar] [CrossRef]
- Roberts-Semple, D.; Gao, Y. Evaluation of air pollution, local meteorology and urban public health. Int. J. Environ. Technol. Manag. 2013, 16, 160. [Google Scholar] [CrossRef]
- Wu, X.; Nethery, R.C.; Sabath, M.B.; Braun, D.; Dominici, F. Exposure to air pollution and COVID-19 mortality in the United States: A nationwide cross-sectional study. medRxiv 2020. [Google Scholar] [CrossRef]
- Akteruzzaman, M.; Rahman, M.A.; Rabbi, F.M.; Asharof, S.; Rofi, M.M.; Hasan, M.K.; Islam, M.A.M.; Khan, M.A.R.; Rahman, M.M.; Rahaman, M.H. The impacts of cooking and indoor air quality assessment in the southwestern region of Bangladesh. Heliyon 2023, 9, e12852. [Google Scholar] [CrossRef]
- World Health Organization: WHO. Household Air Pollution. 28 November 2022. Available online: https://www.who.int/news-room/fact-sheets/detail/household-air-pollution-and-health (accessed on 11 January 2023).
- Bergmans, B.; Cattaneo, A.; Duarte, R.M.B.O.; Gomes, J.F.; Saraga, D.; Ródenas García, M.; Querol, X.; Liotta, L.F.; Safell, J.; Spinazzé, A.; et al. Particulate matter indoors: A strategy to sample and monitor size-selective fractions. Appl. Spectrosc. Rev. 2022, 57, 675–704. [Google Scholar] [CrossRef]
- Marć, M.; Śmiełowska, M.; Namieśnik, J.; Zabiegała, B. Indoor air quality of everyday use spaces dedicated to specific purposes—A review. Environ. Sci. Pollut. Res. 2018, 25, 2065–2082. [Google Scholar] [CrossRef] [PubMed]
- Hao, J.; Li, X.; Zhao, Y.P. Indoor Air Pollution and Its Control in China. In Indoor Air Pollution; Springer: Berlin/Heidelberg, Germany, 2014; pp. 145–170. [Google Scholar] [CrossRef]
- Mansor, A.A.; Hisham, A.N.B.; Abdullah, S.; Napi, N.N.L.M.; Ahmed, A.; Ismail, M. Indoor-Outdoor Air Quality Assessment in Nurseries. IOP Conf. Ser. Earth Environ. Sci. 2020, 616, 012001. [Google Scholar] [CrossRef]
- Us Epa, O. Download Daily Data. 2016. Available online: https://www.epa.gov/outdoor-air-quality-data/download-daily-data (accessed on 17 April 2023).
- HabitatMap. Available online: https://www.habitatmap.org/airbeam/how-it-works (accessed on 24 May 2023).
- Ryder, O.; Minor, H.; Brown, S.; Duvall, R.; Clements, A.; Freed, R. AirBeam2 Quick Start Guide. Los Angeles Public Library Air Sensor Loan Program, Funded by U.S. EPA. 2020. Available online: https://cfpub.epa.gov/si/si_public_record_report.cfm?Lab=CEMM&dirEntryId=350603 (accessed on 9 March 2023).
- Gao, S.S.; Hilts, R.W.; Ross, M.K.; Styler, S.A. Particulate matters: Student-led air quality research in the third-year environmental chemistry classroom and the field. Anal. Bioanal. Chem. 2018, 410, 3223–3229. [Google Scholar] [CrossRef]
- Kortoçi, P.; Motlagh, N.H.; Zaidan, M.A.; Fung, P.L.; Varjonen, S.; Rebeiro-Hargrave, A.; Niemi, J.V.; Nurmi, P.; Hussein, T.; Petäjä, T.; et al. Air pollution exposure monitoring using portable low-cost air quality sensors. Smart Health 2022, 23, 100241. [Google Scholar] [CrossRef]
- Hegde, S.; Min, K.T.; Moore, J.E.; Lundrigan, P.; Patwari, N.; Collingwood, S.; Balch, A.; Kelly, K.E. Indoor Household Particulate Matter Measurements Using a Network of Low-cost Sensors. Aerosol Air Qual. Res. 2020, 20, 381–394. [Google Scholar] [CrossRef]
- Weschler, C.J. Changes in indoor pollutants since the 1950s. Atmos. Environ. 2009, 43, 153–169. [Google Scholar] [CrossRef]
- Kaunelienė, V.; Prasauskas, T.; Krugly, E.; Stasiulaitienė, I.; Čiužas, D.; Šeduikytė, L.; Martuzevičius, D. Indoor air quality in low energy residential buildings in Lithuania. Build. Environ. 2016, 108, 63–72. [Google Scholar] [CrossRef]
- Xu, R.; Qi, X.; Dai, G.; Lin, H.; Zhai, P.; Zhu, C.; Wang, L.; Ding, A. A Comparison Study of Indoor and Outdoor Air Quality in Nanjing, China. Aerosol Air Qual. Res. 2020, 20, 2128–2141. [Google Scholar] [CrossRef]
- Jiang, J.; Ding, X.; Isaacson, K.P.; Tasoglou, A.; Huber, H.; Shah, A.D.; Jung, N.; Boor, B.E. Ethanol-based disinfectant sprays drive rapid changes in the chemical composition of indoor air in residential buildings. J. Hazard. Mater. Lett. 2021, 2, 100042. [Google Scholar] [CrossRef]
- Cao, Z.; Wang, Y.; Wang, M. A comparison of concentrated contaminant removal in enclosure by using mixing ventilation and vortex ventilation. In Proceedings of the International Conference on Building Energy & Environment, Melbourne, Australia, 5–9 February 2018; pp. 139–143. [Google Scholar]
- Gruenwald, T.; Seals, B.A.; Knibbs, L.D.; Hosgood, H.D. Population Attributable Fraction of Gas Stoves and Childhood Asthma in the United States. Int. J. Environ. Res. Public Health 2022, 20, 75. [Google Scholar] [CrossRef] [PubMed]
- Bo, M.; Salizzoni, P.; Clerico, M.; Buccolieri, R. Assessment of Indoor-Outdoor Particulate Matter Air Pollution: A Review. Atmosphere 2017, 8, 136. [Google Scholar] [CrossRef]
- Li, J.; Tartarini, F. Changes in Air Quality during the COVID-19 Lockdown in Singapore and Associations with Human Mobility Trends. Aerosol Air Qual. Res. 2020, 20, 1748–1758. [Google Scholar] [CrossRef]
- Zhang, Z.; Arshad, A.; Zhang, C.; Hussain, S.; Li, W. Unprecedented Temporary Reduction in Global Air Pollution Associated with COVID-19 Forced Confinement: A Continental and City Scale Analysis. Remote Sens. 2020, 12, 2420. [Google Scholar] [CrossRef]
- Massey, D.B.; Kulshrestha, A.; Masih, J.; Taneja, A. Seasonal trends of PM10, PM5.0, PM2.5 & PM1.0 in indoor and outdoor environments of residential homes located in North-Central India. Build. Environ. 2012, 47, 223–231. [Google Scholar] [CrossRef]
- Li, H.; Guo, B.; Han, M.; Tian, M.; Zhang, J. Particulate matters pollution characteristic and the correlation between PM (PM 2.5, PM 10) and meteorological factors during the summer in Shijiazhuang. J. Environ. Prot. 2015, 6, 457. [Google Scholar] [CrossRef]
- Hernandez, G. Temperature and Humidity Effects on Particulate Matter Concentrations in a Sub-Tropical Climate during Winter. 2017. Available online: https://www.semanticscholar.org/paper/Temperature-and-humidity-effects-on-particulate-in-Hernandez-Berry/e2d8748fa838f69fa8554ea6f3e0fcc3fbd13c9b (accessed on 22 February 2023).
- Li, L.; Li, Q.X.; Huang, L.; Wang, Q.; Zhu, A.; Xu, J.; Liu, Z.; Li, H.; Shi, L.; Li, R.; et al. Air quality changes during the COVID-19 lockdown over the Yangtze River Delta Region: An insight into the impact of human activity pattern changes on air pollution variation. Sci. Total Environ. 2020, 732, 139282. [Google Scholar] [CrossRef]
- Clements, N.; Keady, P.; Emerson, J.; Fierer, N.; Miller, S. Seasonal variability of airborne particulate matter and bacterial concentrations in Colorado homes. Atmosphere 2018, 9, 133. [Google Scholar] [CrossRef]
- Sarmadi, M.; Rahimi, S.; Rezaei, M.; Sanaei, D.; Dianatinasab, M. Air quality index variation before and after the onset of COVID-19 pandemic: A comprehensive study on 87 capital, industrial and polluted cities of the world. Environ. Sci. Eur. 2021, 33, 134. [Google Scholar] [CrossRef] [PubMed]
- Jiang, S.; Kong, S.; Zheng, H.; Zeng, X.; Chen, N.; Qi, S. Real-time Source Apportionment of PM2.5 and Potential Geographic Origins of Each Source During Winter in Wuhan. Huan Jing Ke Xue=Huanjing Kexue 2022, 43, 61–73. [Google Scholar] [CrossRef] [PubMed]
- Comunian, S.O.; Dongo, D.; Milani, C.; Palestini, P. Air Pollution and COVID-19: The Role of Particulate Matter in the Spread and Increase of COVID-19’s Morbidity and Mortality. Int. J. Environ. Res. Public Health 2020, 17, 4487. [Google Scholar] [CrossRef] [PubMed]
- Sharma, A.K.; Balyan, P. Air pollution and COVID-19: Is the connect worth its weight? Indian J. Public Health 2020, 64, 132–134. [Google Scholar] [CrossRef] [PubMed]
- Shao, L.; Wang, Y.; Jones, T.; Santosh, M.; Silva, L.F.; Ge, S.; da Boit, K.; Feng, X.; Zhang, M.; BéruBé, K. COVID-19 mortality and exposure to airborne PM2.5: A lag time correlation. Sci. Total Environ. 2022, 806, 151286. [Google Scholar] [CrossRef]
- Tung, N.H.; Cheng, P.W.; Chi, K.H.; Hsiao, T.C.; Jones, T.; BéruBé, K.; Ho, K.F.; Chuang, H.C. Particulate matter and SARS-CoV-2: A possible model of COVID-19 transmission. Sci. Total Environ. 2021, 750, 141532. [Google Scholar] [CrossRef]
Disclaimer/Publisher’s Note: The statements, opinions and data contained in all publications are solely those of the individual author(s) and contributor(s) and not of MDPI and/or the editor(s). MDPI and/or the editor(s) disclaim responsibility for any injury to people or property resulting from any ideas, methods, instructions or products referred to in the content. |
© 2023 by the authors. Licensee MDPI, Basel, Switzerland. This article is an open access article distributed under the terms and conditions of the Creative Commons Attribution (CC BY) license (https://creativecommons.org/licenses/by/4.0/).