

Multiple Enrollment Policy: Clustering Dropout and Graduation Constellations in Psychology and Sociology Bachelor’s Programs


Abstract
:1. Introduction
1.1. The Austrian University System
1.2. Study Duration and Student Workload
1.3. Psychology and Sociology Studies
1.4. Aims and Expectations
2. Materials and Methods
2.1. Data Background and Sample Characteristics
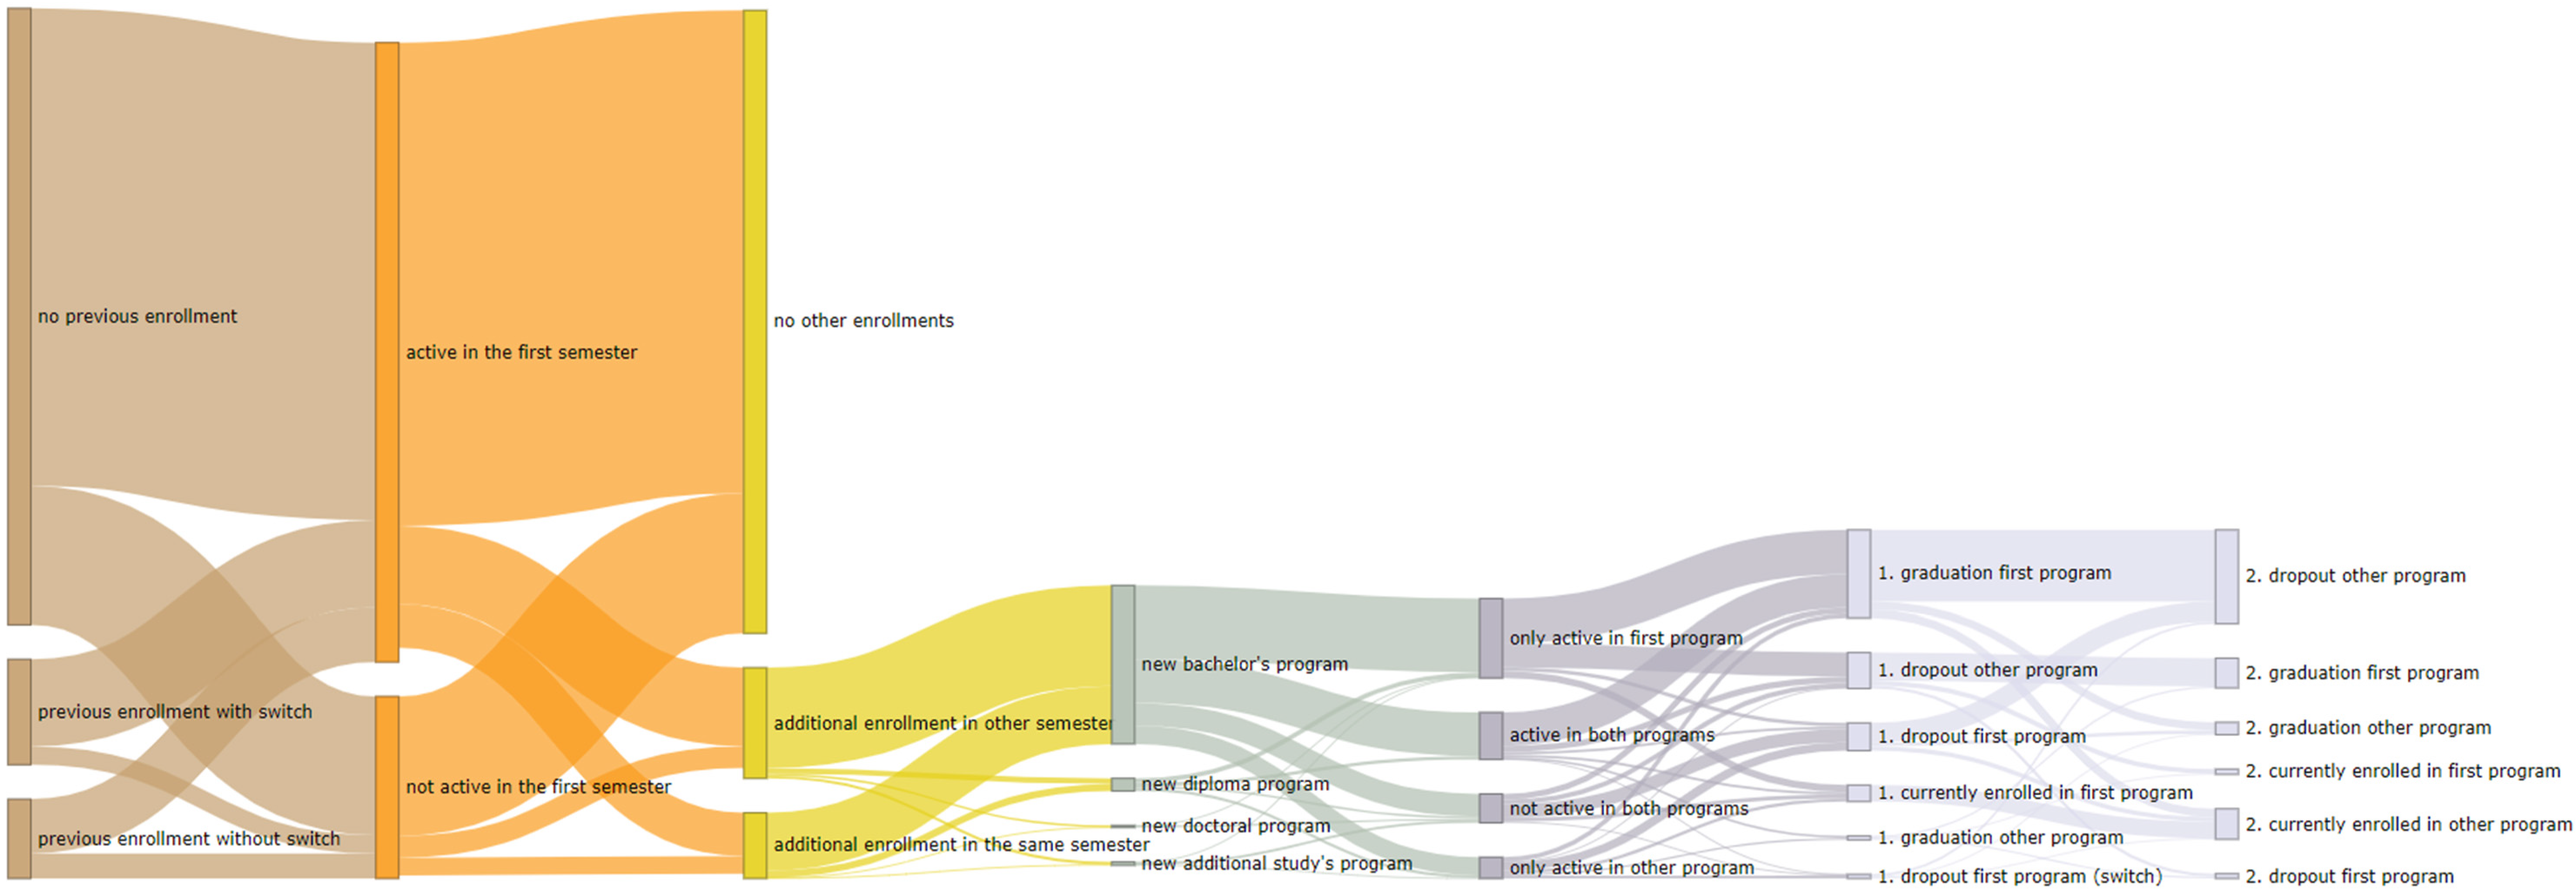
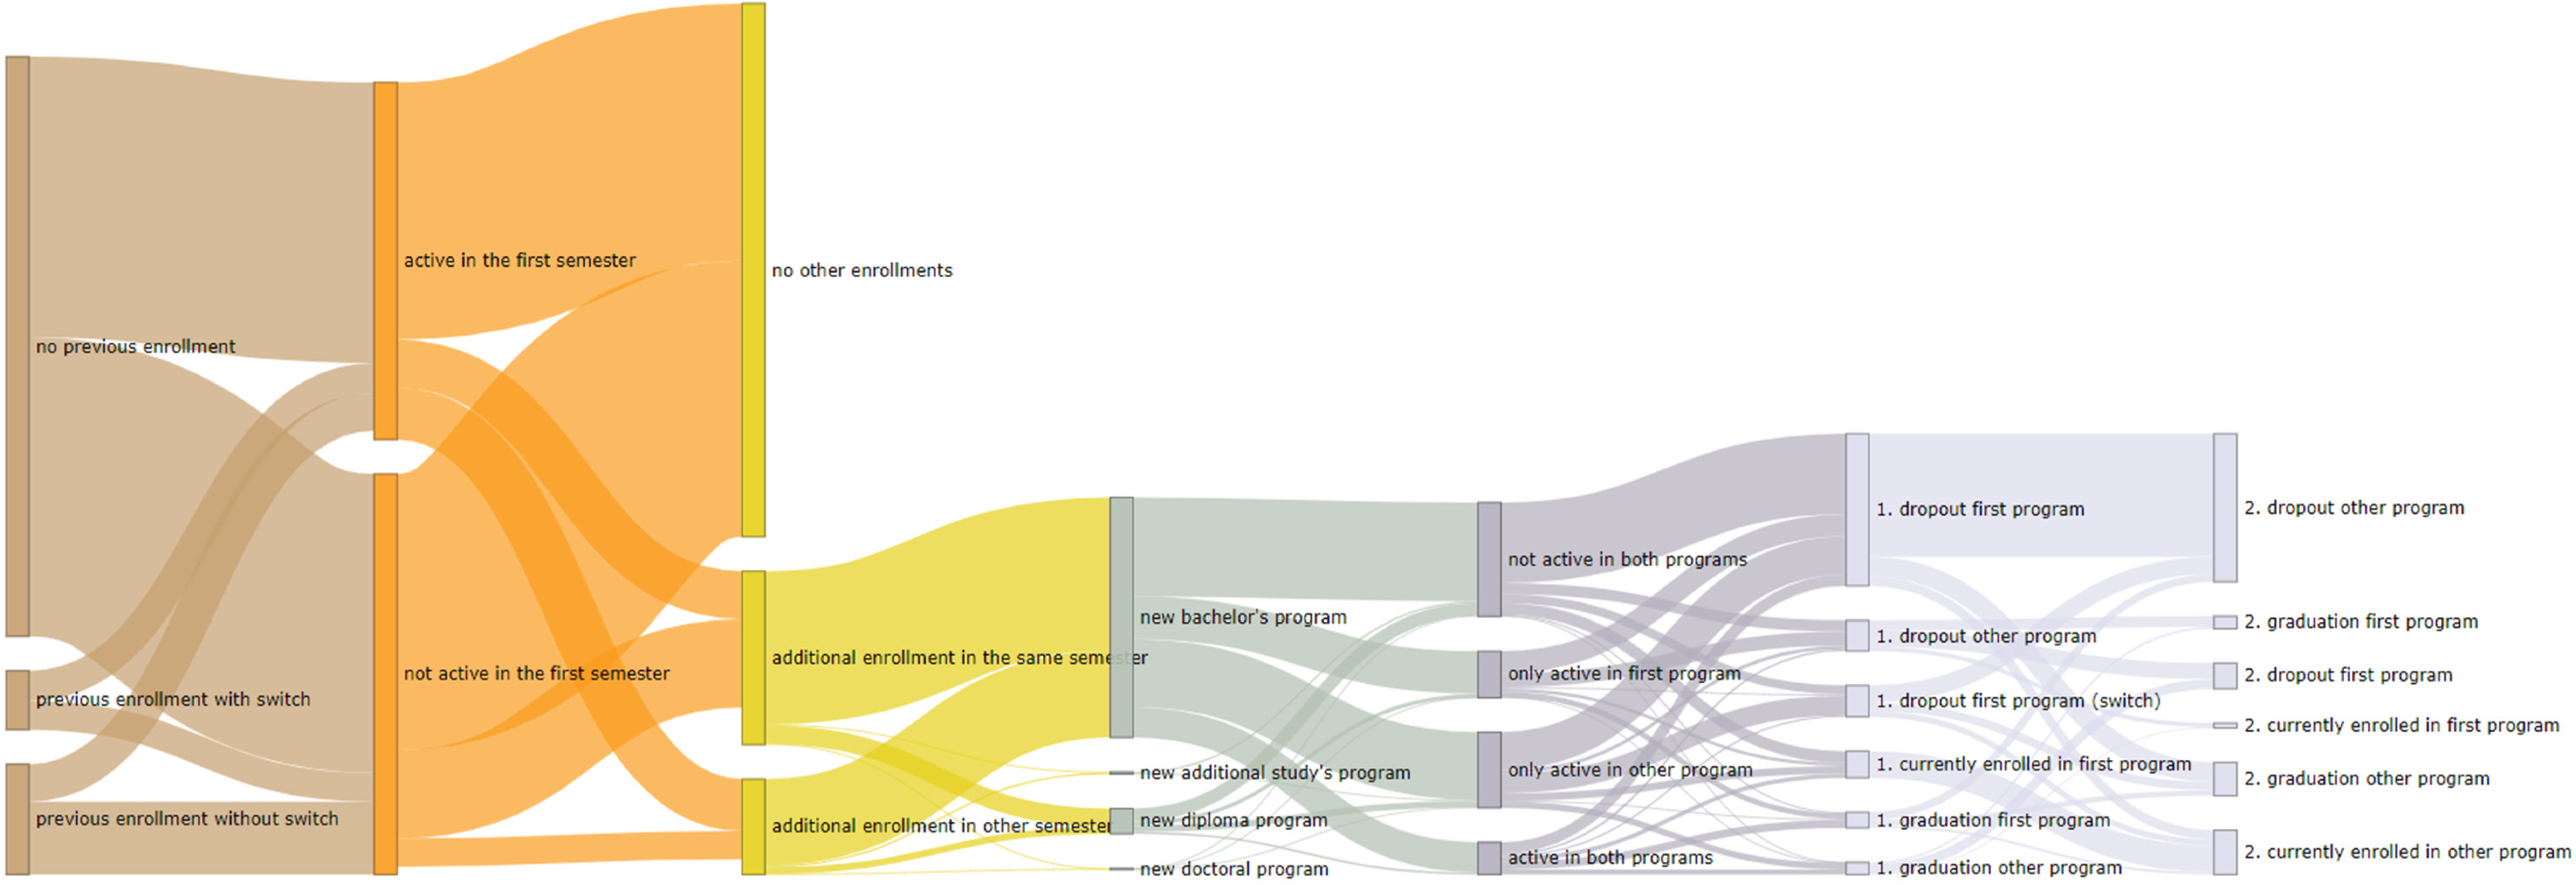
2.2. Psychology and Sociology Student Flows

2.3. Variables
2.4. Apparatus
2.5. Statistical Analyses, Algorithms and Settings
- kmeans: algorithm = “Hartigan–Wong”, nstart = 25, maximum iterations = 1000.
- pam: metric = “euclidean”.
- clara: metric = “euclidean”, number of samples = 25.
- hclust: metric = “euclidean”, method = “average”.
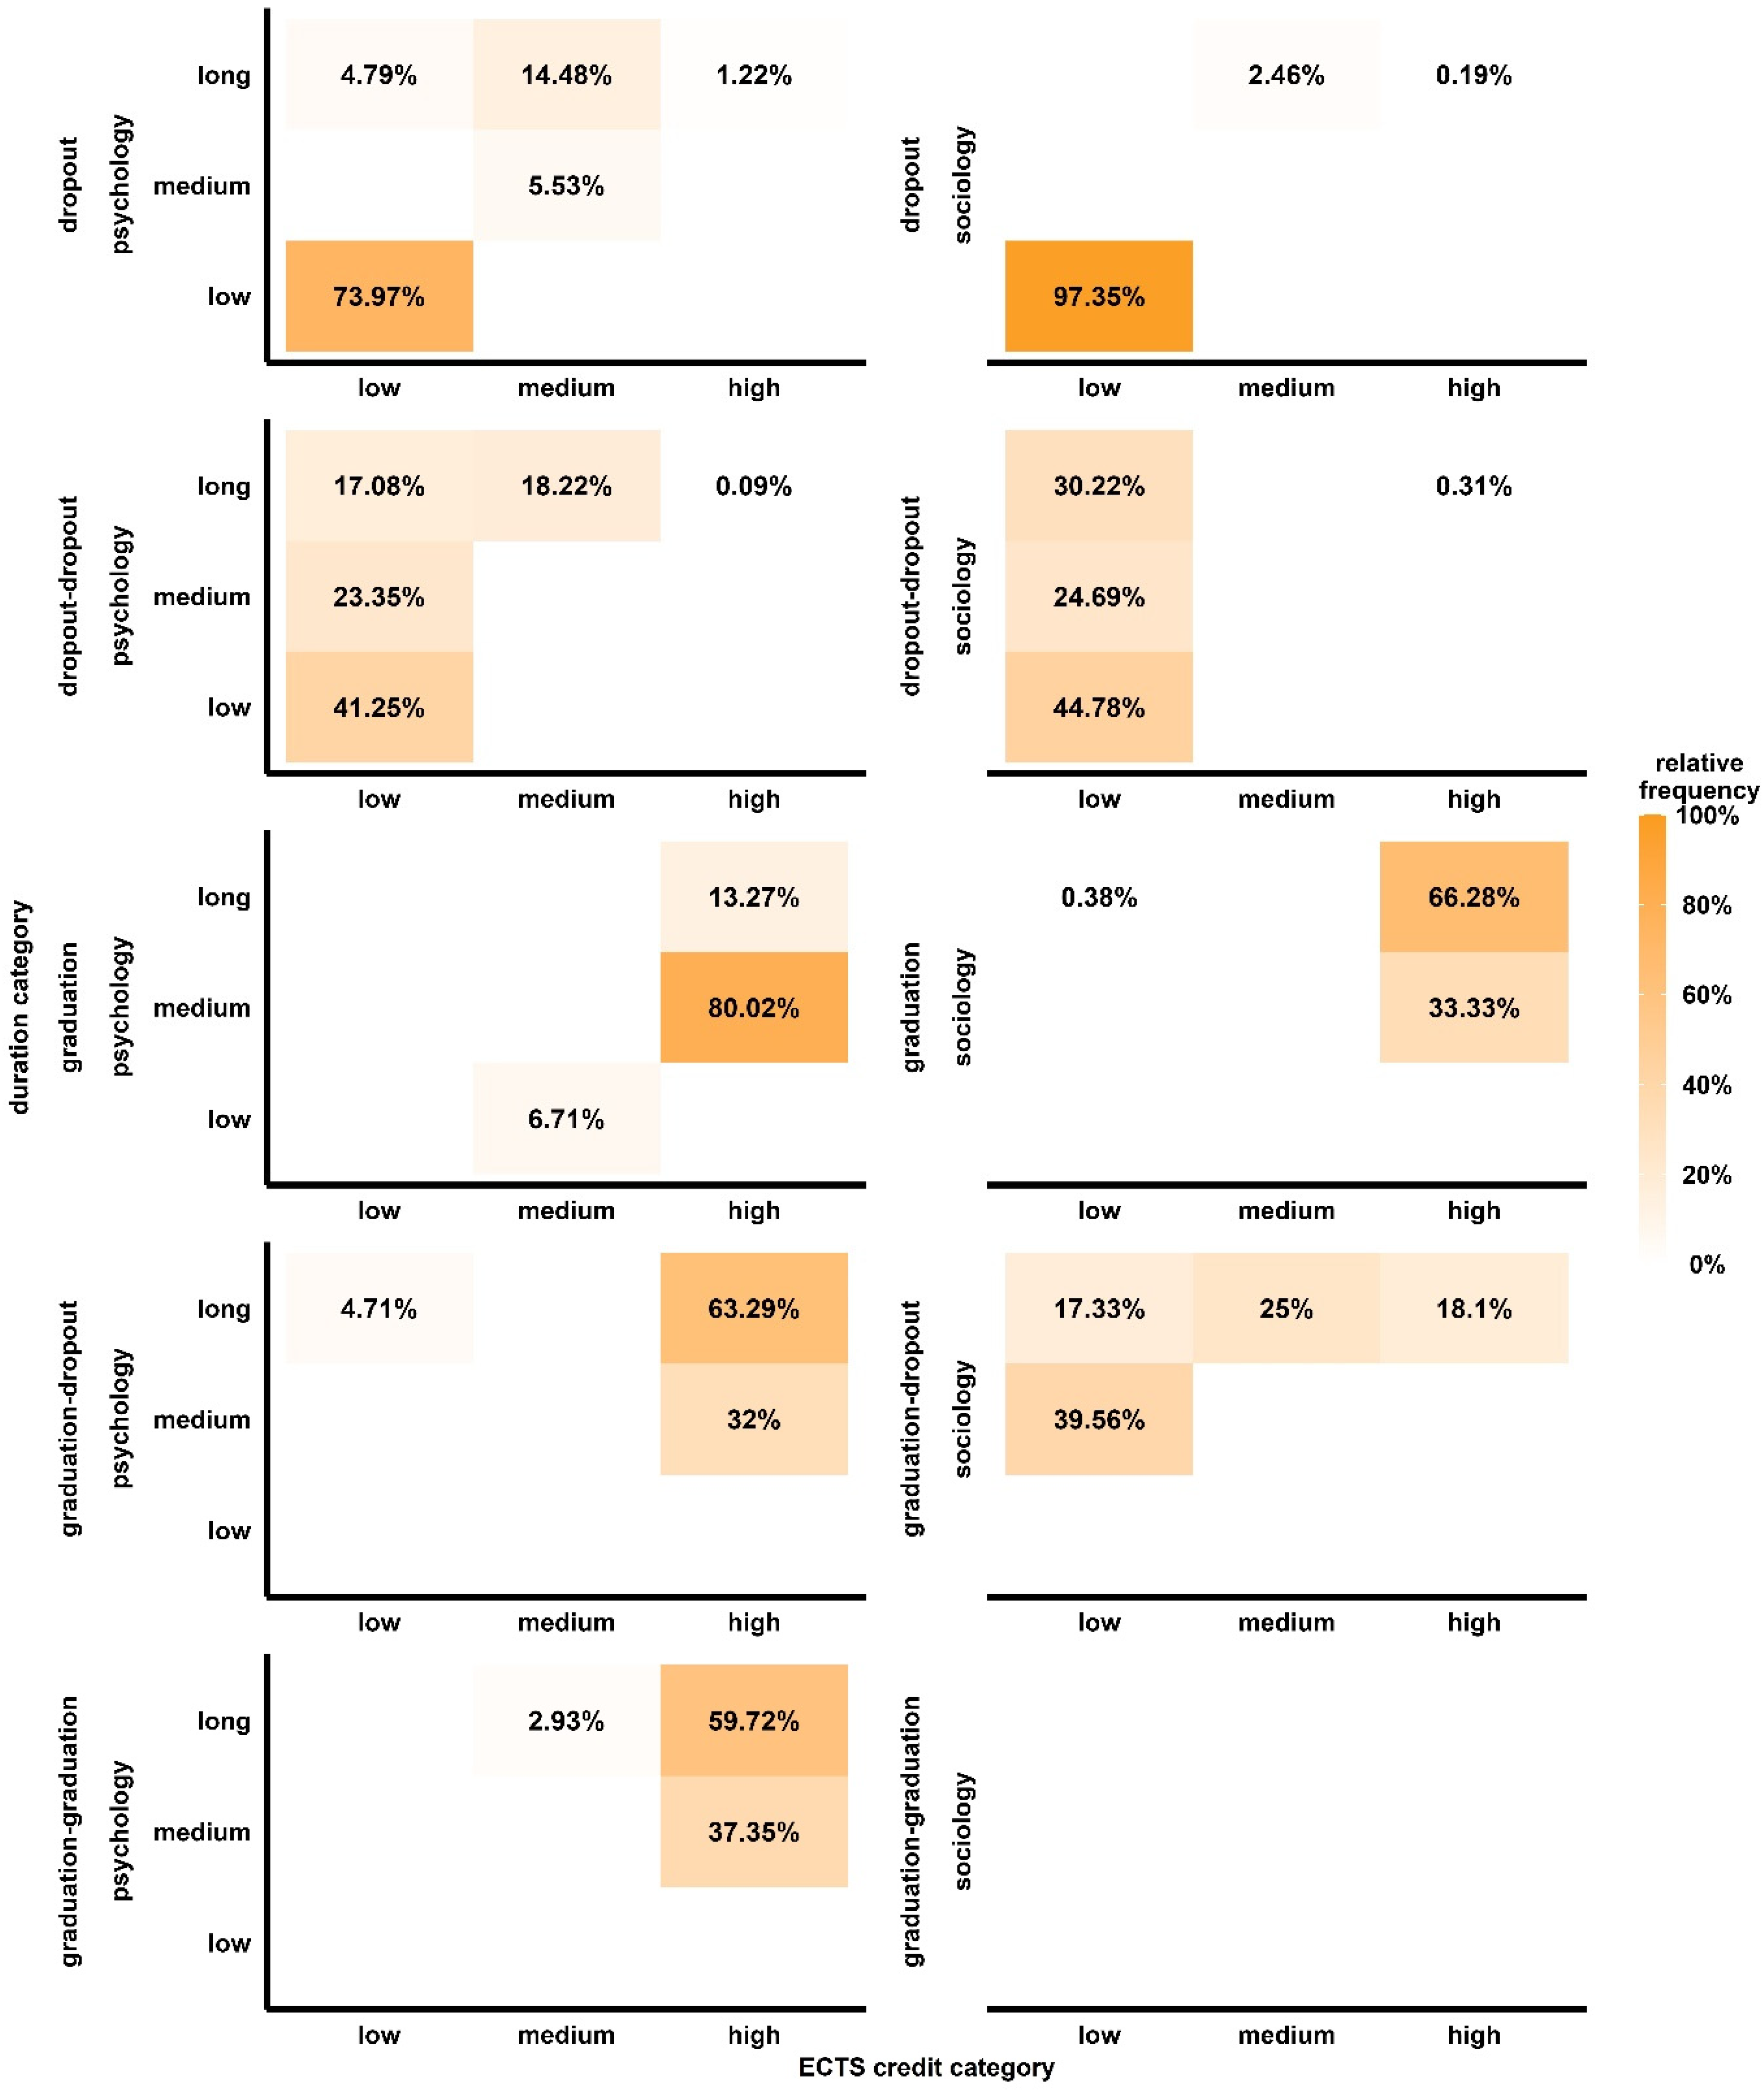
- Low ECTS: <30 ECTS
- Medium ECTS: 30 to <100 ECTS
- High ECTS: 100+ ECTS
- Low duration: <6
- Medium duration: 6–8
- Long duration: >8
3. Results
3.1. Cluster Analyses
3.2. Cluster Aggregation
4. Discussion
4.1. Outcome Clusters
4.1.1. Dropout and Dropout–Dropout
4.1.2. Graduation and Graduation–Graduation
4.1.3. Graduation–Dropout
4.2. Limitations
4.3. Implications for Policy, Practice, and Research
5. Conclusions
Supplementary Materials
Funding
Institutional Review Board Statement
Informed Consent Statement
Data Availability Statement
Acknowledgments
Conflicts of Interest
Appendix A. Model Parameters

| Outcome | Cluster | Variable | Value | n | Total SS | Total within SS | Within SS | Between SS | Iterations | Variance Explained |
|---|---|---|---|---|---|---|---|---|---|---|
| Psychology: bachelor’s programs | ||||||||||
| dropout | 1 | total ECTS credits (standardized) | 1.09 | |||||||
| 2 | −0.35 | |||||||||
| 1 | total time in the university system (standardized) | 1.26 | ||||||||
| 2 | −0.41 | |||||||||
| 1 | model parameters | 125 | 1020 | 562.24 | 362.7 | 457.76 | 1 | 44.88% | ||
| 2 | 386 | 199.54 | ||||||||
| dropout–dropout | 1 | total ECTS credits (standardized) | 2.17 | |||||||
| 2 | −0.41 | |||||||||
| 3 | −0.14 | |||||||||
| 1 | total time in the university system (standardized) | 0.67 | ||||||||
| 2 | −0.68 | |||||||||
| 3 | 0.97 | |||||||||
| 1 | model parameters | 69 | 1090 | 380.34 | 121.6 | 709.66 | 3 | 65.11% | ||
| 2 | 309 | 108.59 | ||||||||
| 3 | 168 | 150.14 | ||||||||
| graduation | 1 | total ECTS credits (standardized) | −2.9 | |||||||
| 2 | 0.26 | |||||||||
| 3 | −0.06 | |||||||||
| 1 | total time in the university system (standardized) | −0.83 | ||||||||
| 2 | −0.13 | |||||||||
| 3 | 3.14 | |||||||||
| 1 | model parameters | 72 | 1860 | 619.69 | 134.57 | 1240.31 | 2 | 66.68% | ||
| 2 | 807 | 366.95 | ||||||||
| 3 | 52 | 118.17 | ||||||||
| graduation–dropout | 1 | total ECTS credits (standardized) | −2.71 | |||||||
| 2 | 0.29 | |||||||||
| 1 | total time in the university system (standardized) | 0.66 | ||||||||
| 2 | −0.07 | |||||||||
| 1 | model parameters | 128 | 2642 | 1542.15 | 317.96 | 1099.85 | 1 | 41.63% | ||
| 2 | 1194 | 1224.19 | ||||||||
| graduation–graduation | 1 | total ECTS credits (standardized) | 0.18 | |||||||
| 2 | −0.43 | |||||||||
| 3 | −2.78 | |||||||||
| 4 | 0.91 | |||||||||
| 1 | total time in the university system (standardized) | −0.78 | ||||||||
| 2 | 1.14 | |||||||||
| 3 | −0.5 | |||||||||
| 4 | 0.42 | |||||||||
| 1 | model parameters | 76 | 322 | 103.11 | 30.02 | 218.89 | 3 | 67.98% | ||
| 2 | 44 | 40.12 | ||||||||
| 3 | 9 | 15.59 | ||||||||
| 4 | 33 | 17.38 | ||||||||
| Sociology: bachelor’s programs | ||||||||||
| dropout | 1 | total ECTS credits (standardized) | −0.16 | |||||||
| 2 | 1.5 | |||||||||
| 1 | total time in the university system (standardized) | −0.26 | ||||||||
| 2 | 2.4 | |||||||||
| 1 | model parameters | 1852 | 4106 | 2318.85 | 979.98 | 1787.15 | 1 | 43.53% | ||
| 2 | 202 | 1338.87 | ||||||||
| dropout–dropout | 1 | total ECTS credits (standardized) | 0.47 | |||||||
| 2 | −0.25 | |||||||||
| 1 | total time in the university system (standardized) | 1.1 | ||||||||
| 2 | −0.58 | |||||||||
| 1 | model parameters | 926 | 5338 | 3320.46 | 2637.36 | 2017.54 | 1 | 37.80% | ||
| 2 | 1744 | 683.11 | ||||||||
| graduation | 1 | total ECTS credits (standardized) | 0.17 | |||||||
| 2 | −2.02 | |||||||||
| 1 | total time in the university system (standardized) | −0.17 | ||||||||
| 2 | 2.01 | |||||||||
| 1 | model parameters | 180 | 388 | 256.04 | 136.59 | 131.96 | 1 | 34.01% | ||
| 2 | 15 | 119.44 | ||||||||
| graduation–dropout | 1 | total ECTS credits (standardized) | 1.68 | |||||||
| 2 | −0.58 | |||||||||
| 3 | −0.44 | |||||||||
| 1 | total time in the university system (standardized) | −0.19 | ||||||||
| 2 | −0.47 | |||||||||
| 3 | 1.47 | |||||||||
| 1 | model parameters | 300 | 2470 | 633.16 | 181.19 | 1836.84 | 3 | 74.37% | ||
| 2 | 678 | 179.61 | ||||||||
| 3 | 258 | 272.37 | ||||||||
| Outcome | Cluster | Variable | Value | n | Max Diss | M Diss | Isolation | Med Iteration | Cluster M Width | M Width | Objective |
|---|---|---|---|---|---|---|---|---|---|---|---|
| Psychology: bachelor’s programs | |||||||||||
| dropout | 1 | total ECTS credits (standardized) | −0.56 | ||||||||
| 2 | 1.29 | ||||||||||
| 3 | −0.36 | ||||||||||
| 1 | total time in the university system (standardized) | −0.71 | |||||||||
| 2 | 0.17 | ||||||||||
| 3 | 1.27 | ||||||||||
| 1 | model parameters | 300 | 1.23 | 0.47 | 0.62 | 158 | 0.7 | 0.46 | 0.71 | ||
| 2 | 113 | 3.87 | 1.11 | 1.94 | 336 | 0.15 | |||||
| 3 | 98 | 2.97 | 0.97 | 1.49 | 152 | 0.33 | |||||
| dropout–dropout | 1 | total ECTS credits (standardized) | −0.53 | ||||||||
| 2 | −0.53 | ||||||||||
| 3 | 1.64 | ||||||||||
| 1 | total time in the university system (standardized) | 0.31 | |||||||||
| 2 | −0.81 | ||||||||||
| 3 | 0.54 | ||||||||||
| 1 | model parameters | 190 | 3.6 | 0.74 | 3.21 | 342 | 0.49 | 0.45 | 0.68 | ||
| 2 | 252 | 1.68 | 0.45 | 1.5 | 11 | 0.49 | |||||
| 3 | 104 | 4.68 | 1.13 | 2.14 | 370 | 0.3 | |||||
| graduation | 1 | total ECTS credits (standardized) | −2.14 | ||||||||
| 2 | 0.13 | ||||||||||
| 3 | 0.33 | ||||||||||
| 4 | 0.39 | ||||||||||
| 1 | total time in the university system (standardized) | −0.53 | |||||||||
| 2 | 2.78 | ||||||||||
| 3 | 0.2 | ||||||||||
| 4 | −0.53 | ||||||||||
| 1 | model parameters | 92 | 2.97 | 1.34 | 1.17 | 636 | 0.17 | 0.36 | 0.51 | ||
| 2 | 52 | 3.69 | 1.25 | 1.43 | 210 | 0.34 | |||||
| 3 | 355 | 1.9 | 0.48 | 2.57 | 515 | 0.33 | |||||
| 4 | 432 | 1.22 | 0.27 | 1.66 | 924 | 0.54 | |||||
| graduation–dropout | 1 | total ECTS credits (standardized) | 0.26 | ||||||||
| 2 | 0.06 | ||||||||||
| 1 | total time in the university system (standardized) | −0.63 | |||||||||
| 2 | 0.93 | ||||||||||
| 1 | model parameters | 863 | 3.79 | 0.63 | 2.41 | 134 | 0.73 | 0.5 | 0.83 | ||
| 2 | 459 | 4.67 | 1.2 | 2.97 | 384 | 0.04 | |||||
| graduation–graduation | 1 | total ECTS credits (standardized) | −0.62 | ||||||||
| 2 | 0.25 | ||||||||||
| 3 | 0.37 | ||||||||||
| 1 | total time in the university system (standardized) | 0.54 | |||||||||
| 2 | −0.97 | ||||||||||
| 3 | 0.54 | ||||||||||
| 1 | model parameters | 44 | 4.34 | 0.91 | 4.38 | 49 | 0.25 | 0.4 | 0.76 | ||
| 2 | 74 | 2.58 | 0.6 | 1.7 | 144 | 0.59 | |||||
| 3 | 44 | 3.03 | 0.9 | 3.06 | 129 | 0.41 | |||||
| Sociology: bachelor’s programs | |||||||||||
| dropout | 1 | total ECTS credits (standardized) | −0.61 | ||||||||
| 2 | 0.36 | ||||||||||
| 1 | total time in the university system (standardized) | −0.52 | |||||||||
| 2 | −0.2 | ||||||||||
| 1 | model parameters | 1071 | 1.59 | 0.31 | 1.56 | 1882 | 0.7 | 0.3 | 0.72 | ||
| 2 | 983 | 9.45 | 1.17 | 9.26 | 230 | −0.03 | |||||
| dropout–dropout | 1 | total ECTS credits (standardized) | −0.11 | ||||||||
| 2 | −0.36 | ||||||||||
| 1 | total time in the university system (standardized) | 0.86 | |||||||||
| 2 | −0.72 | ||||||||||
| 1 | model parameters | 1151 | 8.39 | 1.07 | 5.26 | 1930 | 0.31 | 0.52 | 0.74 | ||
| 2 | 1519 | 3.58 | 0.5 | 2.24 | 1924 | 0.68 | |||||
| graduation | 1 | total ECTS credits (standardized) | 0.37 | ||||||||
| 2 | 0.34 | ||||||||||
| 3 | −1.19 | ||||||||||
| 1 | total time in the university system (standardized) | 0.96 | |||||||||
| 2 | −0.27 | ||||||||||
| 3 | 0.03 | ||||||||||
| 1 | model parameters | 33 | 4.1 | 1.12 | 3.32 | 26 | 0.24 | 0.43 | 0.68 | ||
| 2 | 125 | 1.46 | 0.44 | 1.18 | 21 | 0.59 | |||||
| 3 | 37 | 5.29 | 1.09 | 3.39 | 180 | 0.1 | |||||
| graduation–dropout | 1 | total ECTS credits (standardized) | −0.58 | ||||||||
| 2 | −0.51 | ||||||||||
| 3 | 1.75 | ||||||||||
| 1 | total time in the university system (standardized) | −0.36 | |||||||||
| 2 | 1.27 | ||||||||||
| 3 | −0.36 | ||||||||||
| 1 | model parameters | 678 | 1.95 | 0.44 | 1.2 | 418 | 0.59 | 0.58 | 0.56 | ||
| 2 | 260 | 4.31 | 0.77 | 2.65 | 864 | 0.5 | |||||
| 3 | 298 | 2.28 | 0.67 | 0.98 | 245 | 0.61 | |||||
| Outcome | Cluster | Variable | Value | n | Max Diss | M Diss | Diameter | Separation | Med Iteration | Cluster M Width | M Width | Objective Build | Objective Swap |
|---|---|---|---|---|---|---|---|---|---|---|---|---|---|
| Psychology: bachelor’s programs | |||||||||||||
| dropout | 1 | total ECTS credits (standardized) | −0.53 | ||||||||||
| 2 | 0.8 | ||||||||||||
| 1 | total time in the university system (standardized) | −0.49 | |||||||||||
| 2 | 0.61 | ||||||||||||
| 1 | model parameters | 340 | 1.56 | 0.55 | 2.59 | 0.08 | 12 | 0.67 | 0.47 | 0.88 | 0.84 | ||
| 2 | 171 | 4.11 | 1.43 | 6.14 | 0.08 | 135 | 0.09 | ||||||
| dropout–dropout | 1 | total ECTS credits (standardized) | 0.69 | ||||||||||
| 2 | −0.53 | ||||||||||||
| 1 | total time in the university system (standardized) | 0.76 | |||||||||||
| 2 | −0.58 | ||||||||||||
| 1 | model parameters | 206 | 5.61 | 1.32 | 7.38 | 0.22 | 264 | 0.14 | 0.46 | 0.88 | 0.84 | ||
| 2 | 340 | 1.75 | 0.55 | 2.5 | 0.22 | 25 | 0.65 | ||||||
| graduation | 1 | total ECTS credits (standardized) | −2.55 | ||||||||||
| 2 | 0.33 | ||||||||||||
| 1 | total time in the university system (standardized) | −0.53 | |||||||||||
| 2 | −0.17 | ||||||||||||
| 1 | model parameters | 86 | 3.77 | 1.38 | 5.62 | 0.06 | 296 | 0.36 | 0.65 | 0.78 | 0.78 | ||
| 2 | 845 | 6.64 | 0.72 | 7.73 | 0.06 | 333 | 0.68 | ||||||
| graduation–dropout | 1 | total ECTS credits (standardized) | 0.33 | ||||||||||
| 2 | 0.31 | ||||||||||||
| 3 | −3.04 | ||||||||||||
| 1 | total time in the university system (standardized) | −0.63 | |||||||||||
| 2 | 0.93 | ||||||||||||
| 3 | 0.31 | ||||||||||||
| 1 | model parameters | 829 | 2.45 | 0.51 | 3.86 | 0.31 | 56 | 0.57 | 0.5 | 0.67 | 0.64 | ||
| 2 | 372 | 3.75 | 0.74 | 4.51 | 0.31 | 85 | 0.36 | ||||||
| 3 | 121 | 4.05 | 1.22 | 6.27 | 0.31 | 859 | 0.45 | ||||||
| graduation–graduation | 1 | total ECTS credits (standardized) | −0.2 | ||||||||||
| 2 | 0.29 | ||||||||||||
| 1 | total time in the university system (standardized) | 0.85 | |||||||||||
| 2 | −0.67 | ||||||||||||
| 1 | model parameters | 70 | 4.76 | 1.12 | 6.79 | 0.23 | 153 | 0.2 | 0.38 | 0.99 | 0.88 | ||
| 2 | 92 | 2.71 | 0.69 | 4.42 | 0.23 | 141 | 0.52 | ||||||
| Sociology: bachelor’s programs | |||||||||||||
| dropout | 1 | total ECTS credits (standardized) | −0.61 | ||||||||||
| 2 | 0.31 | ||||||||||||
| 1 | total time in the university system (standardized) | −0.52 | |||||||||||
| 2 | 0.12 | ||||||||||||
| 1 | model parameters | 1071 | 0.96 | 0.28 | 1.52 | 0.03 | 12 | 0.75 | 0.33 | 0.77 | 0.72 | ||
| 2 | 983 | 9.39 | 1.2 | 10.11 | 0.03 | 563 | −0.12 | ||||||
| dropout–dropout | 1 | total ECTS credits (standardized) | −0.11 | ||||||||||
| 2 | −0.36 | ||||||||||||
| 1 | total time in the university system (standardized) | 0.86 | |||||||||||
| 2 | −0.72 | ||||||||||||
| 1 | model parameters | 1151 | 8.39 | 1.07 | 9.03 | 0.15 | 409 | 0.18 | 0.45 | 0.81 | 0.74 | ||
| 2 | 1519 | 3.58 | 0.5 | 3.83 | 0.15 | 276 | 0.65 | ||||||
| graduation | 1 | total ECTS credits (standardized) | −0.55 | ||||||||||
| 2 | 0.37 | ||||||||||||
| 3 | −0.7 | ||||||||||||
| 1 | total time in the university system (standardized) | 4.35 | |||||||||||
| 2 | −0.27 | ||||||||||||
| 3 | 0.34 | ||||||||||||
| 1 | model parameters | 6 | 1.73 | 0.87 | 2.5 | 0.93 | 33 | 0.64 | 0.45 | 0.7 | 0.69 | ||
| 2 | 135 | 2.29 | 0.5 | 3.24 | 0.09 | 22 | 0.6 | ||||||
| 3 | 54 | 5.87 | 1.13 | 7.59 | 0.09 | 95 | 0.04 | ||||||
| graduation–dropout | 1 | total ECTS credits (standardized) | −0.61 | ||||||||||
| 2 | −0.55 | ||||||||||||
| 3 | 1.7 | ||||||||||||
| 1 | total time in the university system (standardized) | −0.68 | |||||||||||
| 2 | 0.94 | ||||||||||||
| 3 | −0.36 | ||||||||||||
| 1 | model parameters | 600 | 1.63 | 0.39 | 2.51 | 0.32 | 1019 | 0.69 | 0.56 | 0.65 | 0.56 | ||
| 2 | 339 | 4.62 | 0.78 | 5.28 | 0.22 | 608 | 0.3 | ||||||
| 3 | 297 | 2.29 | 0.67 | 3.37 | 0.22 | 892 | 0.59 | ||||||
| Outcome | Cluster | n | Cluster M Width | M Width |
|---|---|---|---|---|
| Psychology: bachelor’s programs | ||||
| dropout | 1 | 486 | 0.58 | 0.58 |
| 2 | 25 | 0.55 | ||
| dropout–dropout | 1 | 15 | 0.74 | 0.48 |
| 2 | 510 | 0.47 | ||
| 3 | 2 | 0.45 | ||
| 4 | 19 | 0.60 | ||
| graduation | 1 | 896 | 0.68 | 0.68 |
| 2 | 35 | 0.61 | ||
| graduation–dropout | 1 | 1307 | 0.57 | 0.57 |
| 2 | 15 | 0.68 | ||
| graduation–graduation | 1 | 149 | 0.47 | 0.47 |
| 2 | 10 | 0.36 | ||
| 3 | 3 | 0.80 | ||
| Sociology: bachelor’s programs | ||||
| dropout | 1 | 2038 | 0.82 | 0.82 |
| 2 | 16 | 0.76 | ||
| dropout–dropout | 1 | 2637 | 0.77 | 0.77 |
| 2 | 33 | 0.70 | ||
| graduation | 1 | 192 | 0.76 | 0.76 |
| 2 | 3 | 0.46 | ||
| graduation–dropout | 1 | 1159 | 0.48 | 0.48 |
| 2 | 77 | 0.60 | ||
References
- Heublein, U. Student drop-out from G erman higher education institutions. Eur. J. Educ. 2014, 49, 497–513. [Google Scholar] [CrossRef]
- Ozga, J.; Sukhnandan, L. Undergraduate non-completion: Developing an explanatory model. High. Educ. Q. 1998, 52, 316–333. [Google Scholar] [CrossRef]
- Wilcox, P.; Winn, S.; Fyvie-Gauld, M. ‘It was nothing to do with the university, it was just the people’: The role of social support in the first-year experience of higher education. Stud. High. Educ. 2005, 30, 707–722. [Google Scholar] [CrossRef]
- Bardach, L.; Lüftenegger, M.; Oczlon, S.; Spiel, C.; Schober, B. Context-related problems and university students’ dropout intentions—The buffering effect of personal best goals. Eur. J. Psychol. Educ. 2020, 35, 477–493. [Google Scholar] [CrossRef]
- Barbera, S.A.; Berkshire, S.D.; Boronat, C.B.; Kennedy, M.H. Review of undergraduate student retention and graduation since 2010: Patterns, predictions, and recommendations for 2020. J. Coll. Stud. Retent. Res. Theory Pract. 2020, 22, 227–250. [Google Scholar] [CrossRef]
- Wachen, J.; Pretlow, J.; Dixon, K.G. Building college readiness: Exploring the effectiveness of the UNC academic summer bridge program. J. Coll. Stud. Retent. Res. Theory Pract. 2018, 20, 116–138. [Google Scholar] [CrossRef]
- Giani, M.S.; Attewell, P.; Walling, D. The value of an incomplete degree: Heterogeneity in the labor market benefits of college non-completion. J. High. Educ. 2020, 91, 514–539. [Google Scholar] [CrossRef] [PubMed]
- Biggs, J. Teaching for Quality Learning at University; Society for Research into Higher Education: Buckingham, UK, 2003. [Google Scholar]
- Dochy, F.; De Rijdt, C.; Dyck, W. Cognitive prerequisites and learning: How far have we progressed since Bloom? Implications for educational practice and teaching. Act. Learn. High. Educ. 2002, 3, 265–284. [Google Scholar] [CrossRef]
- Hailikari, T.; Katajavuori, N.; Lindblom-Ylanne, S. The relevance of prior knowledge in learning and instructional design. Am. J. Pharm. Educ. 2008, 72, 113. [Google Scholar] [CrossRef]
- Hailikari, T.; Nevgi, A.; Lindblom-Ylänne, S. Exploring alternative ways of assessing prior knowledge, its components and their relation to student achievement: A mathematics based case study. Stud. Educ. Eval. 2007, 33, 320–337. [Google Scholar] [CrossRef]
- Abdelrahman, R.M. Metacognitive awareness and academic motivation and their impact on academic achievement of Ajman University students. Heliyon 2020, 6, e04192. [Google Scholar] [CrossRef] [PubMed]
- Seery, M.K. The role of prior knowledge and student aptitude in undergraduate performance in chemistry: A correlation-prediction study. Chem. Educ. Res. Pract. 2009, 10, 227–232. [Google Scholar] [CrossRef]
- Federal Ministry of Education, Science and Research. Federal Act on the Organisation of Universities and their Studies. In Universities Act 2002—UG; Federal Ministry of Education, Science and Research: Vienna, Austria, 2002; Available online: https://www.ris.bka.gv.at/Dokumente/BgblPdf/2002_120_1/2002_120_1.pdf (accessed on 5 May 2024).
- Loder, A.K.F.; Brandweiner, A.C.; Maia de Oliveira Wood, G. Parallel Enrollments: Associations Between College Student Satisfaction and Performance. J. Coll. Stud. Retent. Res. Theory Pract. 2024, 15210251241232683. [Google Scholar] [CrossRef]
- Assefa, M.; Sedgwick, R. The Bologna bachelor’s degree: An overview. World Educ. News Rev. 2004, 17, 1–10. [Google Scholar]
- European Union. European Credit Transfer System: ECTS Users’ Guide 2015; Publications Office of the European Union: Luxembourg, 2015. [Google Scholar] [CrossRef]
- Federal Ministry of Education, Science and Research. Federal Act on the Organisation of Universities and their Studies (revised version). In Universities Act 2002—UG; Federal Ministry of Education, Science and Research: Vienna, Austria, 2021; Available online: https://www.ris.bka.gv.at/Dokumente/BgblAuth/BGBLA_2021_I_93/BGBLA_2021_I_93.html (accessed on 5 May 2024).
- Federal Ministry of Education, Science and Research. Federal Act on the Capacity Orientated, Student-Centered Financing of Universities. In Universities’ Financing Act—UniFinV; Federal Ministry of Education, Science and Research: Vienna, Austria, 2018. [Google Scholar]
- Kyndt, E.; Berghmans, I.; Dochy, F.; Bulckens, L. ‘Time is not enough.’ Workload in higher education: A student perspective. High. Educ. Res. Dev. 2014, 33, 684–698. [Google Scholar] [CrossRef]
- Karjalainen, A.; Alha, K.; Jutila, S. Give Me Time to Think. In Determining Student Work-Load in Higher Education; Oulu University Press: Oulu, Finland, 2006. [Google Scholar]
- Yusof, R.; Harith, N.H.M.; Lokman, A.; Abd Batau, M.F.; Zain, Z.M.; Rahmat, N.H. A Study of Perception on Students’ Motivation, Burnout and Reasons for Dropout. Int. J. Acad. Res. Bus. Soc. Sci. 2023, 13, 403–432. [Google Scholar] [CrossRef]
- Maslach, C.; Leiter, M.P. Understanding burnout: Definitions, causes, and consequences. In Professional Burnout: Recent Developments in Theory and Research; Routledge: London, UK, 2016; pp. 9–16. [Google Scholar]
- Norez, D. Academic Burnout in College Students: The Impact of Personality Characteristics and Academic Term on Burnout. Master’s Thesis, Fort Hays State University, Hays, Kansas, 2017. Volume 502. [Google Scholar] [CrossRef]
- Pardos, Z.A.; Borchers, C.; Yu, R. Credit hours is not enough: Explaining undergraduate perceptions of course workload using LMS records. Internet High. Educ. 2023, 56, 100882. [Google Scholar] [CrossRef]
- Cummings, M.; Knott, T. How Many Credit Hours Should First Semester Engineering Freshmen Take? In 2001 Annual Conference; ASEE: Crystal City, VA, USA, 2001. [Google Scholar]
- Bound, J.; Lovenheim, M.; Turner, S. Understanding the Decrease in College Completion Rates and the Increased Time to the Baccalaureate Degree; University of Michigan Population Studies Center Research Report No. 07-626; University of Michigan: Ann Arbor, MI, USA, 2007. [Google Scholar]
- Ridgeway, C.L. Sociology and Psychology. Oxf. Res. Encycl. Psychol. 2022. [Google Scholar] [CrossRef]
- Reichardt, C.S. Teaching Quantitative Skills Across the Psychology Curriculum. In Teaching Statistics and Quantitative Methods in the 21st Century; Routledge: London, UK, 2020; pp. 137–152. [Google Scholar]
- Williams, M.; Collett, C.; Rice, R. Baseline Study of Quantitative Methods in British Sociology; University of Plymouth: Plymouth, UK, 2004. [Google Scholar]
- Newstead, S.E.; Makinen, S. Psychology teaching in Europe. Eur. Psychol. 1997, 2, 3–10. [Google Scholar] [CrossRef]
- Federal Ministry of Education, Science and Research. Performance Agreement 2022–24 University of Vienna; Federal Ministry of Education, Science and Research: Vienna, Austria, 2021. [Google Scholar]
- University of Graz. Intellectual Capital Report 2022; University of Graz: Graz, Austria, 2023. [Google Scholar]
- University of Vienna. Intellectual Capital Report 2019; University of Vienna: Vienna, Austria, 2020. [Google Scholar]
- University of Vienna. Intellectual Capital Report 2022; University of Vienna: Vienna, Austria, 2023. [Google Scholar]
- University of Graz. Find Your Study Programme! Available online: https://www.uni-graz.at/en/study/prospective-students/ (accessed on 3 March 2024).
- Fajčíková, A.; Urbancová, H. Factors influencing students’ motivation to seek higher education—A case study at a State University in the Czech Republic. Sustainability 2019, 11, 4699. [Google Scholar] [CrossRef]
- Alzarooni, L.A.D.; Medani, K. Reasons for students to study social sciences in the United Arab Emirates: A field study on students of the Department of Sociology at the University of Sharjah. Al-Adab. J. 2022, 143, 407–431. [Google Scholar] [CrossRef]
- Sándor, A.V. Motivations and Self-Perceived Career Prospects of Undergraduate Sociology Students. Eur. J. Soc. Sci. Educ. Res. 2020, 7, 1–9. [Google Scholar] [CrossRef]
- Upmane, A.; Gaitniece-Putāne, A.; Šmitiņa, A. Society. Integration. Education. In Proceedings of the International Scientific Conference, Rezekne, Latvia, 27–28 May 2016. [Google Scholar]
- Nikolaenko, A.D.; Lantratova, A.A.; Volkodav, T.V. Choosing Psychology as a career: Study on Students’ Professional Motivation. Forum Young Sci. 2018, 5, 35–41. [Google Scholar]
- Harton, H.C.; Lyons, P.C. Gender, empathy, and the choice of the psychology major. Teach. Psychol. 2003, 30, 19–24. [Google Scholar] [CrossRef]
- Fabito, B.S.; Rodriguez, R.L.; Catacutan-Bangit, A.E. Correlation between student entrance exam results and academic performance: Case of a College in a Philippine University. Natl. Univ.—Educ. Work 2015, 50–60. Available online: https://www.semanticscholar.org/paper/Correlation-between-Student-Entrance-Exam-Results-%3A-Fabito-Rodriguez/3f9fdb8a85107f321b07fda9c70200132ced1c1e#citing-papers (accessed on 5 May 2024).
- Tesema, M.T. The Validity of University Entrance Examination and High School Grade Point Average for Predictiong First Year University Students’ Academic Performance; University of Twente: Twente, The Netherlands, 2014. [Google Scholar]
- Busato, V.V.; Prins, F.J.; Elshout, J.J.; Hamaker, C. Intellectual ability, learning style, personality, achievement motivation and academic success of psychology students in higher education. Personal. Individ. Differ. 2000, 29, 10. [Google Scholar] [CrossRef]
- Rokach, A.; Boulazreg, S. The road to becoming a psychologist: Indicators of success and hardship during the university years. J. Psychol. 2020, 154, 632–661. [Google Scholar] [CrossRef] [PubMed]
- Kumar, S.; Jagacinski, C.M. Imposters have goals too: The imposter phenomenon and its relationship to achievement goal theory. Personal. Individ. Differ. 2006, 40, 147–157. [Google Scholar] [CrossRef]
- Cozzarelli, C.; Major, B. Exploring the validity of the impostor phenomenon. J. Soc. Clin. Psychol. 1990, 9, 401–417. [Google Scholar] [CrossRef]
- Zyl-Schalekamp, C.V.; Mthombeni, P. Social-background factors affecting the academic success of first year sociology students at the University of Johannesburg, South Africa. J. Sociol. Soc. Anthropol. 2015, 6, 31–44. [Google Scholar] [CrossRef]
- Luna, Y.M.; Winters, S.A. “Why did you blend my learning?” A comparison of student success in lecture and blended learning introduction to sociology courses. Teach. Sociol. 2017, 45, 116–130. [Google Scholar] [CrossRef]
- Thiele, T.; Singleton, A.; Pope, D.; Stanistreet, D. Predicting students’ academic performance based on school and socio-demographic characteristics. Stud. High. Educ. 2016, 41, 1424–1446. [Google Scholar] [CrossRef]
- Singh, K. Study of achievement motivation in relation to academic achievement of students. Int. J. Educ. Plan. Adm. 2011, 1, 161–171. [Google Scholar]
- Richardson, M.; Abraham, C.; Bond, R. Psychological correlates of university students’ academic performance: A systematic review and meta-analysis. Psychol. Bull. 2012, 138, 353. [Google Scholar] [CrossRef] [PubMed]
- Byun, S.-Y.; Meece, J.L.; Agger, C.A. Predictors of college attendance patterns of rural youth. Res. High. Educ. 2017, 58, 817–842. [Google Scholar] [CrossRef]
- Ewert, S. Male and female pathways through four-year colleges: Disruption and sex stratification in higher education. Am. Educ. Res. J. 2010, 47, 744–773. [Google Scholar] [CrossRef]
- Childs, S.E.; Finnie, R.; Martinello, F. Postsecondary student persistence and pathways: Evidence from the YITS-A in Canada. Res. High. Educ. 2017, 58, 270–294. [Google Scholar] [CrossRef]
- Goldrick-Rab, S. Following their every move: An investigation of social-class differences in college pathways. Sociol. Educ. 2006, 79, 67–79. [Google Scholar] [CrossRef]
- Haas, C.; Hadjar, A. Students’ trajectories through higher education: A review of quantitative research. High. Educ. 2020, 79, 1099–1118. [Google Scholar] [CrossRef]
- Lizzio, A. The Student Lifecycle: An Integrative Framework for Guiding Practice; Griffith University: Brisbane, Australia, 2011. [Google Scholar]
- Loder, A.K.F. Student Flow Visualization. Eur. J. Educ. 2024, 59, e12619. [Google Scholar] [CrossRef]
- R Core Team. R: A Language an Environment for Statistical Computing; R Core Team: Vienna, Austria, 2022. [Google Scholar]
- Ripley, B.; Lapsley, M. RODBC. 2022. Available online: https://cran.r-project.org/web/packages/RODBC/index.html (accessed on 5 May 2024).
- Kassambara, A.; Mundt, F. Factoextra: Extract and Visualize the Results of Multivariate Data Analyses; Package Version 1.0.7; 2020. Available online: https://cran.r-project.org/web/packages/factoextra/index.html (accessed on 5 May 2024).
- Maechler, M.; Rousseeuw, P.; Struyf, A.; Hubert, M.; Hornik, K.; Studer, M.; Roudier, P.; Gonzalez, J.; Kozlowski, Z.; Schubert, E.; et al. Cluster: “Finding Groups in Data”: Cluster Analysis Extended Rousseeuw et al, Package Version 2.1.6; 2023. Available online: https://cran.r-project.org/web/packages/cluster/index.html (accessed on 5 May 2024).
- Wickham, H.; Chang, W.; Pedersen, H.L.T.L.; Takahashi, K.; Wilke, C.; Woo, K.; Yutani, H.; Dunnington, E. ggplot2: Create Elegant Data Visualisations Using the Grammar of Graphics, Package Version 3.4.4; 2023. Available online: https://cran.r-project.org/web/packages/ggplot2/index.html (accessed on 5 May 2024).
- Ammon, B.V.; Bowman, J.; Mourad, R. Who are our students? Cluster analysis as a tool for understanding community college student populations. J. Appl. Res. Community Coll. 2008, 16, 29–41. [Google Scholar]
- Rousseeuw, P.J. Silhouettes: A graphical aid to the interpretation and validation of cluster analysis. J. Comput. Appl. Math. 1987, 20, 53–65. [Google Scholar] [CrossRef]
- Hartigan, J.A.; Wong, M.A. Algorithm AS 136: A K-means clustering algorithm. Appl. Stat. 1979, 28, 100–108. [Google Scholar] [CrossRef]
- Kaufman, L.; Rousseeuw, P.J. Finding Groups in Data: An Introduction to Cluster Analysis; John Wiley & Sons: New York, NY, USA, 2009. [Google Scholar]
- O’Neill, L.; Hartvigsen, J.; Wallstedt, B.; Korsholm, L.; Eika, B. Medical school dropout-testing at admission versus selection by highest grades as predictors. Med. Educ. 2011, 45, 1111–1120. [Google Scholar] [CrossRef] [PubMed]
- Welch, A. A Cost-Benefit Analysis of Amazon Prime Air; University of Tennessee at Chattanooga: Chattanooga, TN, USA, 2015. [Google Scholar]
- Robi, Y.S. University entrance exam result and preparatory class average score as predictors of college performance. Int. J. Indian Psychol. 2014, 1, 103–113. [Google Scholar]
- Roderick, M.; Nagaoka, J.; Coca, V. College readiness for all: The challenge for urban high schools. Future Child. 2009, 19, 185–210. [Google Scholar] [CrossRef]
- Sweet, S. 2015 Hans O. Mauksch Address: How Departments Can Respond to the Changing Popularity of the Sociology Major. Teach. Sociol. 2016, 44, 3–16. [Google Scholar] [CrossRef]
- Das, M. Making sociology attractive. Teach. Sociol. 1989, 17, 356–359. [Google Scholar] [CrossRef]
- Kember, D.; Leung, D.Y. Influences upon students’ perceptions of workload. Educ. Psychol. 1998, 18, 293–307. [Google Scholar] [CrossRef]
- Gonçalves, G.; Carvalho, C.; Sacco, M. Estimate of medical stgudent’s workload in a public health course unit and comparison with ECTS credits allocation. In Proceedings of the INTED2020 Proceedings, Valencia, Spain, 2–4 March 2020. [Google Scholar]
- Hynninen, T.; Knutas, A.; Kasurinen, J. Can One ECTS Credit Make All the Difference? Comparisons of the Actual Student Workload versus the Credit Inflation; 2018; Volume 2256. Available online: https://ceur-ws.org/Vol-2256/SWEPHD18_paper_07.pdf (accessed on 5 May 2024).
- Kyndt, E.; Dochy, F.; Struyven, K.; Cascallar, E. The perception of workload and task complexity and its influence on students’ approaches to learning: A study in higher education. Eur. J. Psychol. Educ. 2011, 26, 393–415. [Google Scholar] [CrossRef]
- Kember, D. Interpreting student workload and the factors which shape students’ perceptions of their workload. Studies in High. Educ. 2004, 29, 165–184. [Google Scholar] [CrossRef]
- Loder, A.K.F. Predicting the Number of “Active” Students: A Method for Preventive University Management. J. Coll. Stud. Retent. Res. Theory Pract. 2023, 15210251231201394. [Google Scholar] [CrossRef]
- Mouton, D.; Zhang, H.; Ertl, B. German university student’s reasons for dropout. Identifying latent classes. J. Educ. Res. Online 2020, 12, 190–224. [Google Scholar]
- Suhlmann, M.; Sassenberg, K.; Nagengast, B.; Trautwein, U. Belonging mediates effects of student-university fit on well-being, motivation, and dropout intention. Soc. Psychol. 2018, 49, 16–28. [Google Scholar] [CrossRef]
- Zając, T.Z.; Komendant-Brodowska, A. Premeditated, dismissed and disenchanted: Higher education dropouts in Poland. Tert. Educ. Manag. 2019, 25, 1–16. [Google Scholar] [CrossRef]
- Ortigosa, A.; Carro, R.M.; Bravo-Agapito, J.; Lizcano, D.; Alcolea, J.J.; Blanco, O. From lab to production: Lessons learnt and real-life challenges of an early student-dropout prevention system. IEEE Trans. Learn. Technol. 2019, 12, 264–277. [Google Scholar] [CrossRef]
- Linden, K. Improving student retention by providing targeted support to university students who do not submit an early assessment item. A practice report. Stud. Success 2022, 13, 67–73. [Google Scholar]

| Field of Study | Outcome | n | M | SD | SE | 95% CI |
|---|---|---|---|---|---|---|
| ECTS credits | ||||||
| psychology | dropout | 511 | 22.96 | 30.16 | 1.33 | −1.29–3.96 |
| dropout–dropout | 546 | 16.52 | 25.31 | 1.08 | −1.04–3.21 | |
| graduation | 931 | 164.54 | 34.29 | 1.12 | −1.08–3.33 | |
| graduation–dropout | 1322 | 146.32 | 44.20 | 1.22 | −1.17–3.60 | |
| graduation–graduation | 546 | 147.36 | 26.29 | 2.07 | −2.01–6.14 | |
| sociology | dropout | 2054 | 11.31 | 18.57 | 0.41 | −0.39–1.21 |
| dropout–dropout | 2670 | 10.20 | 19.86 | 0.38 | −0.37–1.14 | |
| graduation | 195 | 162.37 | 27.14 | 1.94 | −1.89–5.78 | |
| graduation–dropout | 1236 | 46.52 | 65.98 | 0.26 | −1.81–5.56 | |
| graduation–graduation | 78 | 141.6 | 24.58 | 1.13 | −2.76–8.32 | |
| duration | ||||||
| psychology | dropout | 511 | 11.80 | 7.47 | 0.33 | −0.32–0.98 |
| dropout–dropout | 546 | 7.60 | 4.46 | 0.19 | −0.18–0.57 | |
| graduation | 931 | 10.92 | 4.99 | 0.16 | −0.16–0.48 | |
| graduation–dropout | 1322 | 9.01 | 3.21 | 0.09 | −0.08–0.26 | |
| graduation–graduation | 546 | 10.20 | 3.30 | 0.26 | −0.25–0.77 | |
| sociology | dropout | 2054 | 8.11 | 5.33 | 0.12 | −0.11–0.35 |
| dropout–dropout | 2670 | 6.19 | 4.44 | 0.09 | −0.08–0.25 | |
| graduation | 195 | 12.40 | 6.15 | 0.44 | −0.43–1.31 | |
| graduation–dropout | 1236 | 9.10 | 3.08 | 0.09 | −0.08–0.26 | |
| graduation–graduation | 78 | 10.09 | 3.35 | 0.38 | −0.38–1.13 | |
| Outcome | Cluster | Method | n | M ECTS | SD ECTS | SE ECTS | 95% CI ECTS | M Duration | SD Duration | SE Duration | 95% CI Duration |
|---|---|---|---|---|---|---|---|---|---|---|---|
| Psychology: bachelor’s programs | |||||||||||
| dropout | 1 | clara | 300 | 8.73 | 10.82 | 0.62 | −0.60–1.85 | 3.67 | 1.70 | 0.10 | −0.09–0.29 |
| 2 | 113 | 68.36 | 30.28 | 2.85 | −2.80–8.49 | 7.60 | 3.81 | 0.36 | −0.35–1.07 | ||
| 3 | 98 | 14.18 | 16.10 | 1.63 | −1.60–4.85 | 12.51 | 4.45 | 0.45 | −0.44–1.34 | ||
| 1 | hclust | 486 | 18.42 | 22.41 | 1.02 | −0.98–3.01 | 5.92 | 4.33 | 0.20 | −0.19–0.58 | |
| 2 | 25 | 111.18 | 25.71 | 5.14 | −5.47–15.75 | 12.24 | 4.10 | 0.82 | −0.87–2.51 | ||
| 1 | kmeans | 125 | 55.85 | 39.92 | 3.57 | −3.5–10.64 | 11.92 | 4.90 | 0.44 | −0.43–1.31 | |
| 2 | 386 | 12.31 | 15.07 | 0.77 | −0.74–2.27 | 4.39 | 2.35 | 0.12 | −0.12–0.35 | ||
| 1 | pam | 340 | 8.99 | 11.6 | 0.63 | −0.61–1.87 | 4.14 | 2.22 | 0.12 | −0.12–0.36 | |
| 2 | 171 | 50.75 | 35.96 | 2.75 | −2.68–8.18 | 10.40 | 5.04 | 0.39 | −0.38–1.15 | ||
| dropout–dropout | 1 | clara | 190 | 6.63 | 8.77 | 0.64 | −0.62–1.89 | 10.83 | 3.62 | 0.26 | −0.26–0.78 |
| 2 | 252 | 6.05 | 9.38 | 0.59 | −0.57–1.75 | 3.98 | 1.61 | 0.10 | −0.10–0.30 | ||
| 3 | 104 | 59.96 | 26.11 | 2.56 | −2.52–7.64 | 10.49 | 3.91 | 0.38 | −0.38–1.14 | ||
| 1 | hclust | 15 | 5.43 | 9.89 | 2.55 | −2.92–8.03 | 20.13 | 2.39 | 0.62 | −0.71–1.94 | |
| 2 | 510 | 13.42 | 18.93 | 0.84 | −0.81–2.49 | 7.00 | 3.80 | 0.17 | −0.16–0.50 | ||
| 3 | 2 | 160.00 | 22.63 | 16.00 | −187.30–219.30 | 10.00 | 2.83 | 2.00 | −23.41–27.41 | ||
| 4 | 19 | 93.58 | 15.14 | 3.47 | −3.82–10.77 | 13.63 | 2.99 | 0.68 | −0.75–2.12 | ||
| 1 | kmeans | 69 | 71.51 | 25.01 | 3.01 | −3.00–9.02 | 10.58 | 4.02 | 0.48 | −0.48–1.45 | |
| 2 | 309 | 6.18 | 10.04 | 0.57 | −0.55–1.70 | 4.59 | 1.97 | 0.11 | −0.11–0.33 | ||
| 3 | 168 | 12.96 | 13.82 | 1.07 | −1.04–3.17 | 11.92 | 3.46 | 0.27 | −0.26–0.79 | ||
| 1 | pam | 206 | 35.08 | 32.01 | 2.23 | −2.17–6.63 | 11.75 | 3.96 | 0.28 | −0.27–0.82 | |
| 2 | 340 | 5.28 | 8.63 | 0.47 | −0.45–1.39 | 5.09 | 2.40 | 0.13 | −0.13–0.39 | ||
| graduation | 1 | clara | 92 | 77.72 | 39.54 | 4.12 | −4.07–12.31 | 5.72 | 2.49 | 0.26 | −0.26–0.78 |
| 2 | 52 | 162.58 | 26.75 | 3.71 | −3.74–11.15 | 16.00 | 3.55 | 0.49 | −0.50–1.48 | ||
| 3 | 355 | 171.72 | 14.40 | 0.76 | −0.74–2.27 | 8.33 | 1.09 | 0.06 | −0.06–0.17 | ||
| 4 | 432 | 177.36 | 11.63 | 0.56 | −0.54–1.66 | 6.08 | 0.42 | 0.02 | −0.02–0.06 | ||
| 1 | hclust | 896 | 164.53 | 34.80 | 1.16 | −1.12–3.44 | 7.06 | 1.76 | 0.06 | −0.06–0.17 | |
| 2 | 35 | 164.59 | 16.89 | 2.85 | −2.95–8.66 | 17.57 | 3.27 | 0.55 | −0.57–1.67 | ||
| 1 | kmeans | 72 | 64.94 | 35.14 | 4.14 | −4.12–12.40 | 5.19 | 2.50 | 0.29 | −0.29–0.88 | |
| 2 | 807 | 173.55 | 15.33 | 0.54 | −0.52–1.60 | 7.10 | 1.37 | 0.05 | −0.05–0.14 | ||
| 3 | 52 | 162.58 | 26.75 | 3.71 | −3.74–11.15 | 16.00 | 3.55 | 0.49 | −0.50–1.48 | ||
| 1 | pam | 86 | 72.50 | 37.38 | 4.03 | −3.98–12.05 | 5.86 | 2.98 | 0.32 | −0.32–0.96 | |
| 2 | 845 | 173.90 | 14.28 | 0.49 | −0.47–1.46 | 7.62 | 2.64 | 0.09 | −0.09–0.27 | ||
| graduation–dropout | 1 | clara | 863 | 153.08 | 34.28 | 1.17 | −1.12–3.46 | 7.16 | 1.31 | 0.04 | −0.04–0.13 |
| 2 | 459 | 133.60 | 56.34 | 2.63 | −2.54–7.80 | 12.50 | 2.79 | 0.13 | −0.13–0.39 | ||
| 1 | hclust | 1307 | 146.19 | 44.26 | 1.22 | −1.18–3.63 | 8.88 | 2.98 | 0.08 | −0.08–0.24 | |
| 2 | 15 | 157.23 | 37.98 | 9.81 | −11.23–30.84 | 20.40 | 1.59 | 0.41 | −0.47–1.29 | ||
| 1 | kmeans | 128 | 26.68 | 28.70 | 2.54 | −2.48–7.56 | 11.13 | 4.63 | 0.41 | −0.40–1.22 | |
| 2 | 1194 | 159.14 | 19.36 | 0.56 | −0.54–1.66 | 8.79 | 2.93 | 0.08 | −0.08–0.25 | ||
| 1 | pam | 829 | 158.74 | 20.14 | 0.70 | −0.67–2.07 | 7.19 | 1.30 | 0.05 | −0.04–0.13 | |
| 2 | 372 | 158.75 | 19.90 | 1.03 | −1.00–3.06 | 12.47 | 2.57 | 0.13 | −0.13–0.39 | ||
| 3 | 121 | 23.00 | 24.53 | 2.23 | −2.18–6.64 | 10.85 | 4.23 | 0.38 | −0.38–1.15 | ||
| graduation–graduation | 1 | clara | 44 | 120.10 | 27.07 | 4.08 | −4.15–12.31 | 12.05 | 2.27 | 0.34 | −0.35–1.03 |
| 2 | 74 | 153.16 | 17.44 | 2.03 | −2.01–6.07 | 7.41 | 1.19 | 0.14 | −0.14–0.41 | ||
| 3 | 44 | 164.86 | 14.41 | 2.17 | −2.21–6.55 | 13.07 | 2.82 | 0.43 | −0.43–1.28 | ||
| 1 | hclust | 149 | 151.96 | 17.97 | 1.47 | −1.44–4.38 | 10.05 | 2.97 | 0.24 | −0.24–0.72 | |
| 2 | 10 | 75.30 | 29.74 | 9.40 | −11.87–30.68 | 9.40 | 3.50 | 1.11 | −1.40–3.61 | ||
| 3 | 3 | 159.17 | 3.62 | 2.09 | −6.9–11.07 | 20.67 | 1.53 | 0.88 | −2.91–4.68 | ||
| 1 | kmeans | 76 | 152.07 | 13.44 | 1.54 | −1.53–4.61 | 7.62 | 1.23 | 0.14 | −0.14–0.42 | |
| 2 | 44 | 136.18 | 14.87 | 2.24 | −2.28–6.76 | 13.95 | 2.59 | 0.39 | −0.40–1.18 | ||
| 3 | 9 | 74.22 | 31.33 | 10.44 | −13.64–34.53 | 8.56 | 2.40 | 0.80 | −1.05–2.65 | ||
| 4 | 33 | 171.35 | 13.77 | 2.40 | −2.49–7.28 | 11.61 | 1.71 | 0.30 | −0.31–0.91 | ||
| 1 | pam | 70 | 138.40 | 31.98 | 3.82 | −3.80–11.45 | 13.17 | 2.54 | 0.30 | −0.30–0.91 | |
| 2 | 92 | 154.17 | 18.41 | 1.92 | −1.89–5.73 | 7.95 | 1.59 | 0.17 | −0.16–0.49 | ||
| Sociology: bachelor’s programs | |||||||||||
| dropout | 1 | clara | 1071 | 1.55 | 2.82 | 0.09 | −0.08–0.26 | 2.39 | 1.24 | 0.04 | −0.04–0.11 |
| 2 | 983 | 21.94 | 22.26 | 0.71 | −0.68–2.1 | 5.00 | 3.91 | 0.12 | −0.12–0.37 | ||
| 1 | hclust | 2038 | 10.27 | 14.43 | 0.32 | −0.31–0.95 | 3.57 | 3.03 | 0.07 | −0.06–0.20 | |
| 2 | 16 | 142.81 | 18.73 | 4.68 | −5.30–14.66 | 12.56 | 3.22 | 0.81 | −0.91–2.52 | ||
| 1 | kmeans | 1852 | 8.28 | 9.90 | 0.23 | −0.22–0.68 | 2.82 | 1.55 | 0.04 | −0.03–0.11 | |
| 2 | 202 | 39.10 | 41.95 | 2.95 | −2.87–8.77 | 11.15 | 3.91 | 0.28 | −0.27–0.82 | ||
| 1 | pam | 1071 | 2.04 | 3.51 | 0.11 | −0.10–0.32 | 2.20 | 0.95 | 0.03 | −0.03–0.09 | |
| 2 | 983 | 21.41 | 22.62 | 0.72 | −0.69–2.14 | 5.21 | 3.85 | 0.12 | −0.12–0.36 | ||
| dropout–dropout | 1 | clara | 1151 | 16.27 | 27.48 | 0.81 | −0.78–2.40 | 10.34 | 3.39 | 0.10 | −0.10–0.30 |
| 2 | 1519 | 5.60 | 8.50 | 0.22 | −0.21–0.65 | 3.05 | 1.74 | 0.04 | −0.04–0.13 | ||
| 1 | hclust | 2637 | 8.71 | 14.63 | 0.28 | −0.27–0.84 | 6.07 | 4.31 | 0.08 | −0.08–0.25 | |
| 2 | 33 | 128.82 | 24.24 | 4.22 | −4.37–12.81 | 15.79 | 4.01 | 0.7 | −0.72–2.12 | ||
| 1 | kmeans | 1677 | 5.69 | 8.51 | 0.21 | −0.20–0.62 | 3.41 | 2.00 | 0.05 | −0.05–0.14 | |
| 2 | 897 | 9.59 | 11.83 | 0.40 | −0.38–1.17 | 10.85 | 3.11 | 0.10 | −0.10–0.31 | ||
| 3 | 96 | 94.52 | 30.65 | 3.13 | −3.08–9.34 | 11.22 | 4.97 | 0.51 | −0.50–1.51 | ||
| 1 | pam | 1151 | 16.27 | 27.48 | 0.81 | −0.78–2.4 | 10.34 | 3.39 | 0.10 | −0.10–0.30 | |
| 2 | 1519 | 5.60 | 8.5 | 0.22 | −0.21–0.65 | 3.05 | 1.74 | 0.04 | −0.04–0.13 | ||
| graduation | 1 | clara | 33 | 171.29 | 18.92 | 3.29 | −3.41–10 | 13.58 | 4.58 | 0.80 | −0.83–2.42 |
| 2 | 125 | 171.83 | 9.69 | 0.87 | −0.85–2.58 | 7.65 | 1.23 | 0.11 | −0.11–0.33 | ||
| 3 | 37 | 122.45 | 36.14 | 5.94 | −6.11–17.99 | 8.89 | 2.70 | 0.44 | −0.46–1.34 | ||
| 1 | hclust | 192 | 164.65 | 20.13 | 1.45 | −1.41–4.32 | 8.89 | 3.17 | 0.23 | −0.22–0.68 | |
| 2 | 3 | 16.33 | 15.95 | 9.21 | −30.41–48.82 | 9.00 | 7.55 | 4.36 | −14.4–23.11 | ||
| 1 | kmeans | 180 | 166.94 | 17.32 | 1.29 | −1.26–3.84 | 8.34 | 1.93 | 0.14 | −0.14–0.43 | |
| 2 | 15 | 107.53 | 53.66 | 13.86 | −15.86–43.57 | 15.40 | 6.97 | 1.80 | −2.06–5.66 | ||
| 1 | pam | 6 | 149.42 | 19.90 | 8.13 | −12.76–29.01 | 22.50 | 2.66 | 1.09 | −1.71–3.88 | |
| 2 | 135 | 173.71 | 10.68 | 0.92 | −0.90–2.74 | 7.93 | 1.58 | 0.14 | −0.13–0.4 | ||
| 3 | 54 | 135.44 | 35.85 | 4.88 | −4.91–14.66 | 9.76 | 2.72 | 0.37 | −0.37–1.11 | ||
| graduation–dropout | 1 | clara | 678 | 8.55 | 11.98 | 0.46 | −0.44–1.36 | 7.64 | 1.48 | 0.06 | −0.05–0.17 |
| 2 | 260 | 18.18 | 32.07 | 1.99 | −1.93–5.91 | 13.60 | 2.81 | 0.17 | −0.17–0.52 | ||
| 3 | 298 | 157.65 | 22.16 | 1.28 | −1.24–3.81 | 8.49 | 2.14 | 0.12 | −0.12–0.37 | ||
| 1 | hclust | 1159 | 47.54 | 66.85 | 1.96 | −1.89–5.82 | 8.57 | 2.26 | 0.07 | −0.06–0.20 | |
| 2 | 77 | 31.26 | 48.91 | 5.57 | −5.53–16.67 | 17.16 | 2.42 | 0.28 | −0.27–0.83 | ||
| 1 | kmeans | 300 | 157.25 | 22.62 | 1.31 | −1.26–3.88 | 8.51 | 2.15 | 0.12 | −0.12–0.37 | |
| 2 | 678 | 8.55 | 11.98 | 0.46 | −0.44–1.36 | 7.64 | 1.48 | 0.06 | −0.05–0.17 | ||
| 3 | 258 | 17.56 | 31.40 | 1.95 | −1.89–5.8 | 13.62 | 2.81 | 0.18 | −0.17–0.52 | ||
| 1 | pam | 600 | 8.72 | 12.09 | 0.49 | −0.48–1.46 | 7.34 | 1.29 | 0.05 | −0.05–0.16 | |
| 2 | 339 | 15.89 | 29.27 | 1.59 | −1.54–4.72 | 12.76 | 2.89 | 0.16 | −0.15–0.47 | ||
| 3 | 297 | 157.86 | 21.90 | 1.27 | −1.23–3.77 | 8.48 | 2.14 | 0.12 | −0.12–0.37 | ||
Disclaimer/Publisher’s Note: The statements, opinions and data contained in all publications are solely those of the individual author(s) and contributor(s) and not of MDPI and/or the editor(s). MDPI and/or the editor(s) disclaim responsibility for any injury to people or property resulting from any ideas, methods, instructions or products referred to in the content. |
© 2024 by the author. Licensee MDPI, Basel, Switzerland. This article is an open access article distributed under the terms and conditions of the Creative Commons Attribution (CC BY) license (https://creativecommons.org/licenses/by/4.0/).
Share and Cite
Loder, A.K.F. Multiple Enrollment Policy: Clustering Dropout and Graduation Constellations in Psychology and Sociology Bachelor’s Programs. Trends High. Educ. 2024, 3, 373-407. https://doi.org/10.3390/higheredu3020023
Loder AKF. Multiple Enrollment Policy: Clustering Dropout and Graduation Constellations in Psychology and Sociology Bachelor’s Programs. Trends in Higher Education. 2024; 3(2):373-407. https://doi.org/10.3390/higheredu3020023
Chicago/Turabian StyleLoder, Alexander Karl Ferdinand. 2024. "Multiple Enrollment Policy: Clustering Dropout and Graduation Constellations in Psychology and Sociology Bachelor’s Programs" Trends in Higher Education 3, no. 2: 373-407. https://doi.org/10.3390/higheredu3020023
APA StyleLoder, A. K. F. (2024). Multiple Enrollment Policy: Clustering Dropout and Graduation Constellations in Psychology and Sociology Bachelor’s Programs. Trends in Higher Education, 3(2), 373-407. https://doi.org/10.3390/higheredu3020023