
Infrared Spectroscopy and Photochemistry of Ethyl Maltol in Low-Temperature Argon Matrix


Abstract
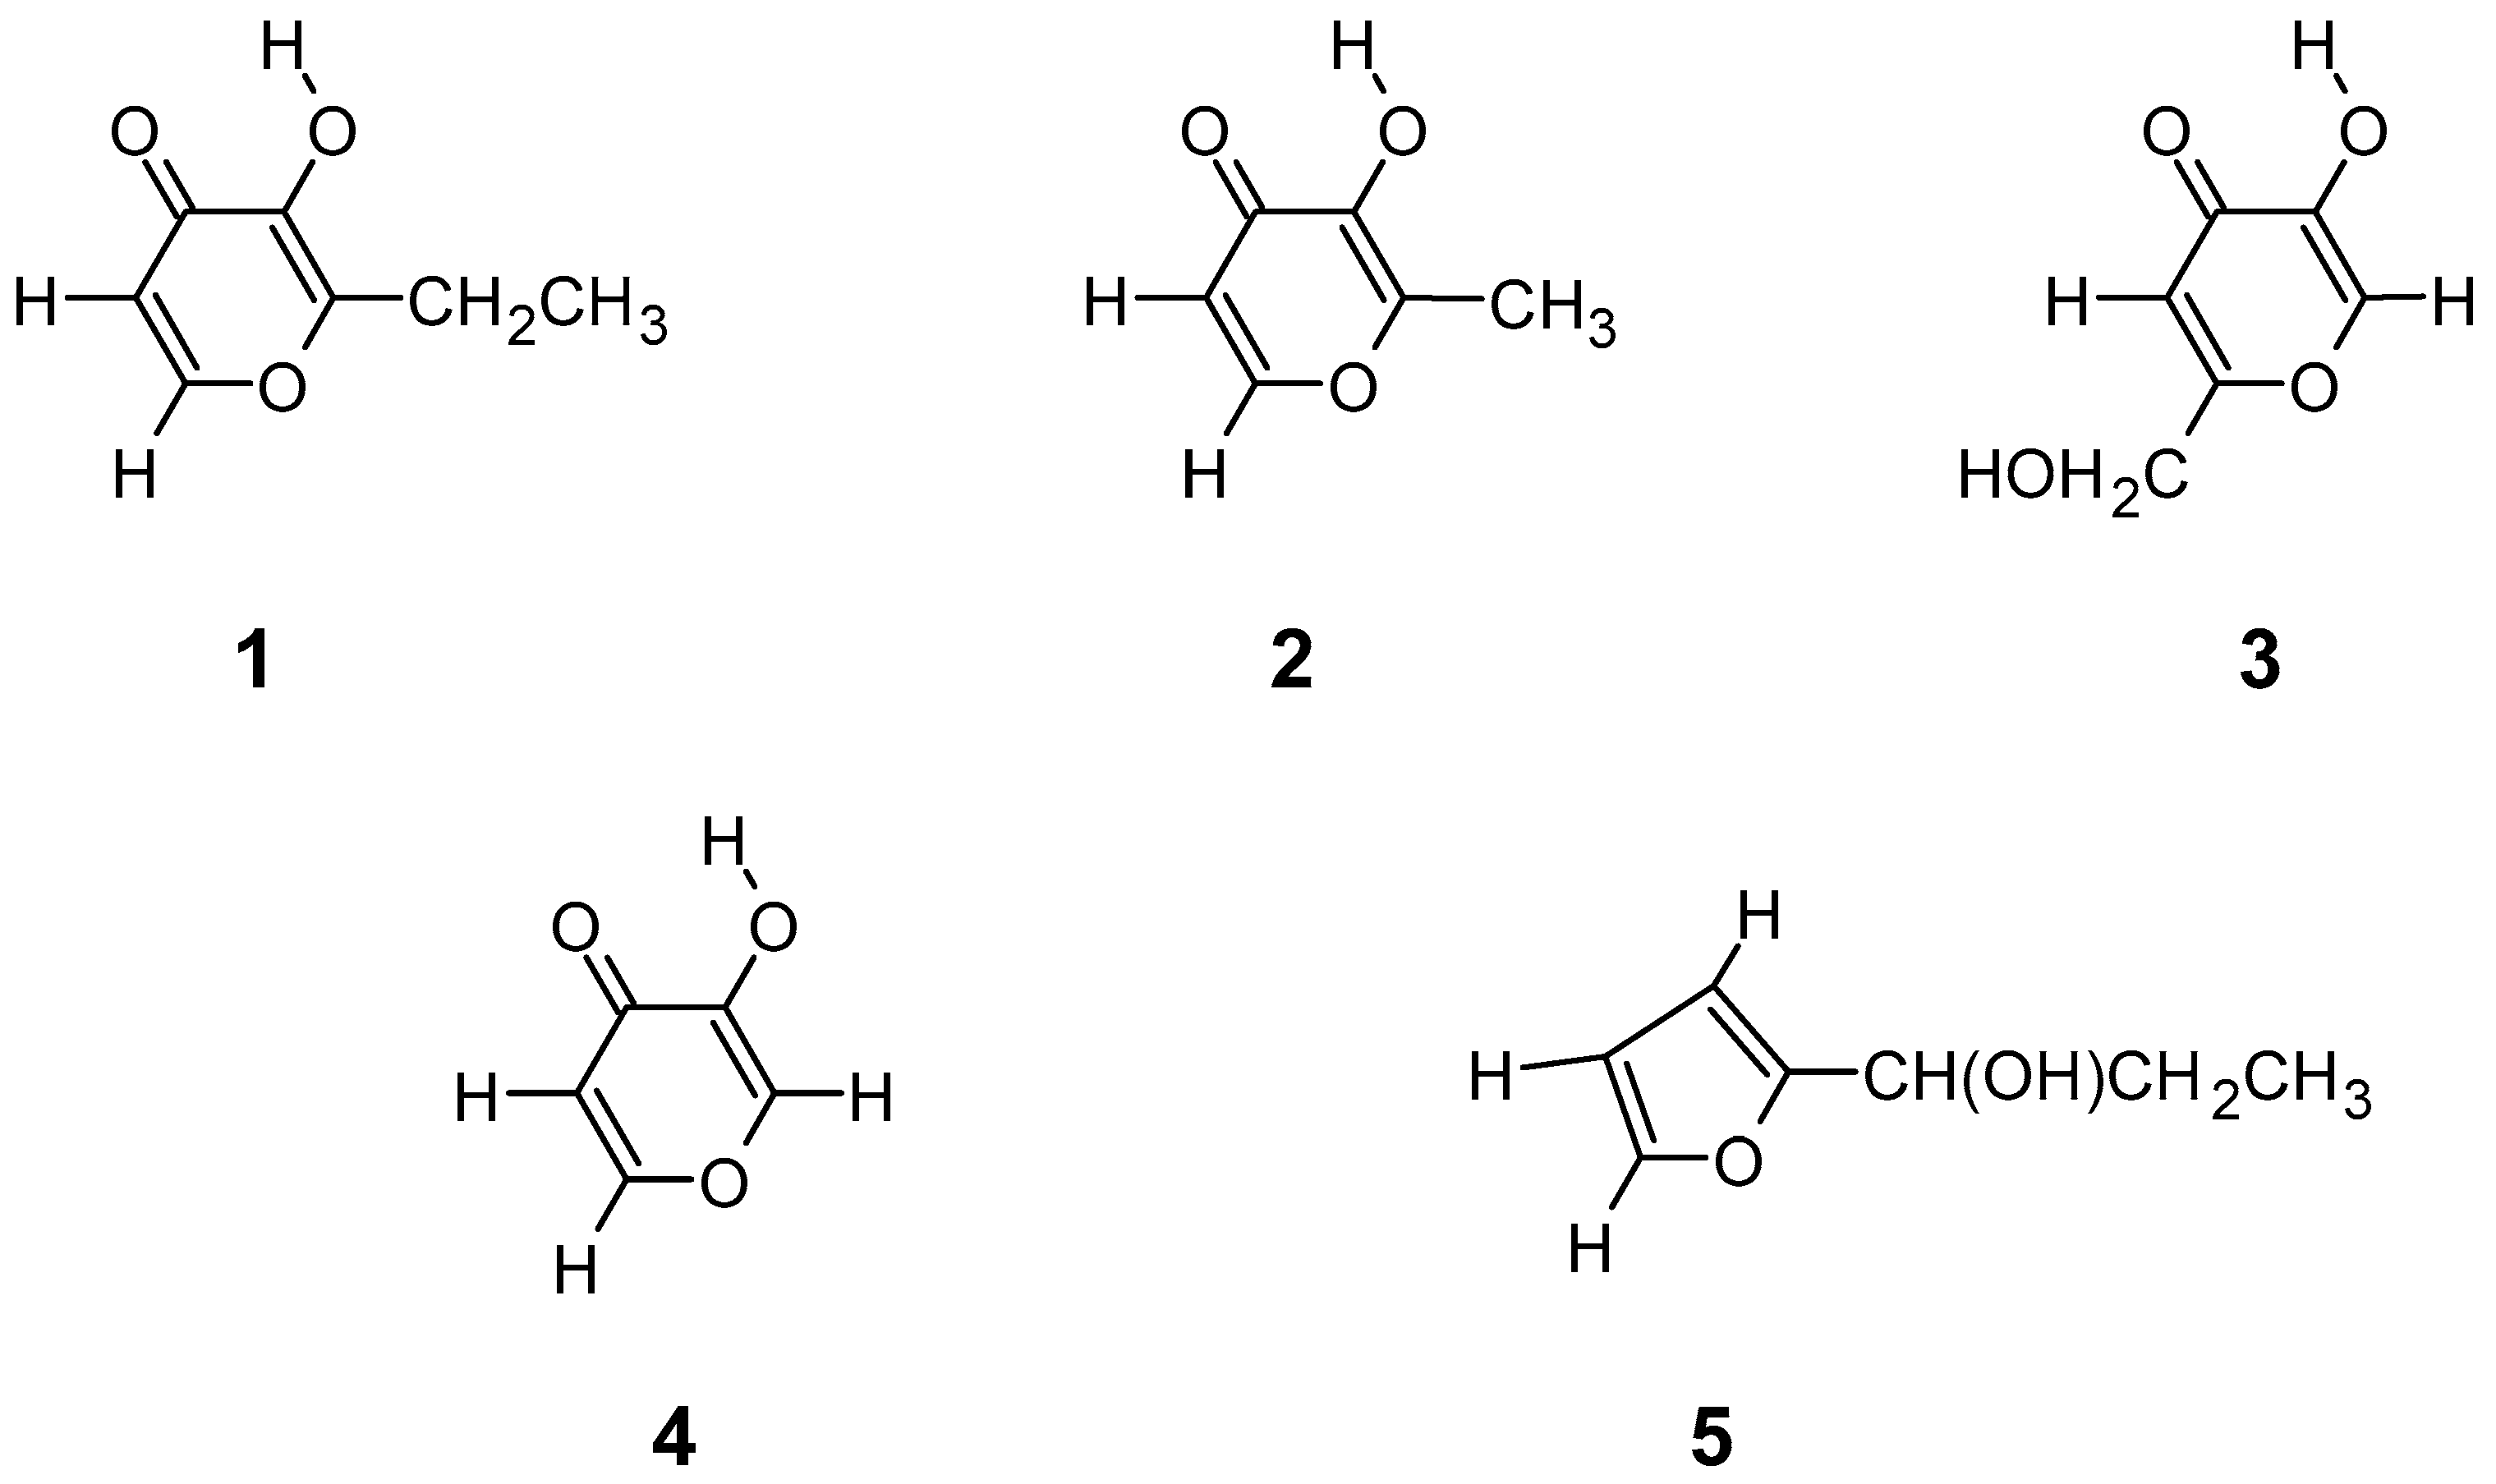
:1. Introduction
2. Experimental Methods
3. Computational Details
4. Results and Discussion
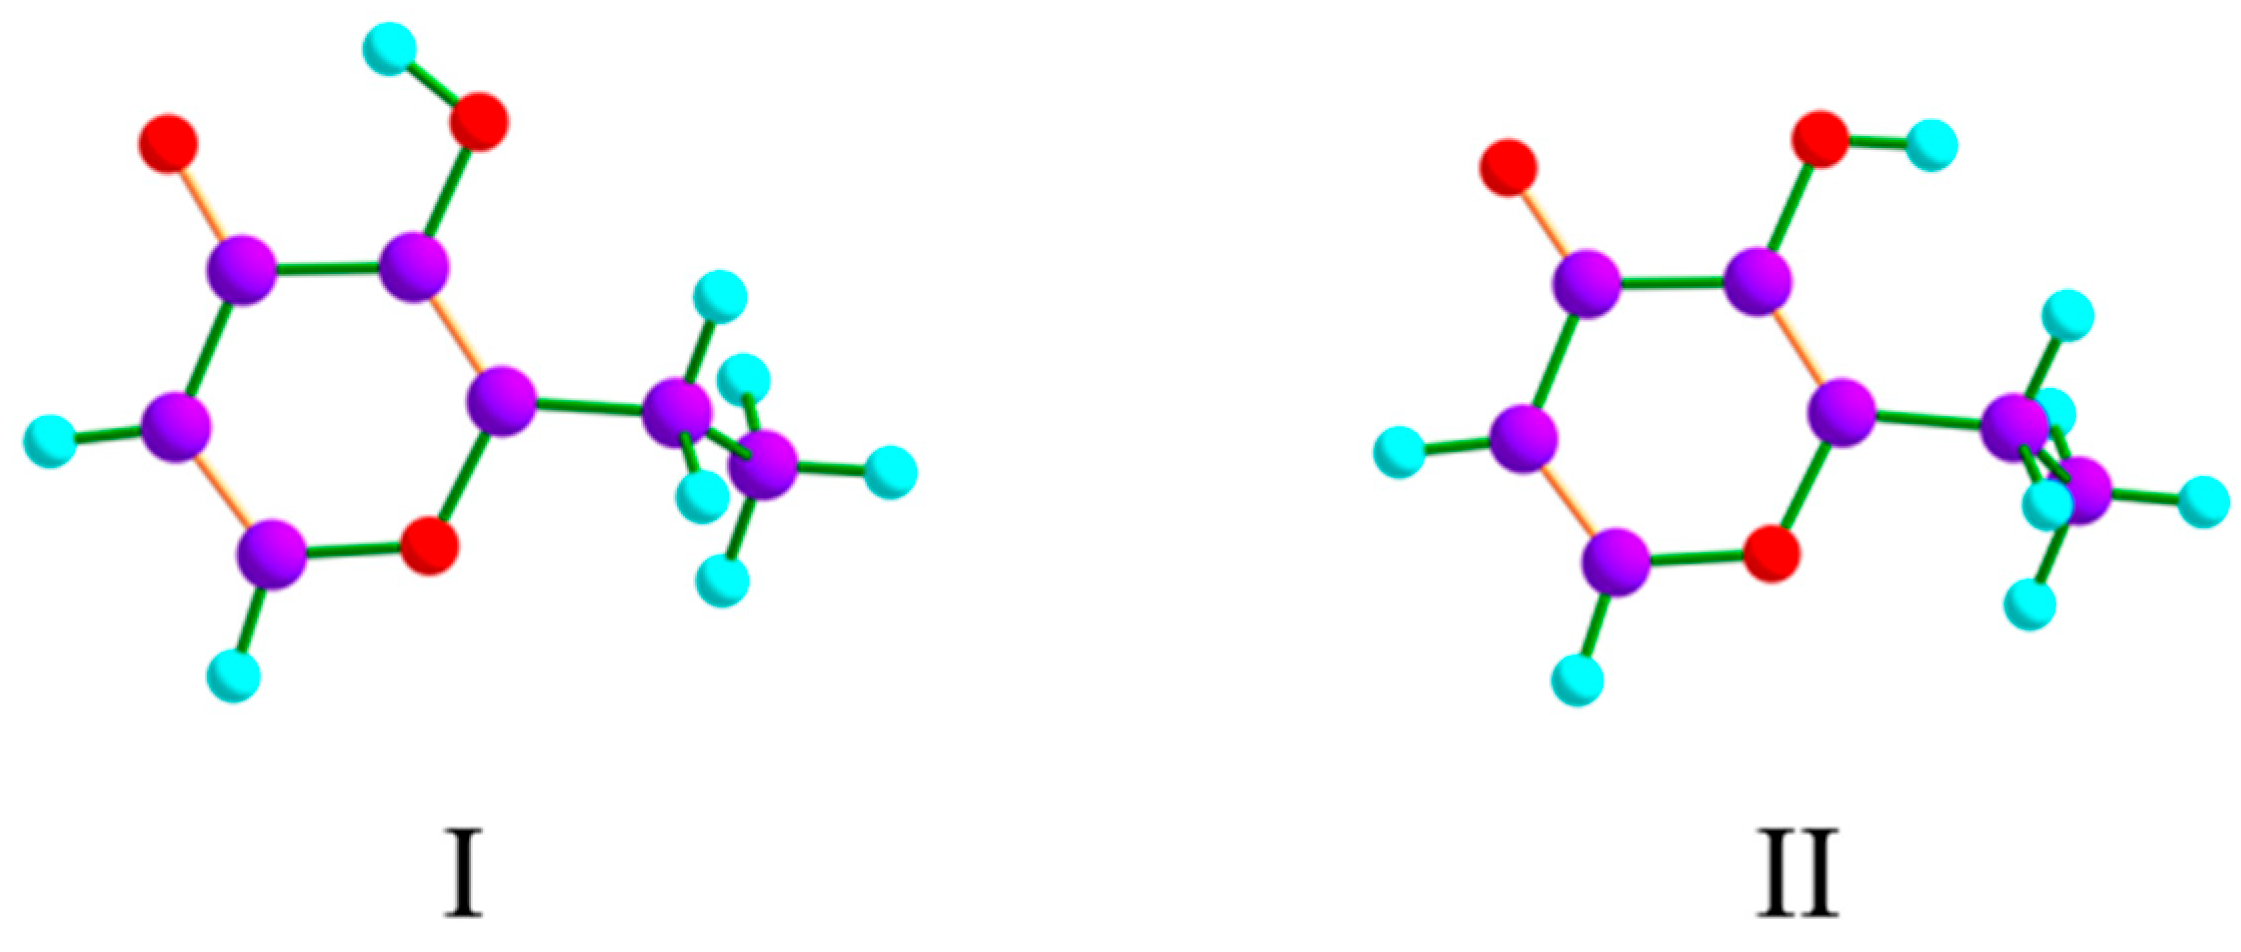
4.1. DFT Calculations: Conformers, Relative Energies, and Isomerization Barriers
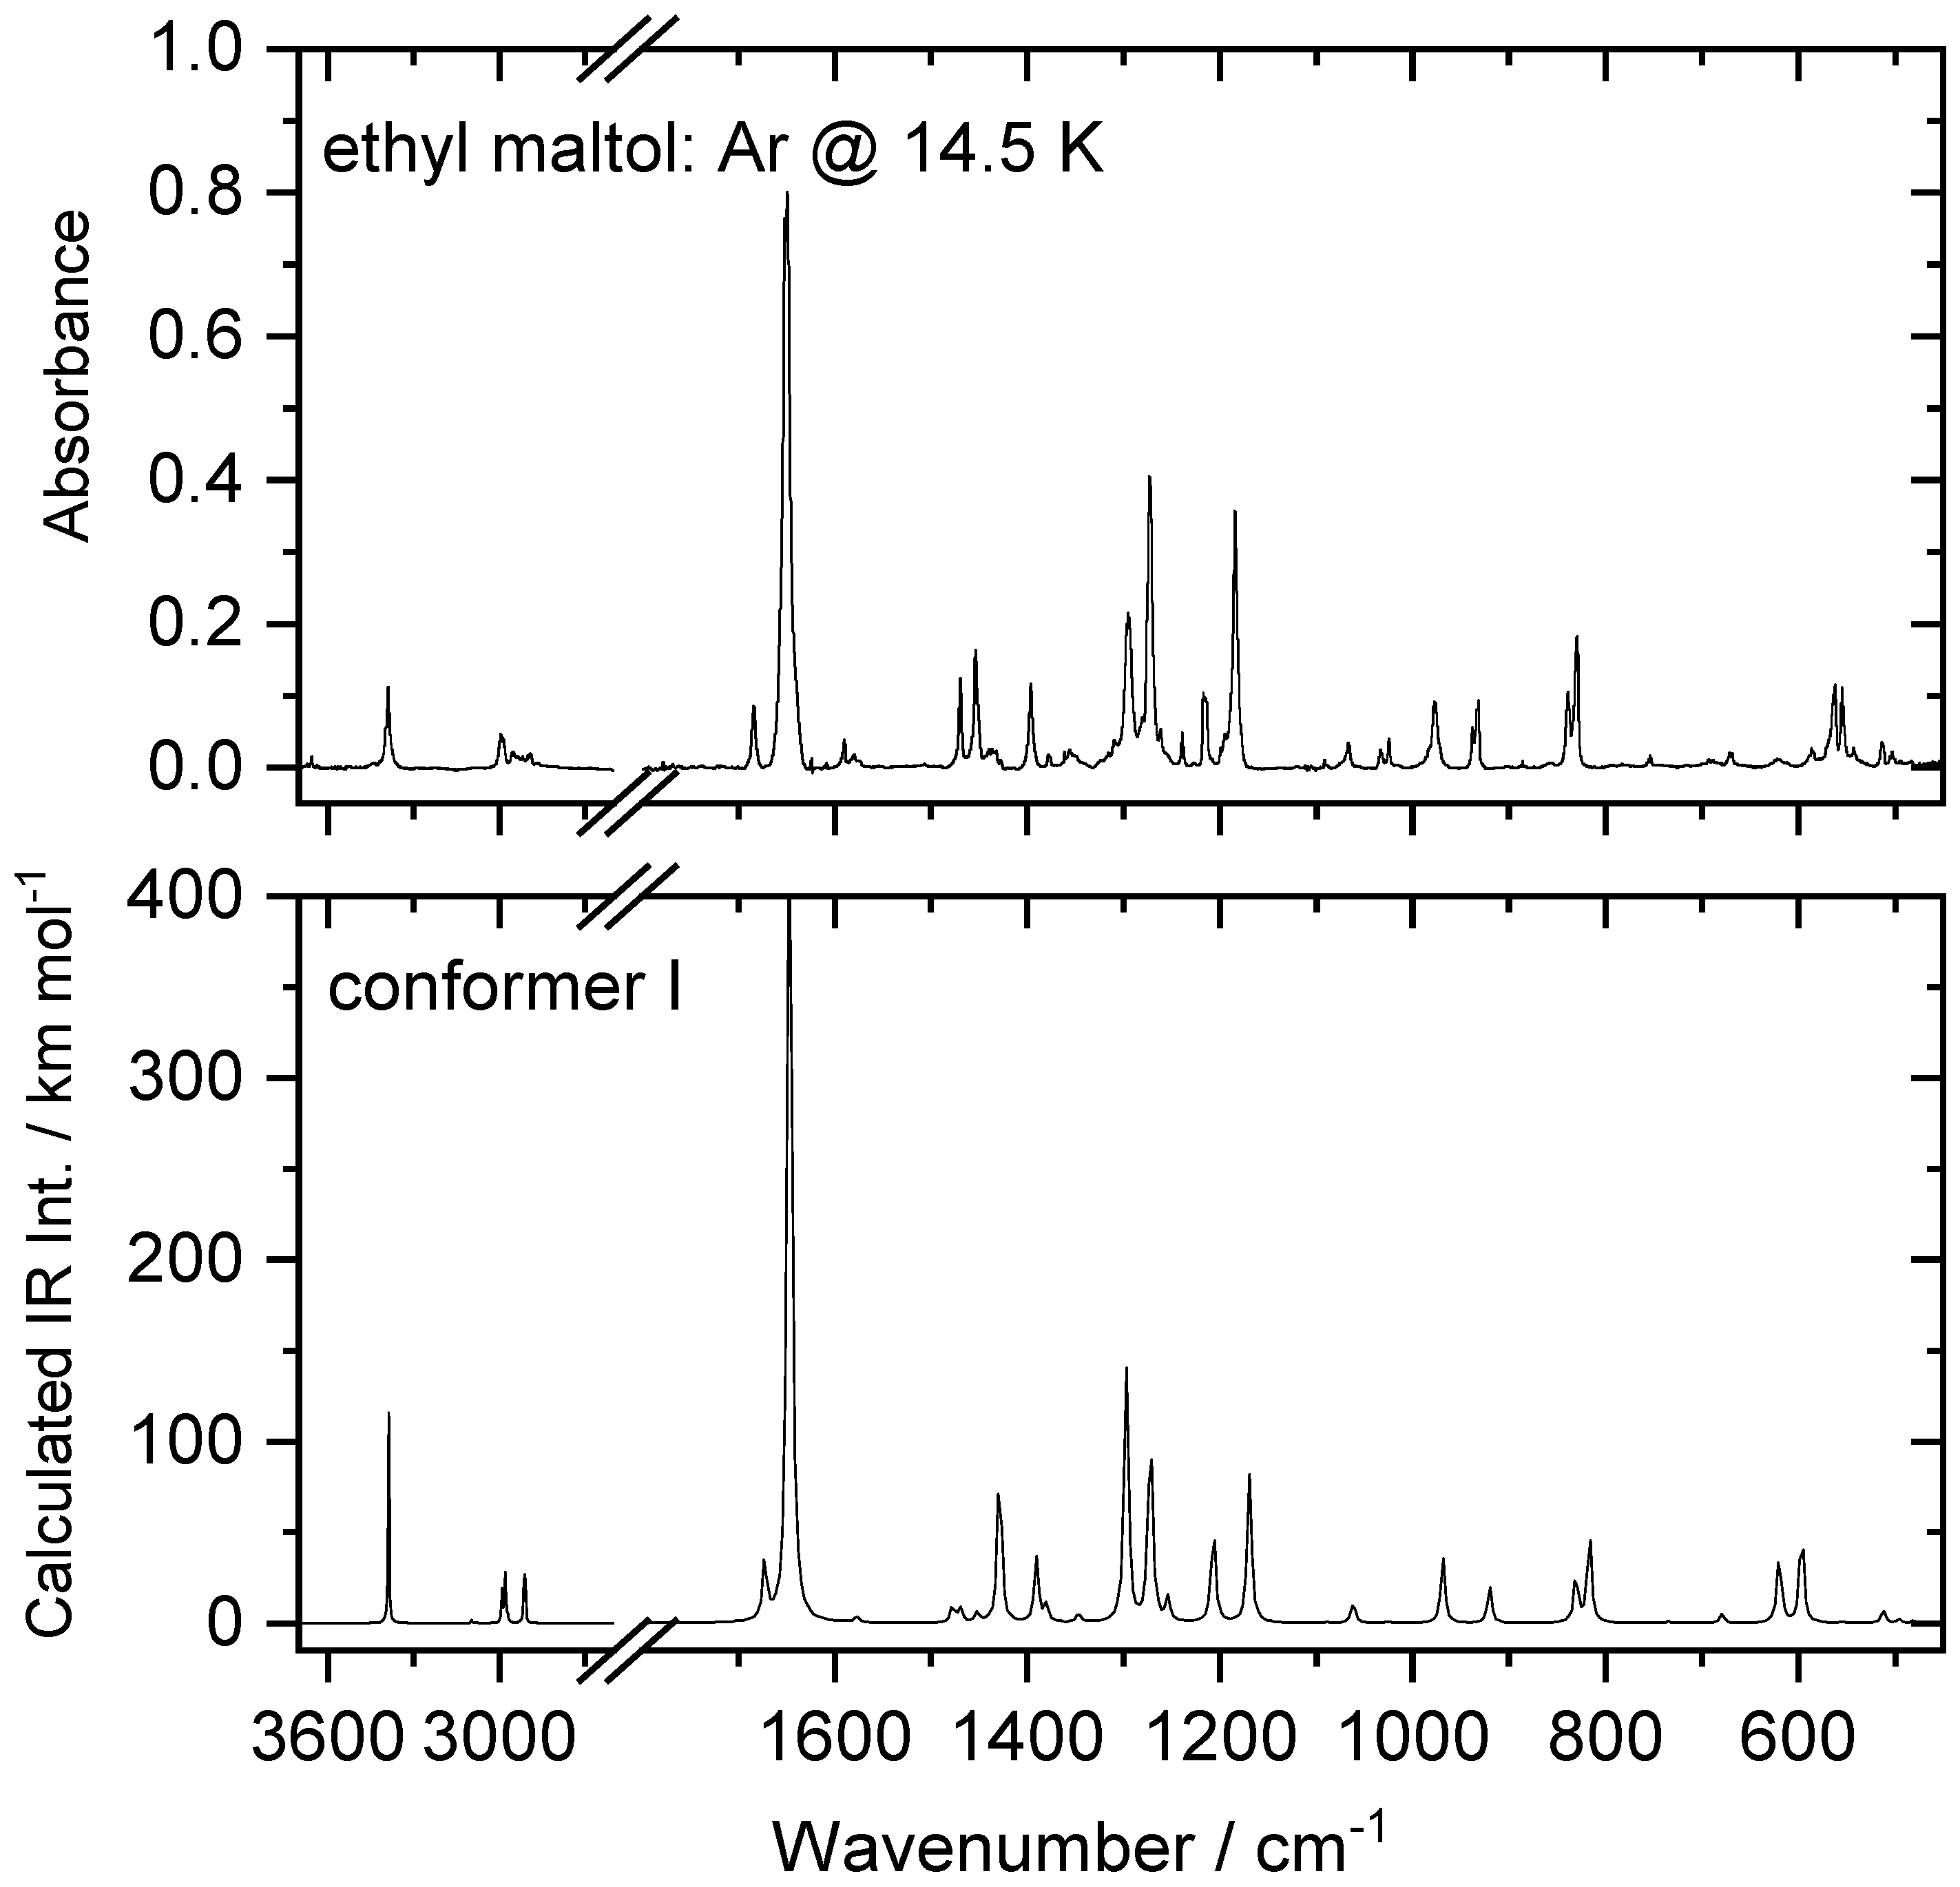
4.2. IR Spectrum of Matrix-Isolated Ethyl Maltol
4.3. Annealing Experiments
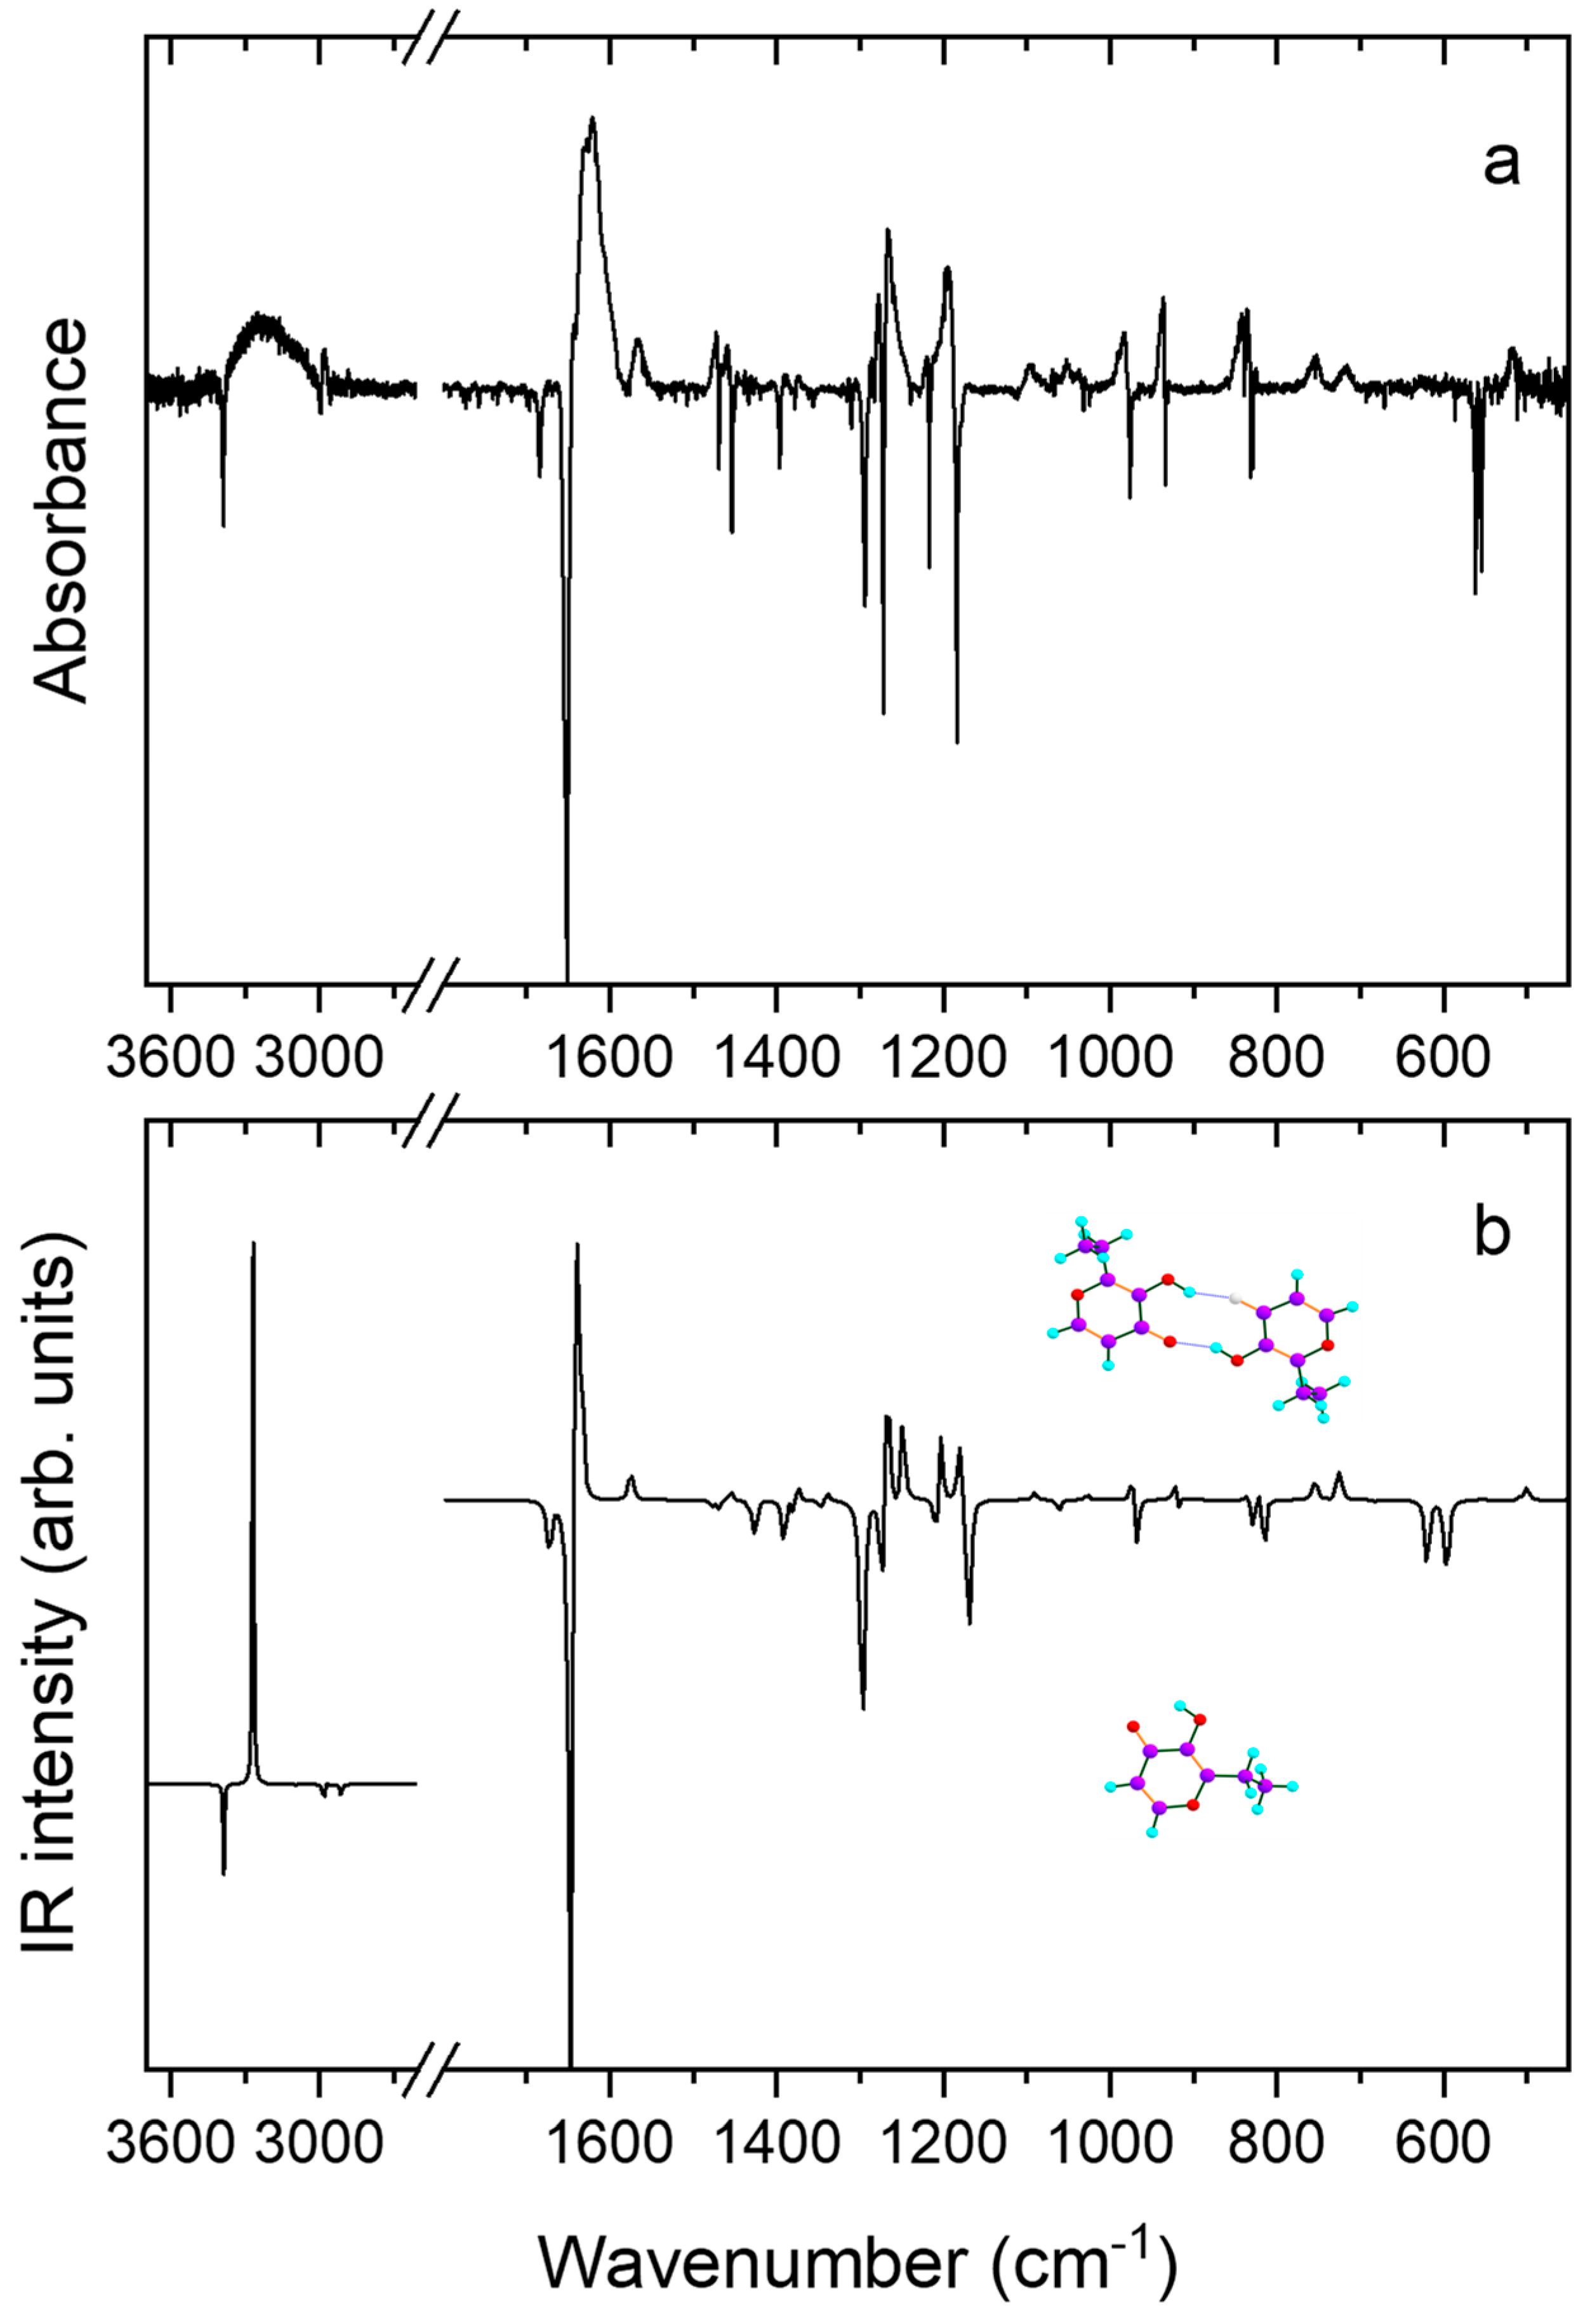
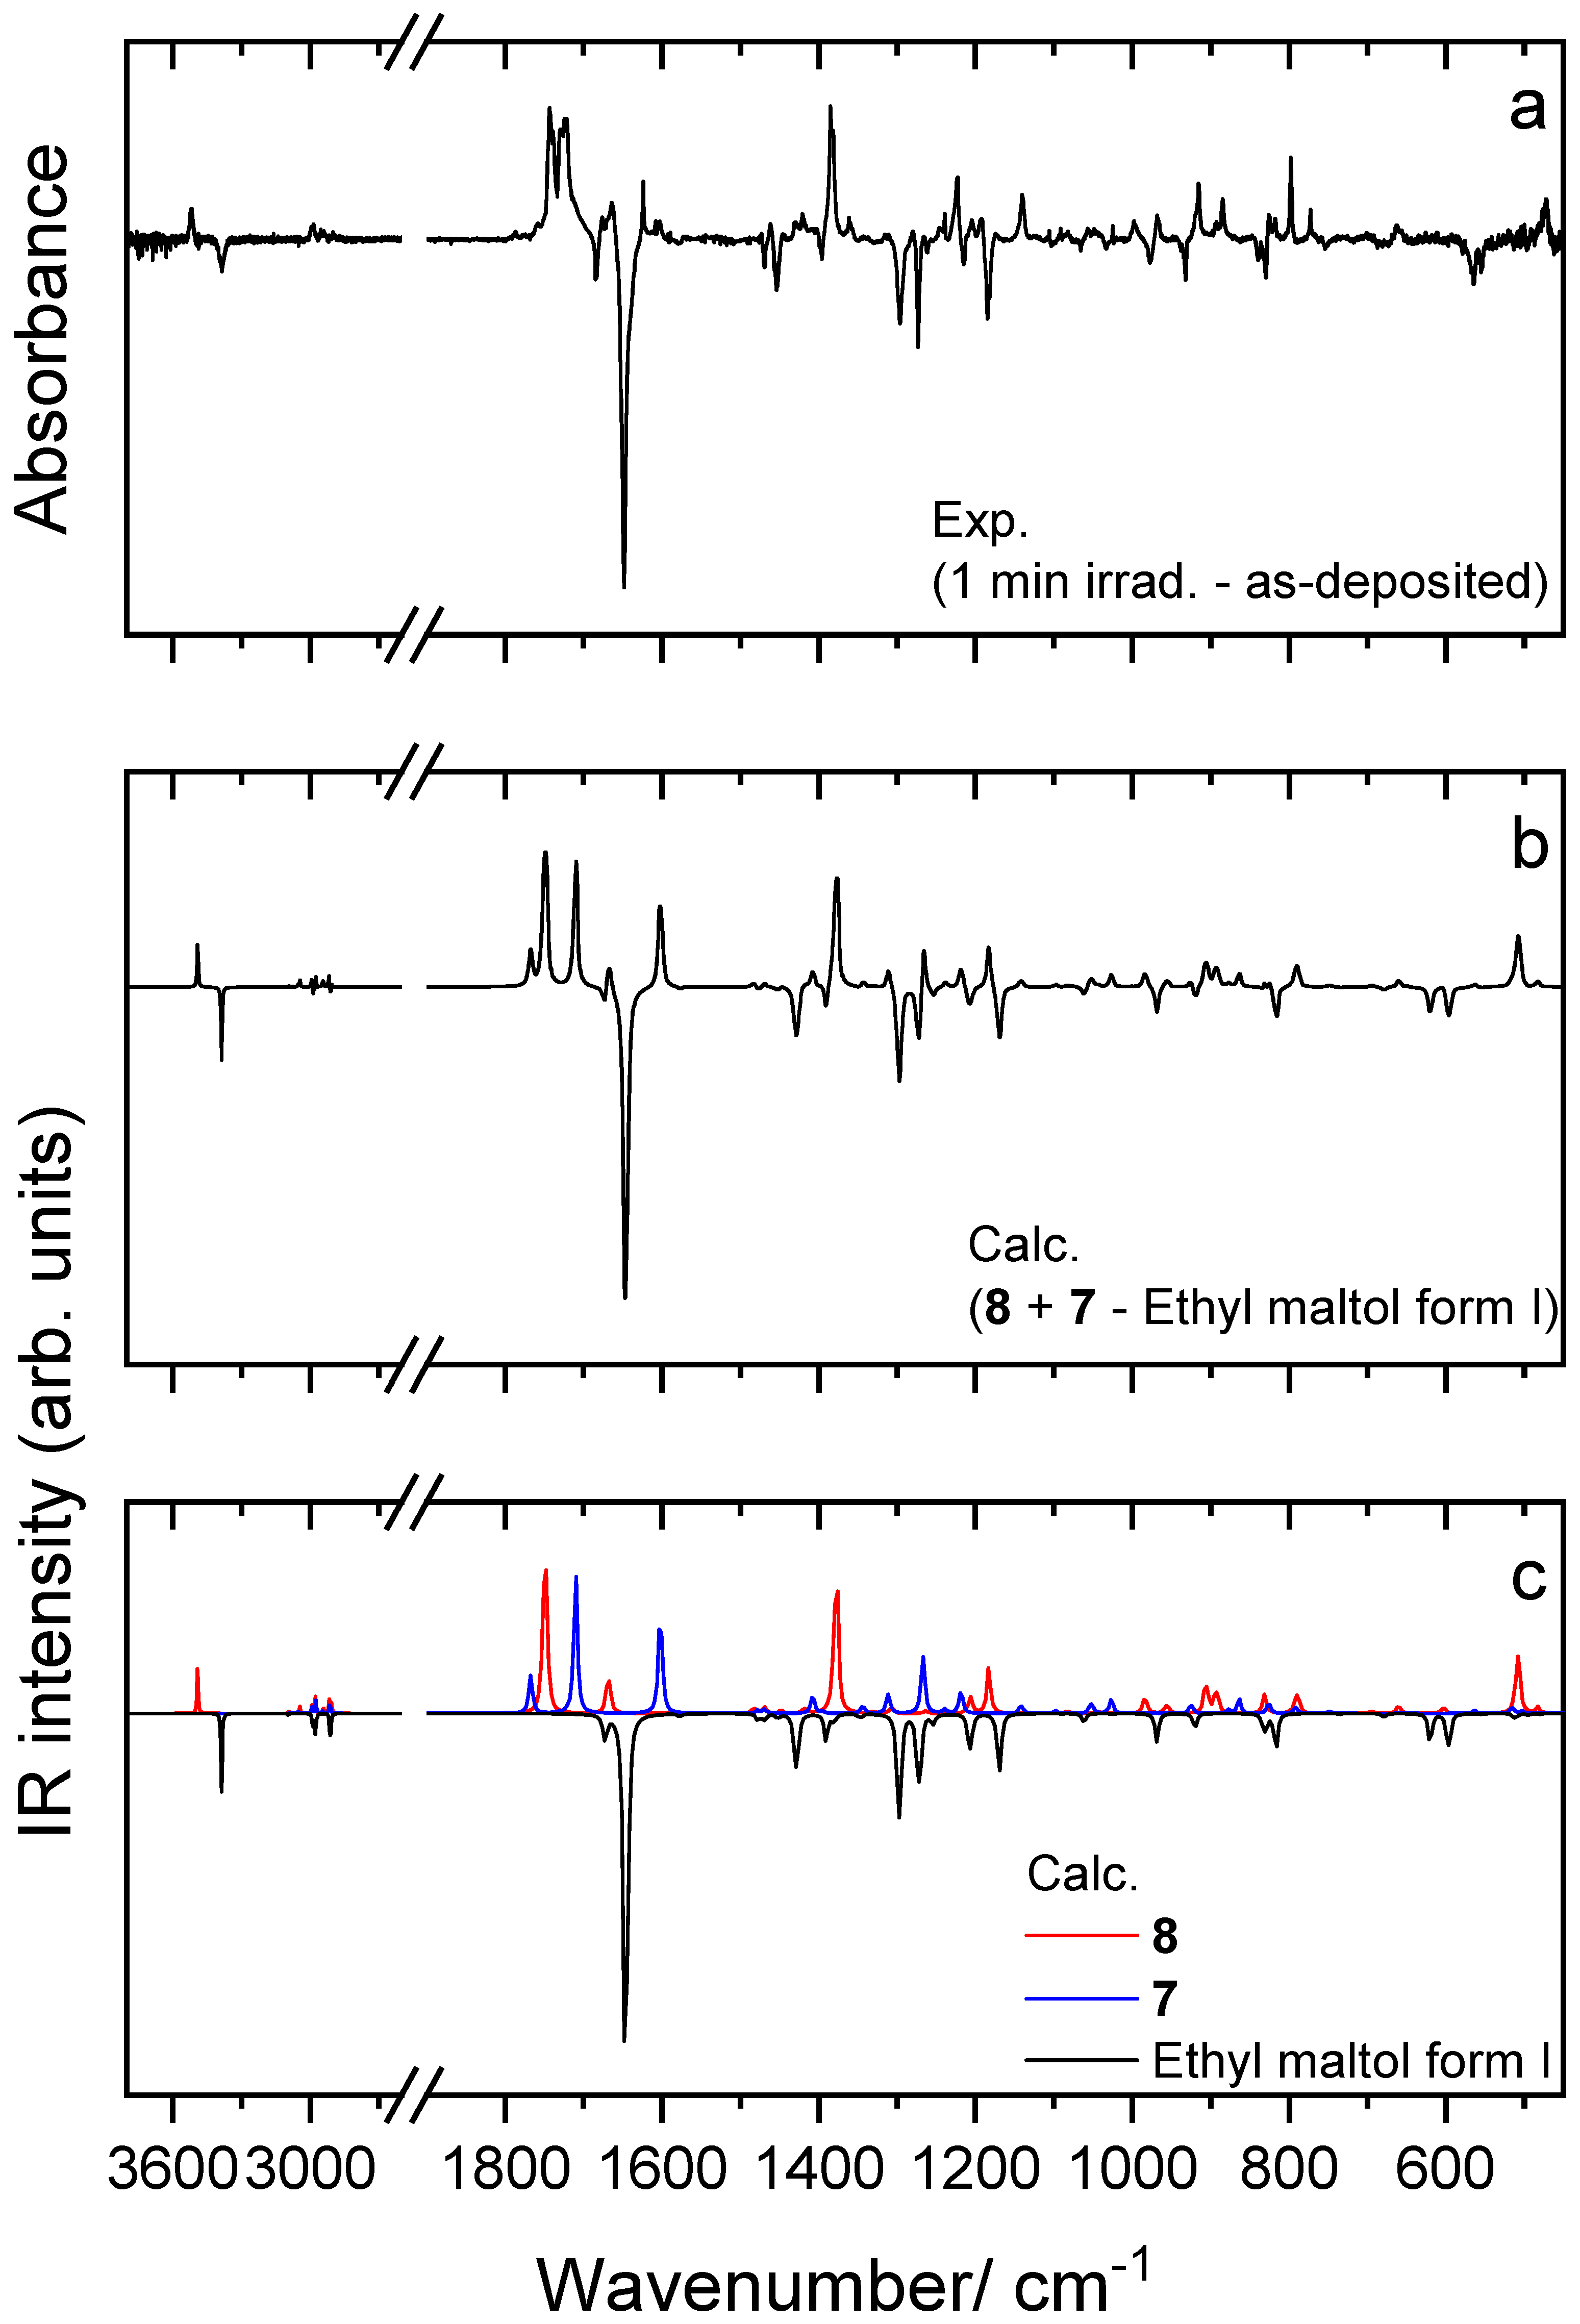
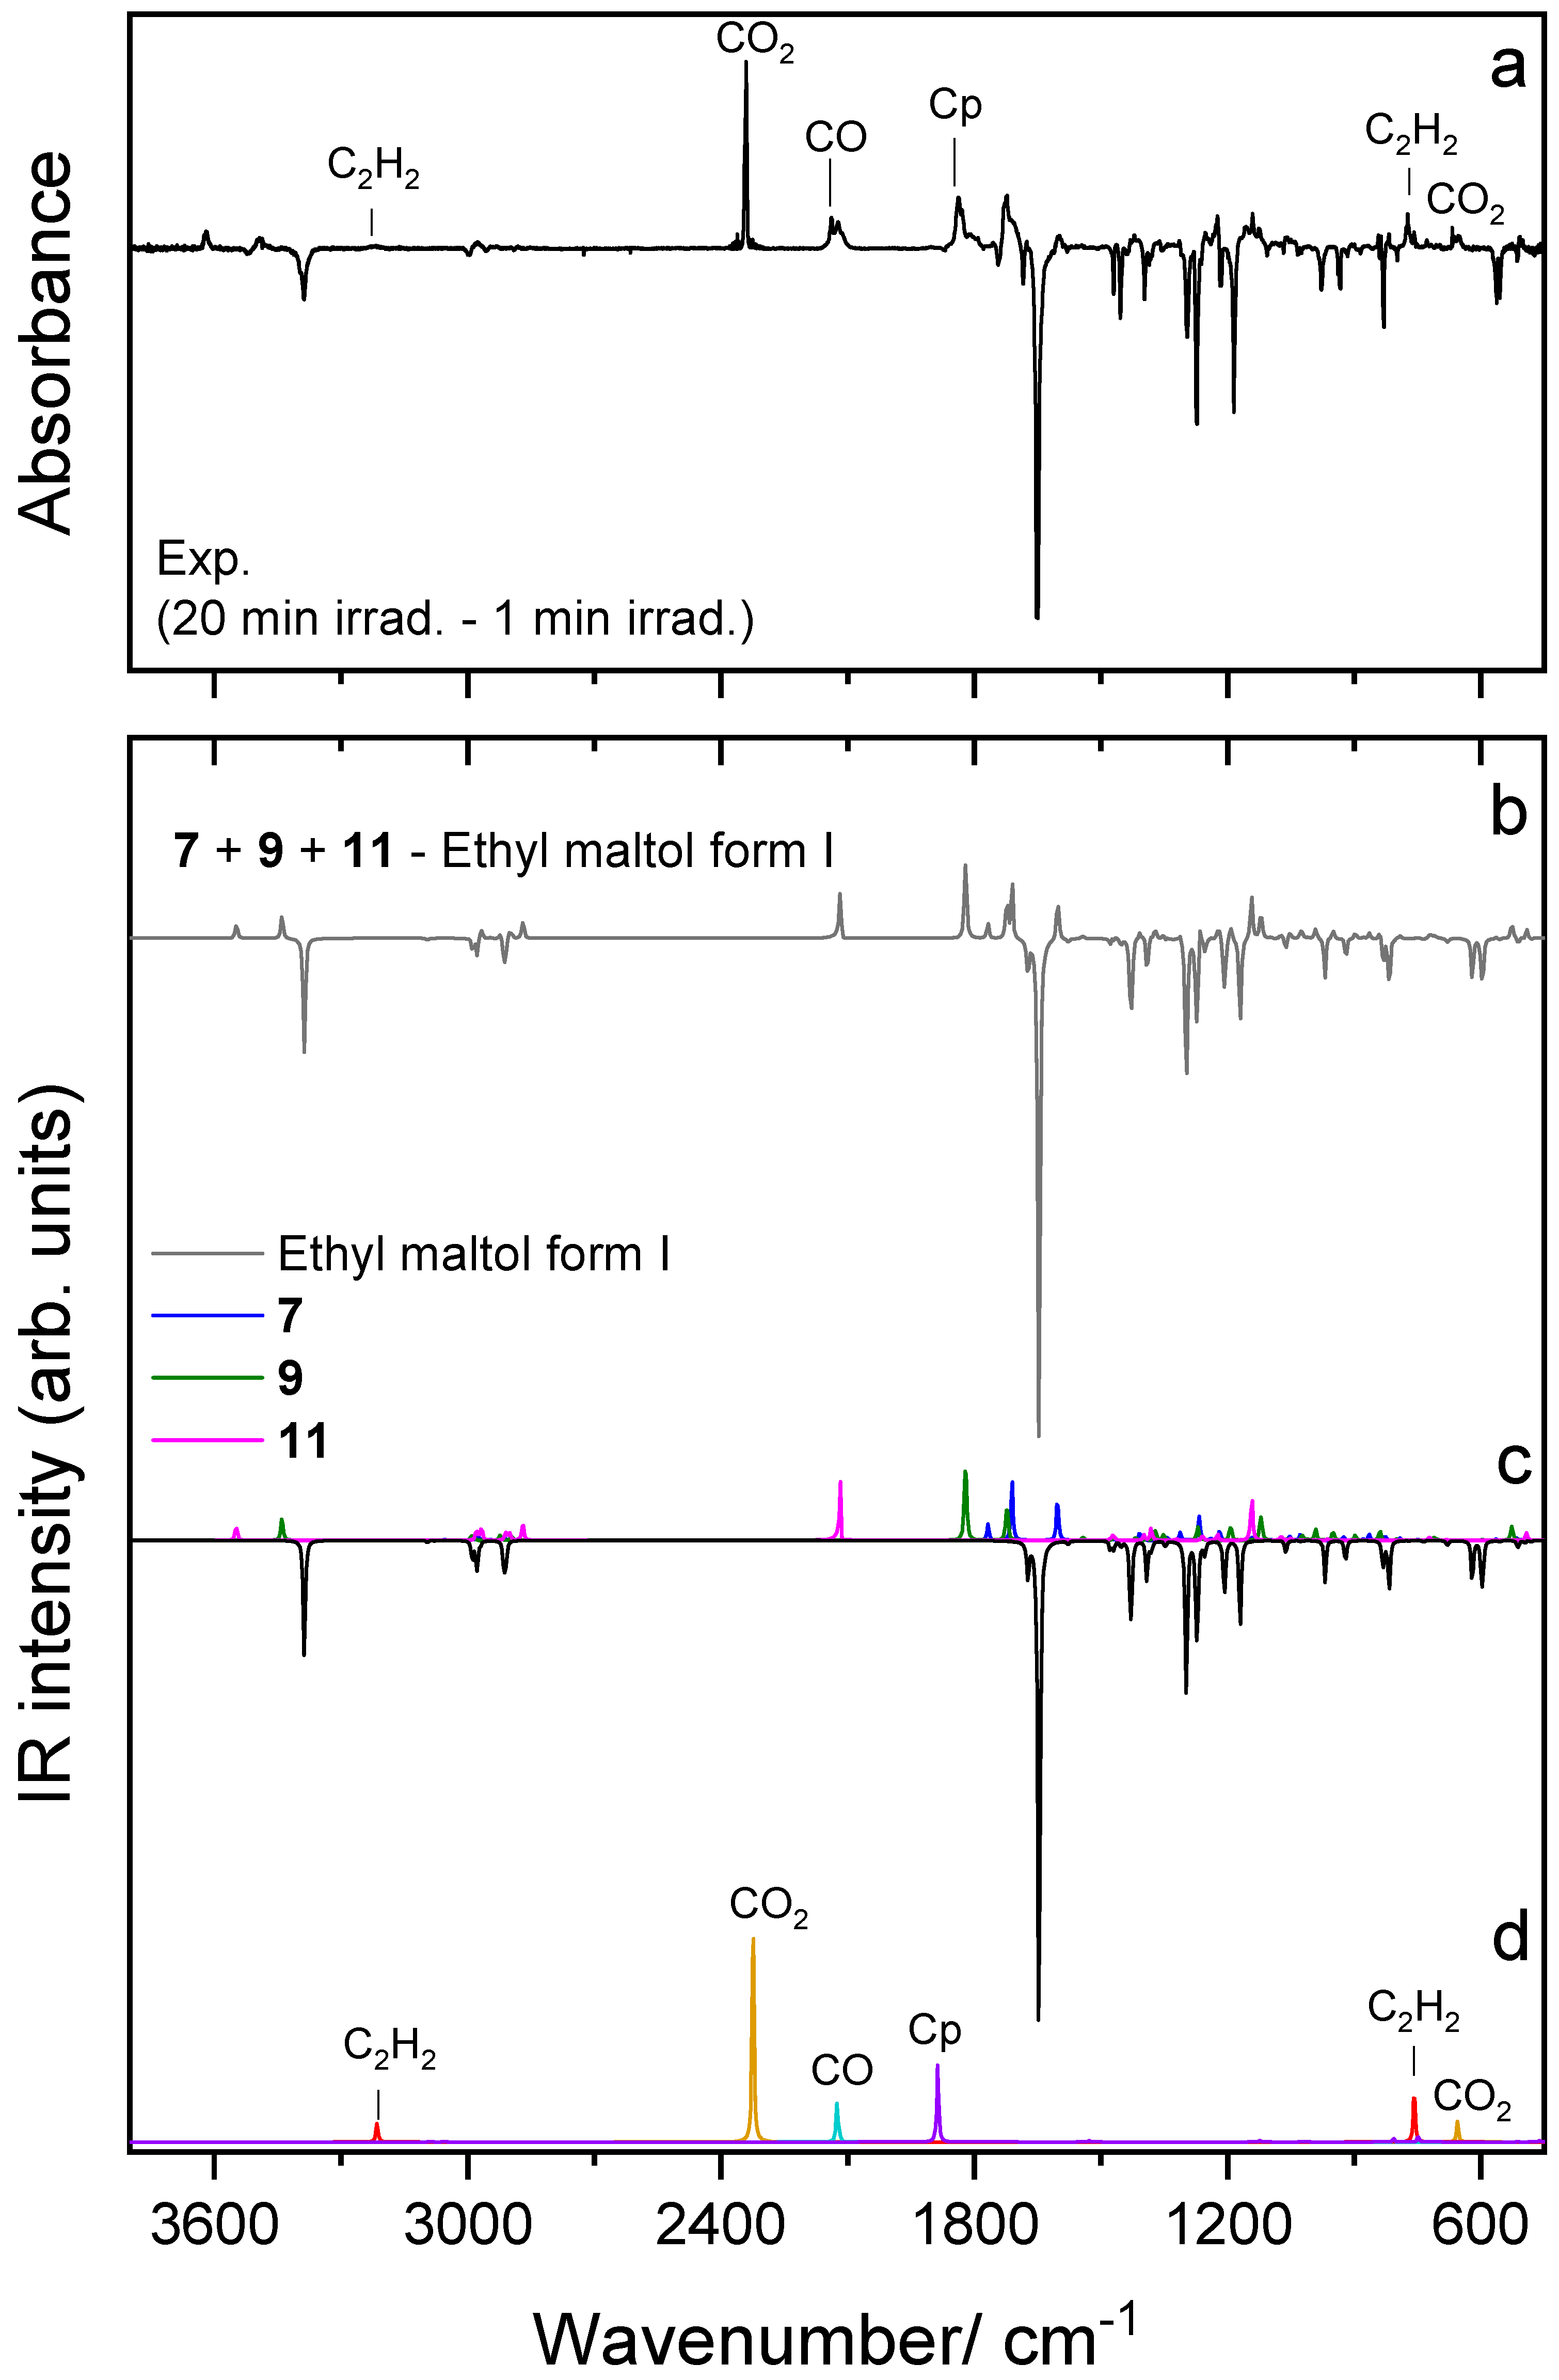
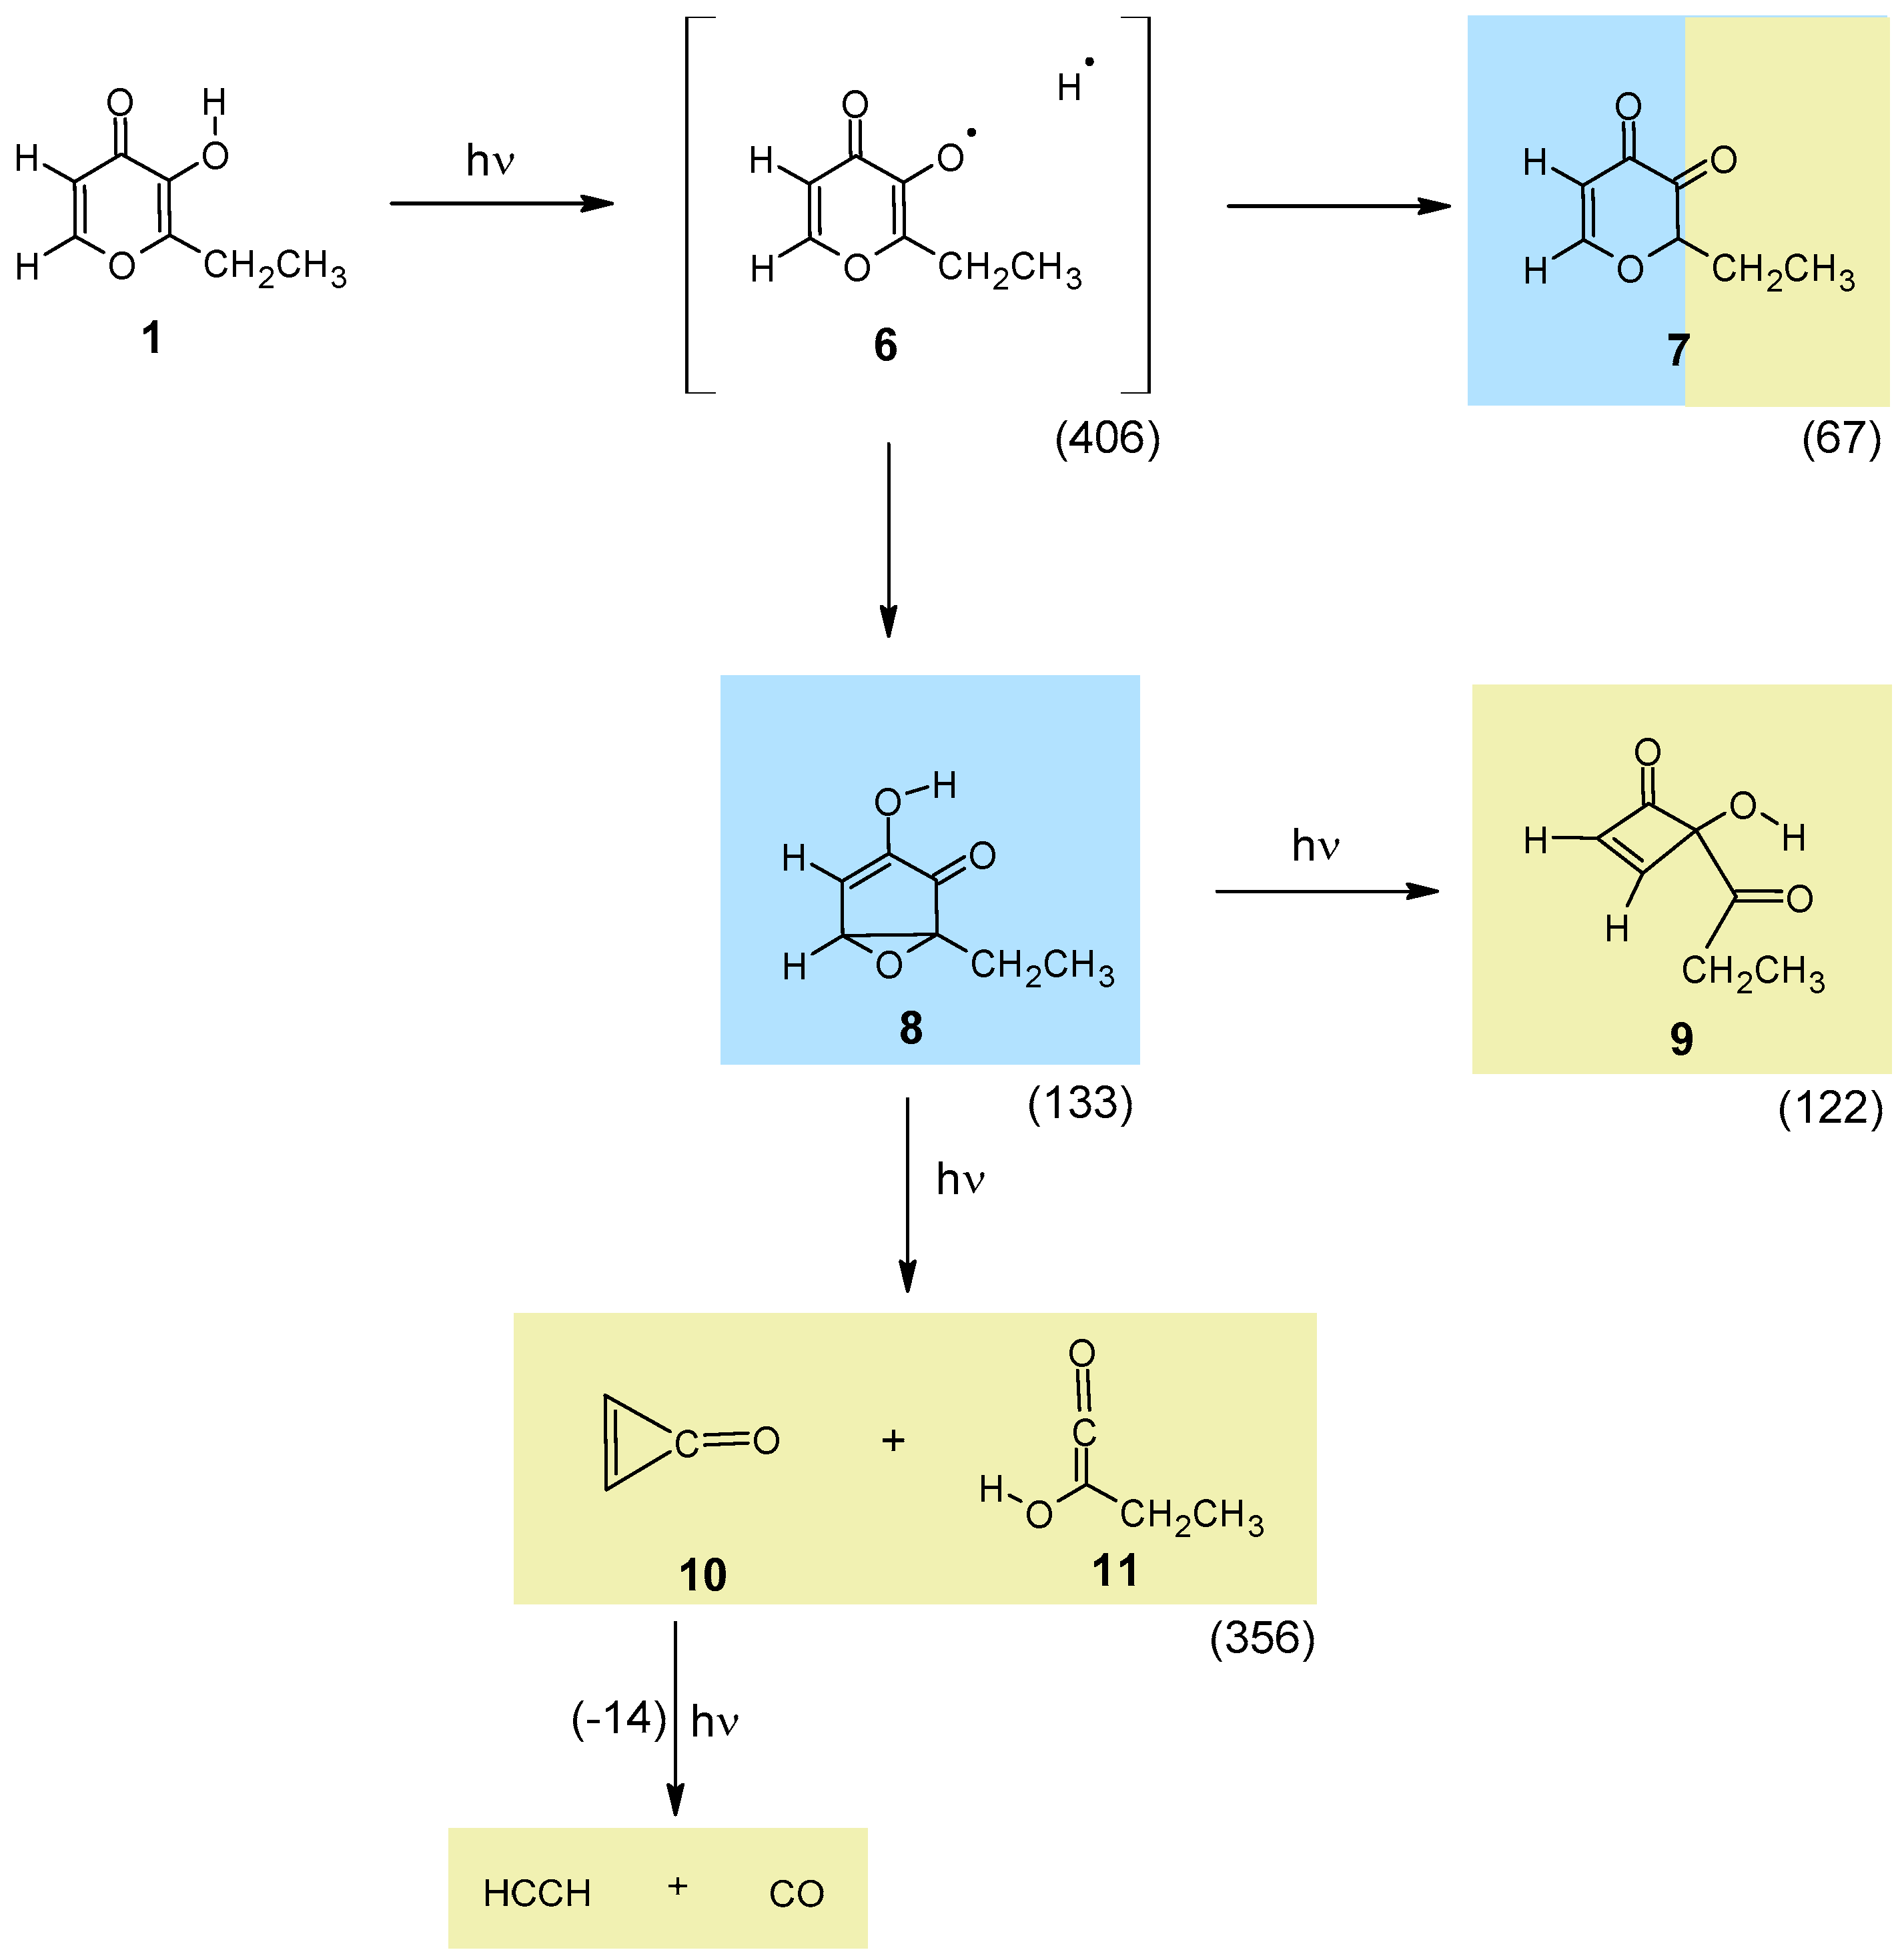
4.4. UV-Induced Photochemistry of Matrix-Isolated Ethyl Maltol
5. Conclusions
Supplementary Materials
Author Contributions
Funding
Institutional Review Board Statement
Informed Consent Statement
Data Availability Statement
Acknowledgments
Conflicts of Interest
References
- Pittet, A.O.; Rittersbacher, P.; Muralidhara, R. Flavor properties of compounds related to maltol and isomaltol. J. Agric. Food Chem. 1970, 18, 929–933. [Google Scholar] [CrossRef]
- Ichimoto, I.; Ueda, H.; Tatsumi, C.; Fujii, K.; Sekido, F.; Nonomura, S. Studies on kojic acid and its related γ-pyrone compounds: Part VII. The alkylation of kojic acid and pyromeconic acid through their Mannich base (synthesis of maltol-(1)) Part VIII. Synthesis of comenic acid from kojic acid (synthesis of maltol (2)). Agric. Biol. Chem. 1965, 29, 94–103. [Google Scholar]
- Popoff, T.; Theander, O.; Westerlund, E. Formation of aromatic compounds from carbohydrates. VI. Reaction of dihydroxyacetone in slightly acidic, aqueous solution. Acta Chem. Scand. B 1978, 32, 1–7. [Google Scholar] [CrossRef]
- Shono, T.; Matsumura, Y. Novel syntheses of maltol and related compounds. Tetrahed. Lett. 1976, 17, 1363–1364. [Google Scholar] [CrossRef]
- Sun, J.J.; Hao, M.; Wang, L.; Cui, L.H. Research on the synthesis process of ethylmaltol by electrochemistry. Appl. Mech. Mater. 2013, 284, 380–384. [Google Scholar] [CrossRef]
- Fung, F.-N.; Hay, B.A.; Swenarton, J.E. Method of Synthesizing Gamma Pyrones. 1999. Available online: https://patents.google.com/patent/US5908941A/en (accessed on 17 May 2024).
- Weeks, P.D.; Allingham, R.P. Preparation of Gamma-Pyrone İntermediates. 1984. Available online: https://patents.google.com/patent/US4451661A/en (accessed on 17 May 2024).
- Gralla, E.J.; Stebbins, R.B.; Coleman, G.L.; Delahunt, C.S. Toxicity studies with ethyl maltol. Toxic. Appl. Pharm. 1969, 15, 604–613. [Google Scholar] [CrossRef]
- Durrani, K.; El Din, S.-M.A.; Sun, Y.; Rule, A.M.; Bressler, J. Ethyl maltol enhances copper mediated cytotoxicity in lung epithelial cells. Toxic. Appl. Pharm. 2021, 410, 115354. [Google Scholar] [CrossRef]
- Omaiye, E.E.; Luo, W.; McWhirter, K.J.; Pankow, J.F.; Talbot, P. Ethyl maltol, vanillin, corylone and other conventional confectionery-related flavour chemicals dominate in some e-cigarette liquids labelled ‘tobacco’ flavoured. Tobacco Contr. 2022, 31, s238–s244. [Google Scholar] [CrossRef]
- Burdock, G.A. Fenaroli′s Handbook of Flavor İngredients, 5th ed.; CRC Press: Boca Raton, FL, USA, 2005. [Google Scholar]
- Rennhard, H.H. Metabolism of ethyl maltol and maltol in the dog. J. Agric. Food Chem. 1971, 19, 152–154. [Google Scholar] [CrossRef]
- LeBlanc, D.T.; Akers, H.A. Maltol and ethyl maltol: From the larch tree to successful food additive. Food Technol. 1989, 43, 78–84. [Google Scholar]
- McAlinden, K.D.; Lu, W.; Eapen, M.S.; Sohal, S.S. Electronic cigarettes: Modern instruments for toxic lung delivery and posing risk for the development of chronic disease. Int. J. Biochem. Cell Biol. 2021, 137, 106039. [Google Scholar] [CrossRef] [PubMed]
- Thompson, K.H.; Barta, C.A.; Orvig, C. Metal complexes of maltol and close analogues in medicinal inorganic chemistry. Chem. Soc. Rev. 2006, 35, 545–556. [Google Scholar] [CrossRef]
- Thompson, K.H.; Lichter, J.; LeBel, C.; Scaife, M.C.; McNeill, J.H.; Orvig, C. Vanadium treatment of type 2 diabetes: A view to the future. J. Inorg. Biochem. 2009, 103, 554–558. [Google Scholar] [CrossRef]
- Thompson, K.H.; Orvig, C. Vanadium in diabetes: 100 years from Phase 0 to Phase I. J. Inorg. Biochem. 2006, 100, 1925–1935. [Google Scholar] [CrossRef]
- Kawabe, K.; Yoshikawa, Y.; Adachi, Y.; Sakurai, H. Possible mode of action for insulinomimetic activity of vanadyl (IV) compounds in adipocytes. Life Sci. 2006, 78, 2860–2866. [Google Scholar] [CrossRef] [PubMed]
- Peters, K.G.; Davis, M.G.; Howard, B.W.; Pokross, M.; Rastogi, V.; Diven, C.; Greis, K.D.; Eby-Wilkens, E.; Maier, M.; Evdokimov, A. Mechanism of insulin sensitization by BMOV (bis maltolato oxo vanadium); unliganded vanadium (VO4) as the active component. J. Inorg. Biochem. 2003, 96, 321–330. [Google Scholar] [CrossRef]
- Willsky, G.R.; Goldfine, A.B.; Kostyniak, P.J.; McNeill, J.H.; Yang, L.Q.; Khan, H.R.; Crans, D.C. Effect of vanadium (IV) compounds in the treatment of diabetes: In vivo and in vitro studies with vanadyl sulfate and bis (maltolato) oxovandium (IV). J. Inorg. Biochem. 2001, 85, 33–42. [Google Scholar] [CrossRef] [PubMed]
- Kennedy, D.C.; Patrick, B.O.; James, B.R. Cationic ruthenium(III) maltolato–imidazole complexes—Synthesis; characterization; antiproliferatory activity, Adapted from the Ph.D. thesis of D.C. Kennedy. Can. J. Chem. 2011, 89, 948–958. [Google Scholar] [CrossRef]
- Chin, L.F.; Kong, S.M.; Seng, H.L.; Khoo, K.S.; Vikneswaran, R.; Teoh, S.G.; Ahmad, M.; Khoo, S.B.A.; Maah, M.J.; Ng, C.H. Synthesis, characterization and biological properties of cobalt (II) complexes of 1,10-phenanthroline and maltol. J. Inorg. Biochem. 2011, 105, 339–347. [Google Scholar] [CrossRef]
- Hsieh, W.-Y.; Zaleski, C.M.; Pecoraro, V.L.; Fanwick, P.E.; Liu, S. Mn (II) complexes of monoanionic bidentate chelators: X-ray crystal structures of Mn(dha).2(CH3OH)2 (Hdha= dehydroacetic acid) and [Mn(ema).2(H2O)]2.2H2O (Hema= 2-ethyl-3-hydroxy-4-pyrone). Inorg. Chim. Acta 2006, 359, 228–236. [Google Scholar] [CrossRef]
- Szklarzewicz, J.; Paciorek, P.; Zabierowski, P.; Kurpiewska, K.; Mikuriya, M.; Yoshioka, D. Synthesis, crystal structures and spectroscopy studies of Mo (IV) complexes synthesized in reactions with kojic acid, maltol and ethylmaltol. Polyhedron 2012, 37, 35–41. [Google Scholar] [CrossRef]
- Chen, X.-F.; Wang, T.-R.; Ma, Z.; Yu, Y.; Tang, L.; Jin, L.-Y.; Sheng, G.-H.; Zhu, H.-L. Synthesis, crystal structures and insulin-like activity of two new oxidovanadium (V) complexes with aroylhydrazones and maltol mixed-ligands. Polyhedron 2017, 137, 321–324. [Google Scholar] [CrossRef]
- Case, D.R.; Gonzalez, R.; Zubieta, J.; Doyle, R.P. Synthesis, characterization, and cellular uptake of magnesium maltol and ethylmaltol complexes. ACS Omega 2021, 6, 29713–29723. [Google Scholar] [CrossRef] [PubMed]
- Xue, L.-W.; Han, Y.-J.; Luo, X.-Q. Synthesis, crystal structures and antimicrobial activity of oxidovanadium (V) complexes with hydrazone and pyrone ligands. Acta Chim. Sloven. 2019, 66, 622–628. [Google Scholar] [CrossRef]
- Xue, L.-W.; Han, Y.-J.; Luo, X.-Q. Six-coordinated oxidovanadium (V) complexes derived from hydrazone and pyrone ligands: Synthesis, spectroscopy, and catalytic property. Inorg. Nano-Met. Chem. 2020, 50, 654–660. [Google Scholar] [CrossRef]
- Bergeron, A.; Kostenkova, K.; Selman, M.; Murakami, H.A.; Owens, E.; Haribabu, N.; Arulanandam, R.; Diallo, J.-S.; Crans, D.C. Enhancement of oncolytic virotherapy by vanadium (V) dipicolinates. Biometals 2019, 32, 545–561. [Google Scholar] [CrossRef]
- Alblawi, K.; Henderson, W.; Nicholson, B.K. Synthesis and characterization of nickel (II) maltolate complexes containing ancillary bisphosphine ligands. J. Coord. Chem. 2011, 64, 679–687. [Google Scholar] [CrossRef]
- Brown, S.D.; Burgess, J.; Fawcett, J.; Parsons, S.A.; Russell, D.R.; Waltham, E. Three polymorphic forms of 2-ethyl-3-hydroxy-4-pyranone (ethyl maltol). Acta Cryst. Sect. C Cryst. Struct. Com. 1995, 51, 1335–1338. [Google Scholar] [CrossRef]
- Frisch, M.J.; Trucks, G.W.; Schlegel, H.B.; Scuseria, G.E.; Robb, M.A.; Cheeseman, J.R.; Scalmani, G.; Barone, V.; Mennucci, B.; Petersson, G.A.; et al. Gaussian 09 (Revision A.02); Gaussian, Inc.: Wallingford, CT, USA, 2016. [Google Scholar]
- Becke, A.D. Density-functional exchange-energy approximation with correct asymptotic behavior. Phys. Rev. A 1988, 38, 3098–3100. [Google Scholar] [CrossRef]
- Lee, C.; Yang, W.; Parr, R.G. Development of the Colle-Salvetti correlation-energy formula into a functional of the electron density. Phys. Rev. B 1988, 37, 785–789. [Google Scholar] [CrossRef]
- Vosko, S.H.; Wilk, L.; Nusair, M. Accurate spin-dependent electron liquid correlation energies for local spin density calculations: A critical analysis. Can. J. Phys. 1980, 58, 1200–1211. [Google Scholar] [CrossRef]
- McLean, A.D.; Chandler, G.S. Contracted Gaussian basis sets for molecular calculations. I. Second row atoms, Z= 11–18. J. Chem. Phys. 1980, 72, 5639–5648. [Google Scholar] [CrossRef]
- Clark, T.; Chandrasekhar, J.; Spitznagel, G.W.; Schleyer, P.V.R. Efficient diffuse function-augmented basis sets for anion calculations. III. The 3-21+G basis set for first-row elements, Li–F. J. Comput. Chem. 1983, 4, 294–301. [Google Scholar] [CrossRef]
- Frisch, M.J.; Pople, J.A.; Binkley, J.S. Self-consistent molecular orbital methods 25. Supplementary functions for Gaussian basis sets. J. Chem. Phys. 1984, 80, 3265–3269. [Google Scholar] [CrossRef]
- Andrienko, G.A. Chemcraft (Version 1.8), Graphical Software for Visualization of Quantum Chemistry Computations; Chemcraft Holdings, Inc.: Port Hope, ON, Canada, 2024. [Google Scholar]
- Frisch, A.; Hratchian, H.P.; Dennington, R.D., II; Keith, T.A.; Millam, J.; Nielsen, B.; Holder, A.J.; Hiscocks, J. GaussView Version 5.0.8; Gaussian, Inc.: Wallingford, CT, USA, 2009. [Google Scholar]
- Iogansen, A.V. Direct proportionality of the hydrogen bonding energy and the intensification of the stretching ν(XH) vibration in infrared spectra. Spectrochim. Acta A 1999, 55, 1585–1612. [Google Scholar] [CrossRef]
- Reva, I.D.; Fausto, R.; Rozenberg, M.; Shoham, G. Low temperature FTIR spectra and hydrogen bonding in polycrystalline L-alanine. Spectrochim. Acta A 2003, 59, 3253–3266. [Google Scholar]
- Rozenberg, M.; Shoham, G.; Reva, I.D.; Fausto, R. Low temperature FTIR spectra and hydrogen bonding in cytosine polycrystals. Spectrochim. Acta A 2004, 60, 463–470. [Google Scholar] [CrossRef]
- Rozenberg, M.; Shoham, G.; Reva, I.D.; Fausto, R. Low temperature Fourier transform infrared spectra and hydrogen bonding in polycrystalline uracil and thymine. Spectrochim. Acta A 2004, 60, 2323–2336. [Google Scholar] [CrossRef]
- Rozenberg, M.; Shoham, G.; Reva, I.D.; Fausto, R. Spontaneous self-association of adenine and uracil in polycrystals from low temperature FTIR spectra in the range below 1000 cm−1. Spectrochim. Acta. A 2005, 62, 233–238. [Google Scholar] [CrossRef]
- Rozenberg, M.; Shoham, G.; Reva, I.D.; Fausto, R. A correlation between the proton stretching vibration red shift and the hydrogen bond length in polycrystalline amino acids and peptides. Phys. Chem. Chem. Phys. 2005, 7, 2376–2383. [Google Scholar] [CrossRef]
- Giuliano, B.M.; Reva, I.; Lapinski, L.; Fausto, R. Infrared spectra and ultraviolet-tunable laser induced photochemistry of matrix-isolated phenol and phenol-d5. J. Chem. Phys. 2012, 136, 024505. [Google Scholar] [CrossRef] [PubMed]
- Nowak, M.J.; Reva, I.; Jesus, A.J.L.; Lapinski, L.; Fausto, R. UV-promoted radical formation, and near-IR-induced and spontaneous conformational isomerization in monomeric 9-methylguanine isolated in low-temperature Ar matrices. Phys. Chem. Chem. Phys. 2019, 21, 22857–22868. [Google Scholar] [CrossRef] [PubMed]
- Jesus, A.J.L.; Júnior, J.R.L.; Fausto, R.; Reva, I. Infrared spectra and phototransformations of meta-fluorophenol isolated in argon and nitrogen matrices. Molecules 2022, 27, 8248. [Google Scholar] [CrossRef] [PubMed]
- Sobolewski, A.L.; Domcke, W.; Dedonder-Ladeux, C.; Jouvet, C. Excited-state hydrogen detachment and hydrogen transfer driven by repulsive 1πσ* states: A new paradigm for nonradiative decay in aromatic biomolecules. Phys. Chem. Chem. Phys. 2002, 4, 1093–1100. [Google Scholar] [CrossRef]
- Vieuxmaire, O.P.; Lan, Z.; Sobolewski, A.L.; Domcke, W. Ab initio characterization of the conical intersections involved in the photochemistry of phenol. J. Chem. Phys. 2008, 129, 224307. [Google Scholar] [CrossRef]
- Kuş, N.; Reva, I.; Bayarı, S.; Fausto, R. In situ photoproduction of dichlorodibenzo-p-dioxin from non-ionic triclosan. J. Mol. Struct. 2012, 1007, 88–94. [Google Scholar] [CrossRef]
- Jesus, A.J.L.; Fausto, R.; Reva, I. Conformational space; IR-induced, and UV-induced chemistry of carvacrol isolated in a low-temperature argon matrix. J. Phys. Chem. A 2021, 125, 8215–8229. [Google Scholar] [CrossRef]
- Jesus, A.J.L.; Nunes, C.M.; Reva, I. Conformational structure, infrared spectra and light-induced transformations of thymol isolated in noble gas cryomatrices. Photochem 2022, 2, 405–422. [Google Scholar] [CrossRef]
- Abe, H.; Takeo, H.; Yamada, K.M. Infrared spectroscopy of CO trapped in an argon matrix revisited. Chem. Phys. Lett. 1999, 311, 153–158. [Google Scholar] [CrossRef]
- Dubost, H. Infrared absorption spectra of carbon monoxide in rare gas matrices. Chem. Phys. 1976, 12, 139–151. [Google Scholar] [CrossRef]
- Dahoo, P.R.; Berrodier, I.; Raducu, V.; Teffo, J.L.; Chabbi, H.; Lakhlifi, A.; Abouaf-Marguin, L. Splitting of vibrational n2 mode of CO2 isotopic species in the unstable trapping site in argon matrix. Eur. Phys. J. D 1999, 5, 71–81. [Google Scholar] [CrossRef]
- Jacox, M.E.; Milligan, D.E. Vibrational spectrum of CO2− in an argon matrix. Chem. Phys. Lett. 1974, 28, 163–168. [Google Scholar] [CrossRef]
- Jose, K.V.J.; Gadre, S.R.; Sundararajan, K.; Viswanathan, K.S. Effect of matrix on IR frequencies of acetylene and acetylene-methanol complex: Infrared matrix isolation and ab initio study. J. Chem. Phys. 2007, 127, 104501. [Google Scholar] [CrossRef] [PubMed]
- Tuazon, E.C.; Finseth, D.H.; Miller, F.A. Cyclopropenone: Normal coordinate calculation and the form of the normal modes. Spectrochim. Acta A 1975, 31, 1133–1138. [Google Scholar] [CrossRef]

| I | II | |
|---|---|---|
| ΔEel | 0.0 | 44.6 |
| ΔE0 | 0.0 | 42.7 |
| ΔG0 | 0.0 | 41.9 |
| Pop. (%) | 100.0 | 2 × 10⁻⁶ |
| N | νExp | νCalc | ICalc | Assignment b |
|---|---|---|---|---|
| 48 | 3397, 3387 | 3387 | 117.7 | ν(OH) |
| 47 | n.obs. | 3095 | 2.0 | νs(CH) |
| 46 | n.obs. | 3078 | 0.4 | νas(CH) |
| 45 | 2999/2995 | 2989 | 19.4 | νas″(CH3) + νas(CH2) |
| 44 | 2986/2980 | 2978 | 30.6 | νas′(CH3) |
| 43 | 2957/2953/2949 | 2969 | 2.9 | νas(CH2) + νas″(CH3) |
| 42 | 2917/2913 | 2913 | 30.0 | νs(CH3) |
| 41 | 2899/2890 | 2909 | 16.2 | νs(CH2) |
| 40 | 1684 | 1672 | 35.4 | ν(C=C) + δ(OH) |
| 39 | 1652/1649 | 1646 | 532.4 | ν(C=O) |
| 38 | 1580 | 1577 | 3.4 | ν(CH=CH) |
| 37 | 1470 | 9.0 | δ′(CH3) | |
| 36 | 8.5 | δ”(CH3) | ||
| 35 | 1454 | 1452 | 5.8 | δ(CH2) |
| 34 | 1440/1437/1433 | 1429 | 88.3 | ν(C=O–COH) + δ(OH) |
| 33 | 1396 | 1391 | 36.4 | δs(CH) + ν(CC) + δ(OH) |
| 32 | 1378 | 1380 | 10.1 | δs(CH3) |
| 31 | 1355 | 1347 | 5.6 | wagg(CH2) |
| 30 | 1295 | 1298 | 154.1 | δ(OH) |
| 29 | 1273/1272 | 1272 | 117.3 | twist(CH2) |
| 28 | 1239 | 1254 | 13.2 | δa(CH) + ν(C–OH) |
| 27 | 1217/1215 | 1207 | 57.7 | ν(C=O–CH) + ν(C–OH) |
| 26 | 1185 | 1170 | 84.5 | ν(CO)ring + ν(C–OH) |
| 25 | 1092 | 1089 | 0.4 | γ”(CH3) |
| 24 | 1067 | 1062 | 12.1 | γ′(CH3) |
| 23 | 1025 | 1026 | 1.0 | ν(C–CH2) + ν(CH2–CH3) |
| 22 | 983/977/972 | 969 | 36.0 | ν(CO)ring |
| 21 | 938/932 | 0.1 | γa(CH) | |
| 20 | 19.9 | ν(CH2–CH3) | ||
| 19 | 839/837 | 831 | 28.8 | δ(CH–CH–O)ring |
| 18 | 831/830 | 817 | 49.9 | γs(CH) |
| 17 | 777 (?) | 769 | 0.2 | γ(CH2) + γ”(CH3) |
| 16 | 754 | 735 | 1.1 | γ(C=O) |
| 15 | 693/689/680 | 679 | 5.2 | Ring breathing |
| 14 | 570/564/562 | 620 | 40.6 | γ(CC) + τ(OH) |
| 13 | 555/551 | 597 | 53.6 | τ(OH) |
| 12 | 542 | 555 | 1.0 | δ(C=O) |
| 11 | 513/511 | 512 | 7.6 | τ Ring |
| 10 | 504/503 | 496 | 2.4 | δ Ring |
| 9 | 486/483 | 480 | 1.3 | δ Ring |
| 8 | n.i. | 340 | 6.6 | δ Ring |
| 7 | n.i. | 318 | 10.9 | τ Ring + δ(CCC)ethyl |
| 6 | n.i. | 287 | 6.4 | δ(C–ethyl) |
| 5 | n.i. | 251 | 0.8 | τ Ring |
| 4 | n.i. | 199 | 0.4 | τ(CH3) |
| 3 | n.i. | 161 | 3.2 | τ Ring |
| 2 | n.i. | 98 | 0.0 | δ(CCC)ethyl |
| 1 | n.i. | 44 | 0.3 | τ(C–CH2) |
| N | νExp | νCalc | ICalc | Assignment b |
|---|---|---|---|---|
| 51 | 3248 | 3268 | 3332.2 | ν(OH) |
| 50 | n.obs. | 3030 | 6.5 | νs(CH) |
| 49 | n.obs. | 3077 | 0.7 | νas(CH) |
| 48 | 31.1 | νas″(CH3) + νas(CH2) | ||
| 47 | 2980 | 63.0 | νas′(CH3) | |
| 46 | 20.6 | νas(CH2) + νas″(CH3) | ||
| 45 | 2922 (?) | 2912 | 46.2 | νs(CH2) |
| 44 | 2883 | 2910 | 68.2 | νs(CH3) |
| 43 | 1644/1641 | 1642 | 1354.3 | ν(C=O) + ν(C=C) |
| 42 | 1625 | 1634 | 347.3 | ν(C=O) + ν(C=C) + δ(OH) |
| 41 | 1565/1548 | 1575 | 85.4 | ν(CH=CH) |
| 40 | 1475 | 21.8 | δ′(CH3) | |
| 39 | 13.7 | δ”(CH3) | ||
| 38 | 1459 | 1454 | 42.0 | δ(CH2) |
| 37 | 1435 1390 | 1429 | 245.4 | ν(C=O–COH) + ν(C–OH) |
| 36 | 1388 | 49.6 | δs(CH) | |
| 35 | 1374 | 1376 | 47.6 | δs(CH3) |
| 34 | 1353 | 1340 | 20.5 | wagg(CH2) |
| 33 | 1285 | 1291 | 16.1 | twist(CH2) |
| 32 | 1278 | 1269 | 536.5 | ν(CO)ring + δ(OH) |
| 31 | 1266 | 1249 | 218.7 | δ(OH) |
| 30 | 1196 | 261.1 | ν(C=O–CH) + ν(C=O–COH) | |
| 29 | 166.9 | ν(CO)ring + ν(C–OH) | ||
| 28 | 1092 | 1091 | 18.2 | γ”(CH3) + γ(CH2) |
| 27 | 1053/1048 | 1062 | 21.1 | γ′(CH3) |
| 26 | 1039 | 1028 | 14.0 | ν(CO)ring + γ′(CH3) |
| 25 | 983 | 972 | 110.5 | ν(C–CH2) + ν(CH2–CH3) |
| 24 | 937 | 5.0 | γa(CH) | |
| 23 | 100.7 | ν(CH2–CH3) | ||
| 22 | 842 | 834 | 73.3 | δ(CH–CH–O)ring |
| 21 | 835 n.obs. | 119.2 | γs(CH) | |
| 20 | 1.1 | γ(CH2) + γ”(CH3) | ||
| 19 | 752 | 755 | 49.1 | τ(OH) |
| 18 | 716 | 726 | 79.6 | γ(C=O) + τ(OH) |
| 17 | 689 | 678 | 18.4 | Ring breathing |
| 16 | n.obs. | 613 | 1.1 | γ(CC) |
| 15 | 561 | 554 | 5.5 | δ(C=O) |
| 14 | 516 | 512 | 29.9 | τ Ring |
| 13 | 508 | 23.4 | δ Ring | |
| 12 | 17.2 | δ Ring |
Disclaimer/Publisher’s Note: The statements, opinions and data contained in all publications are solely those of the individual author(s) and contributor(s) and not of MDPI and/or the editor(s). MDPI and/or the editor(s) disclaim responsibility for any injury to people or property resulting from any ideas, methods, instructions or products referred to in the content. |
© 2024 by the authors. Licensee MDPI, Basel, Switzerland. This article is an open access article distributed under the terms and conditions of the Creative Commons Attribution (CC BY) license (https://creativecommons.org/licenses/by/4.0/).
Share and Cite
Sıdır, İ.; Lopes, S.; Nikitin, T.; Gülseven Sıdır, Y.; Fausto, R. Infrared Spectroscopy and Photochemistry of Ethyl Maltol in Low-Temperature Argon Matrix. Spectrosc. J. 2024, 2, 188-205. https://doi.org/10.3390/spectroscj2040013
Sıdır İ, Lopes S, Nikitin T, Gülseven Sıdır Y, Fausto R. Infrared Spectroscopy and Photochemistry of Ethyl Maltol in Low-Temperature Argon Matrix. Spectroscopy Journal. 2024; 2(4):188-205. https://doi.org/10.3390/spectroscj2040013
Chicago/Turabian StyleSıdır, İsa, Susy Lopes, Timur Nikitin, Yadigar Gülseven Sıdır, and Rui Fausto. 2024. "Infrared Spectroscopy and Photochemistry of Ethyl Maltol in Low-Temperature Argon Matrix" Spectroscopy Journal 2, no. 4: 188-205. https://doi.org/10.3390/spectroscj2040013
APA StyleSıdır, İ., Lopes, S., Nikitin, T., Gülseven Sıdır, Y., & Fausto, R. (2024). Infrared Spectroscopy and Photochemistry of Ethyl Maltol in Low-Temperature Argon Matrix. Spectroscopy Journal, 2(4), 188-205. https://doi.org/10.3390/spectroscj2040013