Article

Geometry Change of 1,3-Dicyanobenzene upon Electronic Excitation from a Franck–Condon Fit of Several Fluorescence Emission Spectra †

by
Jascha Martini
,
Simran Amar
and
Michael Schmitt
*
Institut für Physikalische Chemie I, Heinrich-Heine-Universität, D-40225 Düsseldorf, Germany
*
Author to whom correspondence should be addressed.
Dedicated to Henry Mantsch for his ground-breaking works in the area of applied spectroscopy and his dedication for scientific exchange as means of reconciliation between peoples.
Spectrosc. J. 2025, 3(1), 4; https://doi.org/10.3390/spectroscj3010004
Submission received: 9 October 2024 / Revised: 2 December 2024 / Accepted: 10 January 2025 / Published: 21 January 2025

Abstract

:
The change in the geometry of 1,3-dicyanobenzene upon electronic excitation to the lowest excited singlet state has been elucidated by simultaneous Franck–Condon (FC) fits of the fluorescence emission spectra originating from the vibrationless origin and from four vibronic bands. The geometry changes obtained from the FC fits were compared to the results of ab initio calculations at the SCS-CC2/cc-pVTZ level of theory. We found close agreement between the spectral determination and the theoretical prediction of the geometry changes upon excitation. The aromatic ring opens upon excitation, resulting in a symmetrically distorted structure in the excited state.

1. Introduction

Although the determination of ground-state structures of stable molecules is straightforward using a large variety of methods, considerably less work has been performed on molecules in their electronically excited states.
For molecules in the electronic ground state, structure determination can be achieved through methods that use the inertial moments of the molecules, such as microwave spectroscopy or rotationally resolved infrared spectroscopy. Alternatively, diffraction-based methods, such as single-crystal X-ray diffraction (sc-XRD) and electron diffraction (ED) [1] are applicable. Although X-ray diffraction generally requires crystalline samples, both sc-XRD and ED can also be applied in the gas phase using strongly aligned probes. X-ray diffraction of aligned molecules has been performed using femtosecond X-rays from the Linac Coherent Light Source at the SLAC National Accelerator Laboratory [2].
Inertia-based structural determination can also be used to determine excited-state structures via rotationally resolved UV spectroscopy, pioneered by Meerts [3] and Pratt [4], and by coherent beat techniques in the time domain, introduced by the Felker group [5] and later improved by Riehn [6]. Ultrafast electron diffraction opened the gate to structures of excited states [7], especially of dark states, that cannot be encountered by optical methods.
A complementary approach uses vibronic intensities in fluorescence emission spectra and a fit of these intensities to geometry changes within the Franck–Condon (FC) or, when applicable, the Franck–Condon–Herzberg–Teller (FCHT) approximations [8].
Dicyanobenzene-based photocatalysts have found wide interest in recent years as organic dyes, with a wide range of redox potentials [9], and are widely used as electron acceptors in thermally activated delayed fluorescence (TADF) materials [10].
Several cyano-substituted aromatic species have been detected in the interstellar medium. These comprise singly substituted aromatics like cyanobenzene, 1-cyanonaphthalene, and 2-cyanonaphthalene [11,12], as well as disubstituted aromatics, like 1,2-dicyanobenzene (1,2-DCB) and 1,3-dicyanobenzene (1,3-DCB) [13].
Chitarra et al. performed centimeter- and millimeter-wave rotational spectroscopy of 1,2-DCB and 1,3-DCB to determine the inertial parameters, the quartic and sextic centrifugal constants, and the nuclear quadrupole coupling constants [13].
Recently, Zajonz et al. determined the excited-state dipole moments of 1,2-DCB and 1,3-DCB from thermochromic shifts in solution [14].
In the following, we perform an FC analysis of several fluorescence emission spectra of 1,3-dicyanobenzene to elucidate the structural changes upon electronic excitation to the lowest excited singlet state.

2. Computational Methods

2.1. Quantum Chemical Calculations

The molecular structures of 1,2- and 1,3-DCB in their electronic ground ( S 0 ) and lowest excited singlet states ( S 1 ) have been optimized, employing Dunning’s correlation-consistent polarized valence triple zeta (cc-pVTZ) basis set from the Turbomole library [15,16]. The equilibrium geometries of the S 0 - and S 1 -states were computed using the approximate coupled cluster singles and doubles model (CC2) employing the resolution-of-the-identity (RI) approximation and spin-component scaling (SCS) [17,18,19,20]. The Hessians and harmonic vibrational frequencies of both electronic states, which are a prerequisite for the Franck–Condon fits, described in the following section were obtained from numerical second derivatives using the NumForce script [21]. Additionally, these vibrational frequencies were used to compute the zero-point corrections to the adiabatic excitation energies. The main reason for using SCS-CC2 was that for this method the Hessian is available at the same level of theory for both states. This, of course, is also true for DFT/TD-DFT, which, however, do not compare very well with the experimental vibrational frequencies. MP2 for the ground state is of comparable quality, but lacks a good S1 counterpart. The spin-component scaled (SCS) version of CC2 has to be used for aromatics that contain heteroatoms. Pristine CC2 has large deficiencies, even for the correct order of excited states, which are removed by spin scaling. Other scaling methods like spin-only scaling (SOS) perform equally well compared to SCS.

2.2. Franck–Condon Fits

According to the Franck–Condon principle, the intensities of vibronic transitions, both in absorption and emission, depend on the overlap of the electronic wavefunctions of the different vibronic levels in the ground and excited states. With the FCFit program, developed in our group and described before [22,23], the fit of vibronic intensities of several bands in emission was performed. It was based on the recursion formula of Doktorov, Malkin, and Man’ko for computation of multidimensional FC integrals [24,25]. The ground-state geometry was distorted along a set of normal modes, in order to minimize the differences between the experimentally observed and calculated intensities. A local optimizer was used, based on a Levenberg–Marquardt variant [26,27]. Technical details of the program are given in the Supporting Material.

3. Experimental Methods

The 1,3-DCB (≥ 98 % ) was purchased from BLDpharm and was used without further purification. The apparatus, which was used to record the disperse fluorescence (DF) spectra has been described in detail before [28,29]. Shortly, 1,3-DCB was evaporated in a home-built oven at T 0 = 453 K and co-expanded, with helium as the carrier gas, into the measuring chamber, which was kept at 10 5 mbar, through a commercial pulsed nozzle (General Valve, 500 μ m orifice). The nozzle was kept at a slightly higher temperature ( T 0 + 10 K) in order to avoid condensation of the substance within the nozzle. The frequency-doubled output of a Nd:YAG (SpectraPhysics, INDI, Darmstadt, Germany) pumped dye laser (Lambda-Physik, FL3002, Göttingen, Germany ) was crossed with the molecular beam. The fluorescence light was dispersed using a monochromator (Jobin Yvon, Oberursel, Germany, f = 1 m) and the spectrum was recorded on an intensified UV-sensitive CMOS detector (LaVision, Göttingen, Germany, IRO X). The relative emission band intensities obtained from integration over the pixel intensities on the CMOS chip were normalized to the strongest band in the respective spectrum. The intensity of the resonantly excited band, which contains stray light from the exciting laser, was omitted from the FC analysis.

4. Results and Discussion

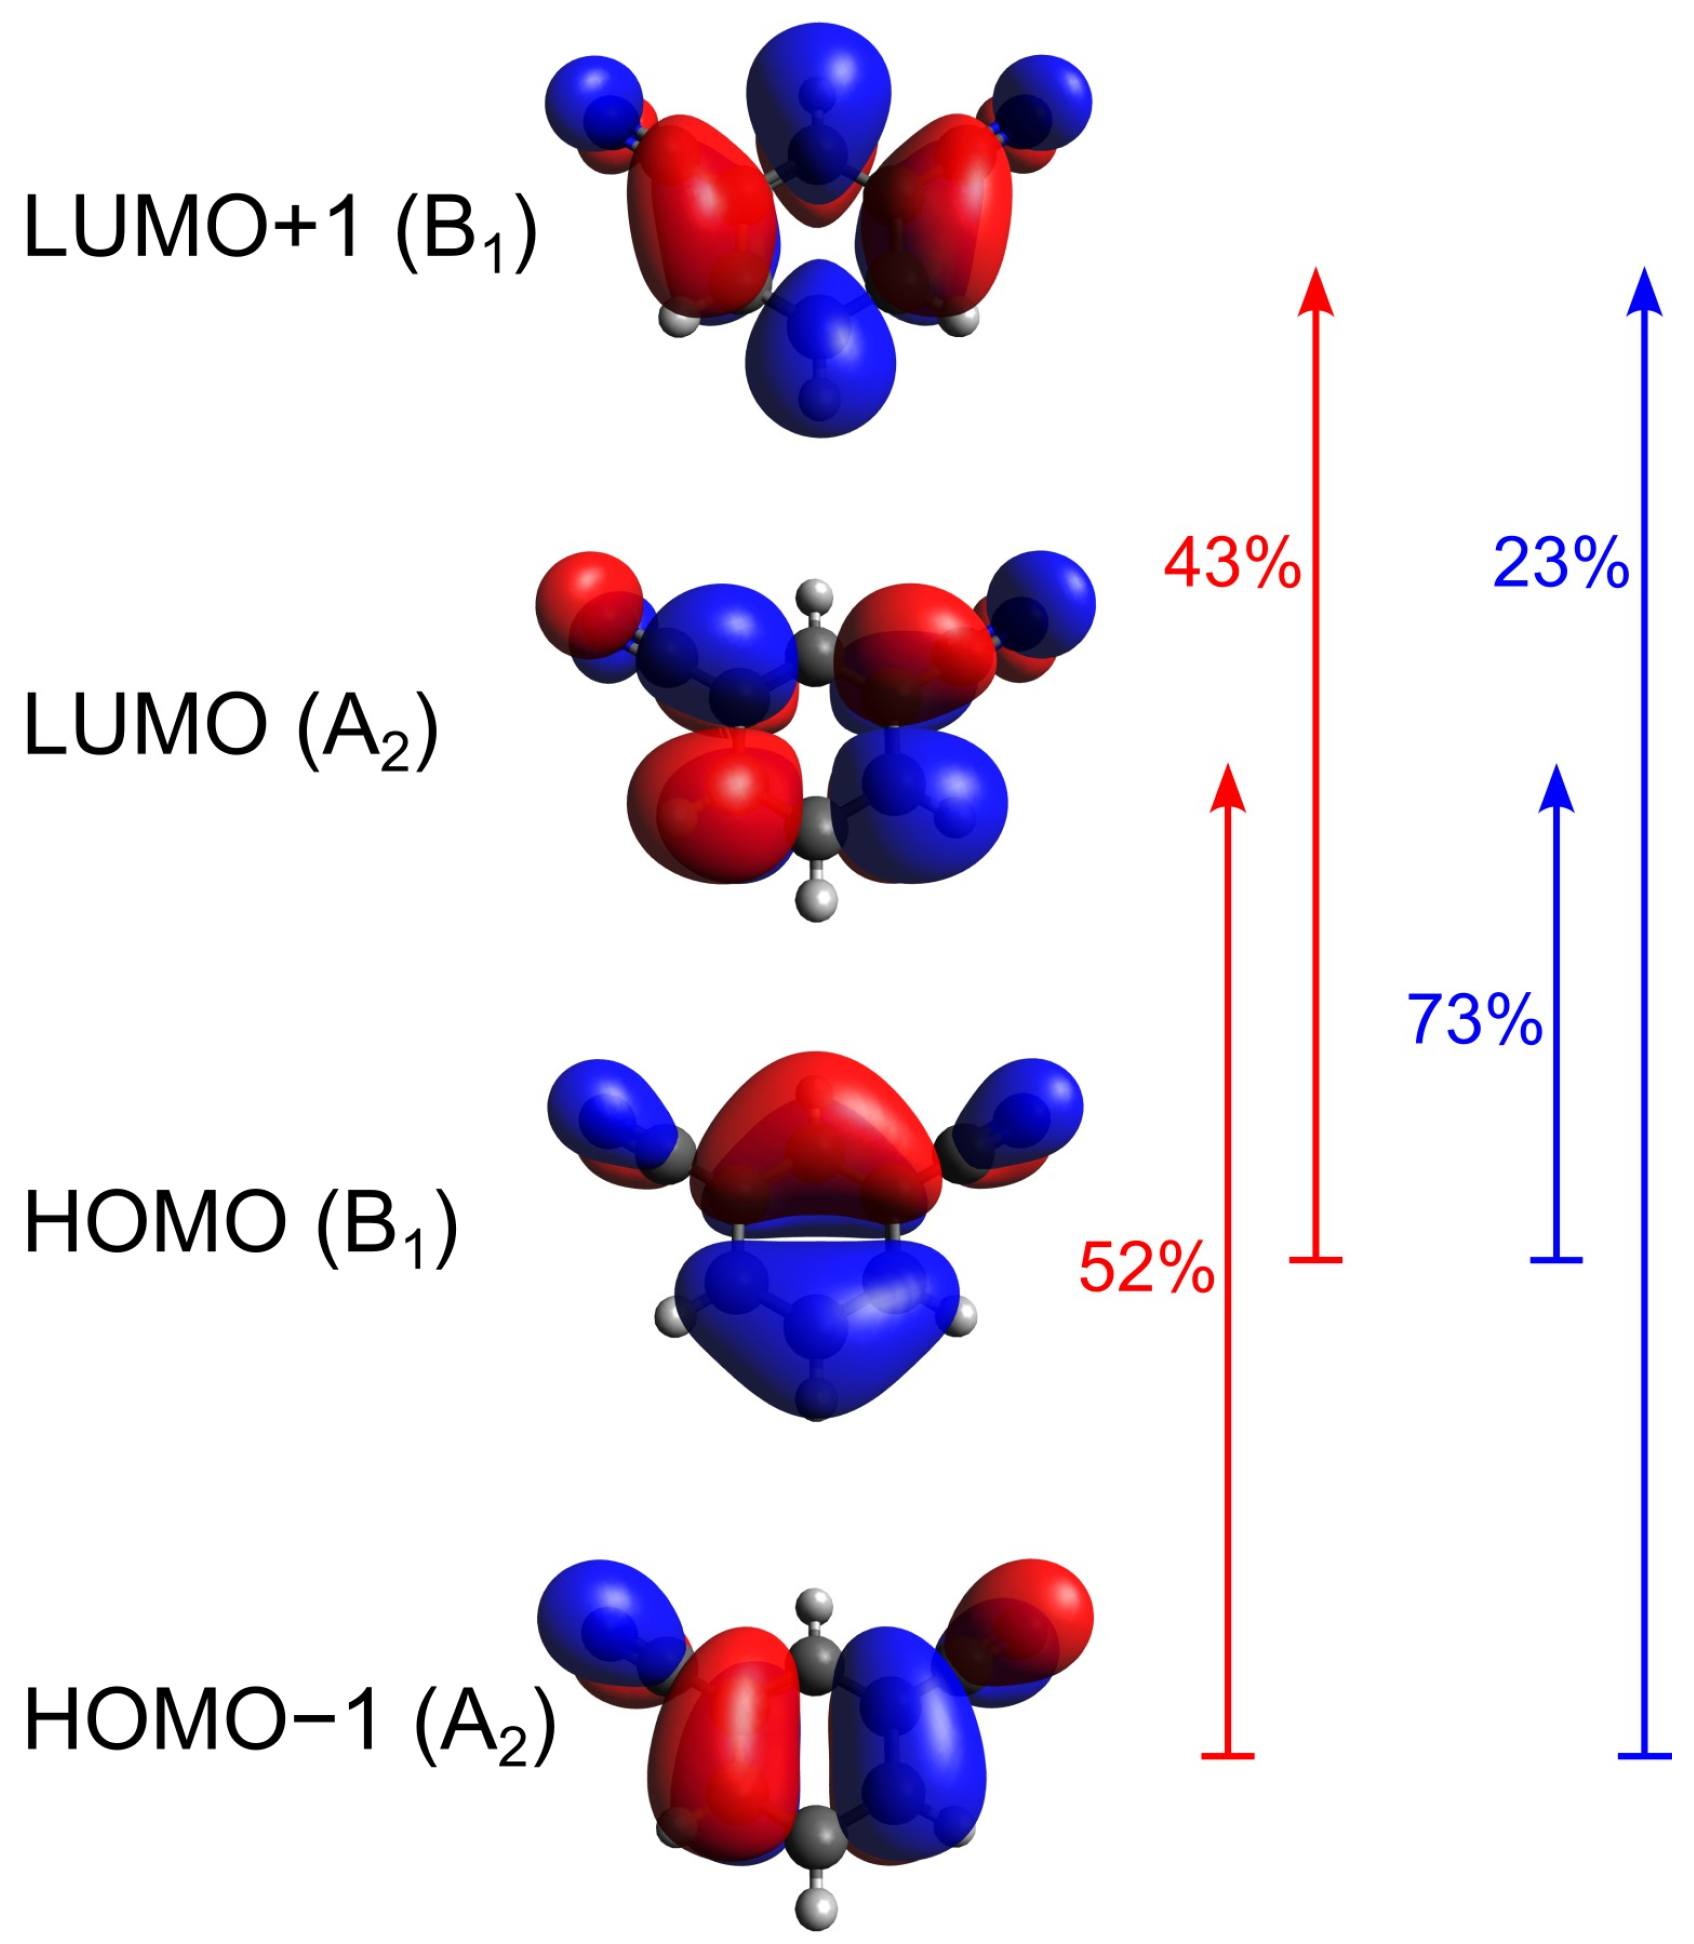
4.1. Computational Results

According to the CC2/cc-pVTZ-optimized structures, 1,3-DCB has C 2 v -symmetry in its electronic ground state and first excited singlet state, respectively. The first electronically excited singlet state, S 1 , is of A 1 -symmetry, and arises from a mixed 0.52 (LUMO ← HOMO-1) + 0.43 (LUMO+1 ← HOMO) transition, cf. Figure 1, and can be classified as Lb-state. The S 2 -state arises mainly from a LUMO ← HOMO excitation and represents an L a -state. The symmetry of the lowest two occupied orbitals, A 2 and B 1 , has been confirmed from a combination of ab initio calculations and photoelectron spectroscopy for 1,3-DCB [30].
The transition dipole moment (TDM) of the S 1 -state of 1,3-DCB is calculated to be oriented along the a-axis and perpendicular to the c-axis, as shown in Figure 2. The TDM of the S 2 -state is oriented along the inertial b-axis. Both orientations can be unambiguously derived from the molecular orbitals and leading contributions to the electronic state transitions, shown in Figure 1.
The 36 molecular vibrations of 1,3-DCB transform like Γ i r e d = 13 a 1 + 4 a 2 + 7 b 1 + 12 b 2 in C 2 v . The complete Duschinsky matrix for all ground- and excited-state vibrations and the respective symmetries are given in Table S4 of the online Supplementary Material.
Table 1 compares the ab initio-calculated rotational constants in the ground and excited states with experimental ground-state results from millimeter- and centimeter-wave spectra [13]. The small deviations of less than 0.6% are due to the difference between the constants of the r 0 -structure given in ref. [13] and the r e -structure derived from our ab initio calculations. The Cartesian geometries of 1,3-DCB in both electronic states are given in Tables S1 and S2 of the online Supporting Information.
No experimental rotational constants for the lowest excited singlet state are available to date.

4.2. Experimental Results

4.2.1. The LIF Spectrum of 1,3-Dicyanobenzene

The laser-induced fluorescence spectrum of 1,3-DCB is shown in Figure 3. The bands at 404, 497, 662, and 954 cm 1 relative to the electronic origin, which were excited to record the fluorescence excitation spectra, are marked with their wavenumber, along with their assignment, guided by the results of the ab initio-calculated vibrational frequencies in the S 1 -state. The vibrational frequencies and assignments in the S 1 -state along with the largest elements of the Duschinsky matrix are summarized in Table S4 of the online Supplementary Material. The magnitude of the (3N-6)(3N-6) elements of the Duschinsky matrix show which modes in the ground state resemble most those of the excited state. Matrix elements with a value close to 1 signify that the respective mode in the excited state is comprised solely of the same mode in the ground state. A graphical representation of the Duschinsky matrix is given in Figure S2 of the online Supporting Material. The excited modes, and those along which the ground-state geometry has been distorted, are depicted in Figure S1 of the online Supplementary Material; the numerical values of the displacements are given in Table S3.
A word on the notation of the vibrations used here. There are several labeling schemes for vibrations of substituted benzenes, which have evolved over several decades. The most prominent are the Wilson-mode labels [31], the scheme according to Varsányi [32], and the Mulliken [33] or Herzberg [34] labels. More recently, Wright pointed out, that for meta-disubstituted benzene derivatives these nomenclatures result in contradicting assignments, depending on the mass of the substituents [35]. Since the present work intends to work out the structural changes after electronic excitation from the FC intensity pattern of several emission spectra, we adopt a more simplistic scheme in which the modes are solely sorted by increasing energy, irrespective of their symmetry.

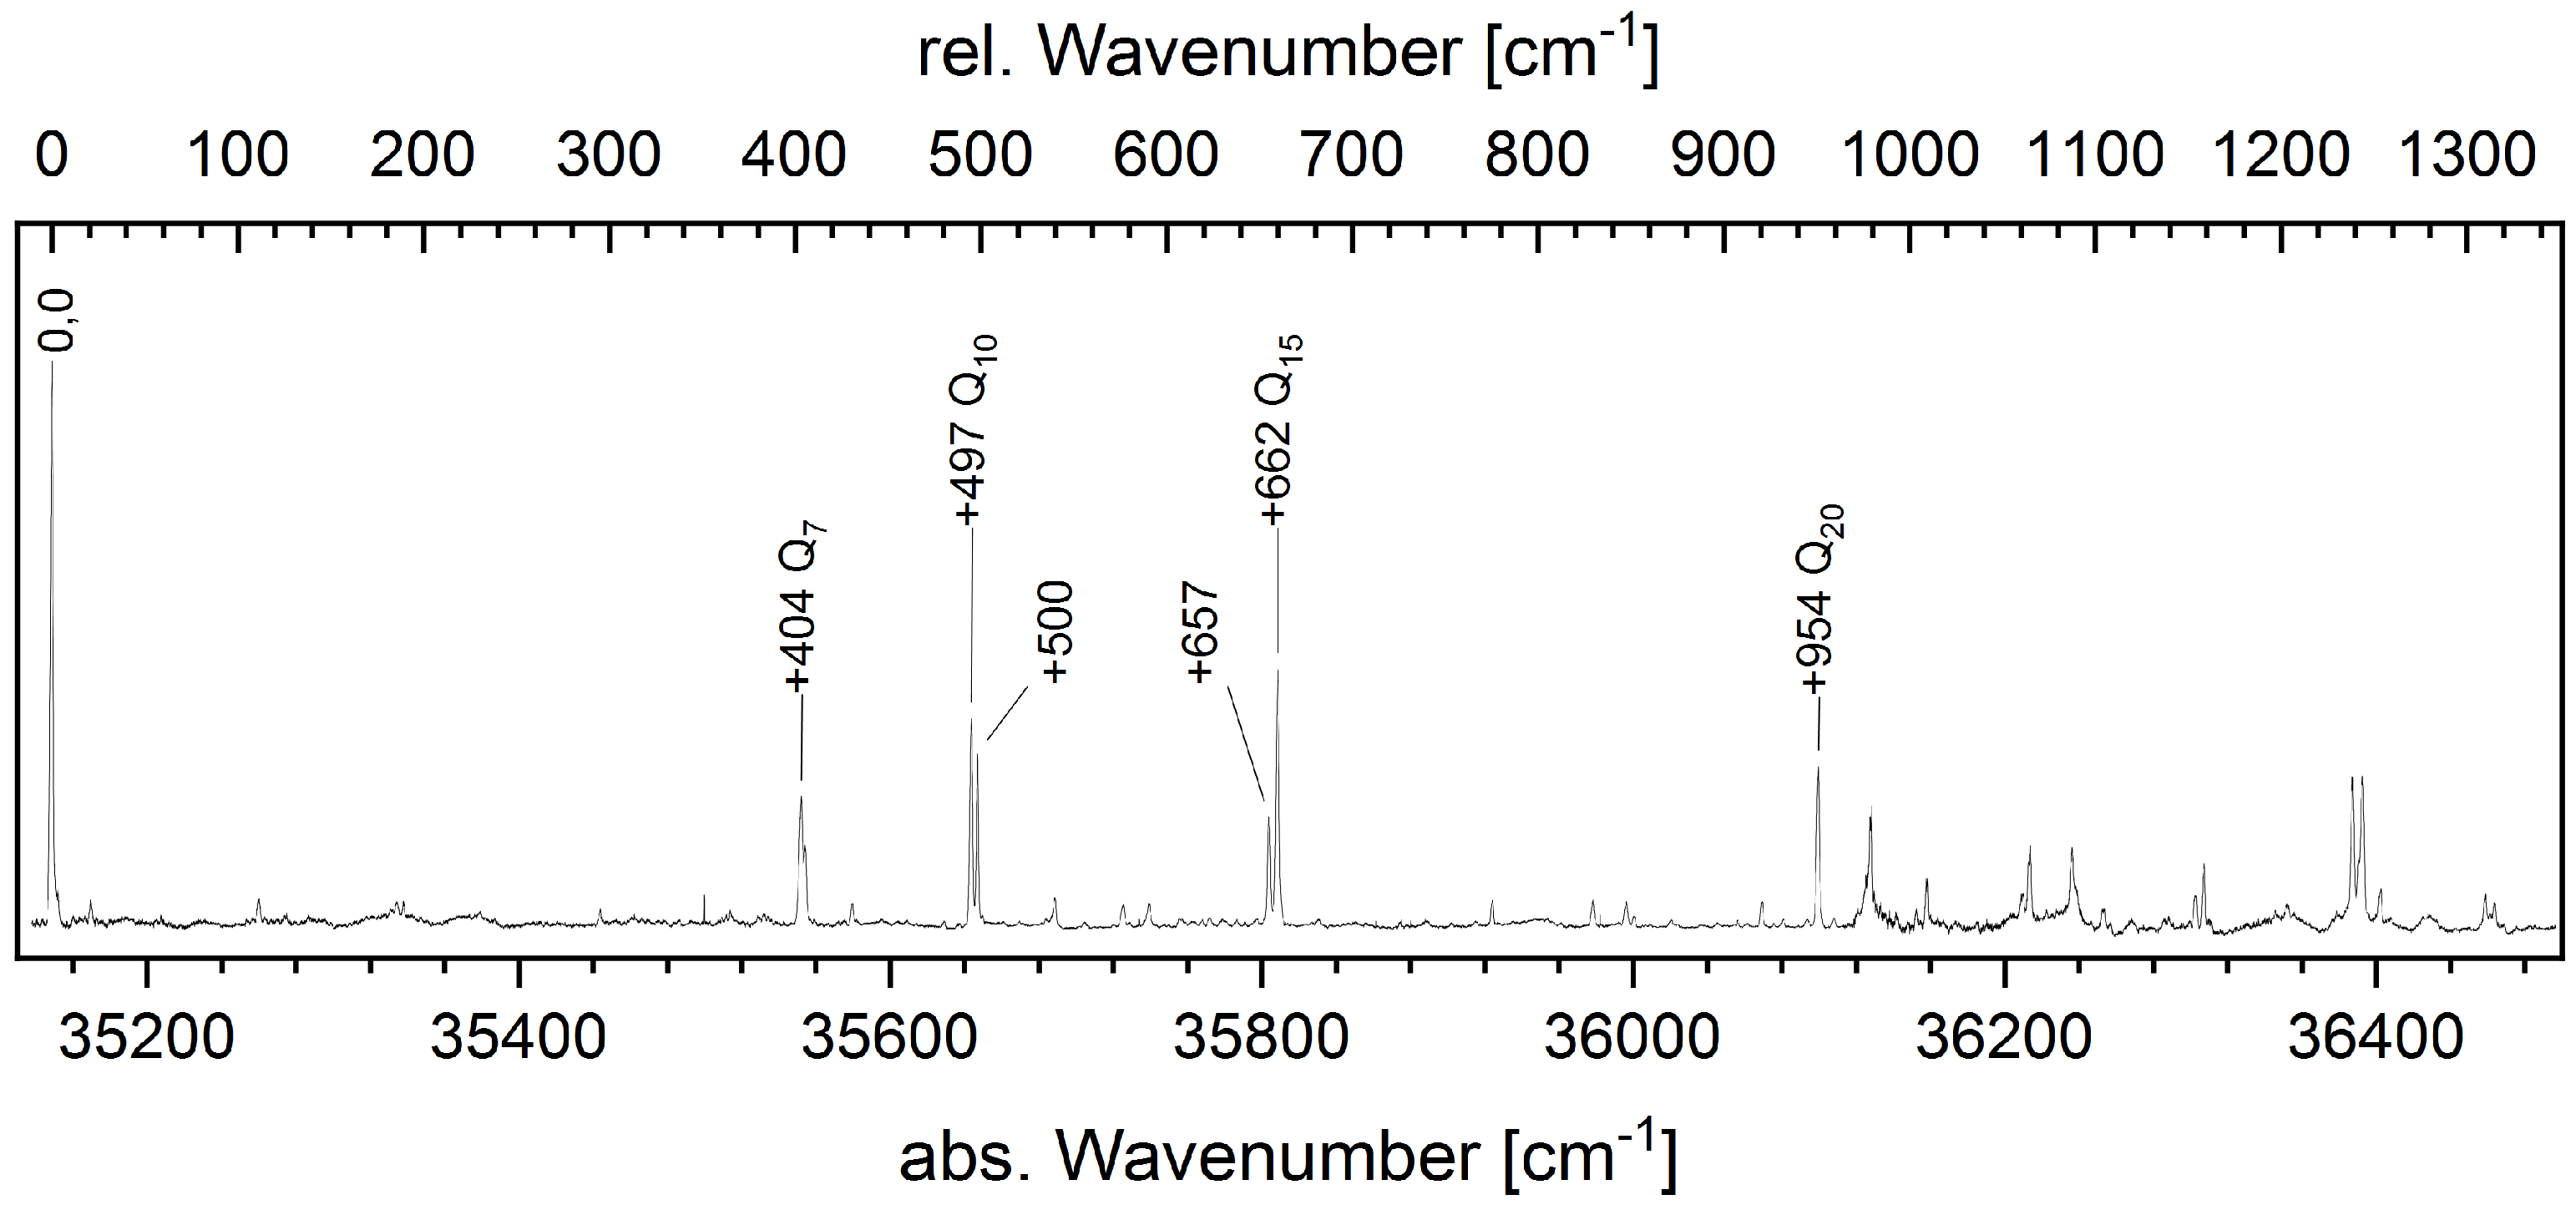
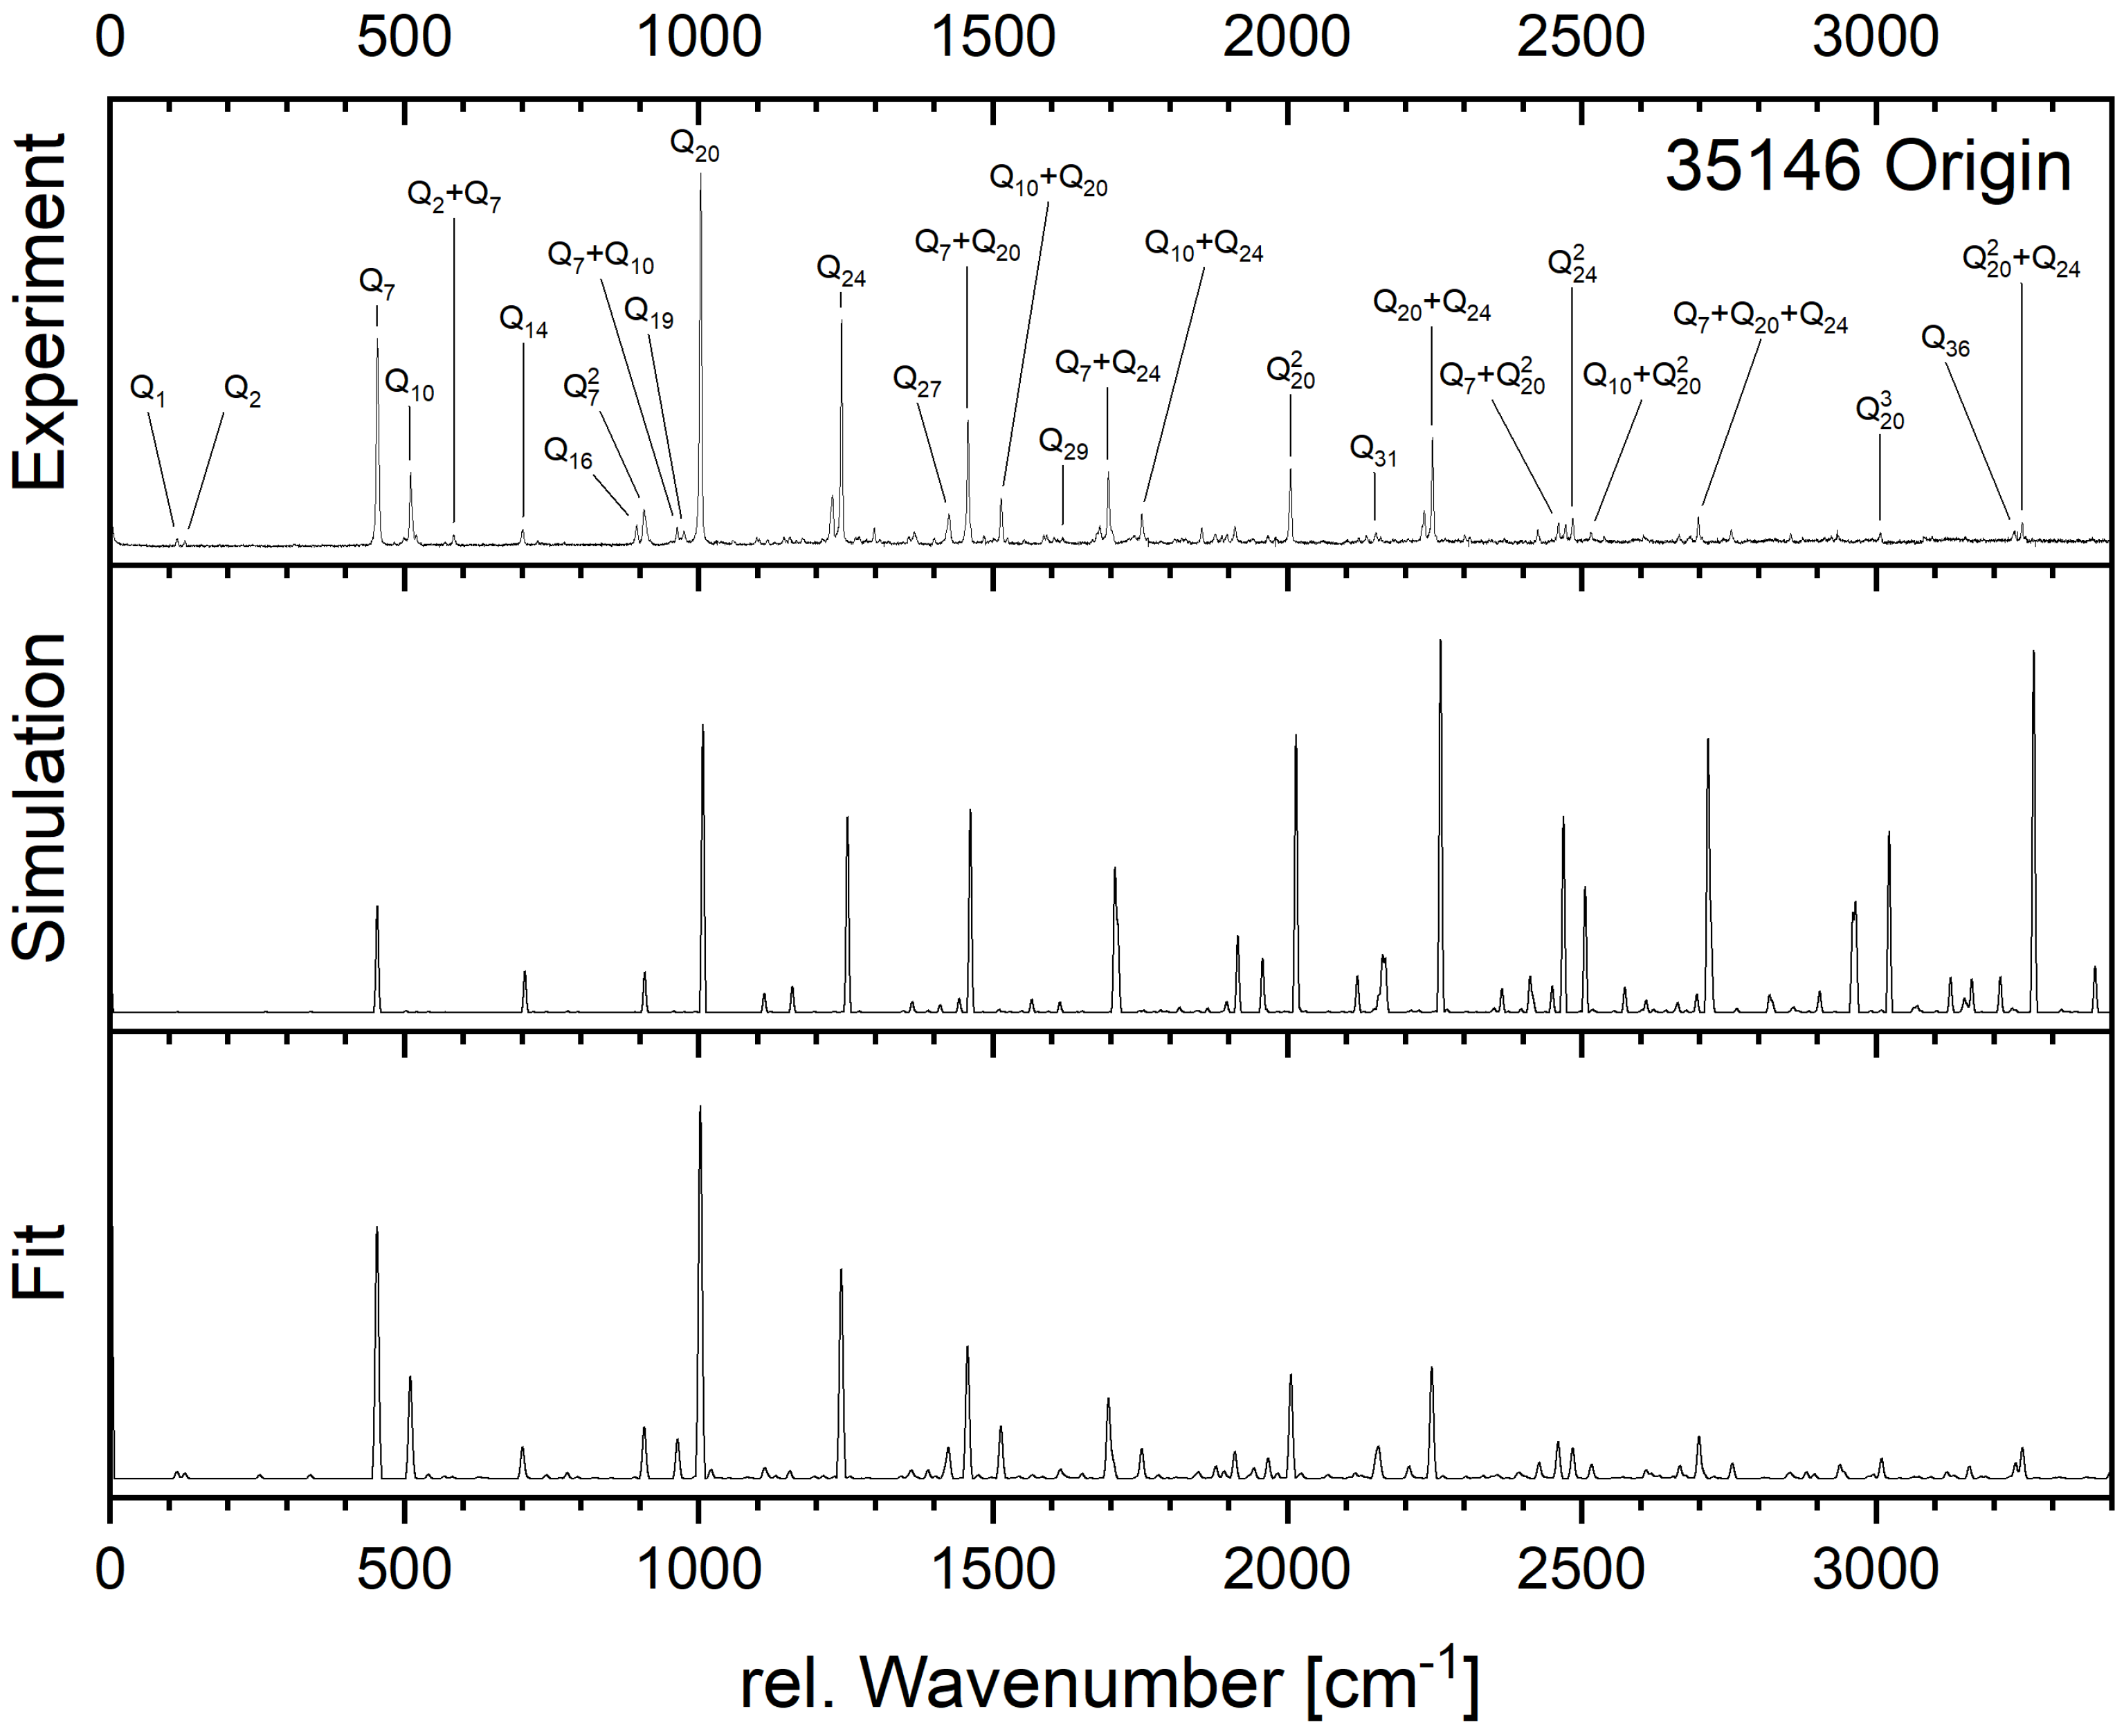
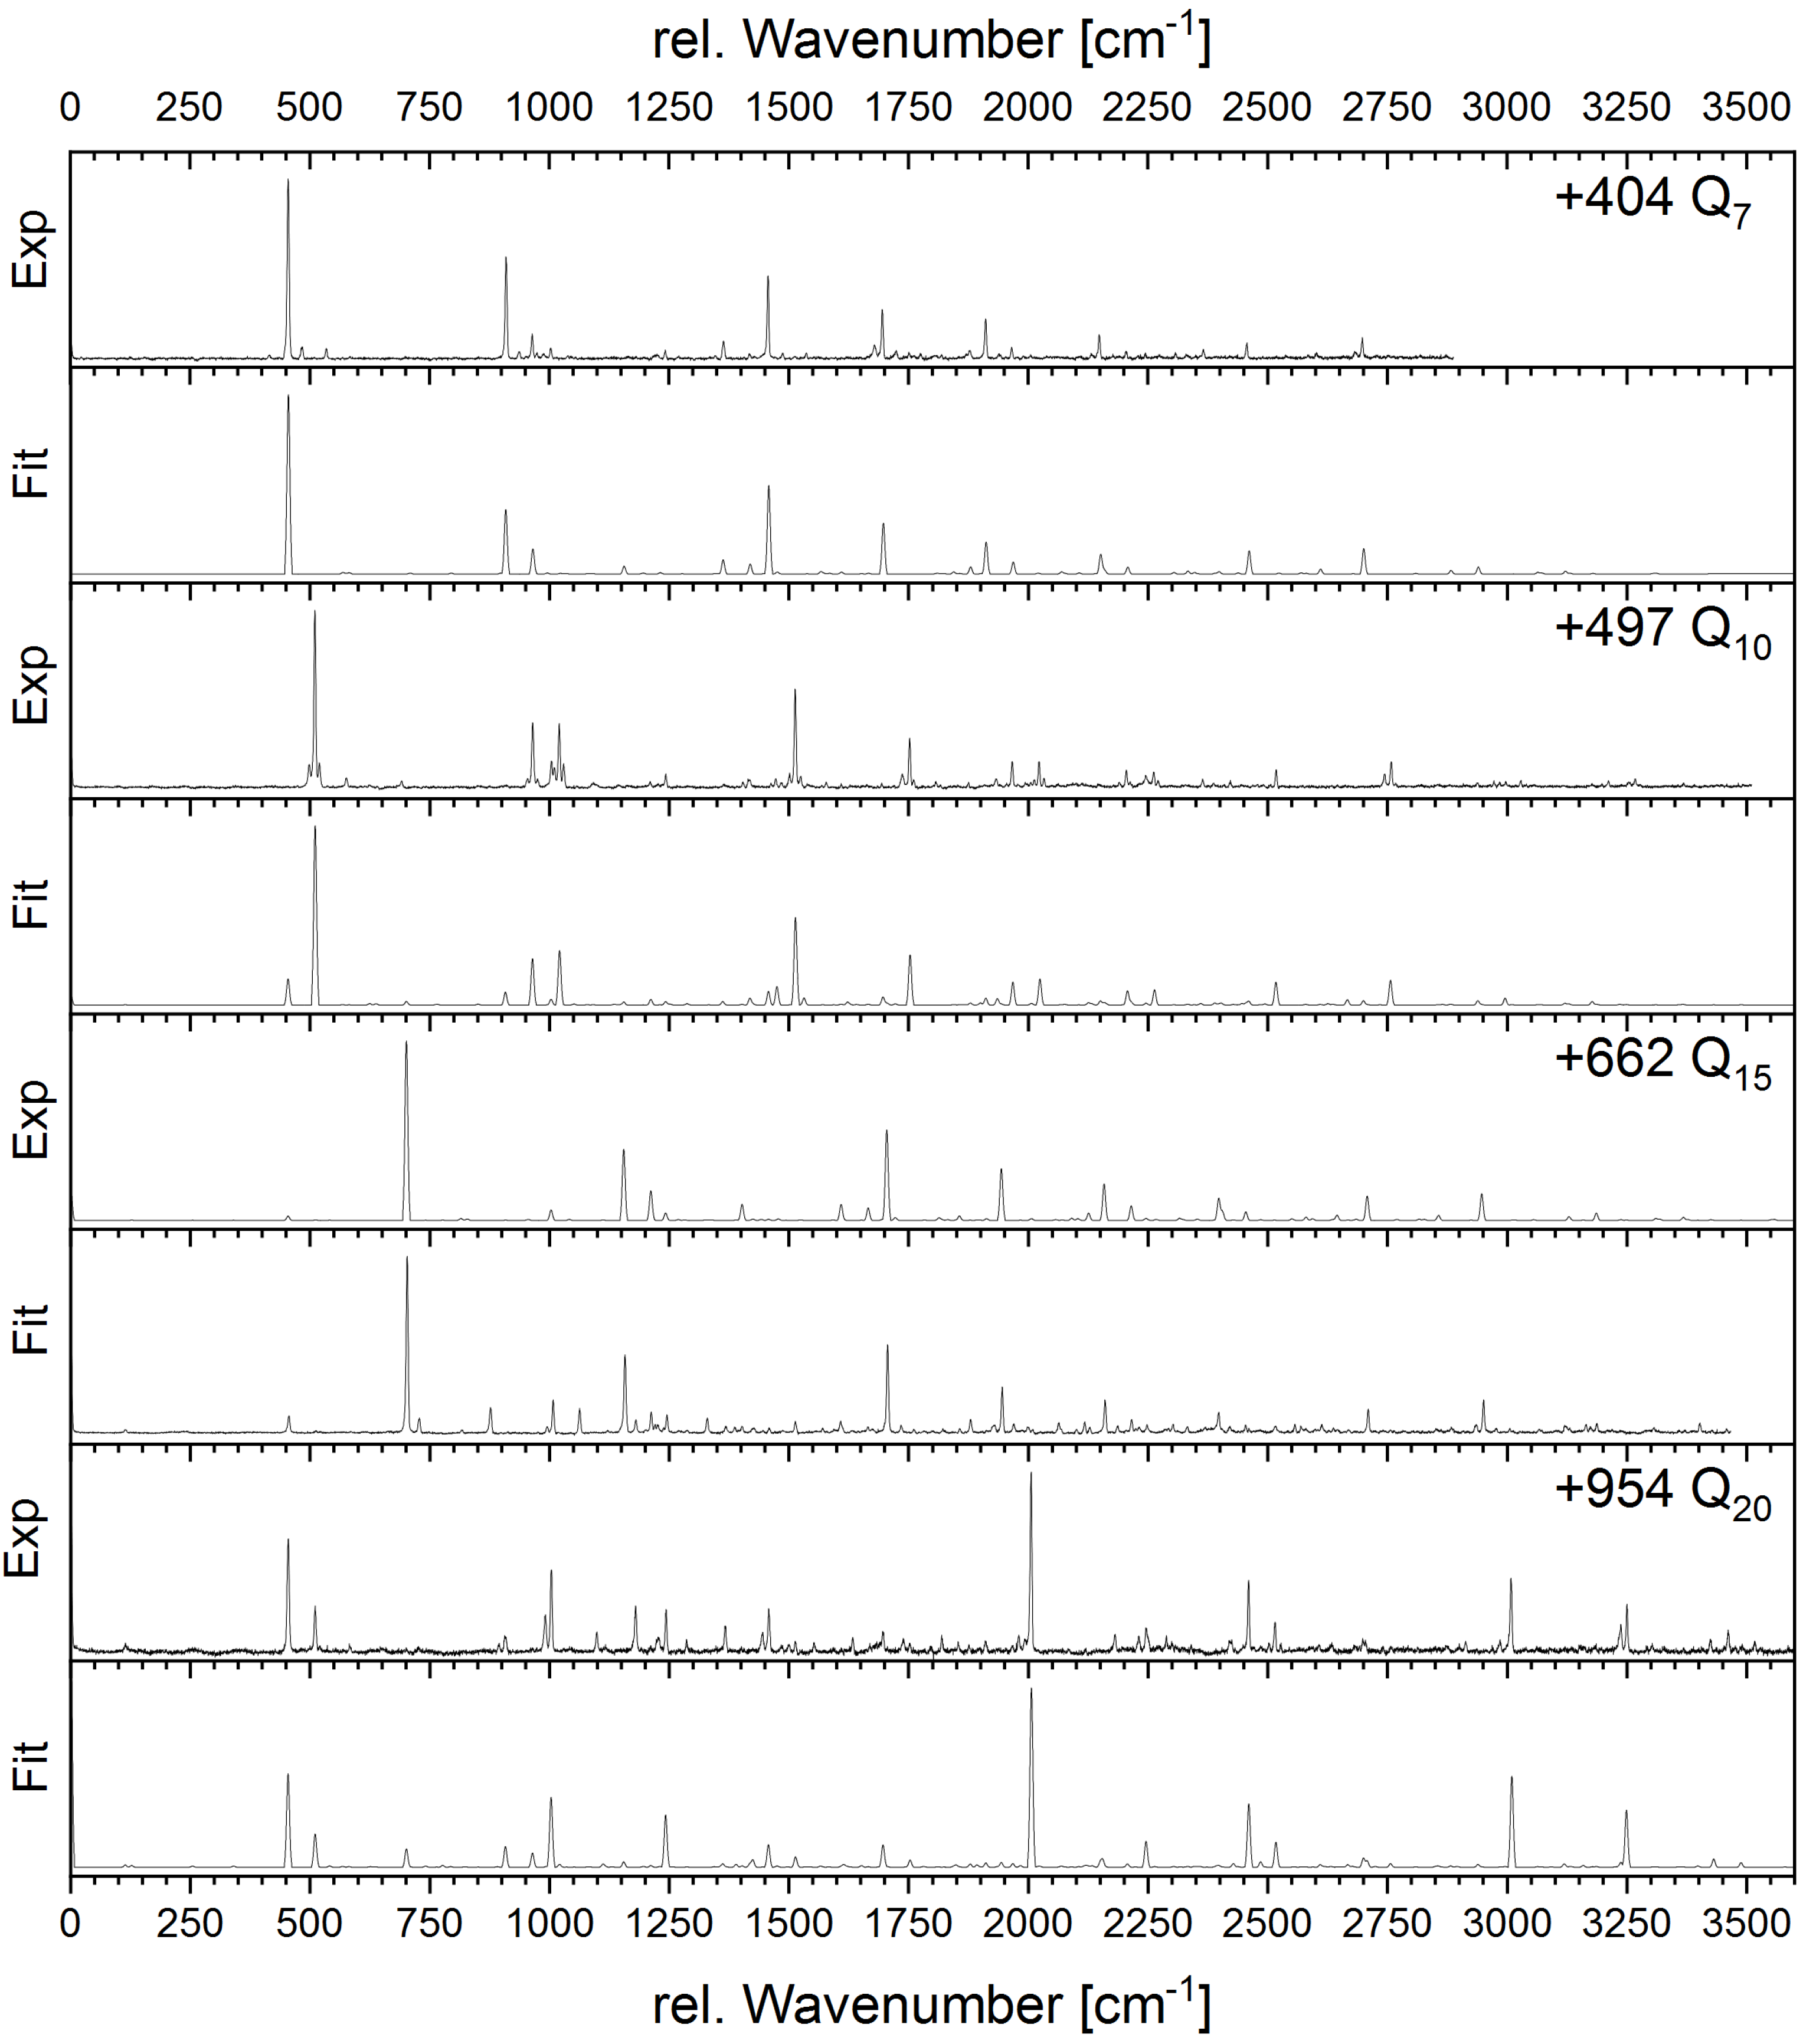
4.2.2. Fluorescence Emission

Dispersed fluorescence (DF) spectra were recorded by pumping the vibrationless origin at 35.146 cm 1 and the vibronic bands at +404, +497, +662, and +954 cm 1 relative to the electronic origin. The upper trace of Figure 4 shows the DF spectrum, obtained through the electronic origin. The assignment of the electronic ground state is guided by the normal-mode analysis from the CC2/cc-pVTZ calculations, shown in the middle trace of Figure 4. The lowest trace of Figure 4 presents the Franck–Condon fit of the emission spectrum, using the vibronic intensities given in Table S5 of the online Supporting Material.
The vibronic emission spectrum, which is obtained by excitation of the vibrationless origin, is mainly governed by overtones and combination bands of the modes Q 7 , Q 20 , and Q 24 . These modes are depicted in Figure S1 of the Supplementary Material available online. It is remarkable how the fit of the geometry changes improves the intensity features compared to the simulation performed at the ab initio geometry of the excited state. This is especially true for the overtone of mode Q 20 and combination bands of mode Q 20 with Q 24 . Obviously, the ab initio geometry is considerably distorted along these modes compared to the ground state in contrast to the experimental finding.
Figure 5 summarizes the results of simultaneous FC fits of the bands obtained from excitation of 0,0+404, 0,0+497, 0,0+662, and 0,0+954 cm 1 . In all cases a good overall agreement is obtained between the experimental intensity distribution and the fitted intensities.

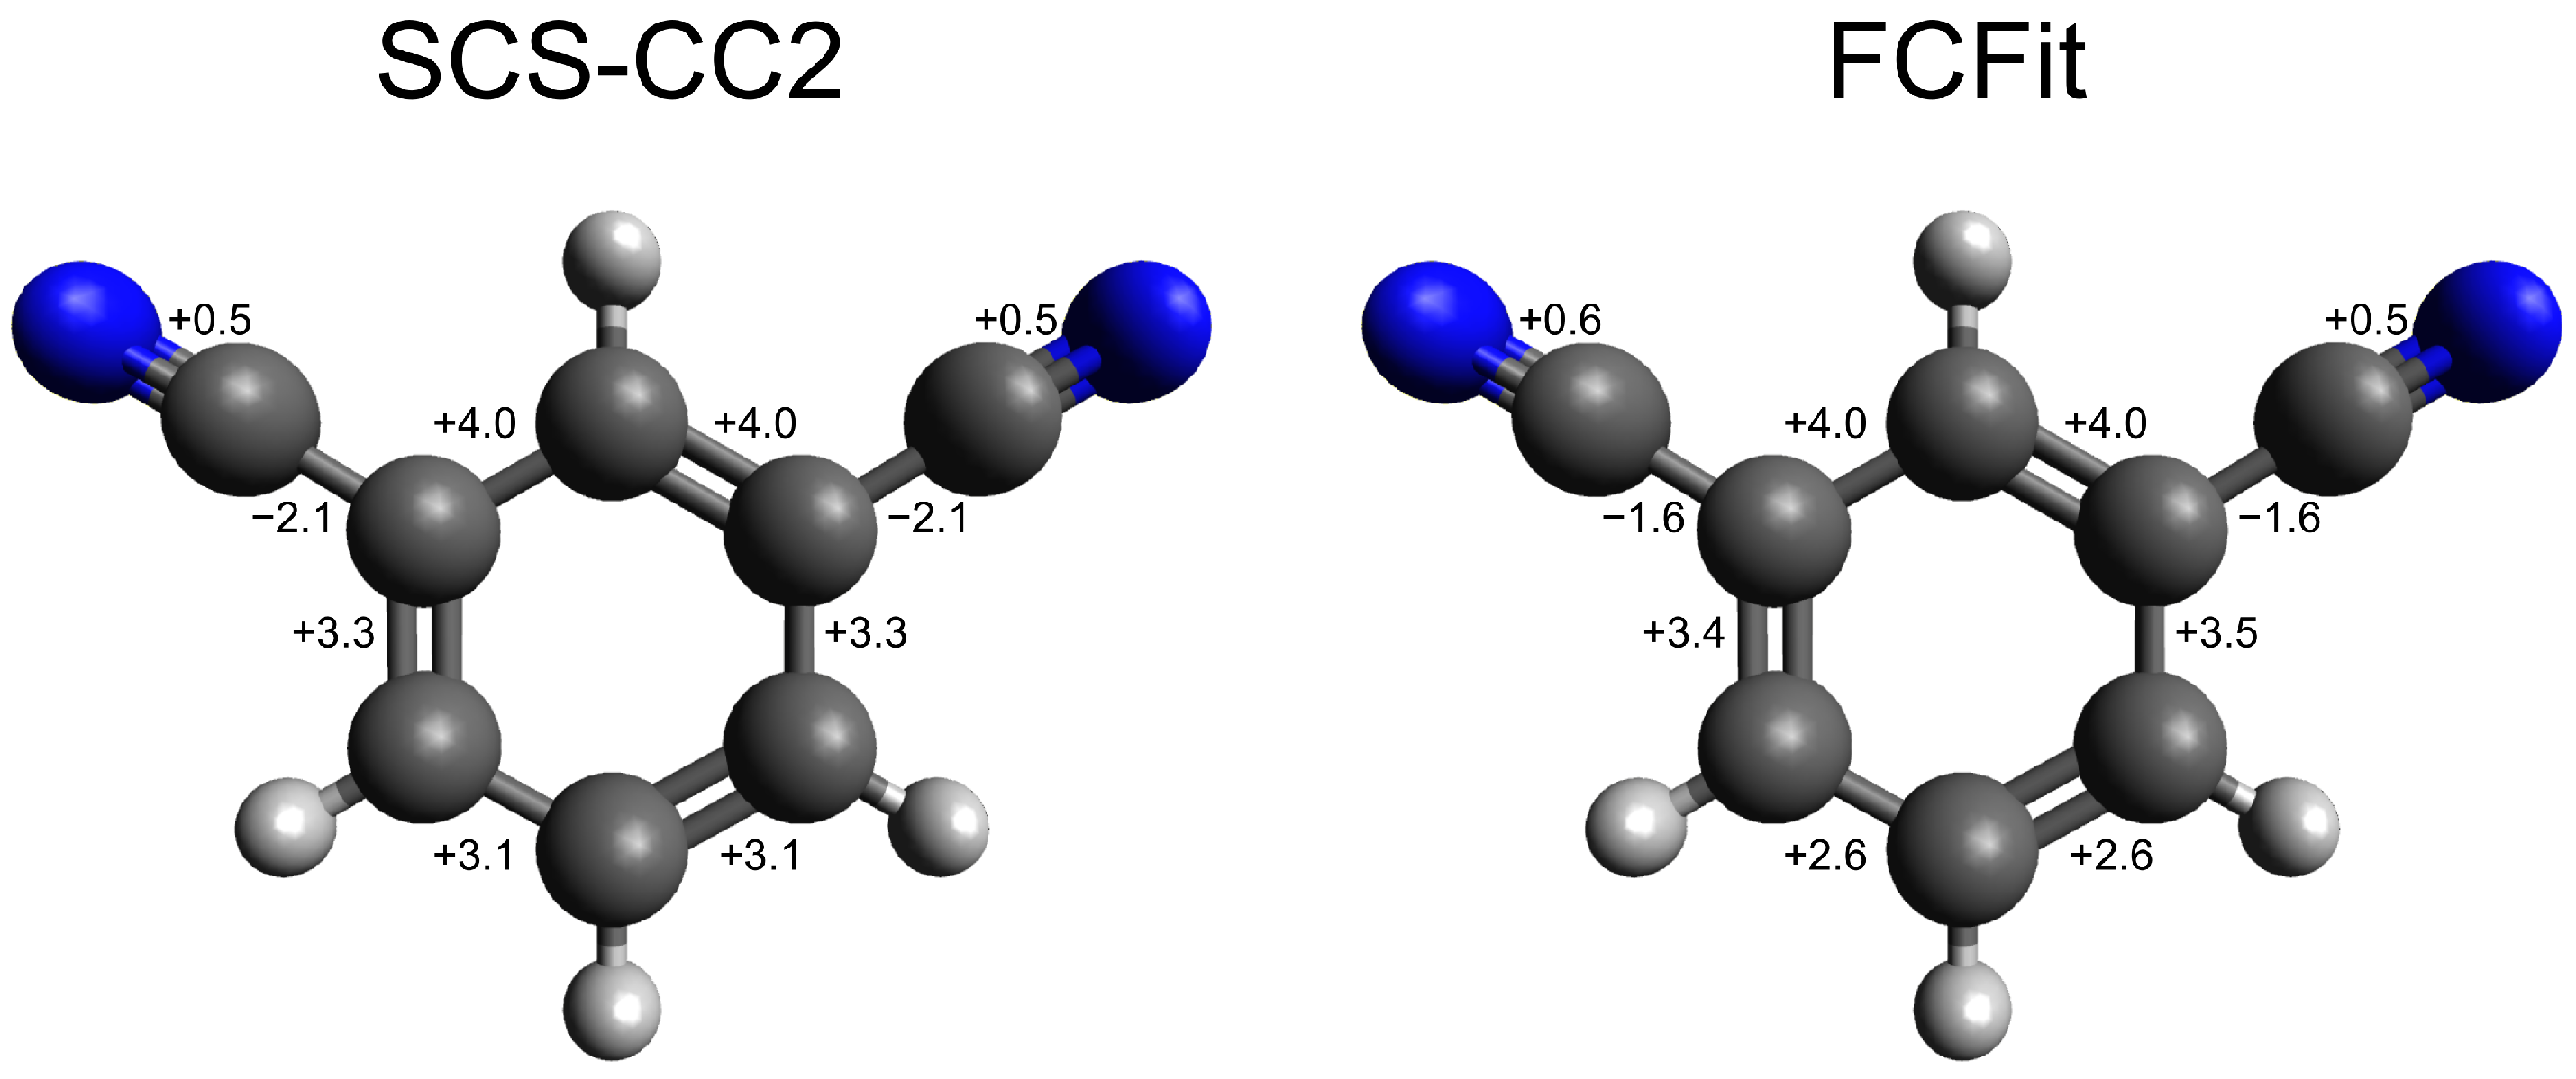
4.3. Franck–Condon Fit of Geometry Changes upon Electronic Excitation

We determined the structural changes of 1,3-DCB after electronic excitation from the ground ( S 0 ) to the lowest excited singlet state ( S 1 ) from a simultaneous fit of the intensities of 74 vibronic bands in five fluorescence emission spectra. The SCS-CC2/cc-pVTZ-optimized ground-state structure was distorted along 12 modes in order to fit the emission intensities. The rotational constants of the resulting excited-state structure are reported in the last column of Table 1. They are close to the ab initio-predicted values for the S 1 -state from the first column of Table 1.
The bond length changes in the chromophore upon electronic excitation are presented in Table 2 and Figure 6. Comparison of the ab initio-predicted bond length changes at the SCS-CC2/cc-pVTZ level and the experimental fit results shows a general good agreement. The changes in bond length are symmetric with respect to the C 2 axis and therefore retain the C 2 v -symmetry of the molecule. Both CN bond lengths increase (by 0.5 pm for ab initio and 0.6 pm for FCFit) upon excitation. The CC bond between the aromatic ring and the nitrile group decreases by 1.6 pm (FCFit). All ring CC bond lengths increase between 2.6 and 4.0 pm, which can be expected for a π π * excitation. The largest differences between the ab initio-calculated and experimentally determined ring bond lengths are found for the C(4)-C(5) and C(5)-C(6) bonds. Here, the theoretical and measured bond lengths differ by 5 pm, the former being longer than the latter. It is these differences that can be compensated for by a combination of the modes Q 20 and Q 24 .

5. Conclusions

FC theory allows for the determination of the geometry changes of 1,3-DCB upon excitation to the lowest excited singlet state. The aromatic ring CC bond lengths increase symmetrically, leading to an overall ring extension. Based on the results of an FC fit of the fluorescence emission spectra of 1,3-DCB, we predict that the changes in the rotational constants upon electronic excitation are Δ A = −88.4 MHz, Δ B = −15.6 MHz, and Δ C = −14.3 MHz. These changes are up to 15% larger than the predicted SCS-CC2/cc-pVTZ changes. The ab initio calculations predict the S 1 -state to be the L b -state, with a transition dipole moment orientation along the inertial a-axis, i.e., the S 1 S 0 as pure a-type spectrum. The reported symmetric geometry changes upon electronic excitation support the assignment of the S 1 -state to an L b -state. The bond length increases in the aromatic ring C-C bonds after electronic excitation are also reflected in the lower vibrational frequencies in the S 1 -state compared to the ground state.

Supplementary Materials

The following supporting information can be downloaded at: https://www.mdpi.com/article/10.3390/spectroscj3010004/s1, Figure S1: Visual representation of the ground state vibrational modes used in the calculation of the final fit. Figure S2: Duschinsky matrix between the ground and first excited state vibrational modes of 1,3-DCB. Figure S3: Dispersed fluorescence spectrum of the 0,0+404 excited state mode of 1,3-DCB. Figure S4: Dispersed fluorescence spectrum of the 0,0+497 excited state mode of 1,3-DCB. Figure S5: Dispersed fluorescence spectrum of the 0,0+662 excited state mode of 1,3-DCB. Figure S6: Dispersed fluorescence spectrum of the 0,0+954 excited state mode of 1,3-DCB. Figure S7: Dispersed fluorescence spectrum of the 0,0+657 excited state mode of 1,3-DCB. This spectrum was not included the final Fit because no valid combination of excitation energy, vibrational mode symmetry and simulation pattern was found. Table S1: SCS-CC2 optimized ground state geometry of 1,3-DCB. Table S2: SCS-CC2 optimized excited state (S1) geometry of 1,3-DCB. Table S3: Dimensionless displacement values with standard deviation σ of the 12 normal modes used in the fit of the 1,3-DCB. Table S4: SCS-CC2/cc-pVTZ calculated and experimental wavenumber of the 36 normal modes of the ground and first electronically excited state of 1,3-DCB. Table S5: Relative intensities of the observed ground state vibrational modes of 1,3-DCB.

Author Contributions

Conceptualization, M.S; methodology, M.S.; software, J.M.; validation, J.M., S.A. and M.S.; formal analysis, J.M.; investigation, J.M. and S.A.; data curation, J.M.; writing—original draft preparation, J.M. and M.S.; writing—review and editing, M.S.; visualization, J.M.; supervision, M.S.; project administration, J.M.; funding acquisition, M.S. All authors have read and agreed to the published version of the manuscript.

Funding

Deutsche Forschungsgemeinschaft DFG (SCHM 1043/14-1).

Data Availability Statement

Data are available upon request from the authors.

Acknowledgments

The authors gratefully acknowledge financial support from the Deutsche Forschungsgemeinschaft DFG (SCHM 1043/14-1).

Conflicts of Interest

The authors declare no conflicts of interest.

References

  1. Karle, J.; Mark, H.; Hargittai, I. Stereochemical Applications of Gas-Phase Electron Diffraction; Hargittai, I., Hargittai, M., Eds.; VCH: Deerfield Beach, FL, USA, 1988. [Google Scholar]
  2. Küpper, J.; Stern, S.; Holmegaard, L.; Filsinger, F.; Rouzée, A.; Rudenko, A.; Johnsson, P.; Martin, A.V.; Adolph, M. X-ray Diffraction from Isolated and Strongly Aligned Gas-Phase Molecules with a Free-Electron Laser. Phys. Rev. Lett. 2014, 112, 083002. [Google Scholar] [CrossRef]
  3. Majewski, W.A.; Meerts, W.L. Near UV spectra with fully resolved structure of naphthalene and perdeurated naphthalene. J. Mol. Spec. 1984, 104, 271–281. [Google Scholar] [CrossRef]
  4. Majewski, W.A.; Plusquellic, D.F.; Pratt, D.W. The rotationally resolved fluorescence excitation spectrum of 1-fluoronaphthalene. J. Chem. Phys. 1989, 90, 1362–1367. [Google Scholar] [CrossRef]
  5. Felker, P.M. Rotational coherence spectroscopy: Studies of the geometries of large gasphase species by picosecond time-domain methods. J. Phys. Chem. 1992, 96, 7844–7857. [Google Scholar] [CrossRef]
  6. Riehn, C. High-resolution pump-probe rotational coherence spectroscopy - rotational constants and structure of ground and electronically excited states of large molecular systems. Chem. Phys. 2002, 297, 283. [Google Scholar] [CrossRef]
  7. Williamson, J.; Dantus, M.; Kim, S.; Zewail, A. Ultrafast diffraction and molecular structure. Chem. Phys. Lett. 1992, 196, 529–534. [Google Scholar] [CrossRef]
  8. Bohm, M.; Tatchen, J.; Krügler, D.; Kleinermanns, K.; Nix, M.G.D.; LeGreve, T.A.; Zwier, T.S.; Schmitt, M. High-resolution and Dispersed Fluorescence Examination of Vibronic bands of Tryptamine: Spectroscopic signatures for La/Lb mixing near a conical intersection. J. Phys. Chem. A 2009, 113, 2456–2466. [Google Scholar] [CrossRef] [PubMed]
  9. Speckmeier, E.; Fischer, T.G.; Zeitler, K. A Toolbox Approach To Construct Broadly Applicable Metal-Free Catalysts for Photoredox Chemistry: Deliberate Tuning of Redox Potentials and Importance of Halogens in Donor-Acceptor Cyanoarenes. J. Am. Chem. Soc. 2018, 140, 15353–15365. [Google Scholar] [CrossRef] [PubMed]
  10. Geon Hyeong Lee, D.Y.K.; Kim, Y.S. High-Efficiency Dicyanobenzene-Based Organic Light-Emitting Diodes Exhibiting Thermally Activated Delayed Fluorescence. Mol. Cryst. Liq. Cryst. 2015, 621, 1–7. [Google Scholar]
  11. McGuire, B.A.; Loomis, R.A.; Burkhardt, A.M.; Lee, K.L.K.; Shingledecker, C.N.; Charnley, S.B.; Cooke, I.R.; Cordiner, M.A.; Herbst, E.; Kalenskii, S.; et al. Detection of two interstellar polycyclic aromatic hydrocarbons via spectral matched filtering. Science 2021, 371, 1265–1269. [Google Scholar] [CrossRef]
  12. McGuire, B.A.; Burkhardt, A.M.; Kalenskii, S.; Shingledecker, C.N.; Remijan, A.J.; Herbst, E.; McCarthy, M.C. Detection of the aromatic molecule benzonitrile (C6H5CN) in the interstellar medium. Science 2018, 359, 202–205. [Google Scholar] [CrossRef] [PubMed]
  13. Chitarra, O.; Lee, K.L.K.; Buchanan, Z.; Melosso, M.; McGuire, B.A.; Goubet, M.; Pirali, O.; Martin-Drumel, M.-A. Hunting the relatives of benzonitrile: Rotational spectroscopy of dicyanobenzenes. Astron. Astrophys 2021, 652, A163. [Google Scholar] [CrossRef]
  14. Zajonz, M.; Oberkirch, T.; Hebestreit, M.-L.; Lindic, M.M.; Hättig, C.; Schmitt, M. Excited state dipole moments of two dicyanobenzene isomers from thermochromic shifts and ab initio calculations. J. Photochem. Photobiol. A Chem. 2024, 452, 115589. [Google Scholar] [CrossRef]
  15. Ahlrichs, R.; Bär, M.; Häser, M.; Horn, H.; Kölmel, C. Electronic Structure Calculations onWorkstation Computers: The Program System TURBOMOLE. Chem. Phys. Lett. 1989, 162, 165–169. [Google Scholar] [CrossRef]
  16. Dunning, T.H., Jr. Gaussian basis sets for use in correlated molecular calculations. I. The atoms boron through neon and hydrogen. J. Chem. Phys. 1989, 90, 1007–1023. [Google Scholar] [CrossRef]
  17. Hättig, C.; Weigend, F. CC2 excitation energy calculations on large molecules using the resolution of the identity approximation. J. Chem. Phys. 2000, 113, 5154–5161. [Google Scholar] [CrossRef]
  18. Hättig, C.; Kohn, A. Transition moments and excited-state first-order properties in the coupled cluster model CC2 using the resolution-of-the-identity approximation. J. Chem. Phys. 2002, 117, 6939–6951. [Google Scholar] [CrossRef]
  19. Hättig, C. Geometry optimizations with the coupled-cluster model CC2 using the resolution-of-the-identity approximation. J. Chem. Phys. 2002, 118, 7751–7761. [Google Scholar] [CrossRef]
  20. Hellweg, A.; Grün, S.; Hättig, C. Benchmarking the performance of spin-component scaled cc2 in ground and electronically excited states. Phys. Chem. Chem. Phys. 2008, 10, 1159–1169. [Google Scholar] [CrossRef] [PubMed]
  21. Deglmann, P.; Furche, F.; Ahlrichs, R. An efficient implementation of second analytical derivatives for density functional methods. Chem. Phys. Lett. 2002, 362, 511–518. [Google Scholar] [CrossRef]
  22. Spangenberg, D.; Imhof, P.; Kleinermanns, K. The S1 state geometry of phenol determined by simultaneous Franck–Condon and rotational constants fits. Phys. Chem. Chem. Phys. 2003, 5, 2505–2514. [Google Scholar] [CrossRef]
  23. Brause, R.; Schmitt, M.; Spangenberg, D.; Kleinermanns, K. Determination of the excited state structure of 7-azaindole using a Franck–Condon analysis. Mol. Phys. 2004, 102, 1615–1623. [Google Scholar] [CrossRef]
  24. Doktorov, E.V.; Malkin, I.A.; Man’ko, V.I. Dynamical symmetry of vibronic transitions in polyatomic molecules and the Franck-Condon principle. J. Mol. Spec. 1975, 56, 1–20. [Google Scholar] [CrossRef]
  25. Doktorov, E.V.; Malkin, I.A.; Man’ko, V.I. Dynamical symmetry of vibronic transitions in polyatomic molecules and the Franck-Condon principle. J. Mol. Spec. 1977, 64, 302–326. [Google Scholar] [CrossRef]
  26. Levenberg, K. A method for the solution of certain non-linear problems in least squares. Q. Appl. Math. Meth. 1944, 2, 164–168. [Google Scholar] [CrossRef]
  27. Marquardt, D.D. An algorithm for least-squares estimation of nonlinear parameters. J. Soc. Ind. Appl. Math. 1963, 11, 431–441. [Google Scholar] [CrossRef]
  28. Schmitt, M.; Henrichs, U.; Müller, H.; Kleinermanns, K. Intermolecular vibrations of the phenol dimer revealed by spectral hole burning and dispersed fluorescence spectroscopy. J. Chem. Phys. 1995, 103, 9918–9928. [Google Scholar] [CrossRef]
  29. Roth, W.; Jacoby, C.; Westphal, A.; Schmitt, M. A study of 2H- and 2D-benzotriazole in their lowest electronic states by UV-laser double-resonance spectroscopy. J. Phys. Chem. A 1998, 102, 3048–3059. [Google Scholar] [CrossRef]
  30. Palmer, M.H.; Moyes, W.; Spiers, M. The Electronic Structure of Substituted Benzenes: Ab Initio Calculations and Photoelectron Spectra for Benzonitrile, the Tolunitriles, Ffluorobenzonitriles, Dicyanobenzenes and Ethynybenzene. J. Mol. Struct. 1980, 62, 165–167. [Google Scholar] [CrossRef]
  31. Wilson, E.B. The Normal Modes and Frequencies of Vibration of the Regular Plane Hexagon Model of the Benzene Molecule. Phys. Rev. 1934, 45, 706. [Google Scholar] [CrossRef]
  32. Varsanyi, G. Assignments for Vibrational Spectra of 700 Benzene Derivatives; Wiley: New York, NY, USA, 1974. [Google Scholar]
  33. Mulliken, R.S. Report on Notation for the Spectra of Polyatomic Molecules. J. Chem. Phys. 1955, 23, 1997–2011. [Google Scholar] [CrossRef]
  34. Herzberg, G. Molecular Spectra and Molecular Structure, III. Electronic Spectra and Electronic Structure of Polyatomic Molecules; van Nostrand Reinhold Company: New York, NY, USA, 1966. [Google Scholar]
  35. Kemp, D.J.; Tuttle, W.D.; Jones, F.M.; Gardner, A.M.; Andrejeva, A.; Wakefield, J.C.; Wright, T.G. Consistent assignment of the vibrations of symmetric and asymmetric meta-disubstituted benzenes. J. Mol. Spec. 2018, 346, 46–59. [Google Scholar] [CrossRef]
Figure 1. Molecular orbitals of 1,3-DCB with leading contributions to electronic state transitions. Red arrows indicate S 1 - and blue arrows S 2 -transitions.
Spectroscj 03 00004 g001
Figure 2. Transition dipole moment for excitation of 1,3-DCB to the lowest excited singlet state ( S 1 ) in the principal axis system.
Spectroscj 03 00004 g002
Figure 3. Fluorescence excitation spectrum of 1,3-DCB in the range between 284.6 and 274 nm. The bands marked with the assignment are used to excite the S 1 -state in order to obtain the fluorescence emission spectra, as described in the next section.
Spectroscj 03 00004 g003
Figure 4. Experimental, simulated and fitted spectra of the electronic origin of 1,3-DCB (35.146 cm 1 ), with assigned vibrational modes used in the fit.
Spectroscj 03 00004 g004
Figure 5. Experimental and fitted fluorescence emission spectra after excitation of four vibronic bands of 1,3-DCB at 0,0+404, +497, +662, and +954 cm 1 . Enlarged versions of the spectra along with their vibrational-mode assignments are given in the online Supporting Material, Tables S2–S5. An additional emission spectrum has been recorded, which we were not able to fit (Figure S6 of the online Supporting Material).
Spectroscj 03 00004 g005
Figure 6. Calculated and experimentally determined geometry changes of 1,3-DCB upon electronic excitation to the S 1 -state.
Spectroscj 03 00004 g006
Table 1. Calculated and experimental inertial parameters A, B, and C; the resulting inertial defects Δ I ; angle of the transition moment vector in the molecular fixed frame with the inertial a-axis θ ; and the adiabatic excitation energies ν 0 of 1,3-DCB. Doubly primed parameters refer to the ground state, single primed to the excited state. Experimental values of ground-state rotational constants from millimeter- and centimeter-wave spectra [13] for the excited state from the FC analysis of this work.
SCS-CC2/cc-pVTZExperimentFCFit
A /MHz2706.72723.018609(46) 12706.7 2
B /MHz899.9906.419893(21) 1899.9 2
C /MHz675.4679.859840(15) 1675.4 2
Δ I /amu Å20.00.2070.0
A ( S 1 )/MHz2632.9-2618.3
B ( S 1 )/MHz885.9-884.3
C ( S 1 )/MHz662.9-661.1
Δ I ( S 1 ) /amu Å20.0-−0.014
Δ A( S 1 - S 0 )/MHz−73.8-−88.4
Δ B( S 1 - S 0 )/MHz−14.0-−15.6
Δ C( S 1 - S 0 )/MHz−12.5-−14.3
θ ( S 1 ) /0.0--
ν 0 ( S 1 ) / cm 1 35,958.035,146 3-
1 Results from millimeter- and centimeter-wave spectra; ref. [13]. 2 The ab initio-calculated S 0 structure is the reference state in the FC fits. 3 From the LIF spectrum in this study.
Table 2. SCS-CC2/cc-pVTZ- and FC fit-calculated geometry changes in pm of 1,3-DCB.
StateS0S1 Δ (S1-S0)
MethodSCS-CC2FCFitSCS-CC2FCFitSCS-CC2FCFit
C1-C2139.4139.4142.5142.0+3.1+2.6
C2-C3140.2140.2143.5143.7+3.3+3.5
C3-C4139.9139.9143.9143.9+4.0+4.0
C4-C5139.9139.9143.9143.9+4.0+4.0
C5-C6140.2140.2143.5143.6+3.3+3.4
C6-C1139.4139.4142.5142.0+3.1+2.6
C3-C8143.8143.8141.7142.2−2.1−1.6
C8-N2117.6117.6118.1118.1+0.5+0.5
C5-C7143.8143.8141.7142.2−2.1−1.6
C7-N1117.6117.6118.1118.2+0.5+0.6
Disclaimer/Publisher’s Note: The statements, opinions and data contained in all publications are solely those of the individual author(s) and contributor(s) and not of MDPI and/or the editor(s). MDPI and/or the editor(s) disclaim responsibility for any injury to people or property resulting from any ideas, methods, instructions or products referred to in the content.

