Article

High-Resolution Imaging Methods for Identification of Calcium Crystal Types in Osteoarthritis

by
Adrian Buchholz
,
Sina Stücker
,
Franziska Koßlowski
,
Christoph H. Lohmann
and
Jessica Bertrand
*
Department of Orthopaedic Surgery, Otto-von-Guericke University, 39120 Magdeburg, Germany
*
Author to whom correspondence should be addressed.
These authors contributed equally to this work.
Gout Urate Cryst. Depos. Dis. 2023, 1(2), 62-82; https://doi.org/10.3390/gucdd1020007
Submission received: 4 January 2023 / Revised: 6 March 2023 / Accepted: 15 March 2023 / Published: 4 April 2023

Abstract

:
The detection and differentiation of BCP and CPP crystals in calcified tissue is an important factor in the context of research and potential future treatment of osteoarthritis and chondrocalcinosis. Current standard methods originate from clinical practice and often lack precision in the correct identification of the calcium crystal type. In this work, a step-by-step guide for the use of the high-resolution imaging methods of tissue sections, Raman spectroscopy and scanning electron microscopy (SEM) in combination with energy-dispersive X-ray spectroscopy (EDS), for calcium crystal identification is presented. Sample preparation including Von Kossa staining, measurement and measurement parameters, data processing and data analysis methods are discussed and described. Furthermore, the different methods are compared to show advantages and disadvantages. Overall, Raman spectroscopy is a reasonable method from an economic point of view and regarding the time/effort required for acquiring highly reliable data in calcium crystal identification. Potentially, semi-quantitative results can be obtained with little effort and without the destruction of the respective test sample. The analysis/penetration depth during the Raman measurements, which is not precisely defined, poses a potential problem for accuracy. SEM can also be used for this task but requires more time, advanced technical knowledge and a pre-treatment of the samples using, e.g., gold sputtering, which may distort further analysis on the specific specimen. Therefore, this technique yields additional value compared to Raman spectroscopy only with additional research questions needed to be answered in the same sample, such as analysis of the sample topography or analysis of other unknown particles/deposits using EDS. The methods described in this manuscript are helpful for retrospective analyses in the context of research, but can also be used for potential future treatment strategies to discriminate between osteoarthritis and chondrocalcinosis patients.

1. Introduction

Osteoarthritis (OA) is one of the leading causes of disability worldwide and often results in the need for joint replacement surgery [1]. The knee is the most commonly affected joint with a global prevalence of OA of over 22% in adults older than 40 years [2]. Calcification of affected joint tissue is a common phenomenon in OA joints and is caused by the deposition of calcium crystals in the extracellular matrix. Calcium crystals can be found in all articular tissue, including hyaline and meniscal fibrillary cartilage, synovial membrane and synovial fluid [3].
The two main types of pathogenic calcium-containing crystals that have been found in arthritic joints are basic calcium phosphate (BCP) crystals and calcium pyrophosphate dihydrate (CPP) crystals. BCP crystals describe a group of small, sub/ultramicroscopic (20–100 nm) crystals, mainly composed of hydroxyapatite Ca10(PO4)6-(OH)2 and its precursors, tricalcium phosphate Ca3(PO4)2 and octacalcium phosphate Ca8H2(PO4)6⋅5H2O [4,5]. BCP crystals have been implicated in OA pathogenesis, causing cartilage degradation, chondrocyte hypertrophy, synovitis and chondrocyte apoptosis [6,7].
CPP crystals are rhomboid- or needle-shaped crystals with a size of 1–20 µm. Intra-articular CPP crystals mostly manifest in chondrocalcinosis and several other clinical phenotypes collectively referred to as CPP deposition disease. CPP deposition disease is typically associated with acute inflammatory flares resembling gout or rheumatoid arthritis but can also show a chronic degenerative OA-like progression [8,9]. CPP deposition is commonly diagnosed based on radiographic evaluation [10] or synovial fluid analysis [11].
However, both of these methods lack sensitivity and reliability in crystal detection and differentiation. Since only sizable calcified deposits are radiologically visible, conventional radiographs are only able to identify a minority of patients with CPP crystals in their synovial fluid. Radiographic evaluation is particularly unreliable in later disease stages due to joint space narrowing and advanced cartilage attenuation [12].
Ultrasound sonography as a widely available, non-invasive and inexpensive tool/method can be used to detect mineralization at a limited expense [8]. For CPP, calcification is made visible as a linear density in the fibrocartilage and hyaline cartilage of the affected joint [13]. Though, it remains difficult to distinguish gout from CPP by solely using sonography since the performance is strongly operator dependent. Smaller, less prevalent mineralisation as seen in OA is not detectable or easily missed, hence it lacks sensitivity and specificity for our purposes [14].
Dual-energy computed tomography (DECT) is a relatively new diagnostic method that can also be used to differentiate calcifications and intraparenchymal or intracranial haemorrhage [15,16,17]. Furthermore, Becce et al. are also working on a method for finer differentiation of crystal types based on the density of the detected calcified areas [18,19,20].
Since the in vivo identification of calcium crystals, even with modern technologies, remains difficult, in vitro techniques have been employed to perform this task.
Standardized polarized light microscopy has been widely used to detect CPP crystals mainly in synovial fluid. However, accurate detection is strongly operator dependent, since CPP crystals can be mistaken for monosodium crystals due to their weak or absent birefringence [21,22]. Imaging BCP crystals with light microscopy proves to be even more difficult. Due to their small size, BCP crystals are mostly not visible with light microscopy, unless aggregated into larger clusters of amorphous appearance that are often mistakenly viewed as debris [22].
To improve the detection of calcium crystals, in vitro stainings such as Alizarin Red S and Von Kossa are often used to complement conventional light microscopy. Alizarin red S stains calcium salts in a deep orange to red colour and provides a fast and simple screening method to detect the presence of calcium crystals [23]. However, high background staining and high rates of falsely-positive results have been reported [22,24] Von Kossa is another widely used in vitro staining method to detect tissue mineralization utilizing a chemical reaction between silver ions and calcium phosphate [25]. However, these staining methods cannot distinguish between BCP and CPP deposits, as both crystals consist of calcium and phosphate.
Fourier-transform infrared spectroscopy (FTIR) is being used in research to identify calcification of various human crystalline pathologies [26,27,28,29]. This method is also regularly applied in the clinical context [27]. It is usually used to examine, e.g., kidney stones, urinary calculi, and abnormal skin deposits [27,28,30,31]. However, the standard use of this technique for the identification and classification of BCP and CPP crystals in joint tissues has not yet been employed in the guidelines.
None of these methods mentioned above enables precise differentiation between BCP and CPP crystals in vivo. An accurate definition of the type of calcification requires more advanced methods such as high-resolution microscopy and spectroscopy such as scanning electron microscopy (SEM) and Raman spectroscopy, which can only be performed in vitro.
SEM creates a high-resolution image of a sample by scanning an electron beam across its surface, enabling a resolution in the nanometer range [32]. In combination with energy-dispersive X-ray spectroscopy (EDS), SEM is a powerful tool for the morphological and chemical analysis of calcified tissues. Energy-dispersive X-ray spectroscopy utilizes X-ray scattering of a sample to identify chemical elements based on characteristic emission spectra [33]. Multiple studies have applied SEM to identify calcium crystals in synovial fluid [34] and cartilage samples [35].
Similar to EDS, Raman spectroscopy fingerprints molecules based on inelastic vibrational light scattering. Originating in non-biological sciences, Raman is increasingly employed for calcium crystal analysis in biological samples in vitro, mainly focussing on MSU and CPP crystal identification in synovial fluid [36,37].
This study compares SEM/EDS and Raman spectroscopy for high-resolution imaging and differentiation of calcium-containing BCP and CPP crystals in histological joint tissue samples, also providing a guideline for applying each technique and interpreting the results.

2. Materials and Methods

2.1. Sample Collection and Preparation

Human articular cartilage and synovial membrane samples were obtained from end-stage OA patients undergoing knee joint replacement after written informed consent. Sampling was approved by the Institutional Review Board (IRB) of the Medical School, Otto-von-Guericke University Magdeburg (IRB No. 28/20). Full-thickness cartilage samples were dissected from the main loading area of the medial compartment of the tibial plateau, fixed and processed for histological staining. Similarly, synovial membrane samples were cut into thin slices.
Cartilage and synovial membrane samples were fixed with 4% paraformaldehyde (Fischar) for at least 24 h, dehydrated using ethanol and embedded in paraffin. Consecutive sections of 4 µm thickness were cut on a microtome (Hyrax M55, Zeiss, Oberkochen, Germany) and mounted on glass slides (Epredia™). Microscope slides made from calcium fluoride or quartz are suitable alternatives as they account for significantly less background on Raman spectra due to lower autofluorescence. The comparatively high autofluorescence of glass is rarely relevant in practice if the sample thickness is sufficient. Sections were deparaffinised using xylene (9713.5 Carl Roth, Karlsruhe, Germany) and rehydrated using a degrading ethanol series. Sections were then washed with aqua dest. before staining, Raman spectroscopy or SEM imaging, respectively. Von Kossa and Alizarin Red S stainings were performed to assess/localize tissue calcification and guide subsequent Raman and SEM analysis of calcium deposits. For SEM imaging and Raman spectroscopy, sections were deparaffinised, washed with aqua dest and air dried.
Alizarin Red S and Von Kossa staining are widely used histological stainings to detect tissue calcification. For Von Kossa staining, deparaffinised tissue sections were incubated in 5% silver nitrate solution for 1 h under daylight and rinsed with aqua dest. Sections were then incubated with 1% pyrogallic acid for 3 min, rinsed again and incubated with 5% sodium thiosulfate solution for 3 min. Stained sections were dehydrated via an increasing series of ethanol and xylene and mounted with Canada balsam. For Alizarin Red S staining, deparaffinised tissue sections were washed in aqua dest and incubated with 2% Alizarin Red S for 2 min followed by dehydrating series of acetone and xylene and mounted with Canada balsam. Images were taken on a Zeiss Axiocam 702 mono using a 100× magnification.
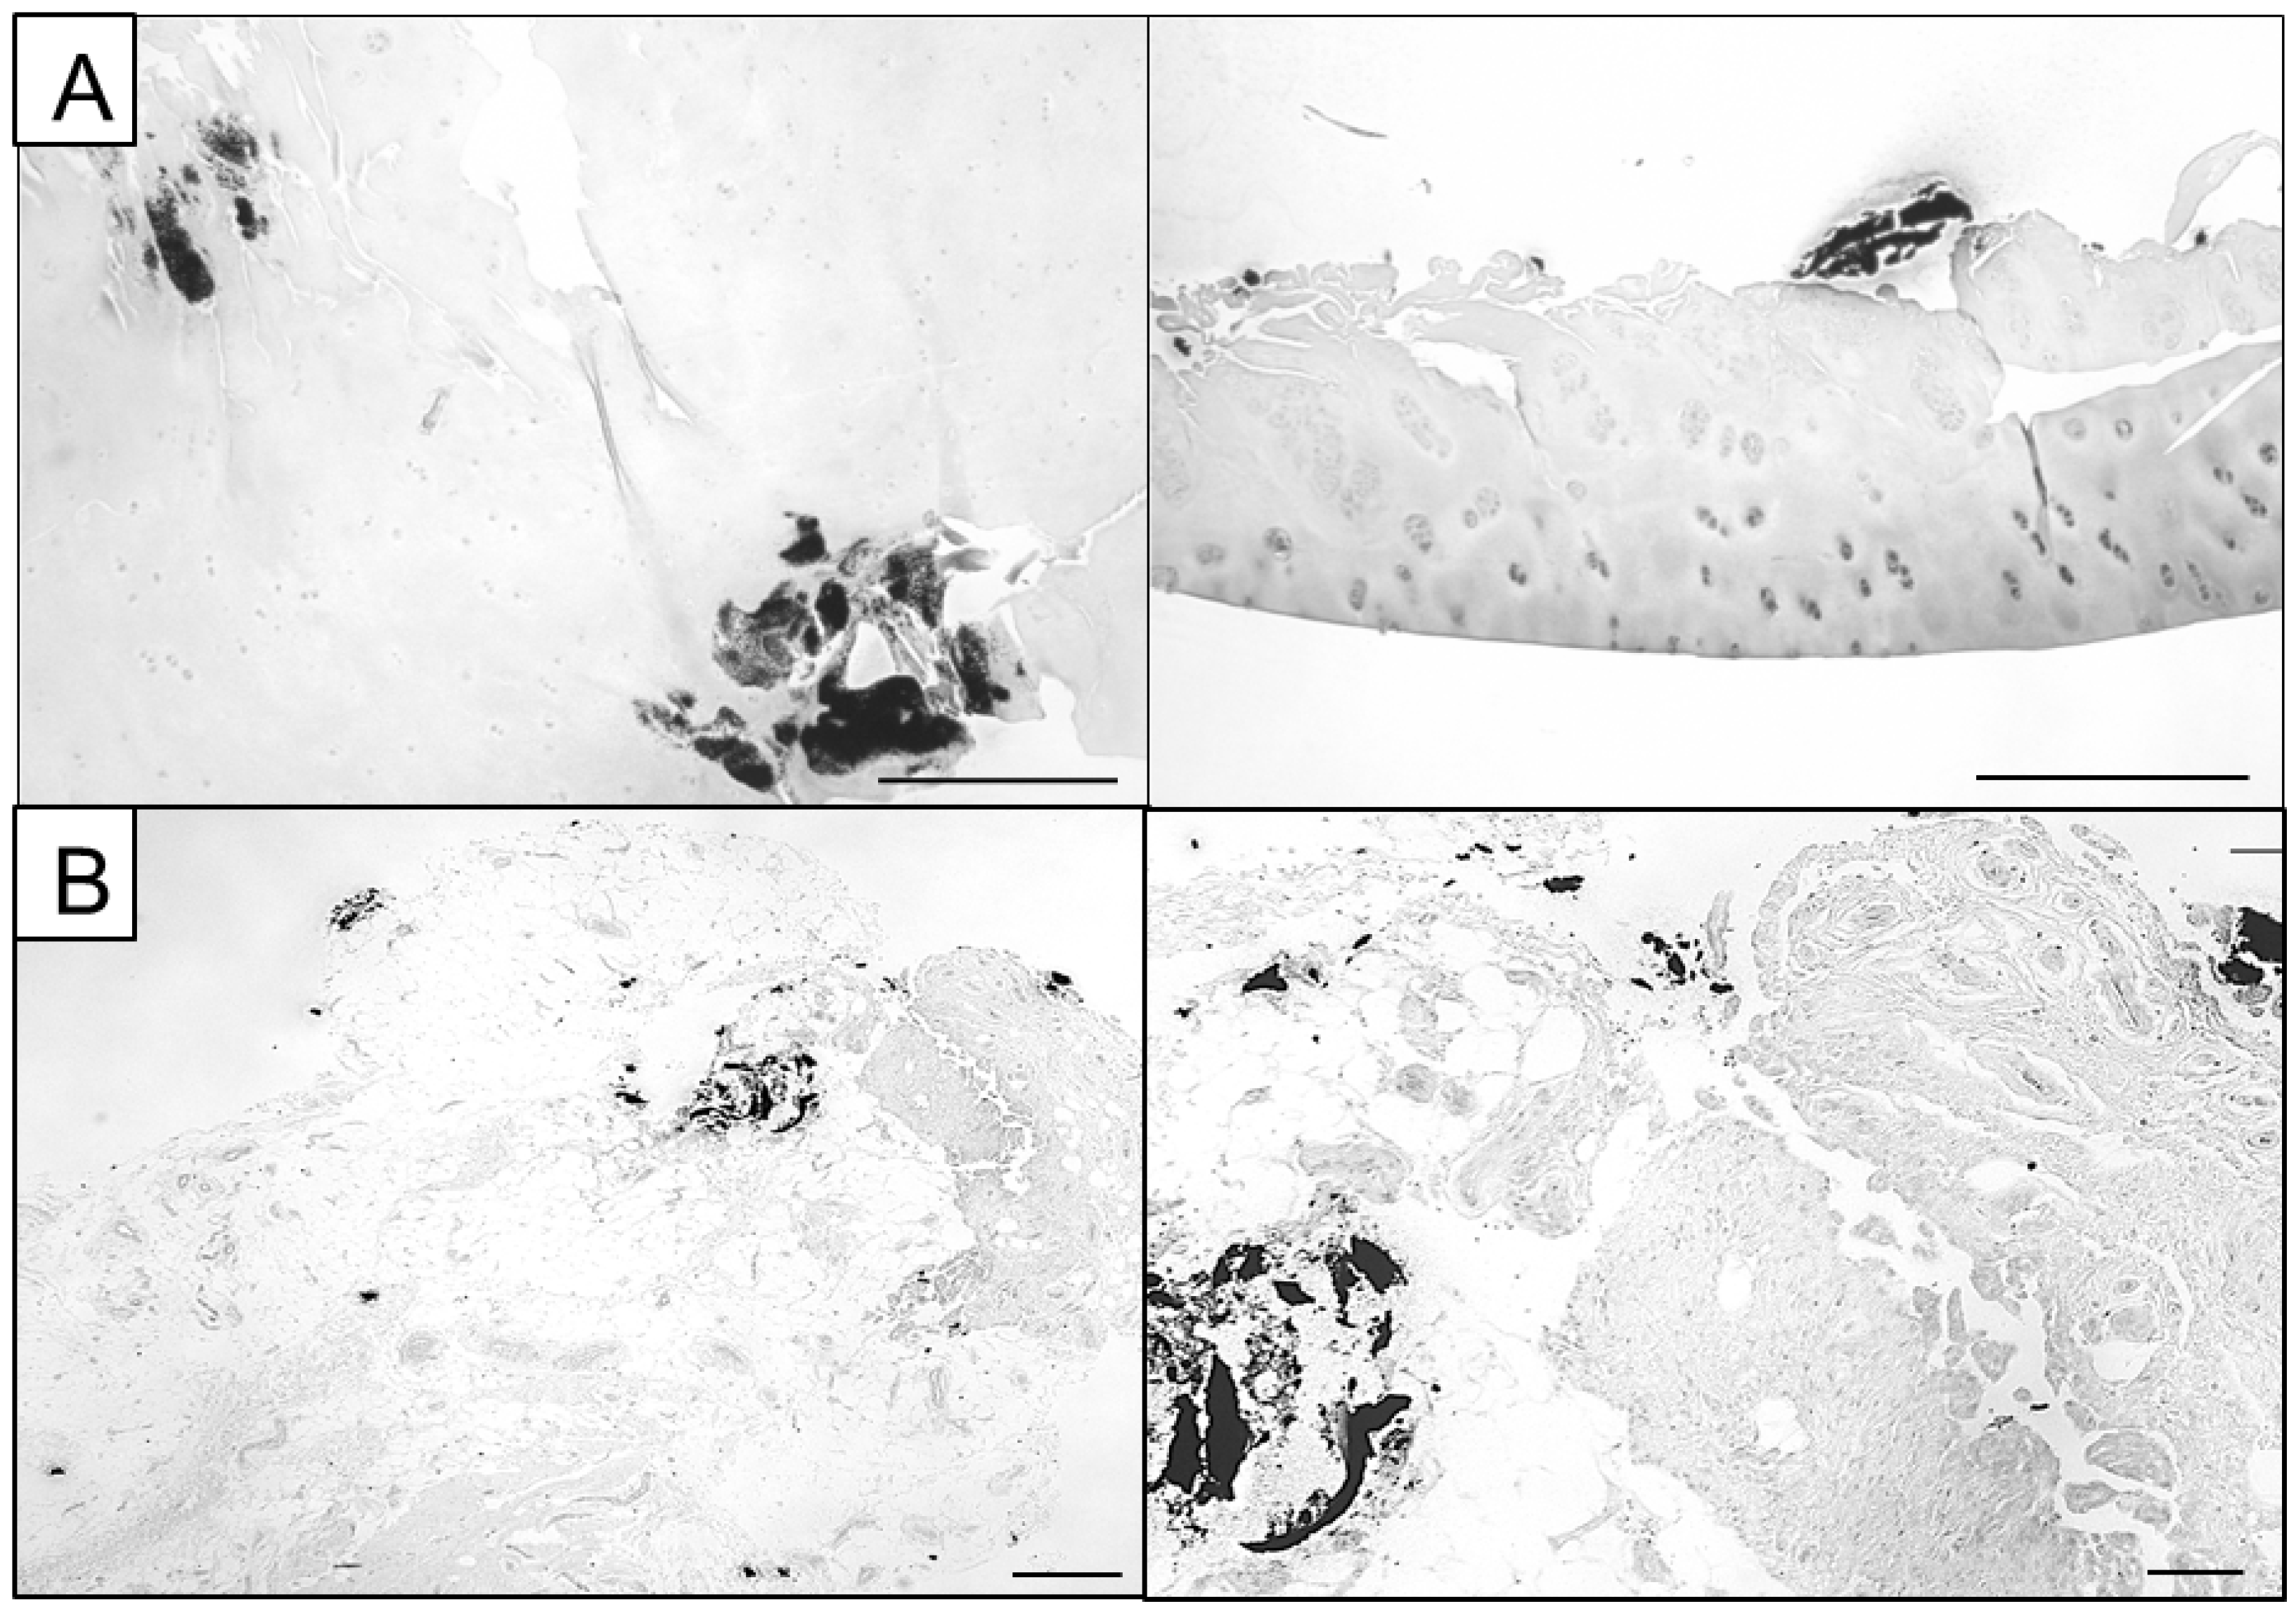
Alizarin Red S stains calcium in a red colour (Figure 1), while Von Kossa marks calcified areas in a black colour, easily visible against the light background (Figure 2). Alizarin red S binds calcium with a high affinity, forming a characteristic red chelation complex. However, the sensitivity of the stain strongly depends on the concentration and pH of the staining solution with overlapping optimal concentration and pH levels for BCP and CPP crystals, impeding accurate differentiation [38].
Von Kossa utilizes a two-step chemical reaction between silver ions and calcium phosphates, leaving a transient yellow colour. Under UV light exposure, organic matter reduces the bound silver ions to metallic silver, resulting in the characteristic black colour. Only the initial yellow colouration after the first reaction directly labels calcium phosphate while the later black colouration is a secondary result caused by organic material [39].
Further, multiple studies demonstrated discrepancies between Von Kossa-stained calcification nodules and spectroscopic detection of calcium phosphates, rendering Von Kossa staining alone insufficient for the identification and quantification of calcifications [25,40]. Therefore, high-resolution imaging techniques should be used to verify/identify the presence and nature of calcified deposits and improve their qualitative analysis. Here, we utilized Alizarin Red S (Figure 1) and Von Kossa images (Figure 2) to select ROIs for further microscopic and spectroscopic analysis.

2.2. Scanning Electron Microscopy

Scanning electron microscopy (SEM) was performed in this study with an FEI XL30 ESEM-FEG (FEI/Philips, Hillsboro, OR, USA) equipped with a secondary electron (SE) and backscattered electron (BSE) detector operating at 10 kV in an environmental pressure mode of ~5 × 10 5 mbar. The chemical composition of the samples was evaluated using energy-dispersive X-ray spectroscopy (EDS, EDAX-AMETEK GmbH, Weiterstadt, Germany) at an accelerating voltage of 10 kV. The BSE detector was used to find regions of interest (ROI). Pictures were taken in SE and BSE mode and EDS scans were executed (see Section 3.1).
The cartilage samples were obtained during the implantation procedure. They underwent routine processing for paraffin block preparation (see Section 2.1). For this study, microscopic sections of 4 µm thickness were sputter-coated with gold for 4 min at approximately 25 mA and examined for the presence of wear debris. The relatively low accelerating voltage of 10 kV was used for EDS as the thin tissue sample contained mostly light elements, and would be likely penetrated by electrons with higher energies [32].

2.3. Raman Spectroscopy

Raman spectroscopy was used to detect BCP and CPP crystals in sections of human cartilage or synovial membrane tissue and to generate a two-dimensional mapping based on the obtained spectra.
Raman spectra were obtained from spot measurements using a confocal Raman microscope (Bruker Senterra II under OPUS 7.8, Bruker, Karlsruhe, Germany). Using a red excitation laser with a wavelength of 785 nm and a 10×, 0.25 objective, the focal spot had an approximate lateral dimension of 1.915 µm according to the Airy formula [41]. First, a single point within the ROI, which was selected using the corresponding Von Kossa staining of serial sections, was measured 5 times with an exposure time of 2 s each in order to generate a good signal-to-noise ratio and exclude possible outliers, e.g., cosmic rays from the final spectrum. Then, the final spectrum was assessed by averaging the results of all prior measurements. This qualitative measurement was performed in order to verify the presence of the calcification and the suitability of the selected parameters.
The mapping then was generated in a 2nd step by the OPUS software (OPUS 7.8, Bruker, Karlsruhe, Germany) based on a rectangular raster scan pattern. For the given raster we defined a maximum distance between each individual point of 10 µm in the x- and y-direction. The quality of the individual spectra is of secondary importance in such mapping since ultimately only the intensity of a certain range is recorded in comparison to the average graph. That is why we changed the measurement time to 0.5 s and the number of measurements to n = 1 in order to keep the total measuring time per raster as low as possible. A grating with a spectral resolution of 1.5 cm−1 and a spectral range from 50 to 1410 cm−1 was chosen since it covers both crystal-specific/characteristic marker bands at 960 cm−1 for BCP and 1050 cm−1 for CPP, respectively. This is not a mandatory setting. Theoretically, a broader grating could also be selected. However, this would also lead to a lower spectral resolution and thus no practical added value. Therefore, it is not recommended by the authors.
The laser power was maintained at ~50 mW. Raman mapping with given parameter settings did not cause structural damage or changes to the tissue, as confirmed by subsequent SEM imaging.
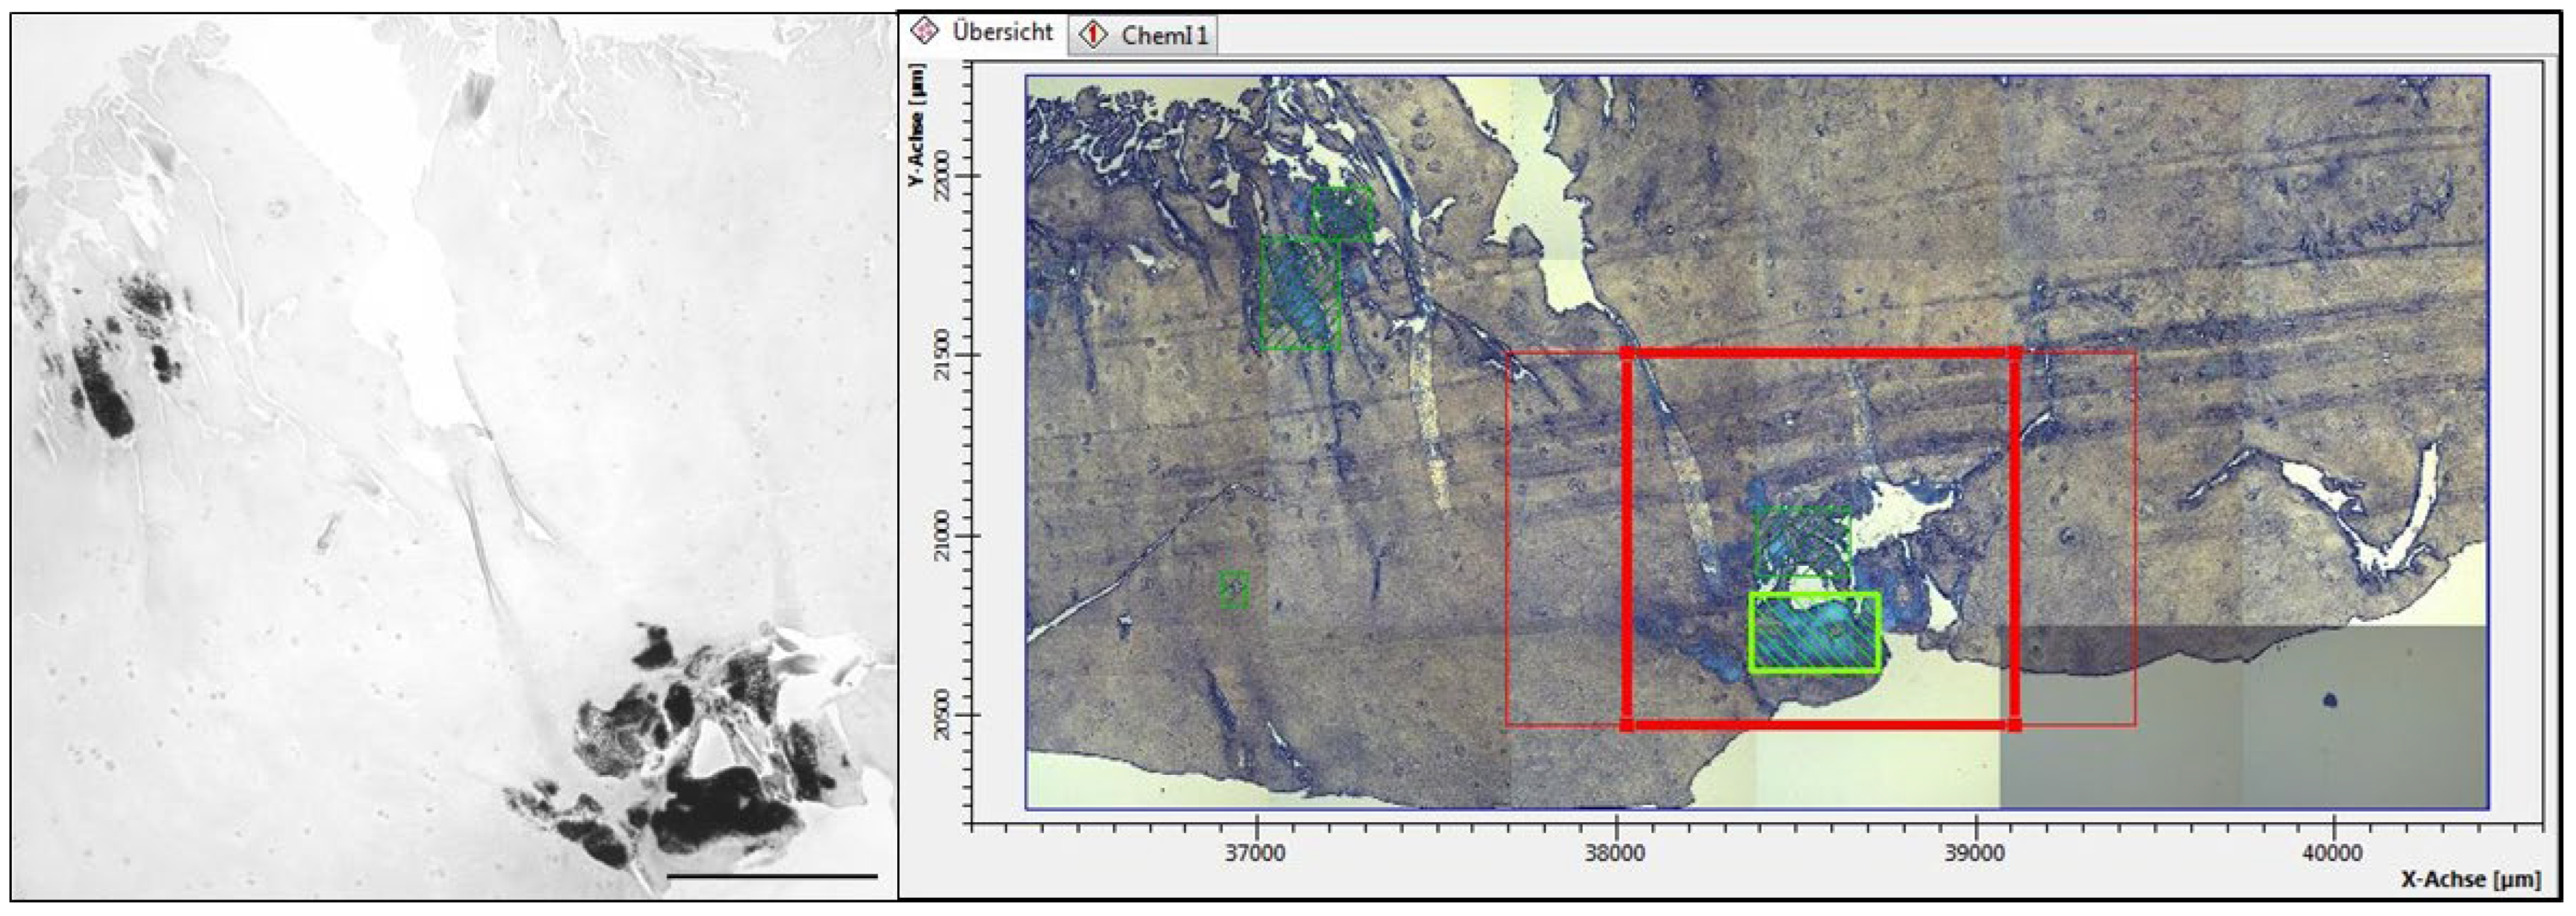
Prior to mapping, an overview image was taken with 100× magnification. Since Raman mapping with given parameters is limited by the measuring time and the processing capabilities of the connected PC, scanning the whole section is not feasible nor recommendable. Therefore, corresponding Von Kossa images of serial sections and the same magnification are used as a template to select ROIs with the expected presence of calcification (Figure 3).
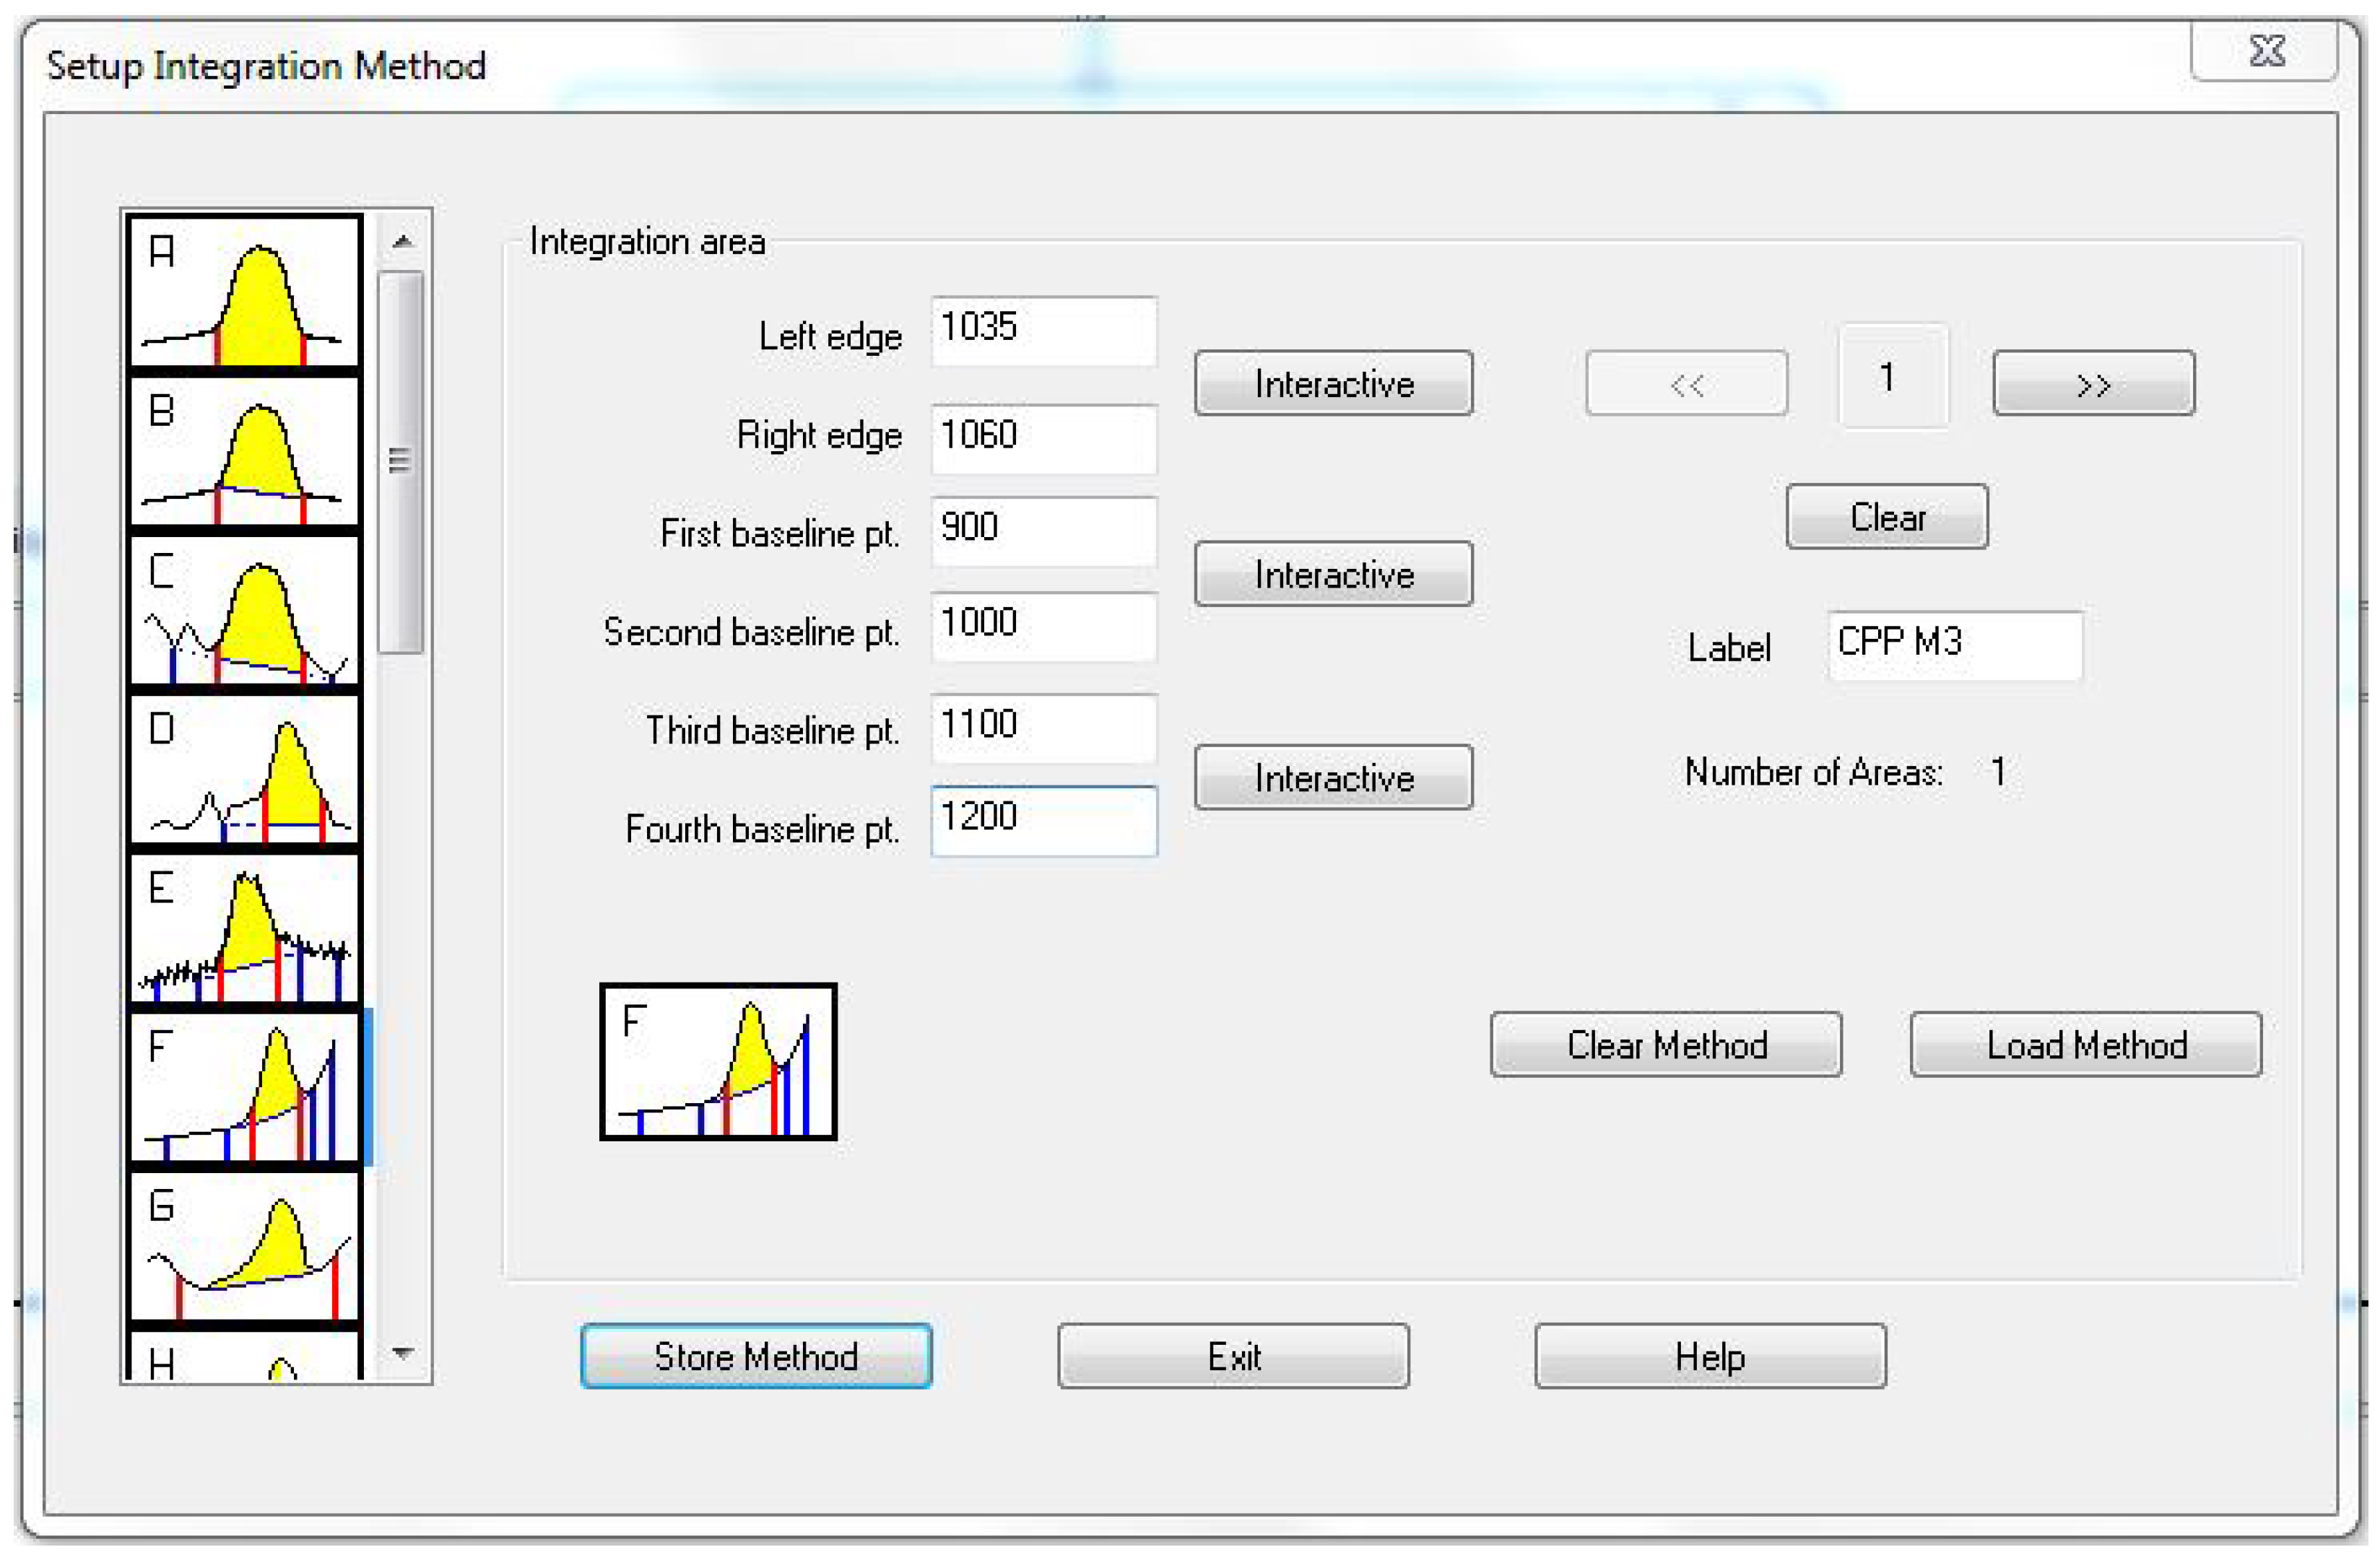
The mapping itself was generated using an algorithm which integrates the spectrum at the characteristic peak location for BCP (960 cm−1) and CPP (1050 cm−1), respectively. To avoid differences in intensity between individual measurements, the baseline for the given integration was derived from defined points with lower and higher wavenumbers of the very same graph using a least square fit (Figure 4).
For the resulting mapping, we used the false colour representation known from the images of a thermal imaging camera. Consequently, locations with high integrated areas, i.e., with an evident peak, are coloured in red to white tones. Locations with a lower area, on the other hand, are coloured in blue tones.
An analogous procedure is also possible with the green Nd:YAG laser with a wavelength of 532 nm. However, after direct comparison of both wavelengths, we decided to use 785 nm as it is less prone to autofluorescence and therefore yields a better signal-to-noise ratio.

3. Results

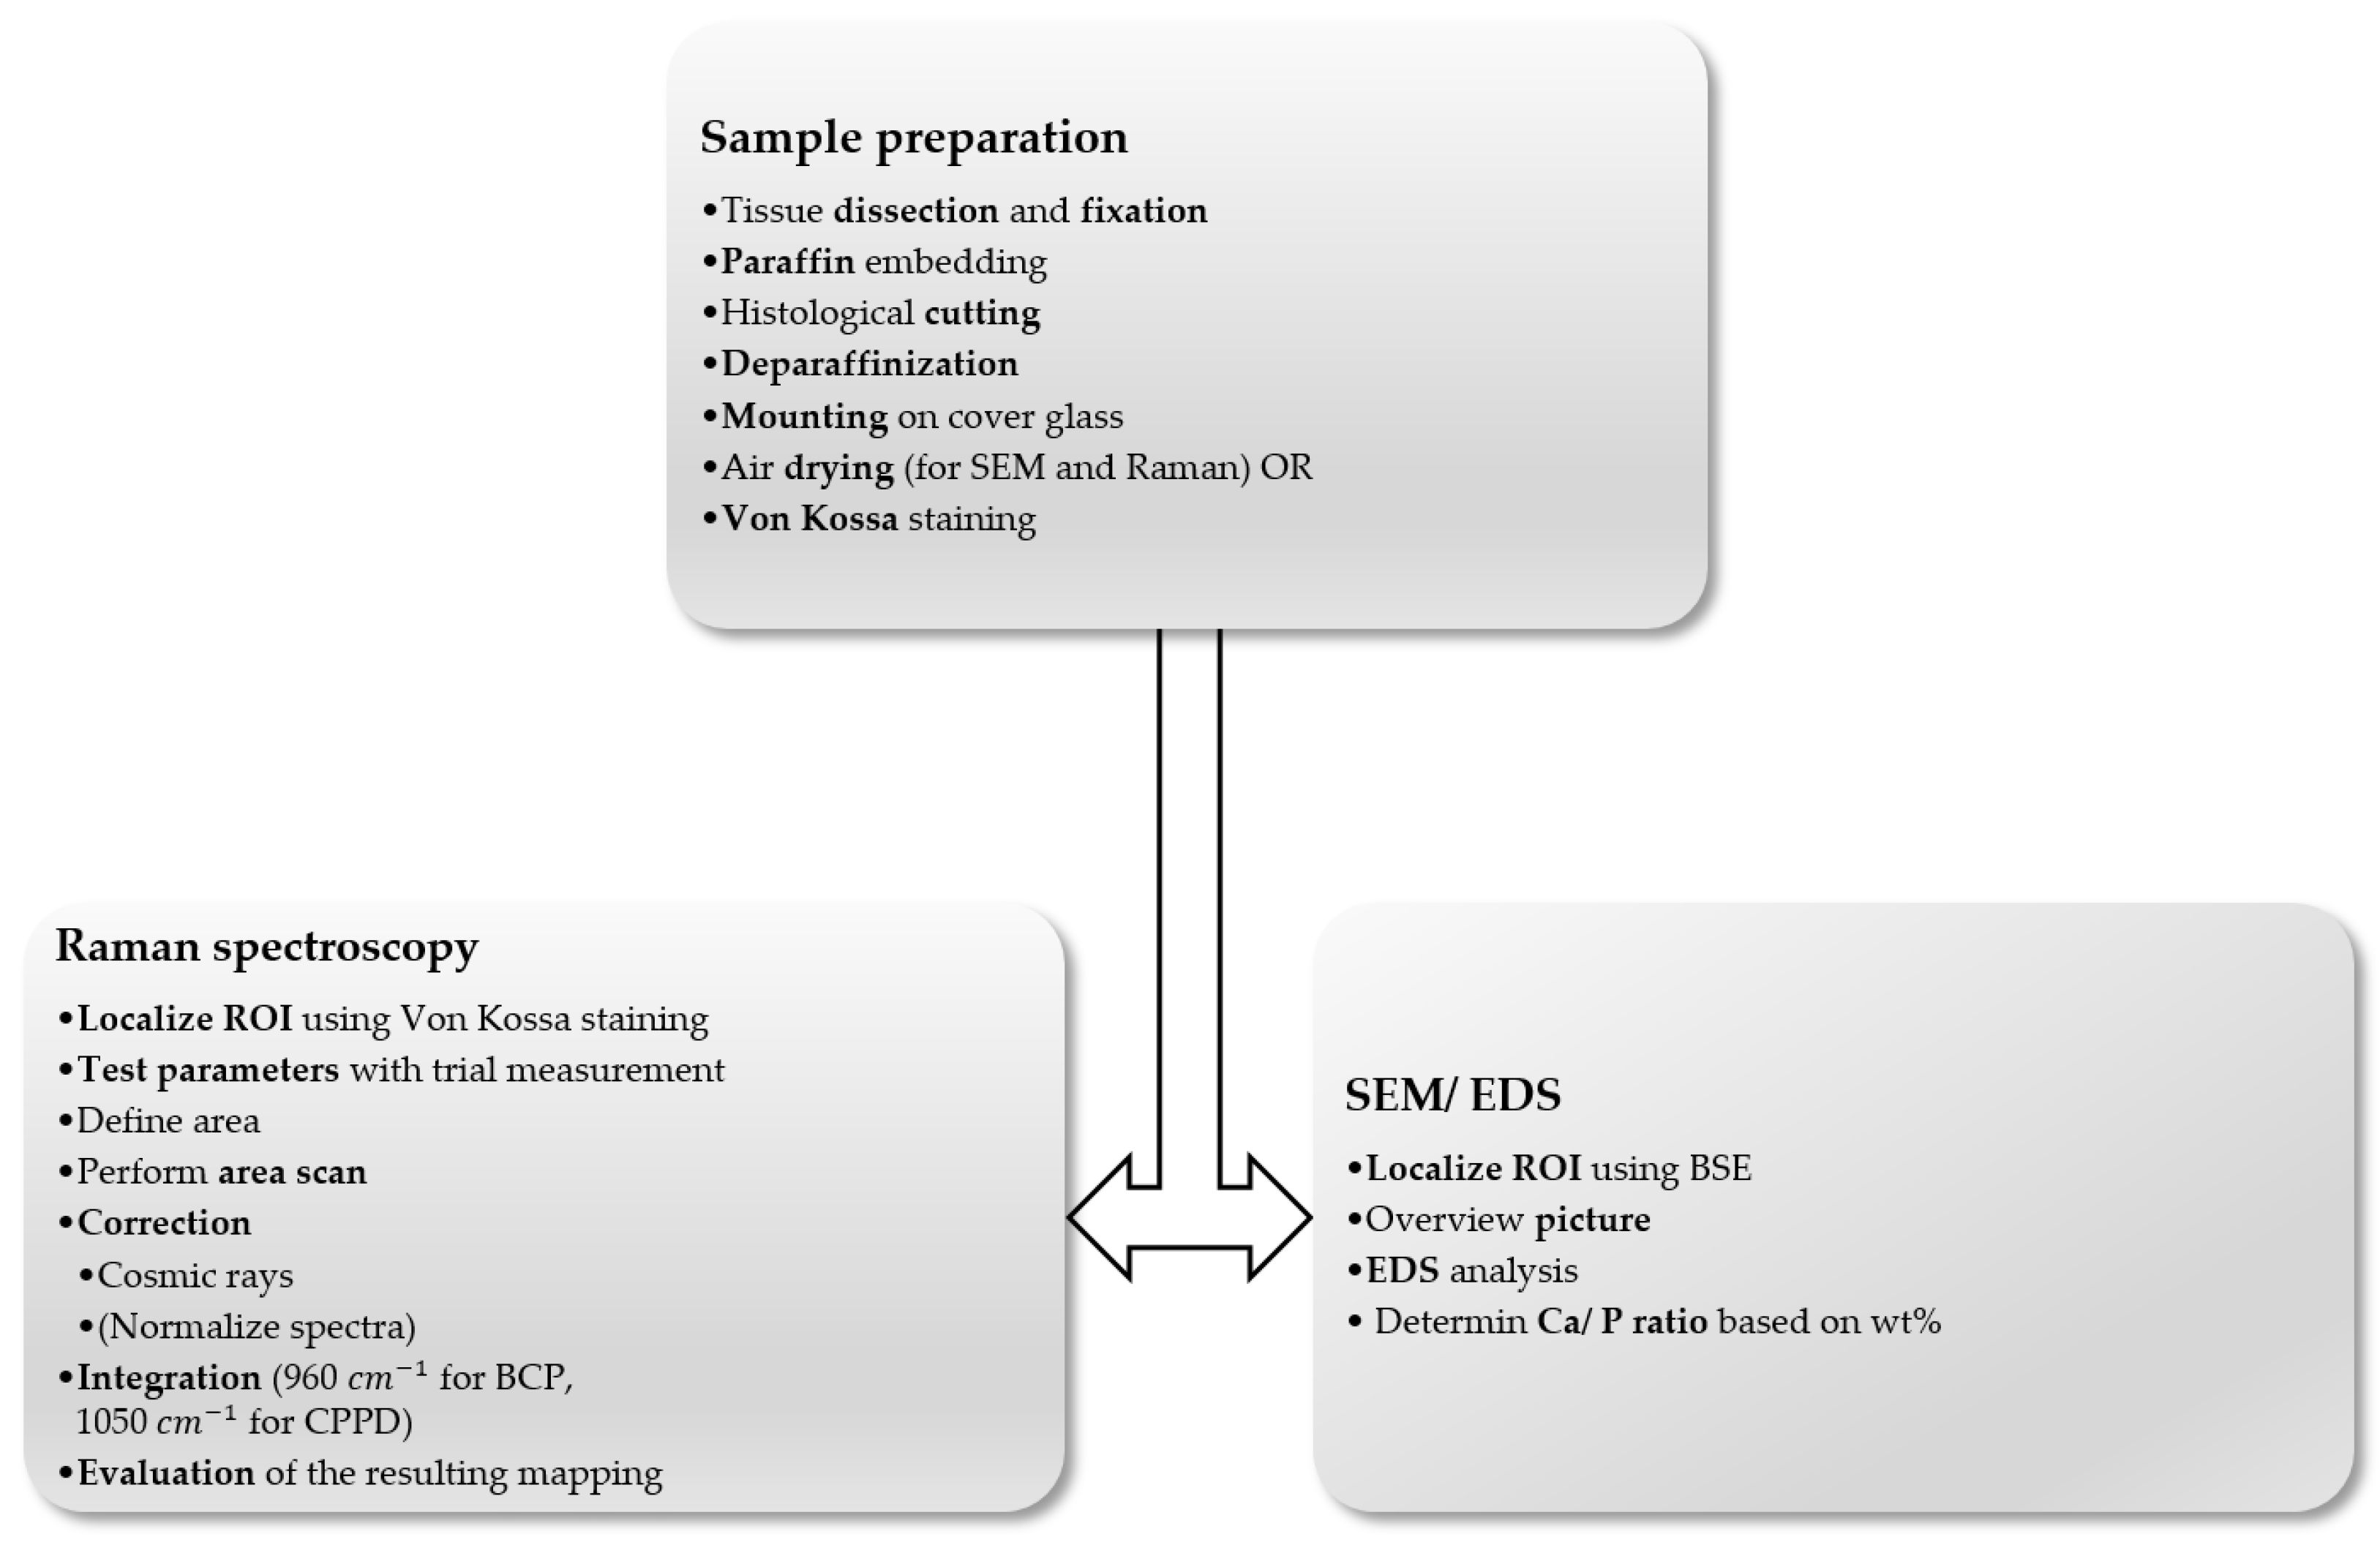
Figure 5 shows the schematic flow of the method presented here. The steps necessary to perform the methods shown are summarized in the corresponding dialog boxes.

3.1. SEM/EDS

Finding the ROI Using BSE

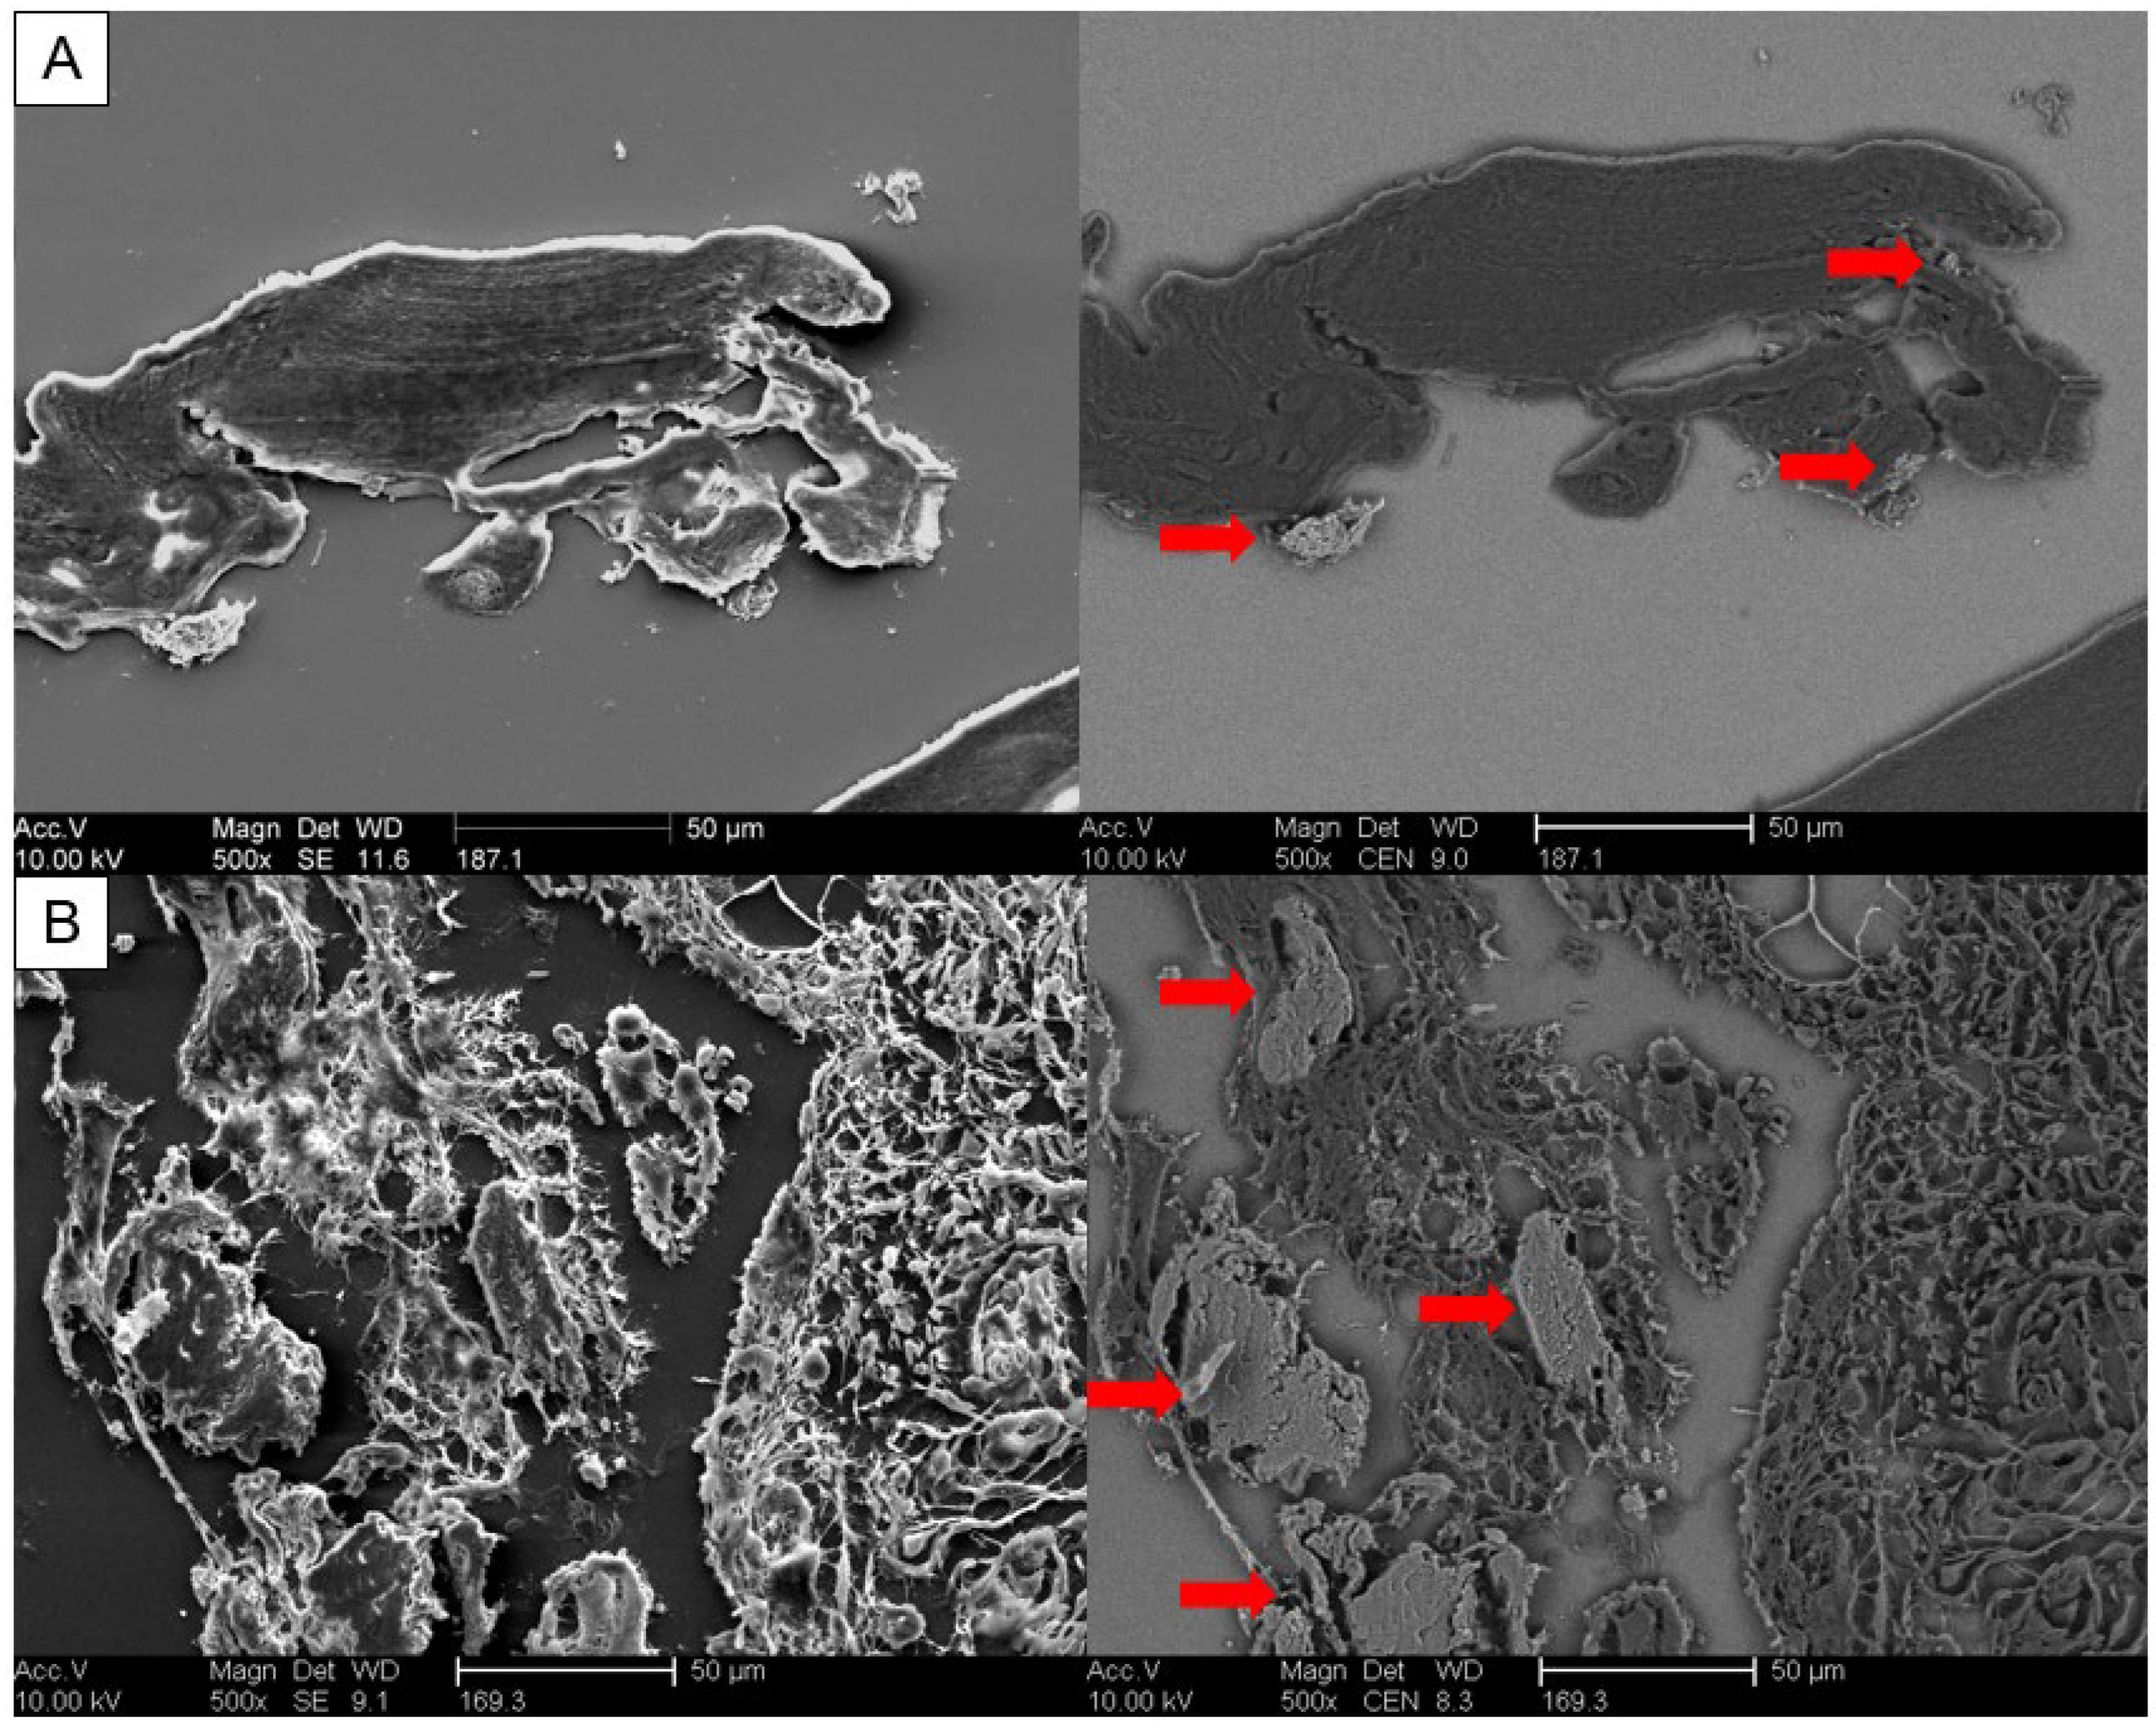
The images generated by the SE detector are displayed in shades of grey. This, in combination with the high minimum magnification of 50×, aggravates the difficulties in orientation on the sample, even with Von Kossa staining as a template on a separate serial section. Therefore, a BSE detector which, in simplified terms, renders areas with higher atomic numbers brighter, can be a great help in finding the calcified regions of interest (ROIs). The BSE detector greatly facilitates the search for calcified areas, as the search is performed visually and within live imaging. Figure 6 shows both imaging methods in direct comparison for a representative cartilage section. The BSE images (right side) clearly show calcification in lighter tones while the SE image (left side) has multiple lighter spots due to electric charge, especially at the rim of the tissue. This method is not only restricted to cartilage but can also be applied to synovial membrane sections (Figure 6B).
When switching between BSE and SE modes, the different optimum working distances of the SEM should be considered for the best image quality.
SEM allows qualitative examination of small ROIs and morphological observation at the same time.
Even though the BSE detector offers a great opportunity in finding the ROI, it is inferior in terms of image quality to the SE detector. Consequently, the latter is better suited for the examination of tissue morphology.
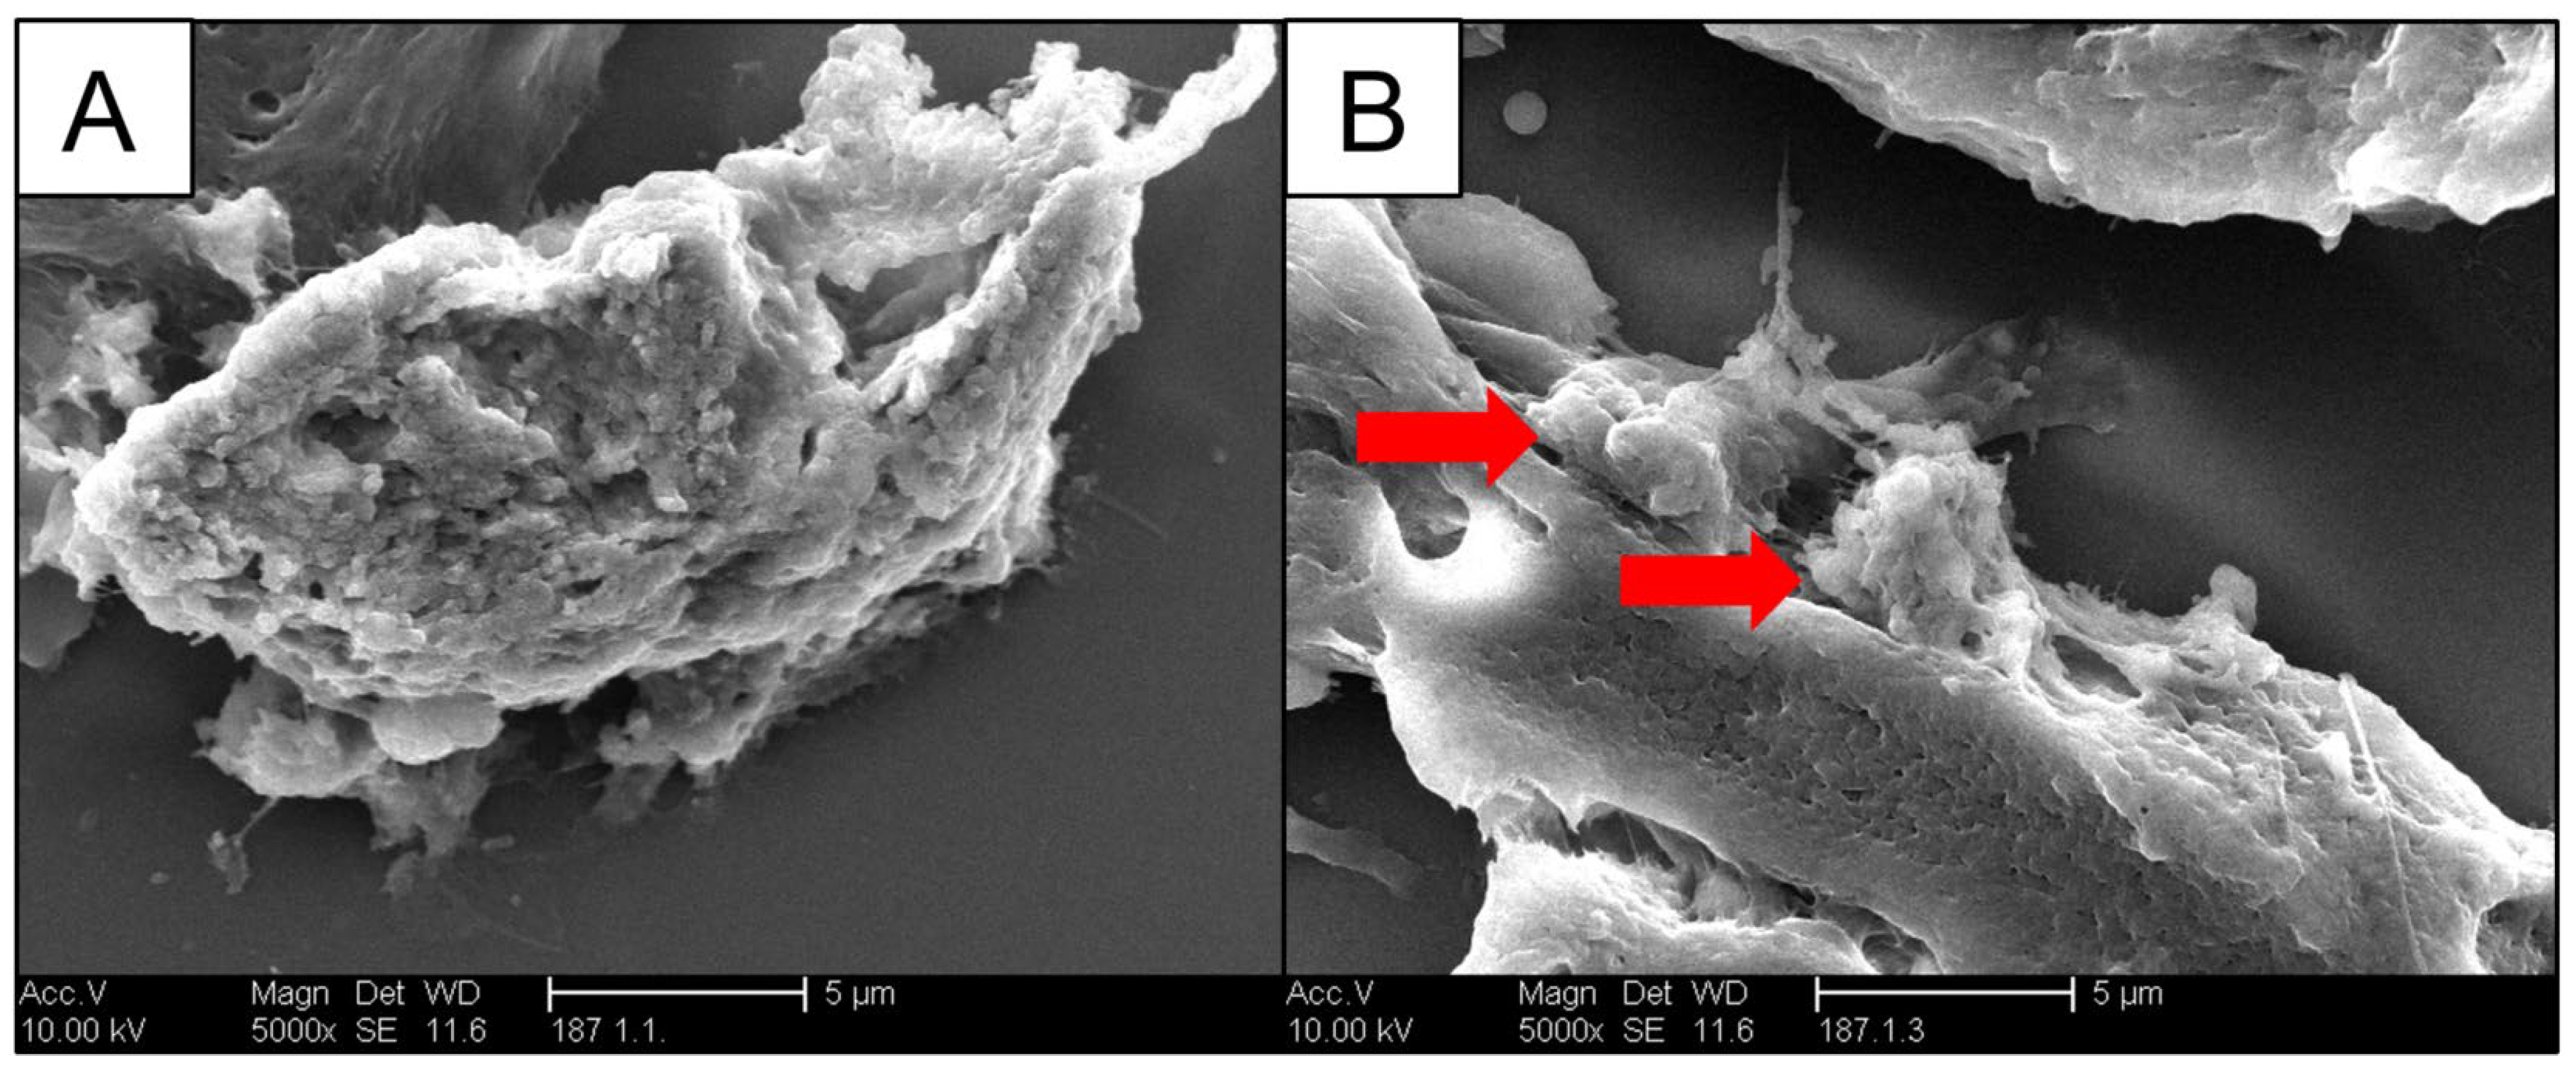
Calcifications of both types (BCP and CPP) exhibit different morphologies in SE and BSE images. BCP can usually be found as local agglomerations with a diameter of up to 30 µm (Figure 7A) or scattered across and within the tissue (Figure 7B). This amorphous grain-like morphology allows for the simple recognition of these crystals.
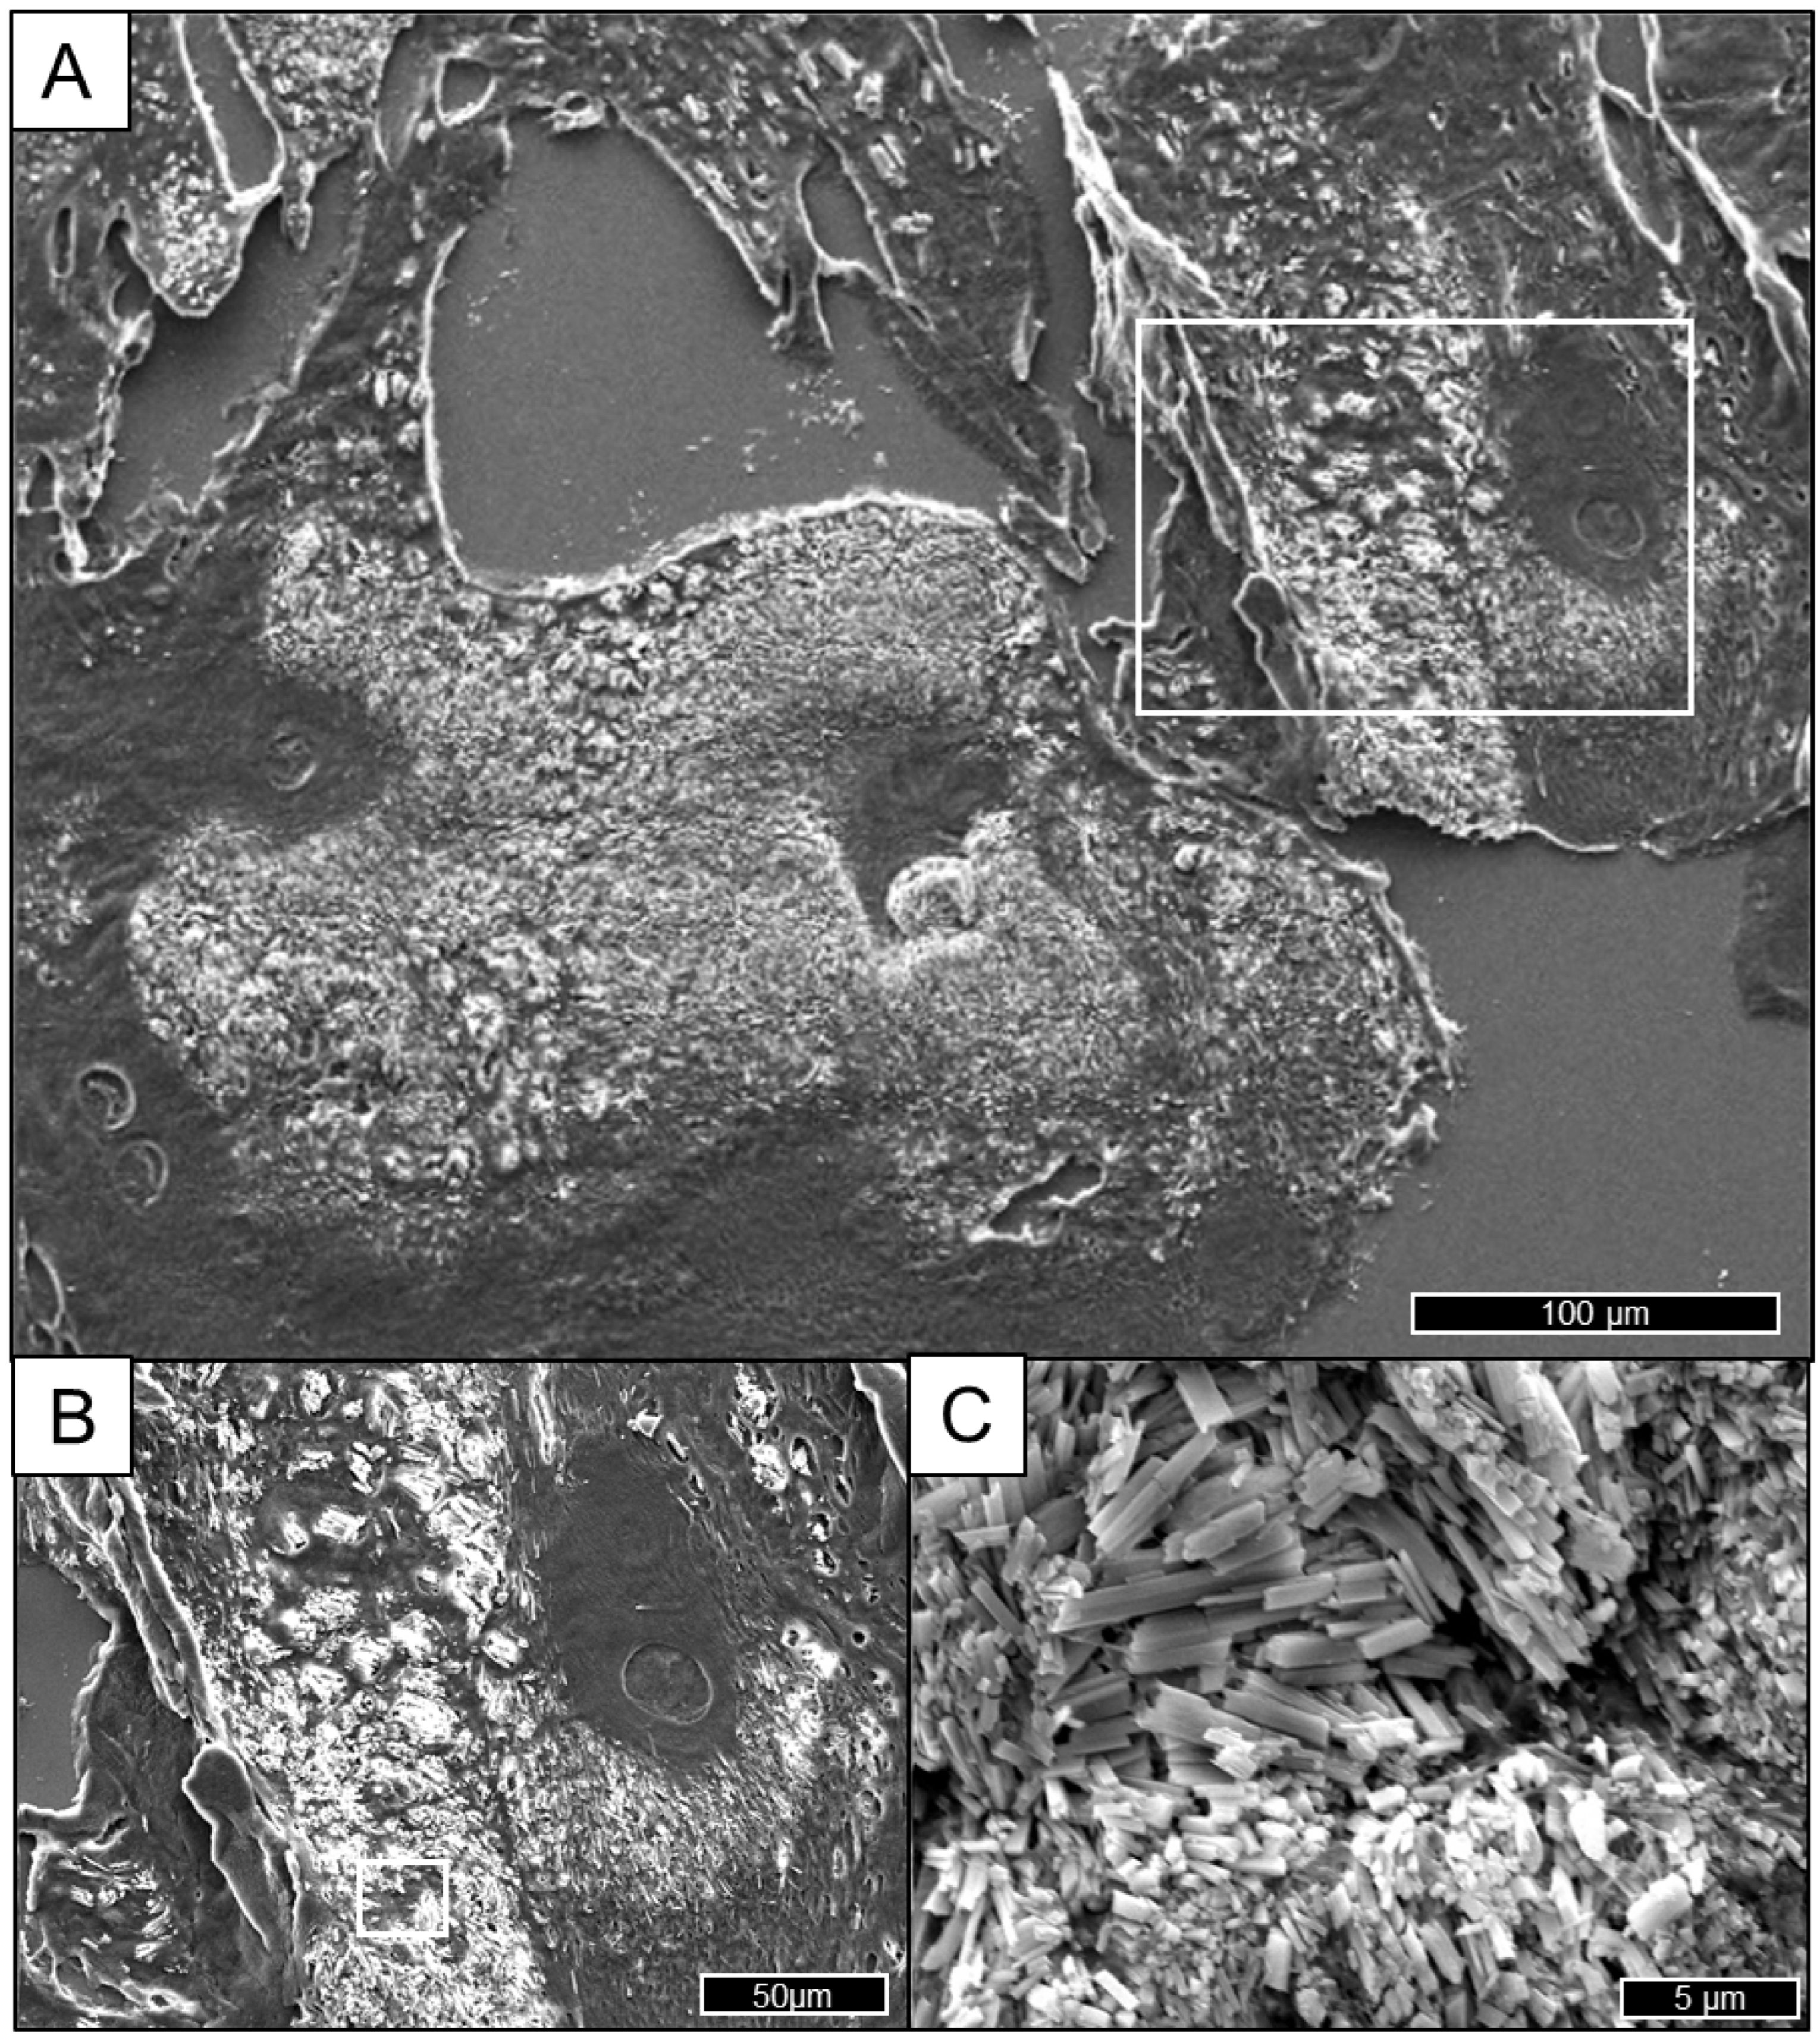
CPP, however, usually represents as needle-like prisms which are often distributed across the whole tissue section, although the amount of CPP depends on the degree of calcification. Figure 8A shows an example of a heavily calcified hyaline cartilage sample. The CPP crystals cover an area of multiple hundreds of µm in both directions, almost covering the tissue completely (Figure 8C). Less calcified areas show how CPP crystals adhere to the tissue by penetrating it or by agglomerating inside larger holes (Figure 8B).
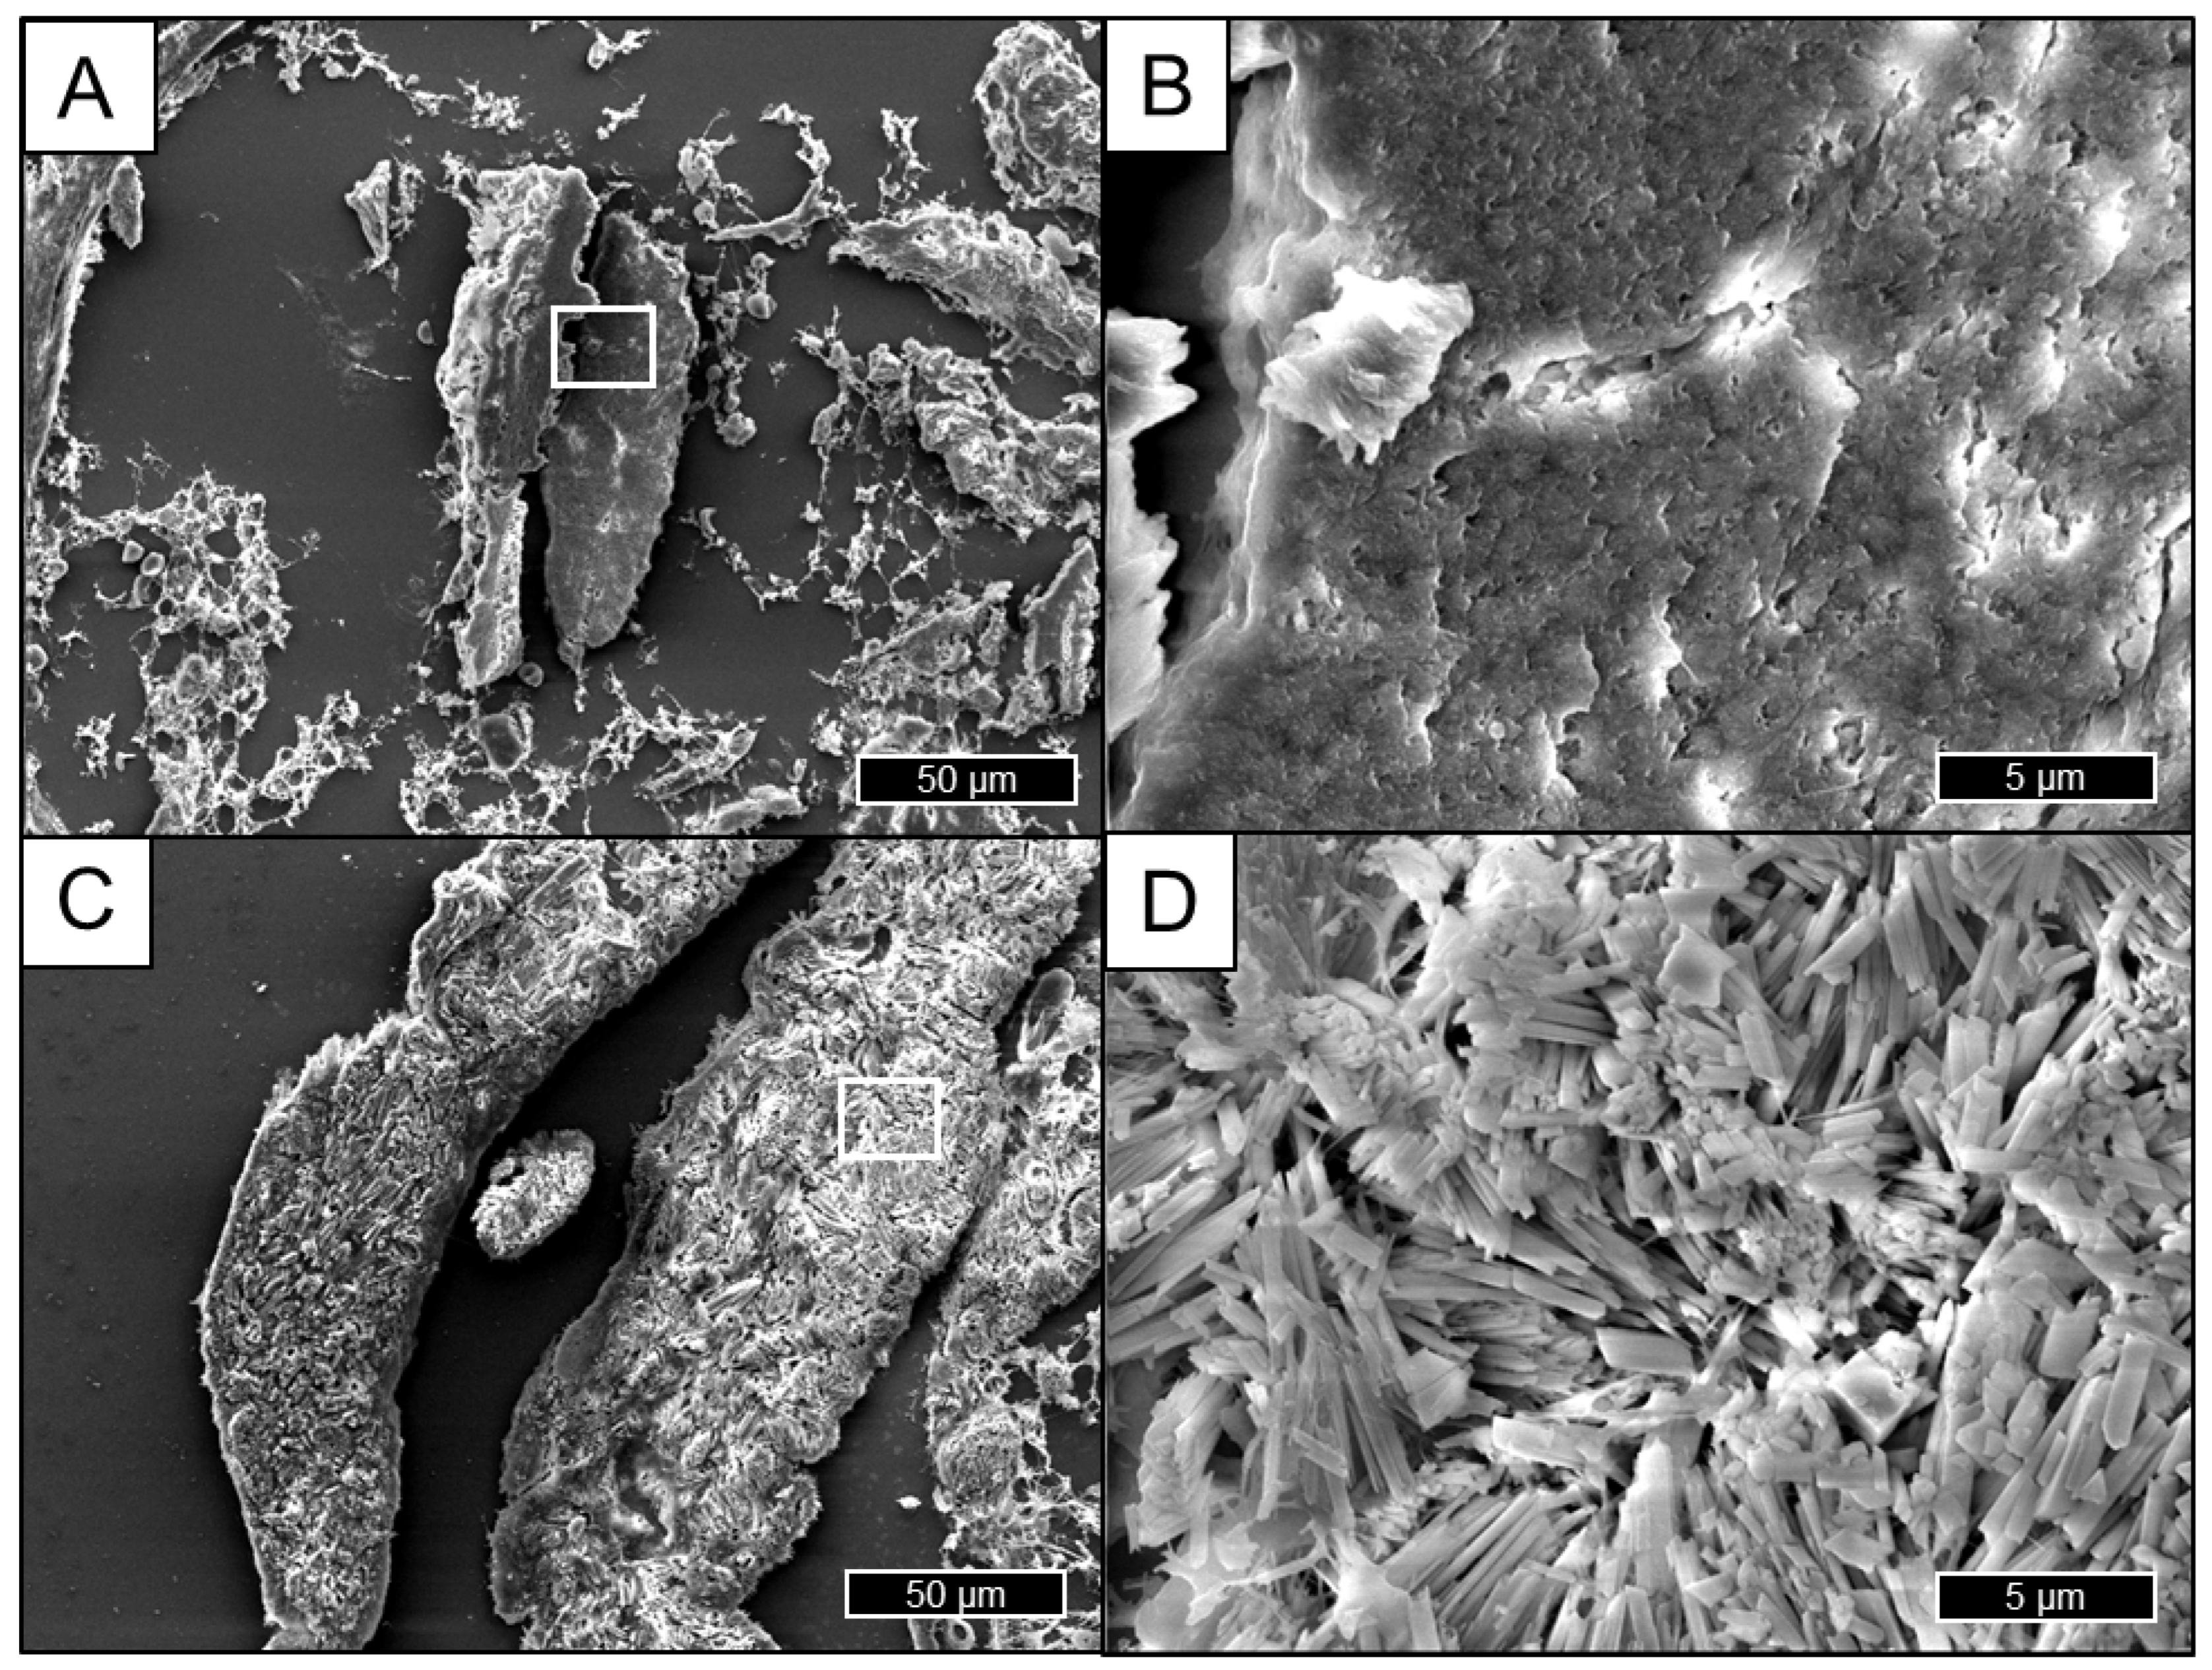
BCP and CPP crystal morphology in synovial membrane samples can be described as similar to the findings in the previously analyzed cartilage samples. BCP crystal depositions can be found as bigger deposits integrated into the surrounding connective tissue, displaying an inhomogeneous surface (Figure 9A). Mineralization due to CPP deposition consists of distinctly needle-shaped crystals, which can either be embedded in their surrounding tissue or represented on the outer rim of the tissue as a long isle of calcification with a length of approximately 100 μm (Figure 9B,C).
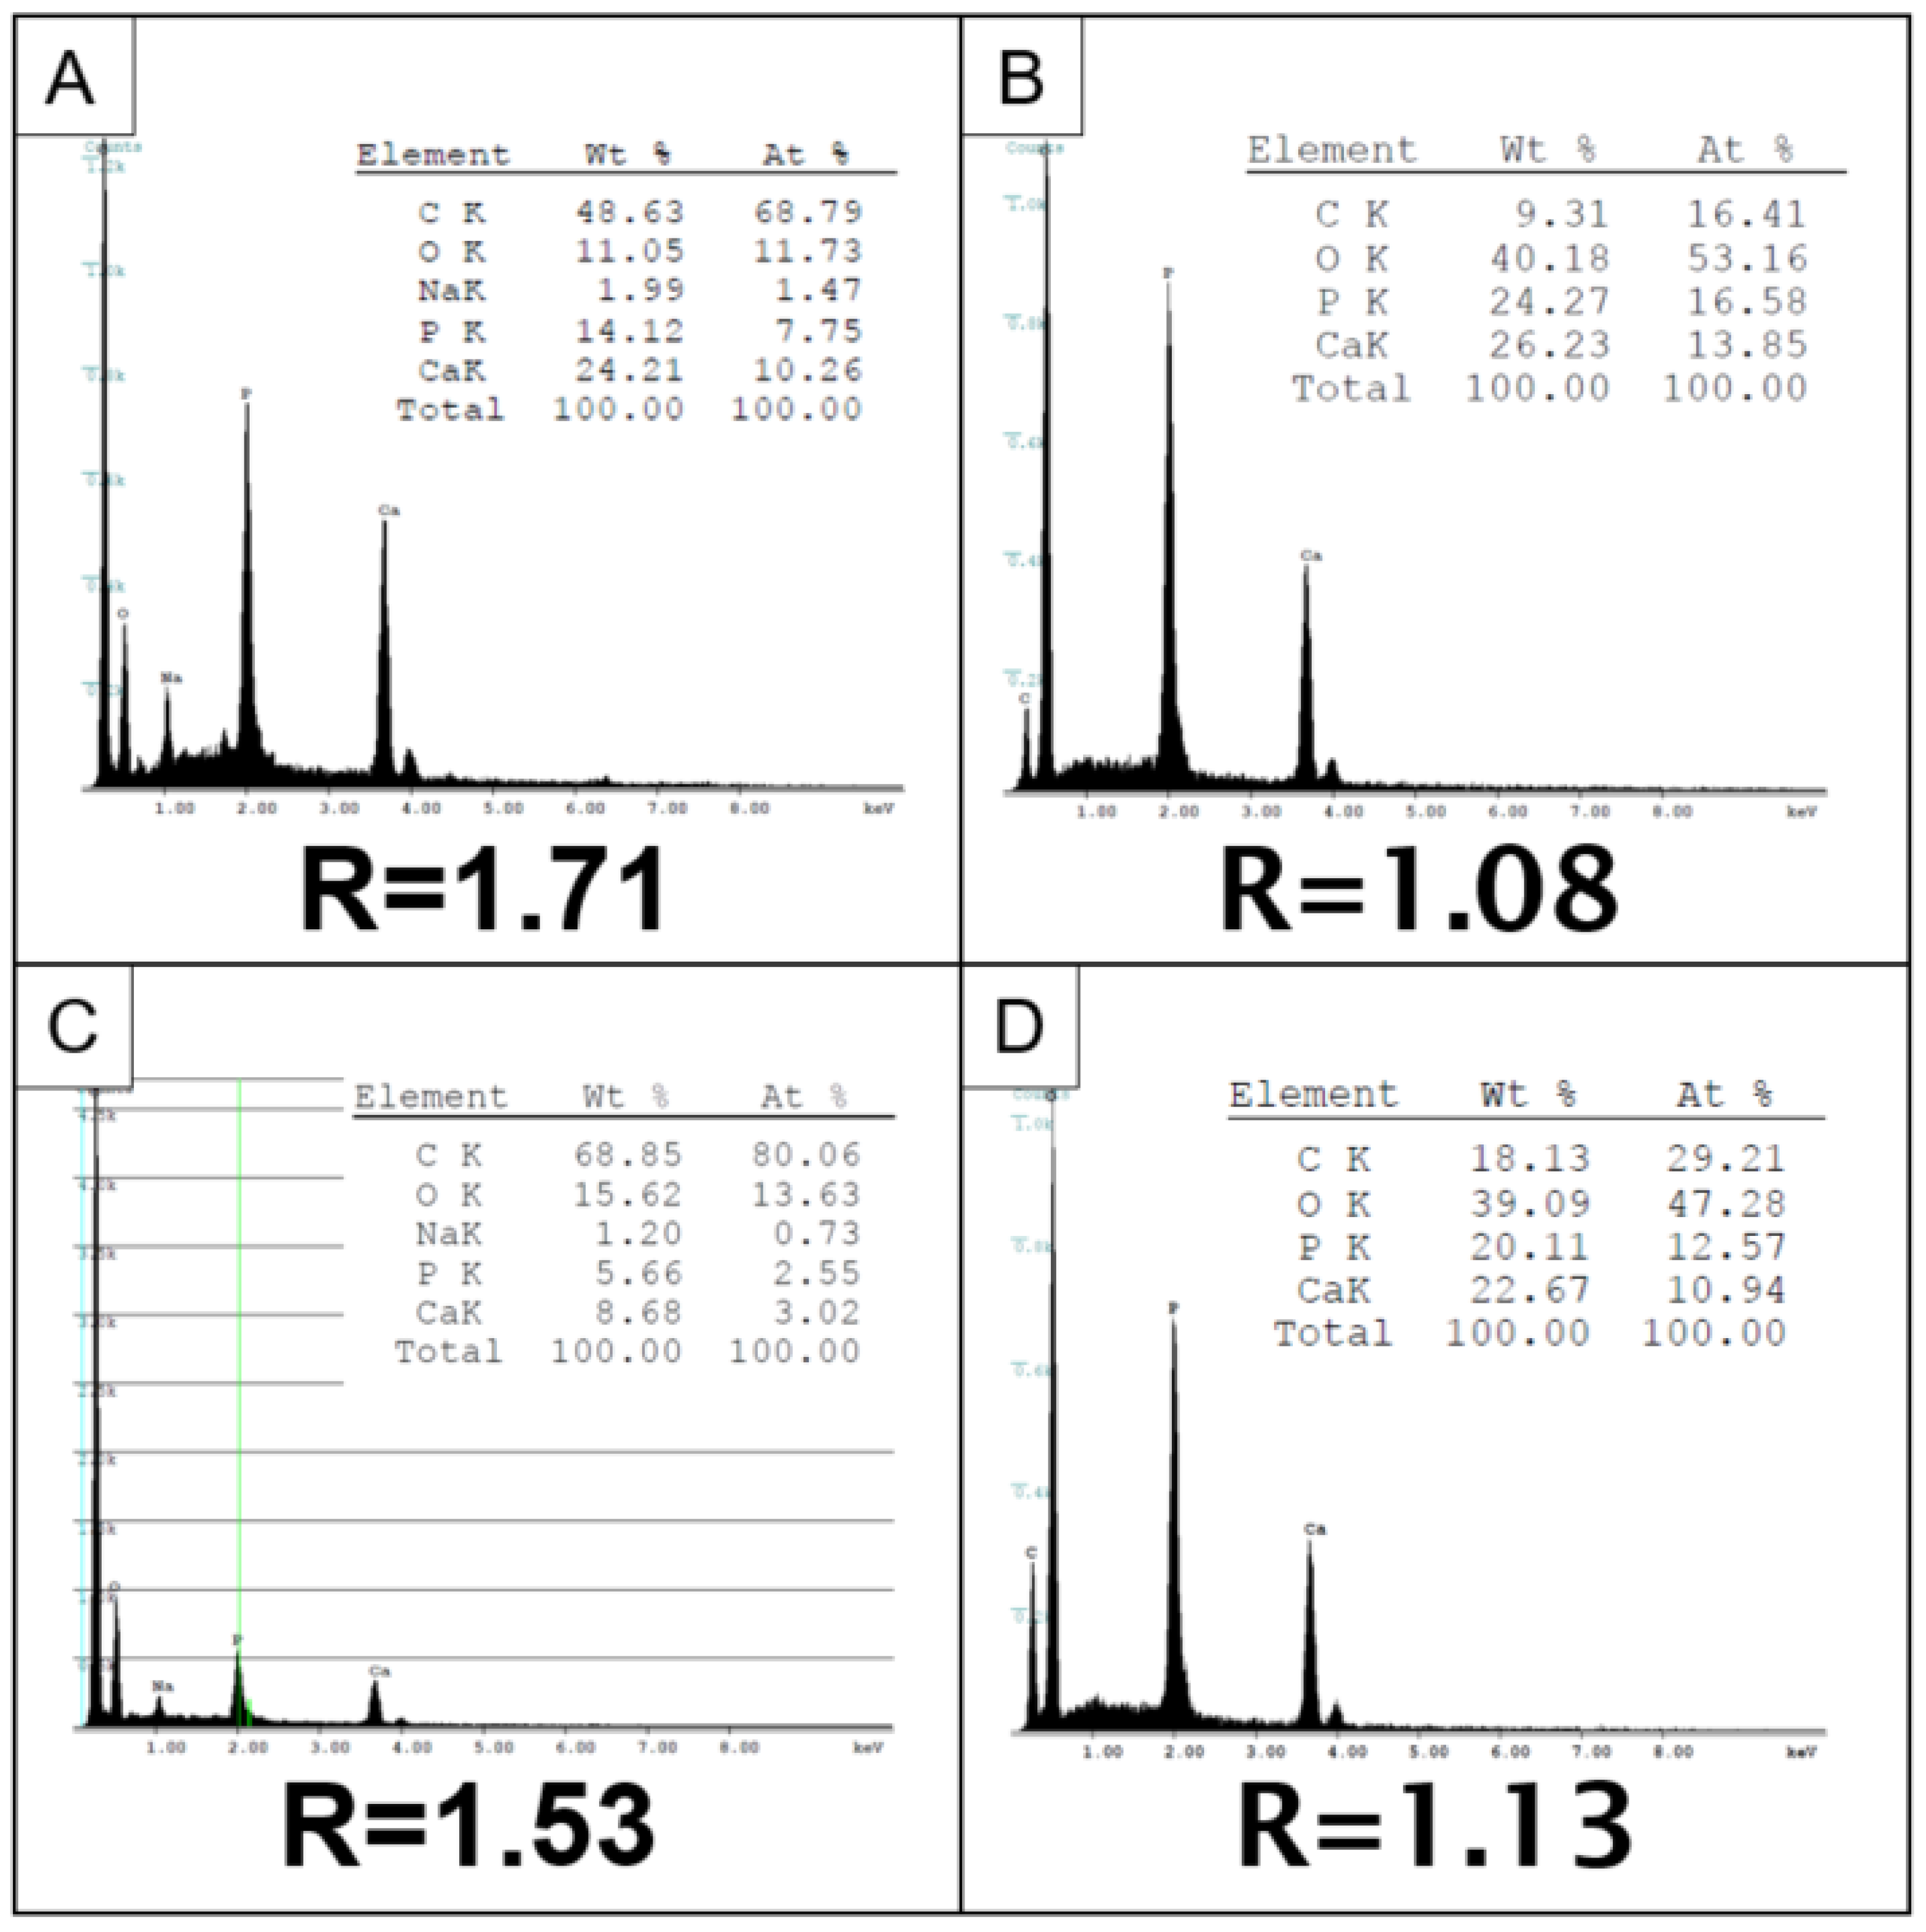
In addition to the differentiation of BCP and CPP based on the distinct crystal morphology, the EDS scan also allows an unambiguous differentiation by putting the mass fractions of calcium and phosphate in proportion to each other. The decisive factor results from R = w t % C a w t % P and equals R C P P = 1.14 ± 0.05 and R B C P = 1.73 ± 0.12 , respectively (average ± standard deviation) (Table 1). By using this ratio, which depends solely on the ratio of the two elements, the crystals can be clearly distinguished.
In some cases, the EDS scan reveals only weak signals for calcium and phosphate. This situation is often a result of, e.g., very thin sections in which cases a large portion of Si will be detected due to the underlying glass carrier of the section. Figure 10 shows representative EDS scans for BCP and CPP crystals in direct comparison for both good and weak signal ratios.

3.2. Raman Spectroscopy

Raman-based mapping enables semi-quantitative examination and localization of calcifications at the same time.
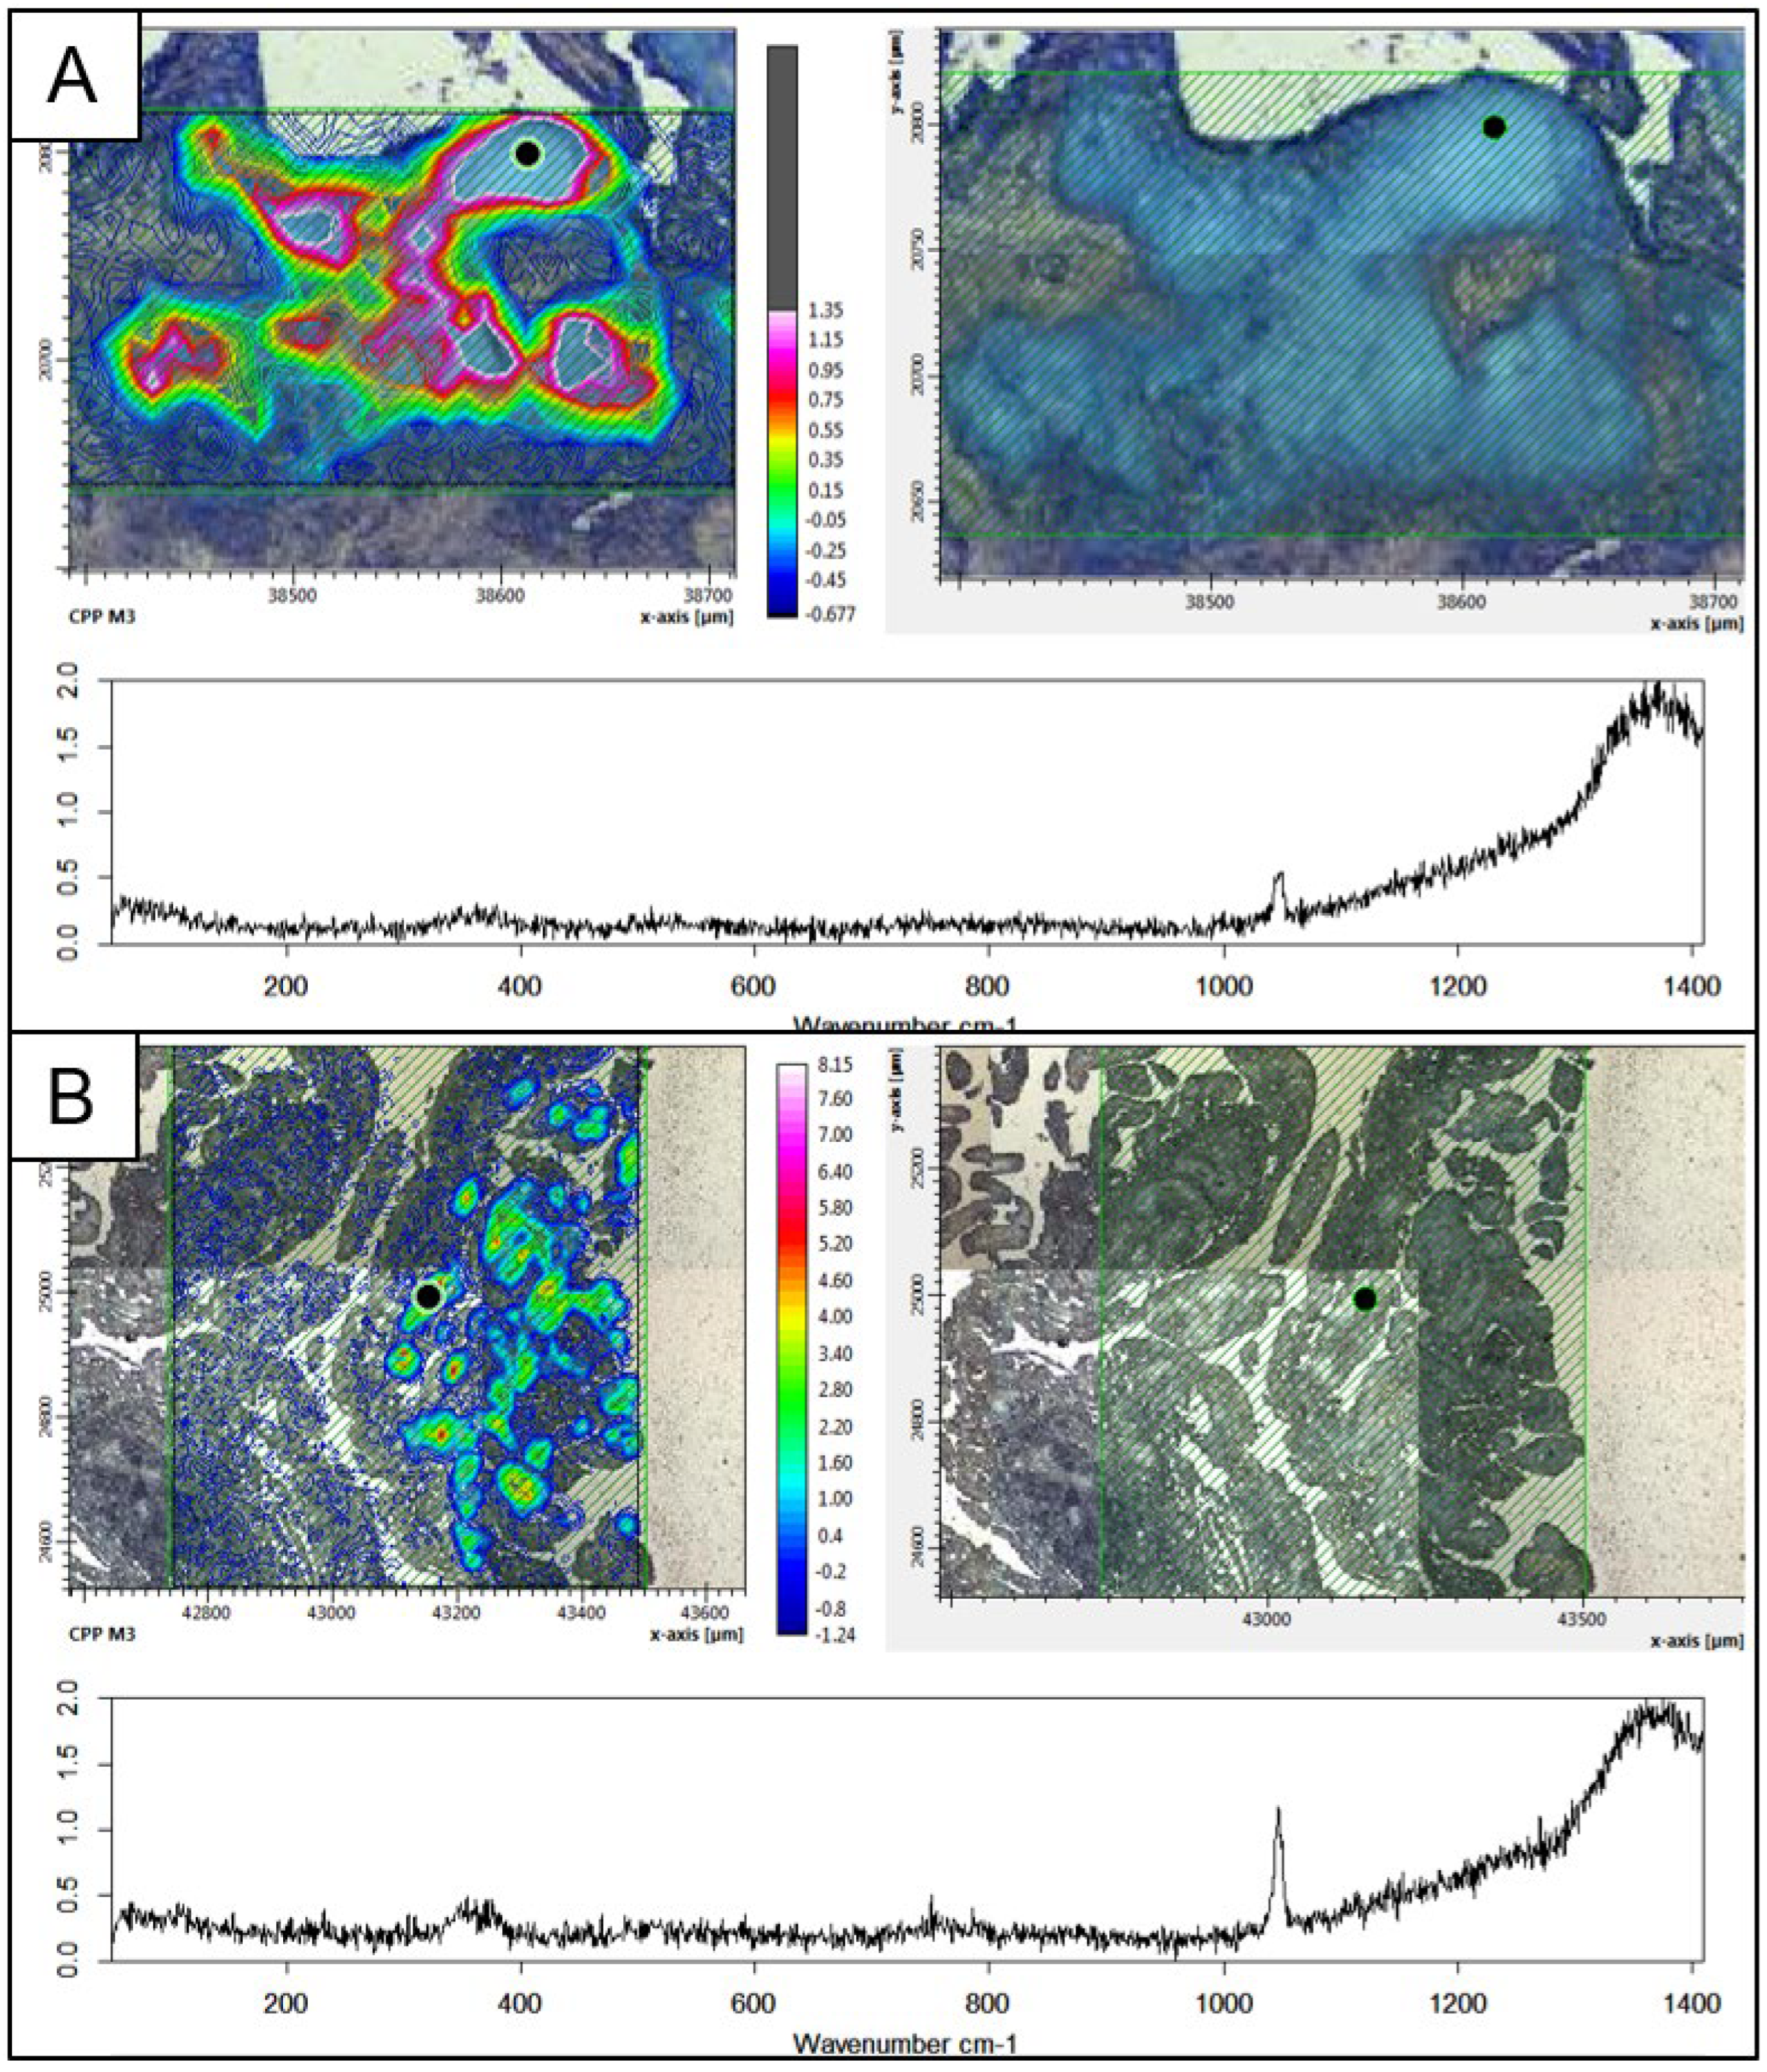
The Raman microscope has a manifold lower resolution than SEM, making it more difficult to differentiate calcified from normal tissue based on the visible morphology. Particularly, smaller crystal aggregates (Figure 7) cannot be detected visually, thus a detailed/high-resolution morphological analysis of the crystals is not possible. Instead, Raman mapping allows for a robust definition of crystal type based on distinct peaks for BCP (Figure 11) and CPP (Figure 12), respectively, as well as localization and measurement of semi-quantitative concertation within the tissue. After normalization and integration at 1050 cm−1, spectra are presented as a heat map, visualizing the localization and distribution of CPP crystals. This colour coding of the integrated area also enables semi-quantitative evaluation of the amount/density of calcification, marking the most densely calcified areas according to the heat map.

Manual Corrections of Raman Spectra

A downside of measurements with N equals one, as they are performed within the prior explained mapping, is the missing ability to automatically detect outliers due to missing reference spectra. In some rare cases, the detector falsely measures and interprets cosmic rays as part of the Raman spectrum. These errors are very rare and the program usually recognizes them by taking multiple spectra, comparing them for high peaks and replacing that part of the spectrum, if necessary. Therefore, we had to exclude such outliers manually by replacing them with a spectrum that represents the arithmetic average of the surrounding spectra. This manual step, however, is easy to perform, since cosmic rays are characterized by very high intensities, which can be easily spotted on the mapping. An example of cosmic ray interference is given in Figure 13. Here, two points represent cosmic rays that can be recognized easily due to the dark red colour. Cosmic rays are stochastically distributed over the entire bandwidth of detected information and are, in most cases, irrelevant for mappings, since they are not within the range of interest. In the given figure, however, they appear at around 960 cm−1 and, therefore, distort the integration algorithm for crystal identification, which is why they need to be removed.
Another option to prevent the distortion of the spectra or mappings by cosmic rays would be to increase the number of measurements per point to at least n = 2. This multiplies the measuring time by the factor N but also smooths out possibly occurring cosmic ray distortion as the mapping is generated based on the average of all spectra measured on one spot. At the expense of a significantly longer measurement time, it is thus possible to eliminate the distorting influence of cosmic rays without having to accept potential errors on the software or user side. Consequently, this method is recommended for very inexperienced users.
Another common issue in analyzing these data is the diverging intensity of individual spectra. This can be caused, for example, by specimens that are not completely flat, resulting in varying distances of the tissue sample to the detector, i.e., a higher measured intensity. The naturally very heterogeneous composition of the biological samples examined is another reason for varying signal intensities. This problem can be identified by the displacement of the graphs in the y-direction and may lead to distortion of the mapping. However, this problem can also be solved using specific software. The software Opus for instance has a “normalize” function, which puts all graphs into the same y-range without changing the course of the curves, solving the described problem. For the presented method, the Min–Max-normalization works very reliably. In general, normalization functions tend to reduce higher bands more than lower bands. However, this is not relevant for the use case presented here, since the relevant bands are in a very similar range. Nevertheless, this could lead to unintended changes in other contexts. Accordingly, the use of the normalization function should be re-evaluated for each case.
Baseline correction was not used in the present method for several reasons. First, the quality of individual spectra in a mapping experiment is not critical, as the focus is on generating spatially resolved chemical information rather than on the spectral quality of each pixel. Second, the method was designed to be beginner-friendly and as objective as possible, and the addition of a subjective step such as baseline correction could potentially introduce variability and bias into the analysis. Finally, the biological samples used in this study were highly heterogeneous, making it difficult to apply a uniform baseline correction across all spectra. While baseline correction can be a useful tool for improving the quality of Raman spectra, the potential risks of introducing bias or distortion into the data outweighed the potential benefits of the present method. Instead, other preprocessing steps such as normalization or smoothing were used to improve the signal-to-noise ratio of the spectra.

4. Discussion

The aim of this manuscript is to provide a step-by-step protocol for the in vitro detection and differentiation of calcium crystals in human cartilage and synovial membrane tissue sections using Raman spectroscopy and SEM/EDS. The protocol combines and compares high-resolution techniques with basic histological staining methods for simple and efficient guided calcium crystal identification in different joint tissues. We employed SEM/EDS analysis and Raman spectroscopy complemented by histological Von Kossa and Alizarin Red S staining to localize and identify calcium crystals in the cartilage and synovial membrane of OA and CC patients.
Multiple studies have combined SEM/EDS and Raman spectroscopy to investigate mineralized cartilage, synovial membrane and cortical bone samples using differential sample preparation methods [42,43]. We use deparaffinized, air-dried tissue sections as starting material for each imaging technique, simplifying the procedure of sample preparation. In fact, due to the non-invasive/destructive nature of Raman mapping, the same sample section can be re-used for SEM/EDS analysis, enabling more efficient and precise complimentary crystal analysis.
The results that can be obtained with the described methods are highly reliable and sensitive. However, with regard to clinical application, these techniques cannot be applied in vivo but might be an additional diagnostic method for biopsy samples in unclear clinical cases.
Radiographic evaluation is the standard diagnostic method for OA and CC patients, which provides a general possibility of calcium crystal identification in cases of marked calcification, but also offers low precision and no separation between BCP and CPP [12]. Furthermore, slight rotations of radiographs or severe joint degeneration may obscure the cartilage layer, impairing diagnostic precision. Therefore, the absence of radiographic chondrocalcinosis does not exclude CPP deposition disease [44]. Due to low costs and general accessibility, however, conventional radiography remains the gold standard for imaging OA and CC patients in clinical practice [45]. Polarized light microscopy-based analysis of synovial fluid, is not routinely applied and poses a risk for potential for error in cases in which no crystals are detected [46,47], as well as an infection risk for the patient during sampling [48]. Cartilage tissue collection during arthroscopy or surgery cannot be performed routinely for diagnostic procedures, but it adds valuable qualitative and quantitative information regarding tissue calcification. It allows for separation between BCP and CPP crystal deposition and therefore might give advice for future treatment strategies addressing the formation of either BCP or CPP crystal formation [49].
DECT represents another promising method for detecting and identifying calcification in human cartilage. The biggest and decisive advantage is the in vivo applicability. However, the sensitivity is still an open issue and the availability of this relatively new method is not yet universally given. The research results so far are promising, but few data are available. Hence, future research to validate this approach and increase its reliability is needed [18,19,20,50].
FTIR can also be used to identify calcium crystals in ex vivo tissue samples, as it delivers elaborate data about the chemical composition and can even be used for crystal mappings (Bazin et al., 2012). However, the slightly faster acquisition time when compared to Raman spectroscopy is accompanied by lower spatial and lateral resolution [51]. The latest technology now also allows FTIR in the nanometer range, which renders this technique equal to Raman spectroscopy in terms of effort and benefit, still with a slight tendency towards Raman spectroscopy due to the simpler sample preparation process [52]. Ideally, both methods should be applied as they complement each other by eliminating the weak/blind points of the respective other technology [53].
Accurate separation of BCP and CPP crystal deposition provides important information about the underlying metabolic imbalances, particularly in the pyrophosphate pathway that causes the deposition of both crystals. This pathway includes several enzymes controlling the ratio of extracellular levels of inorganic phosphate (Pi) and pyrophosphate. The nucleotide pyrophosphatase phosphodiesterase (NPP1) hydrolyses ATP, generating PPi that, at physiological levels, functions as an inhibitor of HA formation [54]. In addition, transmembrane proteins such as progressive ankylosis protein human homolog (ANK) regulate extracellular trafficking of ATP, where it is degraded to AMP and PPi. Therefore, increased ANK expression in chondrocytes increases extracellular PPi and an excess of PPi eventually leads to CPP calcification [55]. In contrast, the alkaline phosphatase TNAP hydrolyses PPi into Pi, increasing extracellular Pi levels and thereby inducing HA calcification with upregulated expression [56,57]. Prevention of pathological calcification, therefore, requires the maintenance of a stable Pi/PPi ratio. Consequently, accurate determination of the type of joint calcification may improve our understanding of its pathogenesis and underlying metabolic disorders and could thereby contribute to more specialized therapeutic approaches and targets, for instance counteracting the overproduction of PPi or Pi, respectively [49,58].
Both methods discussed in this work (Raman spectroscopy and SEM/EDS) have in common that BCP and CPP crystals can be accurately detected and distinguished in ex vivo tissue sections. The techniques complement each other and should be selected with regard to the objectives of the investigation.
SEM together with EDS represents a powerful combination for the detection and discrimination of calcium-phosphate-based mineralization. Due to its high magnification and resolution, it provides valuable information about crystal morphology and chemical composition, enabling precise crystal differentiation based on the Ca/P ratio. It was so far mostly applied to OA cartilage samples [42] and synovial fluid [59] samples. Here, we apply SEM/EDS on cartilage and synovial membrane samples, demonstrating the general applicability of our protocol in different joint tissues. However, based on our experiences presented here, all kinds of tissue sections could probably be analyzed with this technique, as long as the tissues are embedded in paraffin and can be cut into sections without decalcification.
In BSE mode, calcified areas appear white against a dark tissue background. In cartilage tissue, BCP crystals present as deposits of amorphous grain-like appearance while CPP crystals exhibit a rather sharply defined needle-shaped morphology. Complementary, EDS analysis reveals the chemical composition of a spot or a smaller area and enables precise crystal differentiation based on a Ca/P ratio of approximately 1.73 ± 0.12 for BCP and 1.14 ± 0.05 for CPP, respectively.
Theoretically, point-based mapping based on the relative proportions of Ca and P is also feasible, analogous to Raman mapping (for example, in [60]). However, on the one hand, this function is not available on all SEMs and on the other hand requires even more time than Raman-based mapping. The obligatory sputtering before the measurement also contaminates the sample and can have a negative impact on further measurement methods. However, as other sputter materials such as chromium or platinum without inherent functional disadvantages are available in addition to gold, negative impairments can be avoided in most cases. Furthermore, most SEMs operate in a low-pressure atmosphere, which, together with the required cooling for the EDS detector, increases the peripheral costs and thus tends to limit the overall availability.
Analogous to the SEM findings, Raman spectroscopy indicates the presence and location of calcification and enables a precise characterization of crystal composition. The resolution of Raman spectroscopy is much lower than the SEM’s but sufficient for the detection of crystals with a few micrometres in size. The resulting spectra exhibit unique peaks for BCP and CPP, respectively, and are therefore well suited for mathematical evaluation approaches such as the integration method used in this work. The size of calcified deposits can be measured manually with a software-integrated ruler, whereas fully calcified areas, made visible through the heat map, could be quantified via additional software such as ImageJ using a defined threshold to gain the relative concentration of calcification within a tissue section. Another advantage is that the histological sections do not require any additional preparation. Furthermore, the measurements themselves are fast and can be performed in a normal atmosphere, making this method less time-consuming and, for the same output, more cost-efficient. For these reasons, it is used to verify other methods such as DECT [50]. Post-processing of Raman measurements also enables calculating the ratios of certain peaks, e.g., the mineral-to-matrix ratio or determining the crystallinity, making it a useful tool for microstructural and chemical analysis of mineralized tissues such as cortical bone [61,62,63] or atherosclerotic plaques [64,65].
Although both presented high-resolution imaging methods enable relatively fast, simple and specific detection and differentiation of BCP and CPP calcifications, the authors regard them as tending (still) to be used more in research than in clinical use. This is not only due to high cost and limited availability [5] but also due to the added value in the treatment of patients. Since both methods require invasive tissue sampling, in most cases, at the time of joint replacement surgery, the applicability is limited to end-stage OA joints. Currently, there are no mechanistically targeted therapies against intra-articular CPP or BCP deposition available and treatment options are primarily symptomatic [66]. In clinical practice, identification of calcium crystals in calcified OA joints may therefore hold potential for more targeted therapeutic approaches such as the administration of TNAP inhibitors or ENPP1 enzyme replacement therapy that are being developed for ectopic calcification disorders such as Pseudoxanthoma Elasticum (PXE) and generalized arterial calcification of infancy (GACI) [67,68,69].
Limitations of the described methods arise from the inaccuracies inherent to the methods used and the spatial and lateral resolution of the imaging systems. Due to its simple and comparably inexpensive application, the usage of histological staining as a template is reasonable. Calcium crystal detection is mostly consistent with a positive Von Kossa [70] and Alizarin Red S staining, although highly dependent on the size of the calcified deposit and the separation between compared tissue sections, as well as previous sample preparation. In line with published findings, we could confirm discrepancies between Von Kossa-stained nodules and detected BCP and CPP crystals [25,40]. Similarly, Alizarin Red staining exhibits high background staining, rendering it prone/susceptible to producing false positive results [23,71]. The occasional false positive presence of calcium-phosphate-based mineralization in Von Kossa and Alizarin Red S staining may be caused by insufficient washing leaving crystal-resembling debris on the tissue. Since calcified deposits are often located loosely within the surrounding tissue, sample preparation may cause breakage or loss of the deposits.
The lateral resolution of 0.5 µm on the Raman system used might fail to detect individual BCP crystals or calcified matrix vesicles. This may also result in false negative results. On the other hand, the SEM investigations have shown that individual crystals mostly appear when larger agglomerations are also present. Especially in the context of the proposed semi-quantitative evaluation of Raman mappings, the focal volume or the penetration/analysis depth is relevant to derive statements about the investigated tissue volume. Since this is presumably a variable that is strongly dependent on the material investigated and the measurement parameters, no generally valid statements can be made. However, due to the very thin sections used, the total tissue volume investigated is relatively small, which reduces the potential for error.

5. Conclusions

In summary, our results show how to detect and differentiate BCP and CPP in calcified tissues. Both crystal types play an important role in understanding the biological mechanisms underlying OA- and CC-mediated tissue calcification. Compared to conventional (clinical) methods, which often lack accuracy and deal with inherent problems, the additional measurement effort of the described methods results in a significant gain in usable output data. Thus, SEM can additionally be used to investigate the topology of the specimen. The Raman measurements on the other hand are very time-efficient and, therefore, well suited for a raster measurement. The resulting mapping can then be used, for example, for a semi-quantitative evaluation.
Due to the acquisition costs of the devices and the rather retrospective nature of the analysis in relation to the disease course of the patients, the future of these methods is yet to be seen in research. However, a reliable and widely applicable method for the identification of calcium crystals in clinical practice could serve as an important step towards more targeted therapeutic approaches.

Author Contributions

A.B., S.S. and F.K. performed the experiments and drafted the manuscript. C.H.L. and J.B. supervised the work and wrote the final manuscript. All authors have read and agreed to the published version of the manuscript.

Funding

This work was supported by the INTEC society.

Institutional Review Board Statement

The study was conducted in accordance with the Declaration of Helsinki, and approved by the Institutional Review Board of the university hospital Magdeburg (28/20) on the 31 March 2020.

Informed Consent Statement

Written informed consent was obtained from all subjects involved in the study.

Data Availability Statement

Data sharing is not applicable to this article.

Conflicts of Interest

The authors declare no conflict of interest.

References

  1. Cross, M.; Smith, E.; Hoy, D.; Nolte, S.; Ackerman, I.; Fransen, M.; March, L. The global burden of hip and knee osteoarthritis: Estimates from the Global Burden of Disease 2010 study. Ann. Rheum. Dis. 2014, 73, 1323. [Google Scholar] [CrossRef]
  2. Cui, A.; Li, H.; Wang, D.; Zhong, J.; Chen, Y.; Lu, H. Global, regional prevalence, incidence and risk factors of knee osteoarthritis in population-based studies. EClinicalMedicine 2020, 29–30, 100587. [Google Scholar] [CrossRef]
  3. Ryu, K.; Iriuchishima, T.; Oshida, M.; Kato, Y.; Saito, A.; Imada, M.; Ryu, J. The prevalence of and factors related to calcium pyrophosphate dihydrate crystal deposition in the knee joint. Osteoarthr. Cartil. 2014, 22, 975–979. [Google Scholar] [CrossRef] [PubMed] [Green Version]
  4. McCarty, D.J.; Lehr, J.R.; Halverson, P.B. Crystal populations in human synovial fluid. Identification of apatite, octacalcium phosphate, and tricalcium phosphate. Arthritis Rheum 1983, 26, 1220–1224. [Google Scholar] [CrossRef] [PubMed]
  5. Stack, J.; McCarthy, G. Basic calcium phosphate crystals and osteoarthritis pathogenesis: Novel pathways and potential targets. Curr. Opin. Rheumatol. 2016, 28, 122–126. [Google Scholar] [CrossRef] [PubMed]
  6. Ea, H.-K.; Chobaz, V.; Nguyen, C.; Nasi, S.; van Lent, P.; Daudon, M.; Busso, N. Pathogenic Role of Basic Calcium Phosphate Crystals in Destructive Arthropathies. PLoS ONE 2013, 8, e57352. [Google Scholar] [CrossRef] [PubMed] [Green Version]
  7. Fuerst, M.; Bertrand, J.; Lammers, L.; Dreier, R.; Echtermeyer, F.; Nitschke, Y.; Rüther, W. Calcification of articular cartilage in human osteoarthritis. Arthritis Rheum 2009, 60, 2694–2703. [Google Scholar] [CrossRef]
  8. McCarthy, G.M.; Dunne, A. Calcium crystal deposition diseases—Beyond gout. Nat. Rev. Rheumatol. 2018, 14, 592–602. [Google Scholar] [CrossRef] [PubMed]
  9. Zhang, W.; Doherty, M.; Bardin, T.; Barskova, V.; Guerne, P.A.; Jansen, T.L.; Pascual, E. European League Against Rheumatism recommendations for calcium pyrophosphate deposition. Part I: Terminology and diagnosis. Ann. Rheum. Dis. 2011, 70, 563–570. [Google Scholar] [CrossRef]
  10. Mitsuyama, H.; Healey, R.M.; Terkeltaub, R.A.; Coutts, R.D.; Amiel, D. Calcification of human articular knee cartilage is primarily an effect of aging rather than osteoarthritis. Osteoarthr. Cartil. 2007, 15, 559–565. [Google Scholar] [CrossRef] [Green Version]
  11. Mitrovic, D.R.; Stankovic, A.; Iriarte-Borda, O.; Uzan, M.; Quintero, M.; Miravet, L.; Kuntz, D. The prevalence of chondrocalcinosis in the human knee joint. An autopsy survey. J. Rheumatol. 1988, 15, 633–641. [Google Scholar]
  12. Derfus, B.A.; Kurian, J.B.; Butler, J.J.; Daft, L.J.; Carrera, G.F.; Ryan, L.M.; Rosenthal, A.K. The high prevalence of pathologic calcium crystals in pre-operative knees. J. Rheumatol. 2002, 29, 570–574. [Google Scholar]
  13. Rosenthal, A.K.; Ryan, L.M. Calcium Pyrophosphate Deposition Disease. N. Engl. J. Med. 2016, 374, 2575–2584. [Google Scholar] [CrossRef] [PubMed]
  14. Abhishek, A.; Doherty, M. Update on calcium pyrophosphate deposition. Clin. Exp. Rheumatol. 2016, 34 (Suppl. S98), 32–38. [Google Scholar] [PubMed]
  15. Choi, Y.; Shin, N.Y.; Jang, J.; Ahn, K.J.; Kim, B.S. Dual-energy CT for differentiating acute intracranial hemorrhage from contrast staining or calcification: A meta-analysis. Neuroradiology 2020, 62, 1617–1626. [Google Scholar] [CrossRef] [PubMed]
  16. Hu, R.; Daftari Besheli, L.; Young, J.; Wu, M.; Pomerantz, S.; Lev, M.H.; Gupta, R. Dual-Energy Head CT Enables Accurate Distinction of Intraparenchymal Hemorrhage from Calcification in Emergency Department Patients. Radiology 2016, 280, 177–183. [Google Scholar] [CrossRef] [Green Version]
  17. Wiggins, W.F.; Potter, C.A.; Sodickson, A.D. Dual-Energy CT to Differentiate Small Foci of Intracranial Hemorrhage from Calcium. Radiology 2020, 294, 129–138. [Google Scholar] [CrossRef]
  18. Becce, F.; Viry, A.; Stamp, L.K.; Pascart, T.; Budzik, J.F.; Raja, A. Winds of change in imaging of calcium crystal deposition diseases. Jt. Bone Spine 2019, 86, 665–668. [Google Scholar] [CrossRef]
  19. Filippou, G.; Pascart, T.; Iagnocco, A. Utility of Ultrasound and Dual Energy CT in Crystal Disease Diagnosis and Management. Curr. Rheumatol. Rep. 2020, 22, 15. [Google Scholar] [CrossRef]
  20. Pascart, T.; Norberciak, L.; Legrand, J.; Becce, F.; Budzik, J.F. Dual-energy computed tomography in calcium pyrophosphate deposition: Initial clinical experience. Osteoarthr. Cartil. 2019, 27, 1309–1314. [Google Scholar] [CrossRef]
  21. Andrés, M.; Vela, P.; Jovaní, V.; Pascual, E. Most needle-shaped calcium pyrophosphate crystals lack birefringence. Rheumatology 2019, 58, 1095–1098. [Google Scholar] [CrossRef] [PubMed]
  22. MacMullan, P.; McMahon, G.; McCarthy, G. Detection of basic calcium phosphate crystals in osteoarthritis. Jt. Bone Spine 2011, 78, 358–363. [Google Scholar] [CrossRef] [PubMed]
  23. Paul, H.; Reginato, A.J.; Schumacher, H.R. Alizarin red S staining as a screening test to detect calcium compounds in synovial fluid. Arthritis Rheum 1983, 26, 191–200. [Google Scholar] [CrossRef] [PubMed]
  24. Lazcano, O.; Li, C.Y.; Pierre, R.V.; O’Duffy, J.D.; Beissner, R.S.; Abell-Aleff, P.C. Clinical utility of the alizarin red S stain on permanent preparations to detect calcium-containing compounds in synovial fluid. Am. J. Clin. Pathol. 1993, 99, 90–96. [Google Scholar] [CrossRef]
  25. Louvet, L.; Bazin, D.; Büchel, J.; Steppan, S.; Passlick-Deetjen, J.; Massy, Z.A. Characterisation of Calcium Phosphate Crystals on Calcified Human Aortic Vascular Smooth Muscle Cells and Potential Role of Magnesium. PLoS ONE 2015, 10, e0115342. [Google Scholar] [CrossRef] [Green Version]
  26. Bazin, D.; Daudon, M.; Combes, C.; Rey, C. Characterization and some physicochemical aspects of pathological microcalcifications. Chem. Rev. 2012, 112, 5092–5120. [Google Scholar] [CrossRef] [Green Version]
  27. Daudon, M.; Frochot, V.; Bazin, D.; Jungers, P. Drug-Induced Kidney Stones and Crystalline Nephropathy: Pathophysiology, Prevention and Treatment. Drugs 2018, 78, 163–201. [Google Scholar] [CrossRef] [PubMed]
  28. Hester, C.; Philippe, M.; Emmanuel, L.; Vincent, F.; Jean-François, B.; Raphaël, W.; Dominique, B. Pathologies related to abnormal deposits in dermatology: A physico-chemical approach. Comptes Rendus. Chim. 2022, 25, 445–476. [Google Scholar] [CrossRef]
  29. Zimmermann, E.A.; Fiedler, I.A.K.; Busse, B. Breaking new ground in mineralized tissue: Assessing tissue quality in clinical and laboratory studies. J. Mech. Behav. Biomed. Mater. 2021, 113, 104138. [Google Scholar] [CrossRef]
  30. Carpentier, X.; Daudon, M.; Traxer, O.; Jungers, P.; Mazouyes, A.; Matzen, G.; Bazin, D. Relationships between carbonation rate of carbapatite and morphologic characteristics of calcium phosphate stones and etiology. Urology 2009, 73, 968–975. [Google Scholar] [CrossRef] [PubMed]
  31. Daudon, M.; Bouzidi, H.; Bazin, D. Composition and morphology of phosphate stones and their relation with etiology. Urol. Res. 2010, 38, 459–467. [Google Scholar] [CrossRef]
  32. Goldstein, J.I.; Yakowitz, H. Practical Scanning Electron Microscopy: Electron and Ion Microprobe Analysis; Plenum Press: New York, NY, USA, 1975. [Google Scholar]
  33. Miculescu, F.; Luță, C.; Constantinescu, A.E.; Maidaniuc, A.; Mocanu, A.C.; Miculescu, M.; Ciocan, L.T. Considerations and Influencing Parameters in EDS Microanalysis of Biogenic Hydroxyapatite. J. Funct. Biomater. 2020, 11, 82. [Google Scholar] [CrossRef] [PubMed]
  34. Frallonardo, P.; Oliviero, F.; Peruzzo, L.; Tauro, L.; Scanu, A.; Galozzi, P.; Punzi, L. Detection of Calcium Crystals in Knee Osteoarthritis Synovial Fluid: A Comparison Between Polarized Light and Scanning Electron Microscopy. JCR J. Clin. Rheumatol. 2016, 22, 369–371. [Google Scholar] [CrossRef] [PubMed]
  35. Nguyen, C.; Bazin, D.; Daudon, M.; Chatron-Colliet, A.; Hannouche, D.; Bianchi, A.; Ea, H.-K. Revisiting spatial distribution and biochemical composition of calcium-containing crystals in human osteoarthritic articular cartilage. Arthritis Res. Ther. 2013, 15, R103. [Google Scholar] [CrossRef] [Green Version]
  36. Cheng, X.; Haggins, D.G.; York, R.H.; Yeni, Y.N.; Akkus, O. Analysis of crystals leading to joint arthropathies by Raman spectroscopy: Comparison with compensated polarized imaging. Appl. Spectrosc. 2009, 63, 381–386. [Google Scholar] [CrossRef] [PubMed]
  37. Li, B.; Singer, N.G.; Yeni, Y.N.; Haggins, D.G.; Barnboym, E.; Oravec, D.; Akkus, O. A Point-of-Care Raman Spectroscopy-Based Device for the Diagnosis of Gout and Pseudogout: Comparison with the Clinical Standard Microscopy. Arthritis Rheumatol. 2016, 68, 1751–1757. [Google Scholar] [CrossRef] [PubMed] [Green Version]
  38. Yavorskyy, A.; Hernandez-Santana, A.; McCarthy, G.; McMahon, G. Detection of calcium phosphate crystals in the joint fluid of patients with osteoarthritis—Analytical approaches and challenges. Analyst 2008, 133, 302–318. [Google Scholar] [CrossRef] [PubMed] [Green Version]
  39. Schneider, M.R. Von Kossa and his staining technique. Histochem. Cell Biol. 2021, 156, 523–526. [Google Scholar] [CrossRef] [PubMed]
  40. Bonewald, L.F.; Harris, S.E.; Rosser, J.; Dallas, M.R.; Dallas, S.L.; Camacho, N.P.; Boskey, A. Von Kossa Staining Alone Is Not Sufficient to Confirm that Mineralization In Vitro Represents Bone Formation. Calcif. Tissue Int. 2003, 72, 537–547. [Google Scholar] [CrossRef]
  41. Everall, N.J. Confocal Raman microscopy: Common errors and artefacts. Analyst 2010, 135, 2512–2522. [Google Scholar] [CrossRef]
  42. Fuerst, M.; Lammers, L.; Schäfer, F.; Niggemeyer, O.; Steinhagen, J.; Lohmann, C.H.; Rüther, W. Investigation of calcium crystals in OA knees. Rheumatol. Int. 2010, 30, 623–631. [Google Scholar] [CrossRef]
  43. Milovanovic, P.; Zimmermann, E.A.; Vom Scheidt, A.; Hoffmann, B.; Sarau, G.; Yorgan, T.; Busse, B. The Formation of Calcified Nanospherites during Micropetrosis Represents a Unique Mineralization Mechanism in Aged Human Bone. Small 2017, 13, 1602215. [Google Scholar] [CrossRef]
  44. Germann, C.; Galley, J.; Falkowski, A.L.; Fucentese, S.F.; Pfirrmann, C.W.A.; Nanz, D.; Sutter, R. Ultra-high resolution 3D MRI for chondrocalcinosis detection in the knee-a prospective diagnostic accuracy study comparing 7-tesla and 3-tesla MRI with CT. Eur. Radiol. 2021, 31, 9436–9445. [Google Scholar] [CrossRef] [PubMed]
  45. Barskova, V.G.; Kudaeva, F.M.; Bozhieva, L.A.; Smirnov, A.V.; Volkov, A.V.; Nasonov, E.L. Comparison of three imaging techniques in diagnosis of chondrocalcinosis of the knees in calcium pyrophosphate deposition disease. Rheumatology 2013, 52, 1090–1094. [Google Scholar] [CrossRef] [Green Version]
  46. Dieppe, P.; Swan, A. Identification of crystals in synovial fluid. Ann. Rheum. Dis. 1999, 58, 261. [Google Scholar] [CrossRef] [PubMed] [Green Version]
  47. Pascual, E.; Jovaní, V. Synovial fluid analysis. Best Pract. Res. Clin. Rheumatol. 2005, 19, 371–386. [Google Scholar] [CrossRef] [PubMed]
  48. Seidman, A.J.; Limaiem, F. Synovial Fluid Analysis. In StatPearls; StatPearls Publishing: Treasure Island, FL, USA, 2022. [Google Scholar]
  49. Rosenthal, A.K.; Ryan, L.M. Nonpharmacologic and pharmacologic management of CPP crystal arthritis and BCP arthropathy and periarticular syndromes. Rheum. Dis. Clin. N. Am. 2014, 40, 343–356. [Google Scholar] [CrossRef]
  50. Pascart, T.; Falgayrac, G.; Norberciak, L.; Lalanne, C.; Legrand, J.; Houvenagel, E.; Budzik, J.F. Dual-energy computed-tomography-based discrimination between basic calcium phosphate and calcium pyrophosphate crystal deposition in vivo. Ther. Adv. Musculoskelet. Dis. 2020, 12, 1–9. [Google Scholar] [CrossRef] [PubMed]
  51. Krafft, C.; Codrich, D.; Pelizzo, G.; Sergo, V. Raman mapping and FTIR imaging of lung tissue: Congenital cystic adenomatoid malformation. Analyst 2008, 133, 361–371. [Google Scholar] [CrossRef] [Green Version]
  52. Ivan, T.L.; Dominique, B.; Michel, D. Raman opportunities in the field of pathological calcifications. Comptes Rendus. Chim. 2022, 25, 83–103. [Google Scholar] [CrossRef]
  53. Daudon, M.; Bazin, D. Vibrational spectroscopies to investigate concretions and ectopic calcifications for medical diagnosis. Comptes Rendus Chim. 2016, 19, 1416–1423. [Google Scholar] [CrossRef]
  54. Lee, S.Y.; Müller, C.E. Nucleotide pyrophosphatase/phosphodiesterase 1 (NPP1) and its inhibitors. Medchemcomm 2017, 8, 823–840. [Google Scholar] [CrossRef] [PubMed]
  55. Johnson, K.; Terkeltaub, R. Upregulated ank expression in osteoarthritis can promote both chondrocyte MMP-13 expression and calcification via chondrocyte extracellular PPi excess. Osteoarthr. Cartil. 2004, 12, 321–335. [Google Scholar] [CrossRef] [PubMed] [Green Version]
  56. Murshed, M.; Harmey, D.; Millán, J.L.; McKee, M.D.; Karsenty, G. Unique coexpression in osteoblasts of broadly expressed genes accounts for the spatial restriction of ECM mineralization to bone. Genes Dev. 2005, 19, 1093–1104. [Google Scholar] [CrossRef] [Green Version]
  57. Villa-Bellosta, R.; Wang, X.; Millán, J.L.; Dubyak, G.R.; O’Neill, W.C. Extracellular pyrophosphate metabolism and calcification in vascular smooth muscle. Am. J. Physiol. Heart Circ. Physiol. 2011, 301, H61–H68. [Google Scholar] [CrossRef] [PubMed]
  58. Kempf, H.; Komarova, S.; Murshed, M. Editorial: Ectopic Mineralization of Tissues: Mechanisms, Risk Factors, Diseases, and Prevention. Front. Cell Dev. Biol. 2021, 9, 759702. [Google Scholar] [CrossRef]
  59. Frallonardo, P.; Ramonda, R.; Peruzzo, L.; Scanu, A.; Galozzi, P.; Tauro, L.; Oliviero, F. Basic calcium phosphate and pyrophosphate crystals in early and late osteoarthritis: Relationship with clinical indices and inflammation. Clin. Rheumatol. 2018, 37, 2847–2853. [Google Scholar] [CrossRef] [PubMed]
  60. Crackau, M.; Harnisch, K.; Baierl, T.; Rosemann, P.; Lohmann, C.H.; Bertrand, J.; Halle, T. Microstructure and surface investigations of TiAl6V4 and CoCr28Mo6 orthopaedic femoral stems. IOP Conf. Ser. Mater. Sci. Eng. 2020, 882, 012004. [Google Scholar] [CrossRef]
  61. Milovanovic, P.; Vom Scheidt, A.; Mletzko, K.; Sarau, G.; Püschel, K.; Djuric, M.; Busse, B. Bone tissue aging affects mineralization of cement lines. Bone 2018, 110, 187–193. [Google Scholar] [CrossRef]
  62. Seto, J.; Busse, B.; Gupta, H.S.; Schäfer, C.; Krauss, S.; Dunlop, J.W.C.; Jahnen-Dechent, W. Accelerated Growth Plate Mineralization and Foreshortened Proximal Limb Bones in Fetuin-A Knockout Mice. PLoS ONE 2012, 7, e47338. [Google Scholar] [CrossRef] [PubMed]
  63. Wölfel, E.M.; Fiedler, I.A.K.; Dragoun Kolibova, S.; Krug, J.; Lin, M.-C.; Yazigi, B.; Busse, B. Human tibial cortical bone with high porosity in type 2 diabetes mellitus is accompanied by distinctive bone material properties. Bone 2022, 165, 116546. [Google Scholar] [CrossRef] [PubMed]
  64. Tzang, O.; Kfir, K.; Flaxer, E.; Cheshnovsky, O.; Einav, S. Detection of Microcalcification in Tissue by Raman Spectroscopy. Cardiovasc. Eng. Technol. 2011, 2, 228–233. [Google Scholar] [CrossRef]
  65. You, A.Y.F.; Bergholt, M.S.; St-Pierre, J.-P.; Kit-Anan, W.; Pence, I.J.; Chester, A.H.; Stevens, M.M. Raman spectroscopy imaging reveals interplay between atherosclerosis and medial calcification in the human aorta. Sci. Adv. 2017, 3, e1701156. [Google Scholar] [CrossRef] [PubMed] [Green Version]
  66. Iqbal, S.M.; Qadir, S.; Aslam, H.M.; Qadir, M.A. Updated Treatment for Calcium Pyrophosphate Deposition Disease: An Insight. Cureus 2019, 11, e3840. [Google Scholar] [CrossRef]
  67. Khan, T.; Sinkevicius, K.W.; Vong, S.; Avakian, A.; Leavitt, M.C.; Malanson, H.; Askew, K.L. ENPP1 enzyme replacement therapy improves blood pressure and cardiovascular function in a mouse model of generalized arterial calcification of infancy. Dis. Model. Mech. 2018, 11, dmm035691. [Google Scholar] [CrossRef] [PubMed] [Green Version]
  68. Luo, H.; Li, Q.; Cao, Y.; Uitto, J. Therapeutics Development for Pseudoxanthoma Elasticum and Related Ectopic Mineralization Disorders: Update 2020. J. Clin. Med. 2020, 10, 114. [Google Scholar] [CrossRef] [PubMed]
  69. Ziegler, S.G.; Ferreira, C.R.; MacFarlane, E.G.; Riddle, R.C.; Tomlinson, R.E.; Chew, E.Y.; Dietz, H.C. Ectopic calcification in pseudoxanthoma elasticum responds to inhibition of tissue-nonspecific alkaline phosphatase. Sci. Transl. Med. 2017, 9. [Google Scholar] [CrossRef] [Green Version]
  70. Asselman, M.; Verhulst, A.; de Broe, M.E.; Verkoelen, C.F. Calcium Oxalate Crystal Adherence to Hyaluronan-, Osteopontin-, and CD44-Expressing Injured/Regenerating Tubular Epithelial Cells in Rat Kidneys. J. Am. Soc. Nephrol. 2003, 14, 3155. [Google Scholar] [CrossRef] [PubMed] [Green Version]
  71. Eggelmeijer, F.; Dijkmans, B.A.; Macfarlane, J.D.; Cats, A. Alizarin red S staining of synovial fluid in inflammatory joint disorders. Clin. Exp. Rheumatol. 1991, 9, 11–16. [Google Scholar] [PubMed]
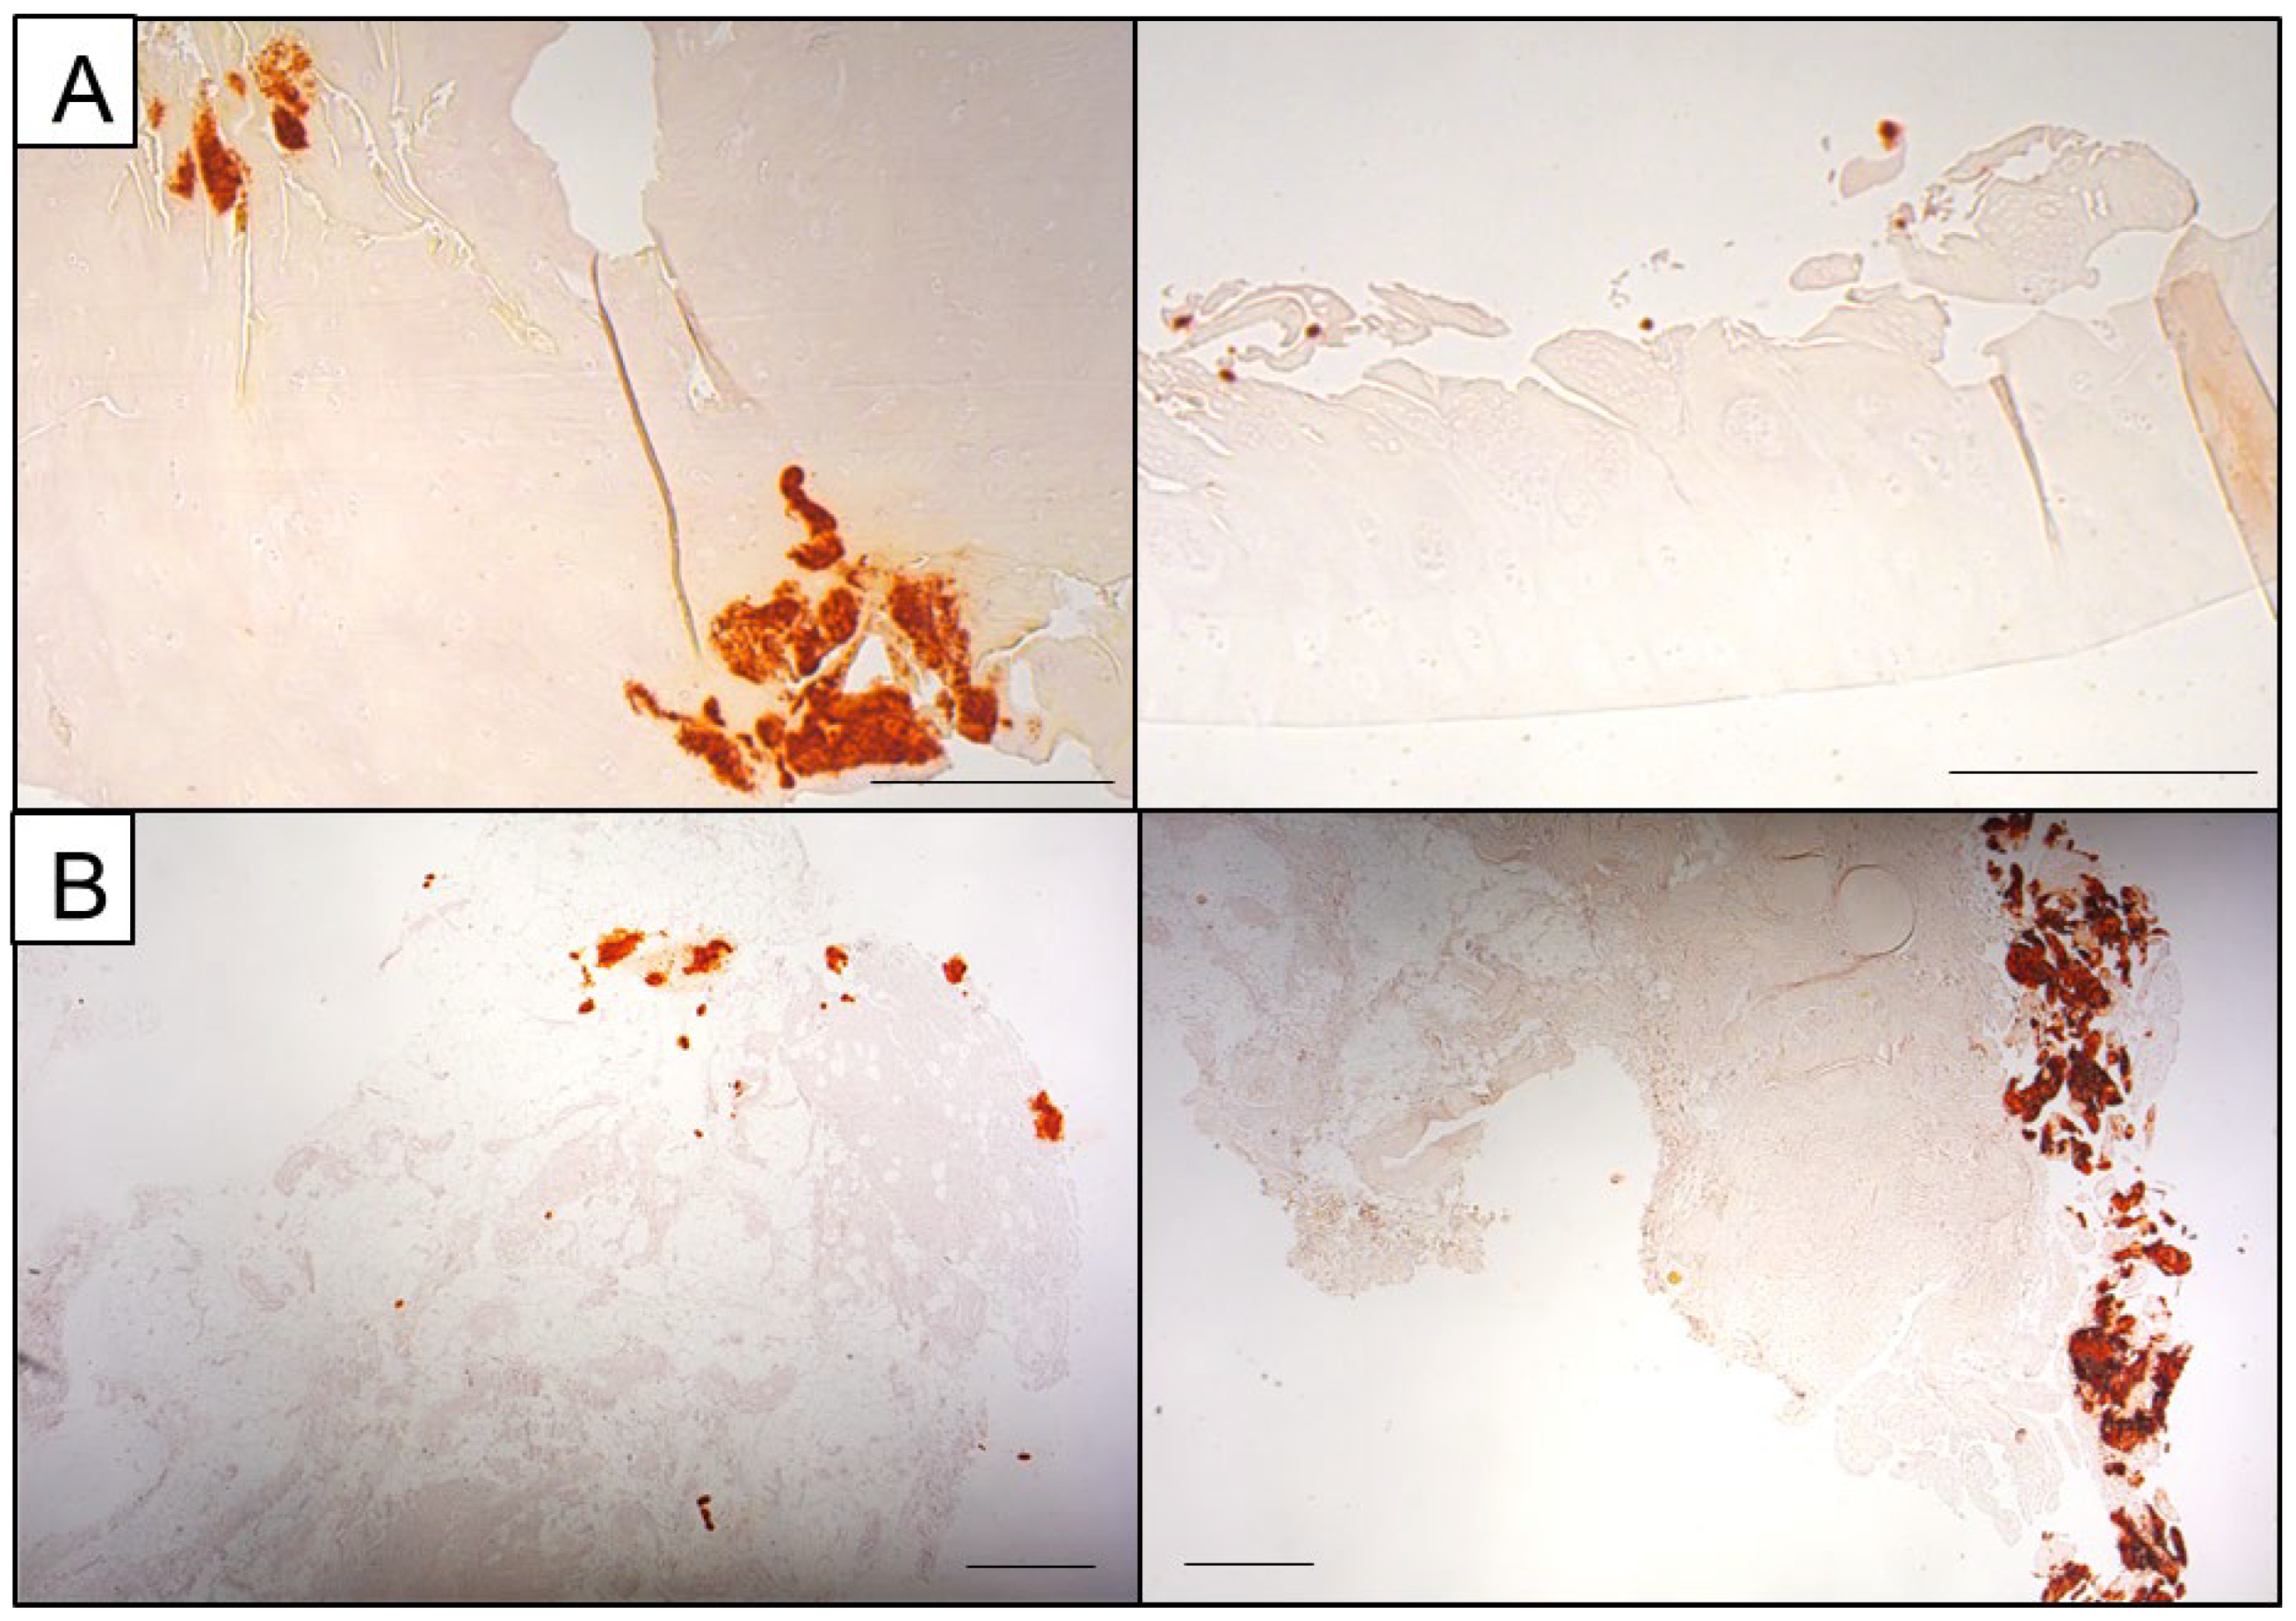
Figure 1. Representative images of Alizarin Red S staining of cartilage (A) and synovial membrane tissue. (B) Calcifications appear as dark orange to red deposits within or surrounding the tissue (scale bars: 500 µm).
Gucdd 01 00007 g001
Figure 2. Representative Von Kossa images of partly calcified joint tissue. (A) Calcifications can be embedded within cartilage tissue and located in the deeper layers exhibiting a powdery appearance (left panel) or presenting as calcified chunks located loosely at the chondrocyte surface (right panel, scale bars: 500 µm). (B) Synovial membrane specimens can exhibit both smaller calcifications and bigger calcified chunks that are integrated into the surrounding tissue or loosely presented aside (scale bars: 500 µm).
Gucdd 01 00007 g002
Figure 3. Representative ROI selection for Raman analysis. Von Kossa image (left panel) was used to guide ROI selection (green square, right panel).
Gucdd 01 00007 g003
Figure 4. Configuration window for the selected integration method for CPP. “Left edge” and “Right edge” define the area of the x-axis that will be integrated, i.e., for CPP, we integrated the graph in the range from 1035 to 1060 cm−1. The baseline points are the base on which the program (OPUS 7.8) determines the baseline for the integration using a least square fit.
Gucdd 01 00007 g004
Figure 5. Schematic workflow for analyzing calcified tissue using Raman spectroscopy or SEM/ EDS.
Gucdd 01 00007 g005
Figure 6. Comparison between SE and BSE image of partly calcified cartilage (A) and synovial membrane (B). Left: SE, right: BSE. The BSE images clearly show calcification in lighter tones (red markings) while the SE image displays multiple lighter spots due to electric charge, especially at the rim of the tissue, complicating the search for ROIs and the overall visibility.
Gucdd 01 00007 g006
Figure 7. Representative SEM images of BCP crystals in hyaline cartilage. (A) Large agglomeration of BCP crystals. (SE detector. 5000×. WD 11.6 mm. Au-sputtered.) (B) Smaller agglomerations locally distributed within the tissue (red arrows). (SE detector. 5000×. WD 11.6 mm. Au-sputtered.).
Gucdd 01 00007 g007
Figure 8. Representative pictures of intense calcified hyaline cartilage sample. The white square identifies the enlarged region for the next picture. (A) Overview. The lighter parts represent CPP crystals. (SE detector. 250×. WD 11.6 mm. Au-sputtered.) (B) Less calcified area exhibiting the partial penetration of the tissue. (SE detector. 500×. WD 11.6 mm. Au-sputtered.) (C) CPP covering the sample with needle-like crystals. (SE detector. 5000×. WD 11.6 mm. Au-sputtered.).
Gucdd 01 00007 g008
Figure 9. Representative SEM images of BCP (A,B) and CPP (C,D) accumulation in synovial membrane specimens enable a qualitative analysis. The white square identifies the enlarged region for the next picture. (A) Selected image of large, disintegrated calcified cluster consisting solely of BCP. (SE detector. 500×. WD 12.8 mm. Au-sputtered). (B) Magnified image of BCP cluster in A (SE detector 5000×. WD 12.8 mm). (C) Overview SE image of a heavily calcified synovial membrane sample due to CPP crystal deposition. (SE detector. 500×. WD 8.5 mm. Au-sputtered). (D) Detailed presentation of rhomboid-shaped CPP crystals. (SE detector. 5000×. WD 8.5 mm. Au-sputtered.).
Gucdd 01 00007 g009
Figure 10. Representative EDS scans of calcified cartilage tissue. Taken at 10 kV. (A) BCP crystal, R = 1.71. (B) CPP crystal, R = 1.08. (C) BCP crystal with weak signals. R = 1.53. (D) CPP crystal, R = 1.13.
Gucdd 01 00007 g010
Figure 11. Representative Raman mapping of the calcified cartilage (OPUS 7.8) (A) and synovial membrane (B) samples. Overview image of the tissue section (right panel). Representative Raman spectrum showing a characteristic peak for BCP at 960 cm−1 (lower panel). Representative heat map of an area containing BCP crystals after normalization and spectrum integration at the characteristic BCP peak (left panel).
Gucdd 01 00007 g011
Figure 12. Representative Raman mapping of the calcified cartilage (OPUS 7.8) (A) and synovial membrane (B) samples. Overview image of the cartilage sample with the selected ROI grid in green (right panel). Representative Raman spectrum showing a characteristic peak for CPP at 1050 cm−1 (lower panel). Representative heat map of an area containing CPP crystals after normalization and spectrum integration at the characteristic CPP peak (left panel).
Gucdd 01 00007 g012
Figure 13. Example of two cosmic rays in Raman mapping (OPUS 7.8) with integral on 960 cm−1 for BCP, the cosmic rays can be clearly recognized due to the outstanding red dots.
Gucdd 01 00007 g013
Table 1. Overview of the resulting Ca/P ratios from EDX measurements on hyaline cartilage and knee synovial membrane (KSM).
KSM BCP
(n = 10)
Cartilage BCP (n = 3)Overall BCP (n = 13)KSM CPP (n = 5)Cartilage CPP (n = 15)Overall CPP (n = 20)
Average1.761.601.731.091.161.14
Standard deviation0.100.080.120.030.040.05
Disclaimer/Publisher’s Note: The statements, opinions and data contained in all publications are solely those of the individual author(s) and contributor(s) and not of MDPI and/or the editor(s). MDPI and/or the editor(s) disclaim responsibility for any injury to people or property resulting from any ideas, methods, instructions or products referred to in the content.