Abstract
Many preclinical reports have coalesced to identify a strong association between obesity and increased levels of uric acid (UA) in tissues and, importantly, in the circulation (hyperuricemia). Unfortunately, nearly all these studies were conducted with male mice or, in one case, female mice without a side-by-side male cohort. Therefore, the relationship between obesity and hyperuricemia in female mice remains undefined. This lack of clarity in the field has considerable impact as the downstream effects of obesity and allied hyperuricemia are extensive, resulting in many comorbidities including cardiovascular dysfunction, chronic kidney disease, and nonalcoholic fatty liver disease (NAFLD). Herein we begin to address this issue by revealing phenotypic and metabolic responses to diet-induced obesity (DIO) in a side-by-side male vs. female C57BL/6J study. Beginning at 6 weeks of age, mice were exposed to either an obesogenic diet (60% calories from fat) or control diet (10% calories from fat) for 19 weeks. Similar to numerous reported observations with the 60% diet, male mice experienced significant weight gain over time, elevated fasting blood glucose, impaired glucose tolerance and significantly elevated circulating uric acid levels (2.54 ± 0.33 mg/dL) compared to age-matched lean male controls (1.53 ± 0.19 mg/dL). As expected, the female mice experienced a slower rate of weight gain compared to the males; however, they also developed elevated fasting blood glucose and impaired glucose tolerance compared to age-matched lean controls. Countervailing our previous report whereby the control diet for the female-only study was vivarium standard chow (18% calories from fat), the obese female mice did demonstrate significantly elevated circulating UA levels (2.55 ± 0.15 mg/dL) compared to the proper control (1.68 ± 0.12 mg/dL). This affirms that the choice of control diet is crucial for reaching durable conclusions. In toto, these results, for the first time, reveal elevated circulating UA to be a similar long-term response to obesogenic feeding for both males and females and mirrors clinical observations demonstrating hyperuricemia in obesity for both sexes.
1. Introduction
Diet-induced obesity (DIO) is a sharply growing epidemic, as modern diets, which emphasize convenience of time and money, have shifted to highly processed foods containing high levels of salt, sugar, and fat [1]. This change in diet has also resulted in enhanced appetitive properties, leading to greater caloric intake in the context of a more sedentary lifestyle [2]. Disease processes allied to DIO include metabolic syndrome and Type II diabetes, with several comorbidities affecting cardiorenal, vascular, and liver function [3]. A potential pathway contributing to this process is purine catabolism which ultimately leads to the generation of uric acid (UA). For example, UA has been found to be a strong independent indicator of obesity as well as several comorbidities [4,5,6]; however, the question of causation versus correlation regarding the contributory impact of UA on these processes is yet to be fully determined. This is important because therapies to diminish UA levels are U.S. Food and Drug Administration (FDA)-approved and could be employed to address obesity and its downstream consequences.
A crucial downside to the current literature reporting DIO data in preclinical models (rodent) is that the studies have been almost exclusively conduced with males. There are reports that indicate differences in male and female mice responses to DIO in terms of weight gain and glucose metabolism. Unfortunately, these investigations have been limited, leaving the physiologic responses to DIO in females far less defined than those in males. It is well known that DIO and/or genetically induced obese males demonstrate a significant and tight linkage between obesity/metabolic dysfunction and elevated circulating UA levels [7,8,9,10,11,12,13]. While there has been a report addressing female murine UA levels and obesity, it was conducted without side-by-side male cohorts and used laboratory chow containing 18% calories from fat as the control diet [14]. This study, employing the 60% DIO model, revealed a trend toward elevated plasma UA in female mice, but this increase was not statistically significant compared to controls. The main conclusion from this report was that, while obese female mice exhibit the same metabolic dysfunction as males (e.g., fasting blood glucose, impaired glucose tolerance, increased plasma and liver triglycerides), they do not show elevated circulating UA levels. However, the study limitations (e.g., fat content of control diet and absence of side-by-side male cohorts) necessitate a follow-up reevaluation. This is especially important as clinical data suggest a link between hyperuricemia and obesity for both adolescent and adult females, underscoring the critical need to establish the translatability of female preclinical models [15,16].
Given the extremely limited data on UA levels in female murine obesity and the importance of establishing a preclinical-to-clinical link for obese female mice and patients, this current study aims to examine the impact of DIO on circulating UA levels in age-matched male and female mice.
2. Materials and Methods
2.1. Reagents
Uric acid standards were made using uric acid sodium salt (Sigma, St. Louis, USA, cat#U2875-5G). XO assay used xanthine sodium salt (Sigma, St. Louis, MO, USA, cat#X2502-10G), allopurinol (Sigma, St. Louis, MO, USA, cat#A8003-5G), and oxonic acid potassium salt (Aldrich, Milwaukee, WI, USA, cat#156124-25G) and β-Nicotinamide adenine dinucleotide, free acid (MP Biomedicals, Cleveland, OH, USA, cat#MP21004991). Samples were fractionated by HPLC on a C18 column (150 × 4.6 mm, Luna 3 µm particle size, Phenomenex). UA content was quantitated via electrochemical detection (Thermo Scientific, Waltham, MA, USA, UltiMate 3000 ECD-3000RS), using a UA calibration curve from 0.1 µM to 50 µM.
2.2. Diet-Induced Obesity Studies
All animal studies were conducted under the approval of the West Virginia University Institutional Animal Care and Use Committee (protocol# 1604002026). Male and female C57BL/6J mice were fed a 60% fat diet (Research Diets D12492, Research Diets Inc., New Brunswick, NJ, USA) for 19 weeks, beginning at 6 weeks of age. Age-matched controls were fed a diet with the same amount of sucrose but containing only 10% of calories from fat (Research Diets D12450J, Research Diets Inc., New Brunswick, NJ, USA). Diets and water were supplied ad libitum for the entire study. Mouse weights and food consumption were recorded weekly. Lean and fat mass were analyzed by EchoMRI after 16 weeks on the diets.
2.3. Glucose Tolerance Test (GTT)
Mice were fasted for 7 h starting at 7 a.m., and then injected (i.p.) with glucose (1.3 g/kg). This dose remained constant throughout the study. Blood glucose was assessed at 0 min, 20 min, 40 min, 60 min, and 120 min post injection using an Accu-Chek Guide Me glucometer (Roche Diagnostics, North America).
2.4. XOR Activity Assay
Plasma samples were assessed for XO activity, while tissue samples were assessed for XO and/or XDH activity, as previously described using reverse phase HPLC coupled to electrochemical detection of uric acid [14,17]. Tissue samples were homogenized in RIPA buffer with a protease inhibitor cocktail (Thermo Scientific, Waltham, USA, cat#89900) and spun down (13,200 RPM for 15 min). The supernatant was transferred to a clean tube, and 10 µL was added to the assay. For the plasma, no homogenization or spin down was necessary, thus 10 µL samples were able to be added directly to the assay. One unit of activity (U) is defined as 1 μmole of urate formed per min at 37 °C and pH 7.4. The lower limit of detection is 300 nM.
2.5. Lipid Extraction and Sample Preparation
To analyze cholesterol, cholesteryl esters, and triglycerides in plasma samples, 15 μL of each plasma sample was spiked with 5 pmol of d7-cholesterol (Avanti Polar Lipids Inc., Alabaster, AL, USA), 5 pmol of d7-16:0-cholesteryl ester (Avanti Polar Lipids, Inc.), and 19.7 pmol of TG17:0/17:0/17:0 (Avanti Polar Lipids Inc., Alabaster, AL, USA) as internal standards for cholesterol, cholesteryl esters, and triglycerides, respectively. Lipids were extracted by adding 200 μL of ethyl acetate, followed by 100 μL of water. The upper organic phase was transferred to a clean vial, dried under nitrogen, and reconstituted in 200 μL of a 50:50 (v/v) ethyl acetate/acetonitrile mixture. The reconstituted samples were then subjected to liquid chromatography-mass spectrometry (LC-MS) analysis.
2.6. LC-MS Measurement of Cholesterol and Cholesteryl Esters
Cholesterol and cholesteryl esters were chromatographically resolved using a C18 reverse-phase column (2 × 100 mm, 5 μm, Phenomenex, Torrance, CA, USA) at a flow rate of 650 μL/min. The gradient solvent system consisted of solvent A (50% water/50% acetonitrile/0.1% formic acid) and solvent B (90% isopropanol/10% acetonitrile/0.1% formic acid). The samples were applied to the column at 50% solvent B and eluted with a linear gradient to 100% solvent B over 7.7 min. The gradient was held at 100% solvent B for 2 min, followed by a return to starting conditions over 3 min.
Quantification of analytes were performed in multiple reaction monitoring (MRM) mode using a QTrap 6500+ triple quadrupole mass spectrometer (Sciex, San Jose, CA, USA) equipped with an electrospray ionization source. The following MRM transitions were used: 369.3/147.3 for cholesterol and cholesteryl esters, and 376.3/147.3 for d7-cholesterol and d7-cholesteryl ester. The ionization in the QTrap 6500+ source hydrolyzes cholesterol esters. The mass spectrometer parameters were as follows: electrospray ionization in positive-ion mode, collision gas at 5 units, curtain gas at 40 units, ion source gas 1 at 55 units, ion source gas 2 at 50 units, ion spray voltage at 5500 V, and temperature at 600 °C. The declustering potential was set at 90 eV, entrance potential at 5 eV, collision energy at 35 eV, and collision exit potential at 10 eV.
2.7. LC-MS Measurement of Triglycerides
Plasma triglycerides were analyzed by high-performance liquid chromatography coupled with high-resolution tandem mass spectrometry (HPLC-HR-MS/MS) using a C8 Luna column (2 × 150 mm, 5 μm, Phenomenex, Torrance, CA, USA) with a flow rate of 0.4 mL/min. The mobile phases consisted of solvent A (acetonitrile/water, 9:1 v/v, with 0.1% ammonium acetate) and solvent B (isopropanol/acetonitrile, 7:3 v/v, with 0.1% ammonium acetate). The gradient program was as follows: 35% to 100% solvent B over 0.1 to 10 min, 100% solvent B from 10 to 13 min, followed by a 4 min re-equilibration to initial conditions.
A Q-Exactive hybrid quadrupole-orbitrap mass spectrometer (Thermo Fisher, Waltham, MA, USA) was used in positive ion mode with the following settings: auxiliary gas heater temperature at 250 °C, capillary temperature at 300 °C, sheath gas flow rate at 20 units, auxiliary gas flow rate at 20 units, sweep gas flow rate at 0 units, spray voltage at 4 kV, and S-lens RF level at 60%. Full MS scans were obtained between 500 to 1100 m/z at a resolution of 35,000, and MS/MS data was acquired for the confirmation of triglyceride peaks at a resolution of 17,500.
2.8. Statistical Analysis
All statistical analyses were performed using Prism 10.2.3 (GraphPad, San Diego, CA, USA). Data is expressed as the mean ± SEM. Normality and homoscedasticity of all data distributions were assessed. Data were analyzed by Student’s t-test or linear regression, unless otherwise specified. Differences between groups with p < 0.05 were deemed significant. Data outliers were identified using the ROUT method with a minimum false discovery rate (Q value) of 1%. No exclusion criteria were pre-established.
3. Results
3.1. Effect of the HFD on Weight Gain and Food Consumption
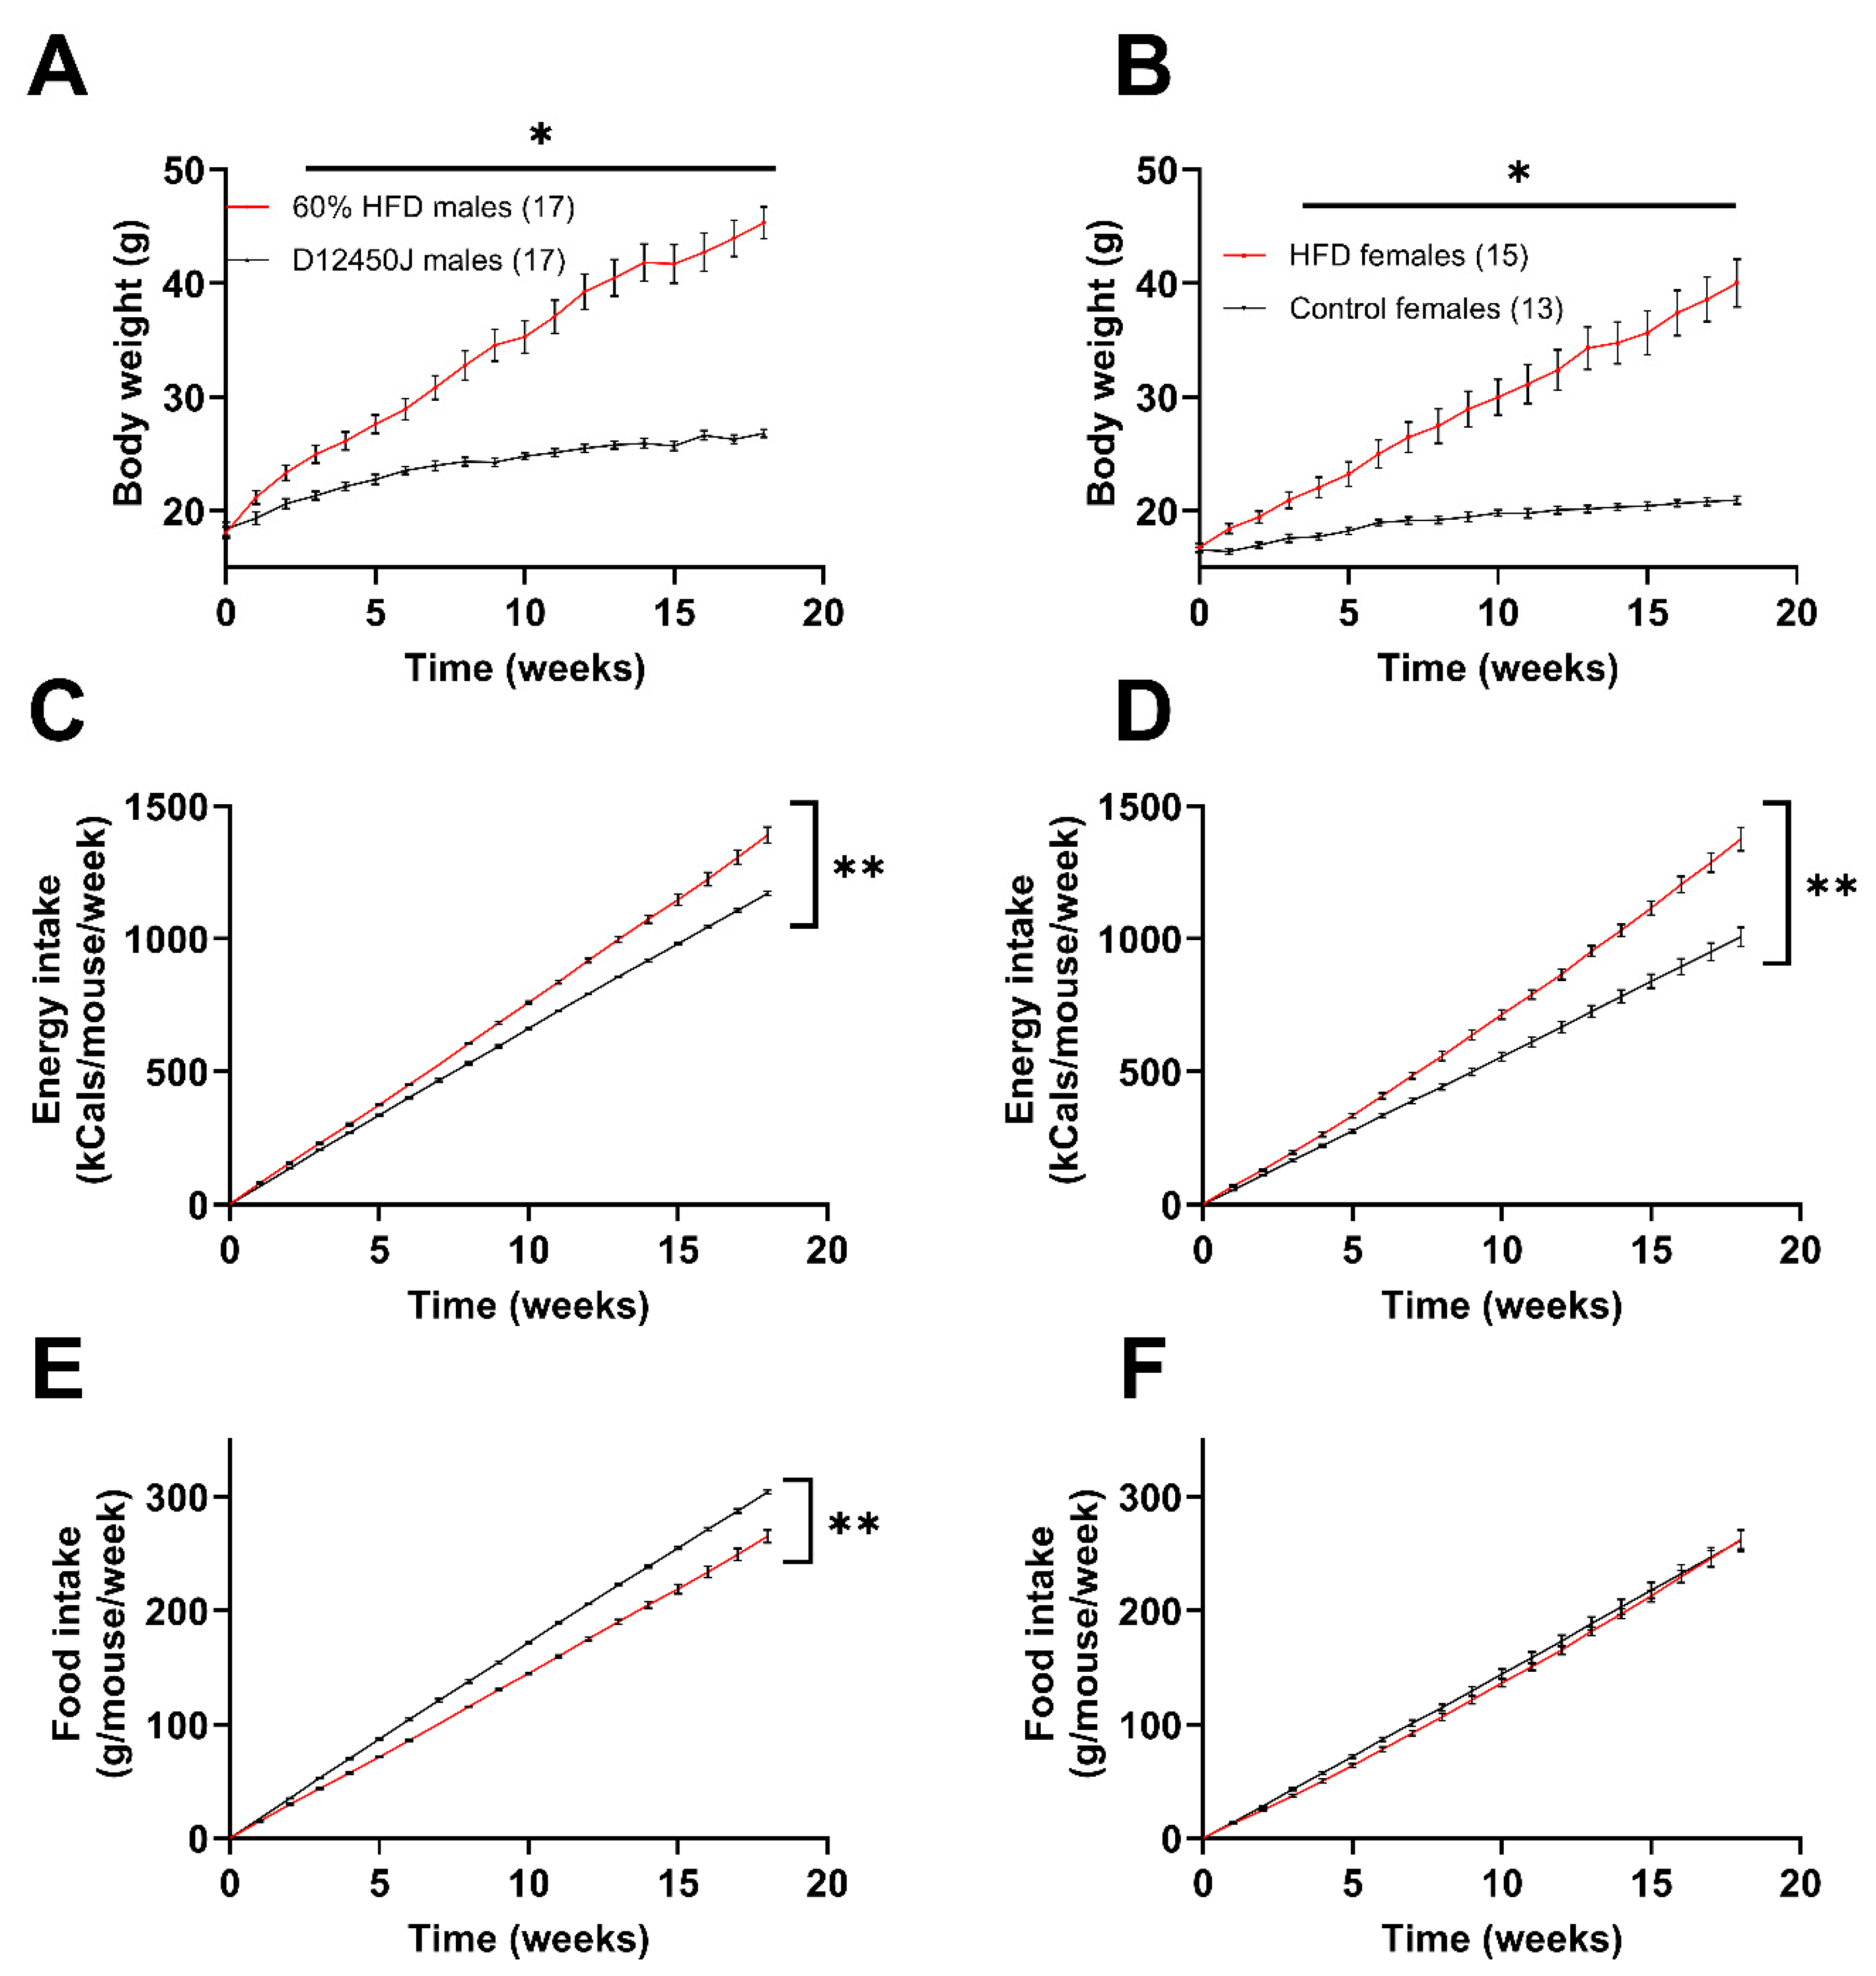
Male mice subjected to the HFD gained weight at a greater rate than the females, as reflected in their attaining an average of 40 grams at week 12 vs. week 18, respectively (Figure 1A,B). Additionally, male mice gained roughly 29.1% of their initial body weight over the first two weeks, while the females only gained 16.1% of their original body weight over the same time frame. Both male and female mice fed the HFD showed greater energy intake compared to the control group (Figure 1C,D). This is evident from the steeper slopes of the cumulative energy intake lines for mice on the HFD, which were significantly greater than those of the control group. Interestingly, male mice exhibited a decrease in their cumulative food intake when fed the high-fat diet (HFD) compared to controls. However, this effect was not observed in females, as they consumed nearly identical amounts of food regardless of the diet (Figure 1E,F).
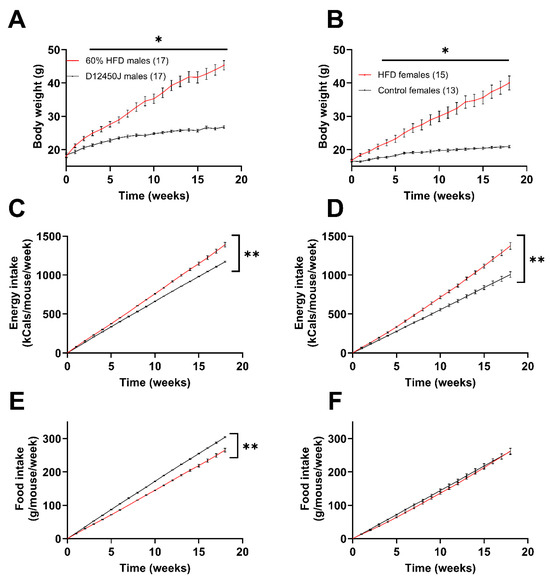
Figure 1.
Impact of diet on weight gain and caloric intake. (A) Male weight gain recorded weekly from the start of the diets. (B) Female weight gain recorded weekly from the start of the diets. (C,D) Amount of total food consumed by male (C) and female (D) mice during the diet, reported as kcals consumed per mouse per week. (E,F) Amount of total food consumed by male (E) and female (F) mice during the diet, reported as grams of food consumed per mouse per week. * p < 0.05, ** p < 0.0001. Number in parenthesis indicates the number of mice in each group.
3.2. Fasting Blood Glucose and Glucose Tolerance
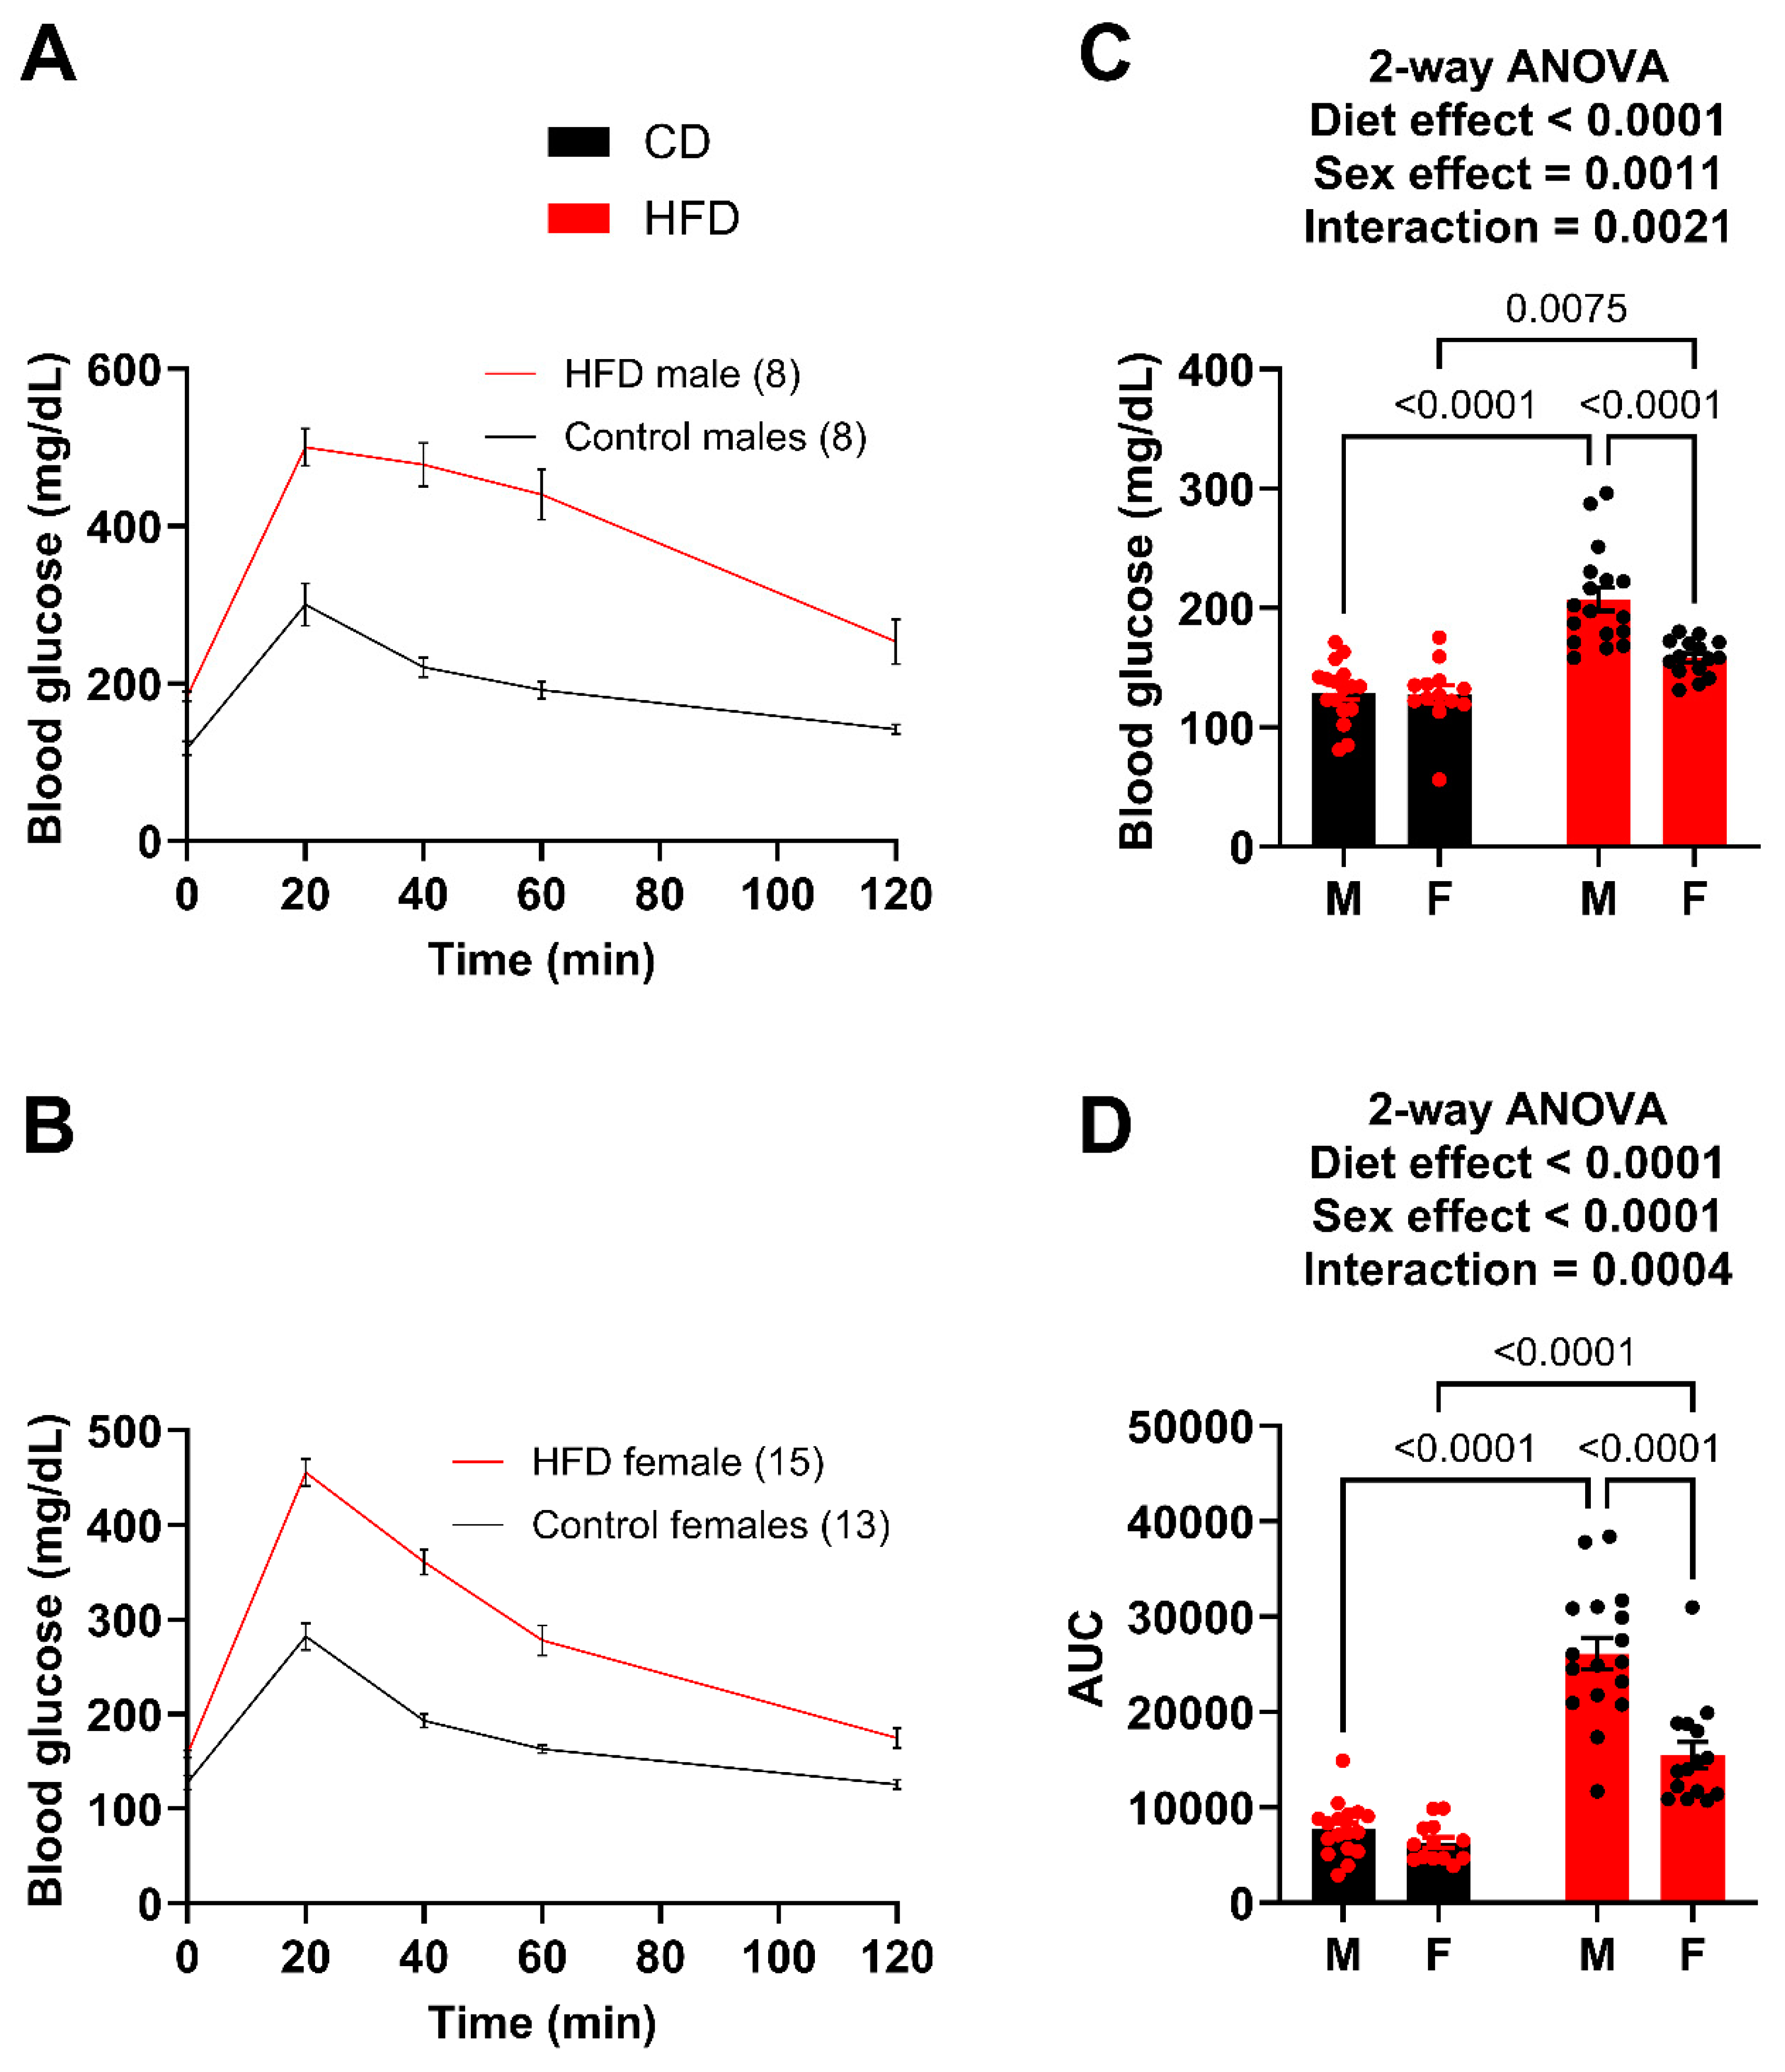
As a reference point, both males and females demonstrated unaltered plasma UA levels at 6 weeks on the diet comparing control versus high fat diet, respectively (males: 0.3278 ± 0.0750 vs. 0.3612 ± 0.0695 mg/dL/females: 0.3860 ± 0.0997 vs. 0.42652 ± 0.0883 mg/dL). However, a glucose tolerance test (GTT) was performed after 10 weeks on the diets (Figure 2A,B). While both male and female HFD mice showed significantly greater fasting blood glucose levels (Figure 2C) and impairment in glucose tolerance, the males had a much greater impairment than the females (Figure 2C). For example, the HFD males had an average glucose level of 318 mg/dL at 2 h post injection whereas the HFD females had almost returned to fasting levels at 175 mg/dL. The degree of difference between the male (26,095.9) and female (15,454.8) AUC also demonstrates this. Using the glucose tolerance test (GTT) as a benchmark, we concluded that females did not exhibit the same level of metabolic dysfunction as males. Therefore, to compare circulating UA levels between male and female mice with similar metabolic dysfunction, we took the following steps: (1) extended the diet for the females, (2) sacrificed a cohort of males at week 12 to collect tissue and plasma to compare to females once they reached a level of metabolic dysfunction similar to what we observed in males fed the HFD for 10 weeks, and (3) continued to monitor a cohort of males to provide an age-matched comparison for the females.
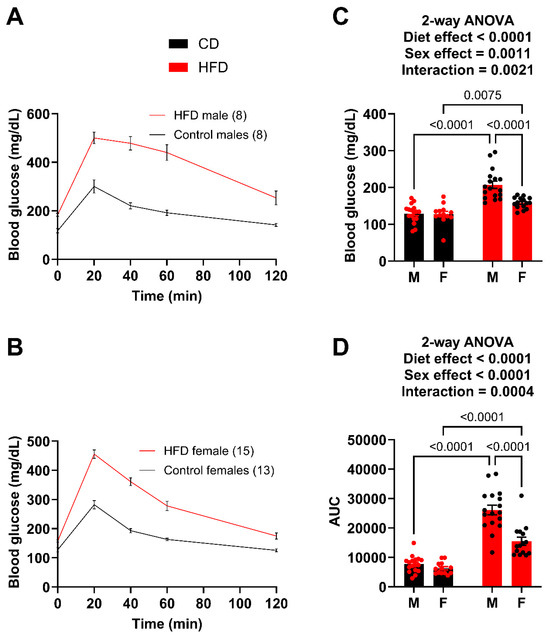
Figure 2.
Males demonstrate greater impairment of glucose tolerance at week 10. (A) GTT curves for male mice fed the HFD and control diet. (B) GTT curves for female mice fed the HFD and control diet. (C) Fasting blood glucose for male and female mice. (D) Area under the curve (AUC) for male and female mice, obtained after subtracting the initial fasting blood glucose value for each mouse. For statistically significant differences, p values are reported. HFD males n = 17, control males n = 17, HFD females n = 15, and control females n = 13.
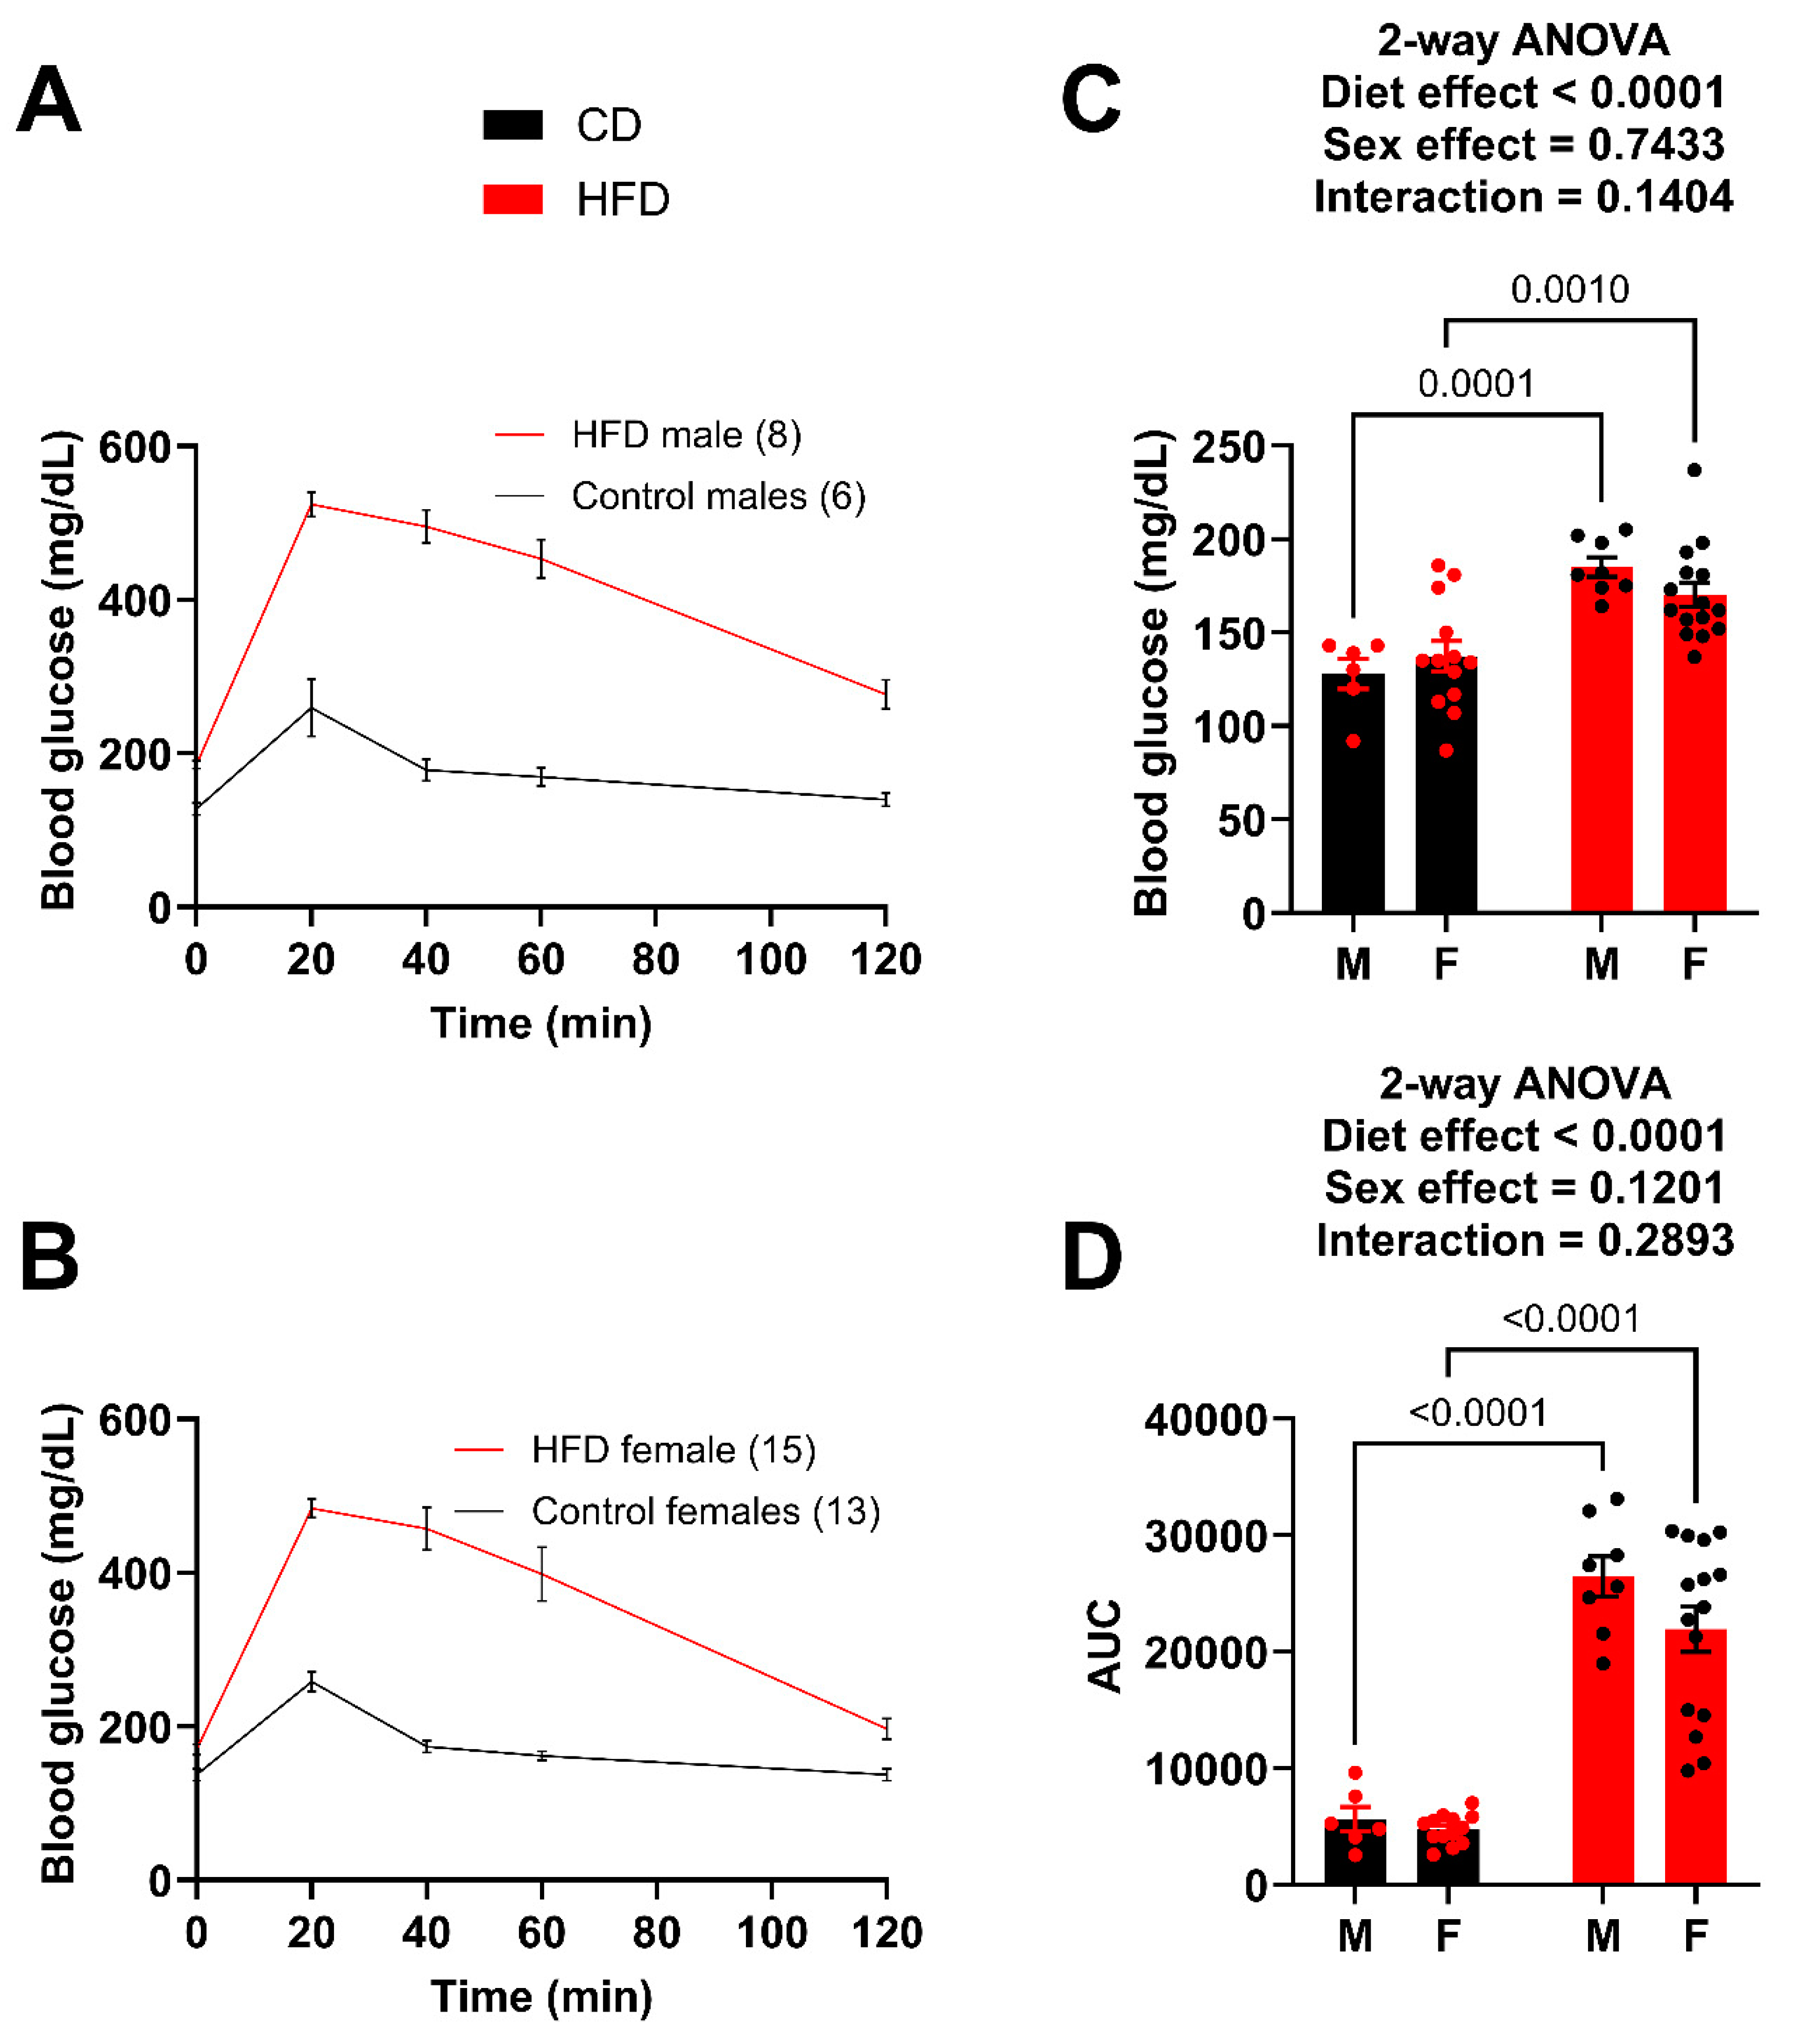
The GTT was repeated after 14 weeks on the diet (Figure 3A,B). Again, both the male and female HFD mice showed significantly greater fasting blood glucose levels (Figure 3C) and greater impairment in glucose tolerance (AUC) (Figure 3D). The male HFD mice demonstrated a greater degree of difference (AUC) compared to the female HFD mice; however, the female HFD mice at week 14 were very similar to the male HFD at week 10. For example, the AUC of the week 10 HFD males was 26,095.9 (Figure 2D) while the AUC for the week 14 females was 21,933.8 (Figure 3D), which is a large increase from 15,454.8 (Figure 2D) just four weeks earlier. A t-test between the week 10 male AUC and the week 14 female AUC resulted in a p-value of 0.1145. It was determined that the goal of matching female metabolic dysfunction to the earlier male time point was achieved.
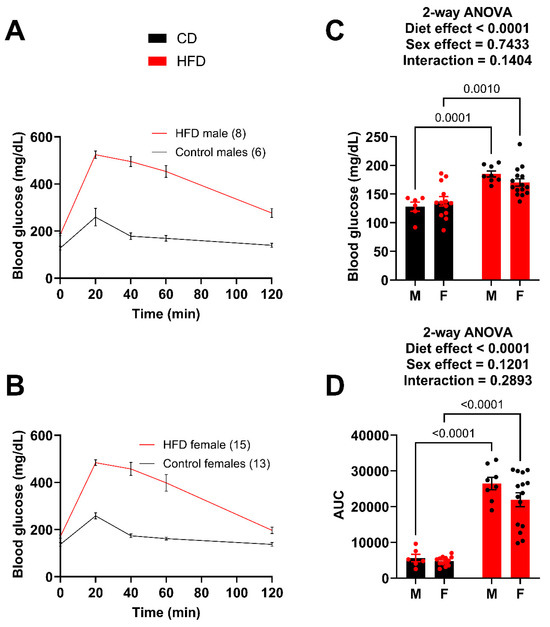
Figure 3.
Male and female mice present with similar impairment in glucose tolerance at week 14. (A) GTT curves for male mice fed the HFD and control diet. (B) GTT curves for female mice fed the HFD and control diet. (C) Fasting blood glucose for male and female mice. (D) Area under the curve (AUC) for male and female mice, obtained after subtracting the initial fasting blood glucose value for each mouse. For statistically significant differences, p values are reported. HFD males n = 8, control males n = 6, HFD females n = 15, and control females n = 13.
3.3. Body Mass Composition and Organ Weights
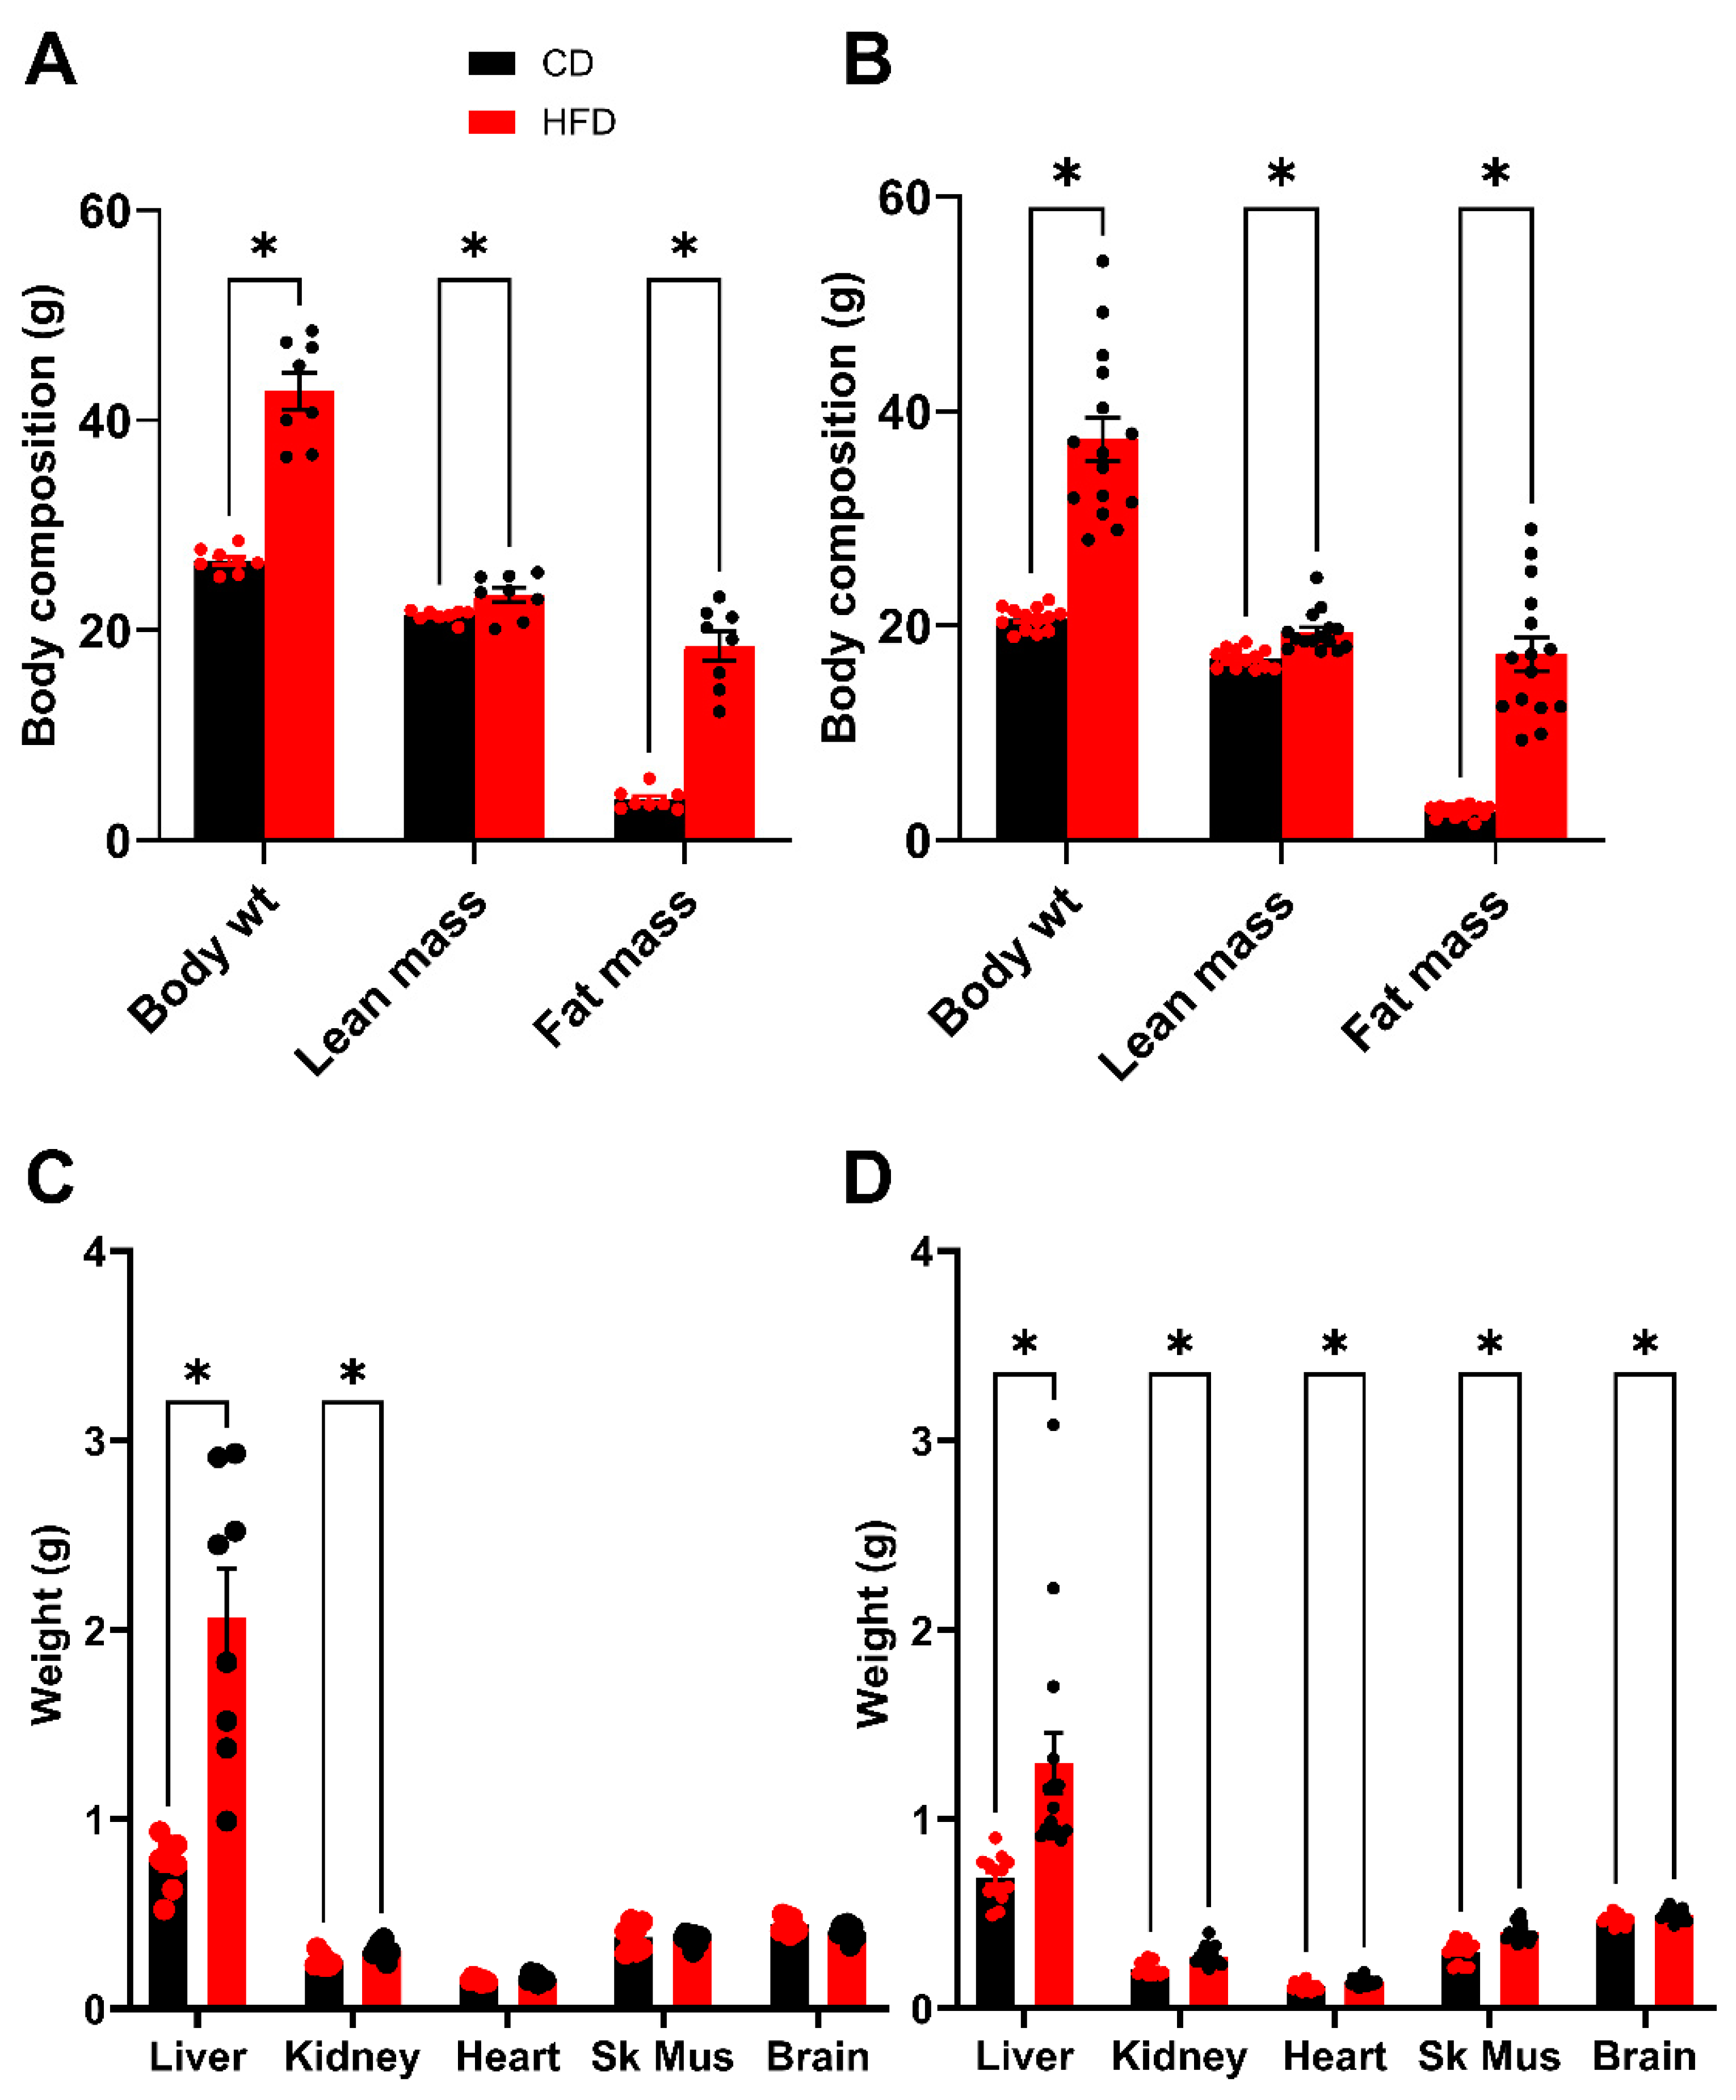
Following 2 weeks of recovery post GTT, an analysis of body composition was performed after 16 weeks on the diet. This timing was chosen to be as close to the glucose tolerance test as possible, while also allowing the mice sufficient time to recover the weight lost during fasting and the stress of the procedure. As expected, both HFD males and females demonstrate a significant elevation in total body weight (BW) which is driven by substantive increases in fat mass (FM) (Figure 4A,B). There is also a small but statistically significant difference in lean mass (LM) between HFD and control groups. Following sacrifice, the organs were dissected, and mean organ weights were plotted (Figure 4C,D). The liver, for both males and females demonstrated the largest increase in mass due to the HFD; however, significant increases in organ weight were also observed for the kidneys in both males and females. In the females, the heart, skeletal muscle and brain also showed significant differences between the HFD and control groups, however, the magnitude of these differences was minimal.
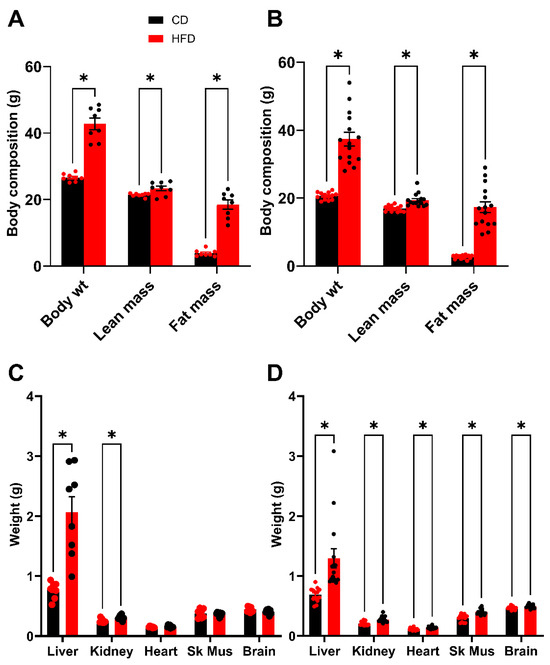
Figure 4.
Body composition analysis (week 16) and terminal organ weights (week 19). (A,B) Total body weight of mice compared to lean mass and fat mass. (A) Male. (B) Female. (C,D) Terminal organ weights after 16 weeks on diets. (C) Male. (D) Female. In males, the fasting terminal body weights were 45.1 ± 1.2 g for mice fed the HFD and 26.0 ± 0.4 g for control mice. In females, the fasting terminal body weights were 39.4 ± 2.1 g for mice fed the HFD and 20.4 ± 0.4 g for control mice. Sk Mus–skeletal muscle. * p < 0.05. For statistically significant differences, p values are reported. * p < 0.05. HFD males n = 8, control males n = 8, HFD females n = 15, and control females n = 13.
3.4. Cholesterol and Triglycerides
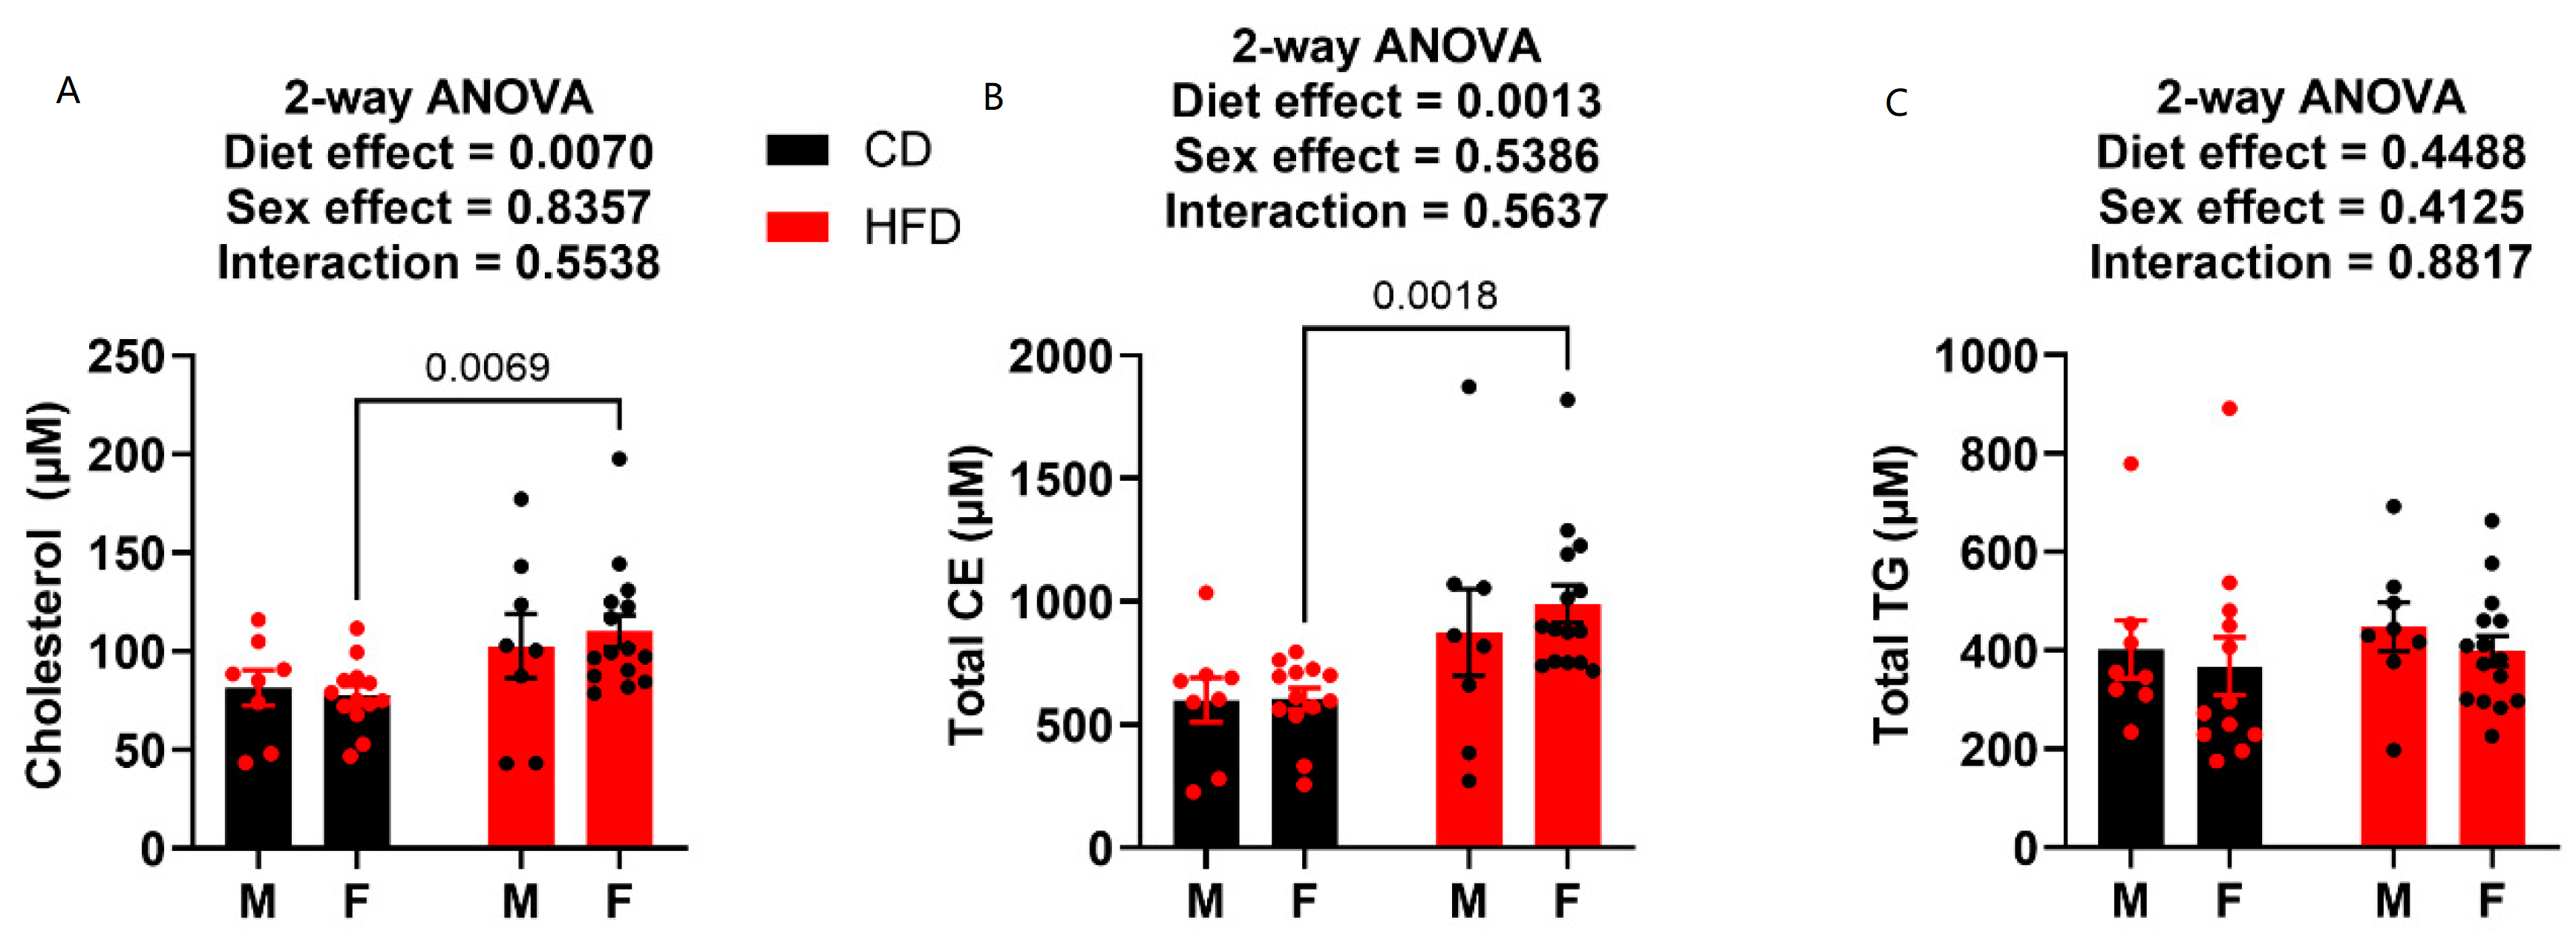
Terminal plasma was also analyzed for metabolic endpoints cholesterol, cholesteryl esters (CEs), and triglycerides (TGs). HFD males did not prove to have any elevation in cholesterol or CEs compared to the control diet-fed males (Figure 5A,B). Conversely, the females on HFD showed elevation in both total circulating cholesterol (Figure 5A) and total circulating CE (Figure 5B). Neither diet nor sex played a role on circulating TG levels, as there was no statistical difference in any of the groups (Figure 5C).
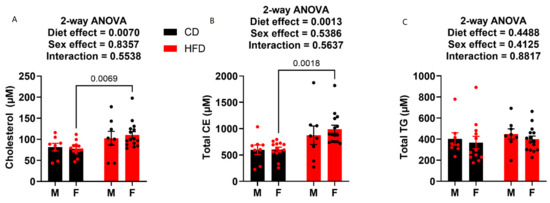
Figure 5.
Plasma cholesterol, cholesteryl ester and triglyceride levels at week 19. (A) Plasma cholesterol content. (B) Plasma cholesteryl ester content. (C) Plasma triglyceride content. HFD males n = 8, control males n = 8, HFD females n = 15, and control females n = 13.
3.5. XO Activity and UA Levels
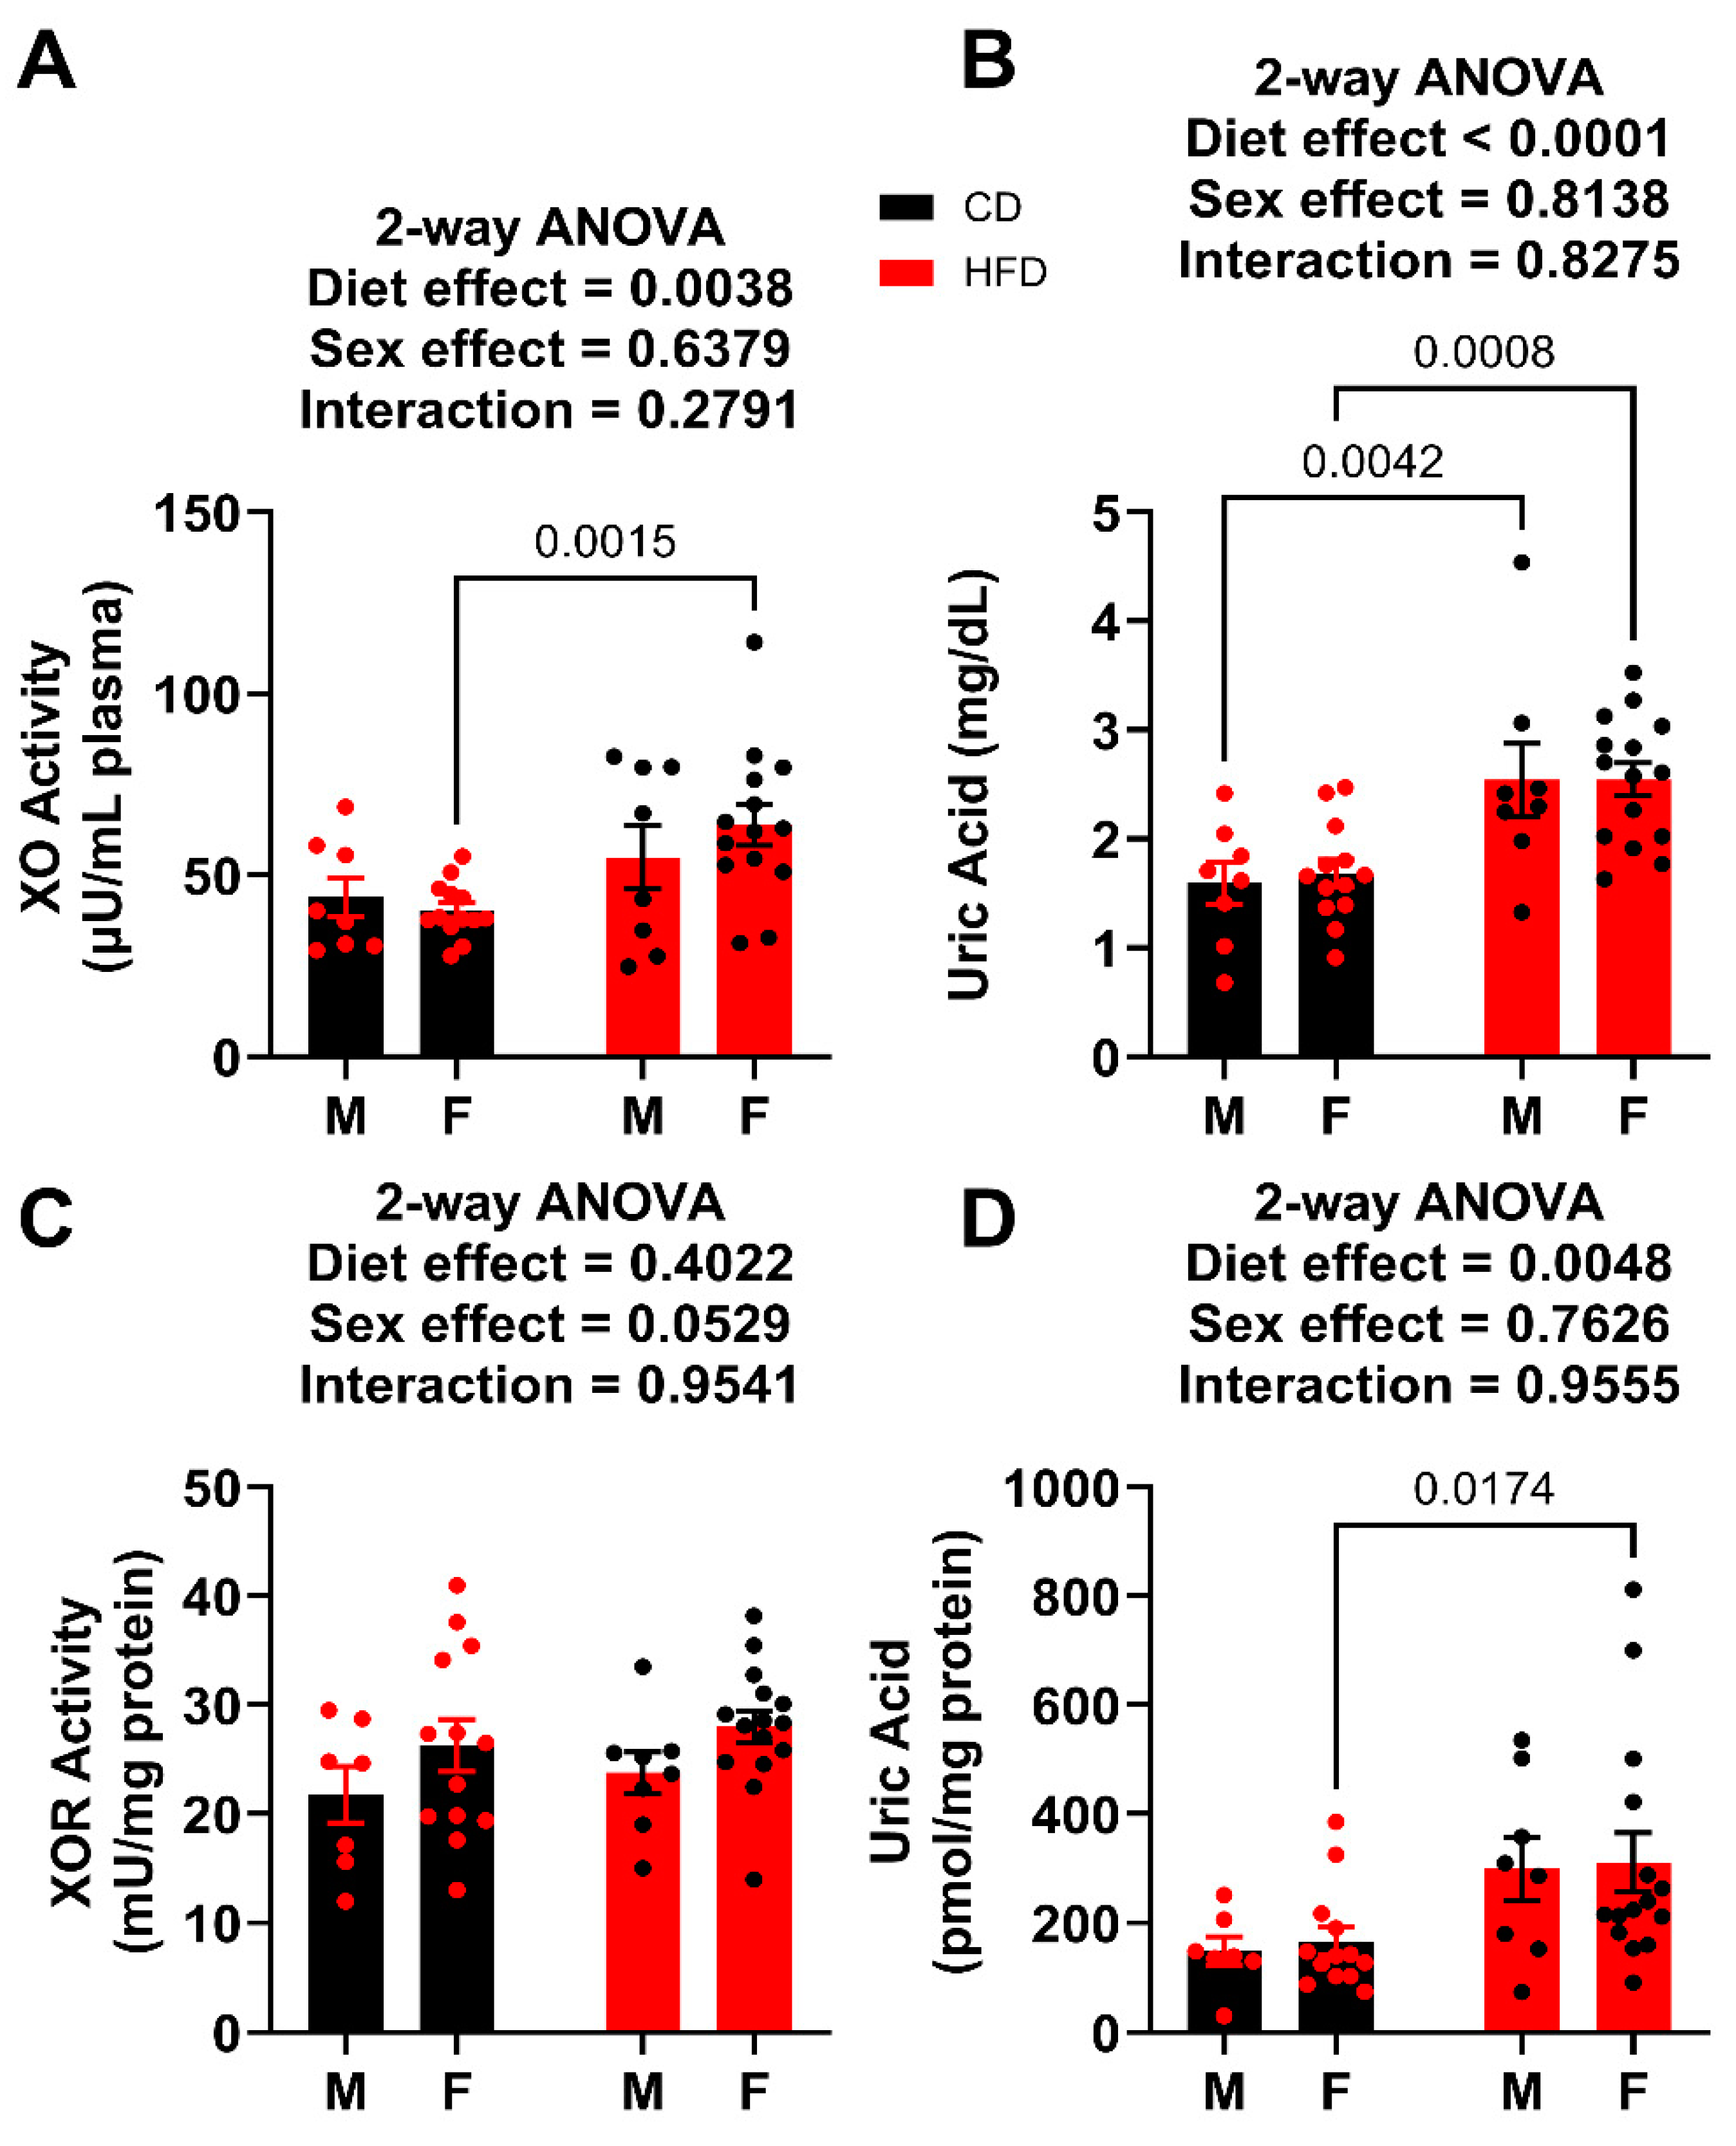
Terminal plasma was analyzed for both XO activity and UA concentration. For the males, the circulating XO activity was not affected by HFD, whereas the HFD did significantly elevate UA levels (Figure 6A,B). In the females, both XO activity and UA levels were elevated in HFD when compared to the control. Importantly, these values can be compared to the males terminated after 12 weeks on the diet, which had plasma UA levels of 3.74 ± 0.45 mg/dL for HFD and 1.89 ± 0.35 mg/dL for controls, which is congruent with what has been reported previously [9,18,19,20]. In the liver, total XOR (XDH + XO) activity for both males and females were not affected by the HFD, whereas the liver UA abundance was significantly elevated in only females (Figure 6C,D).
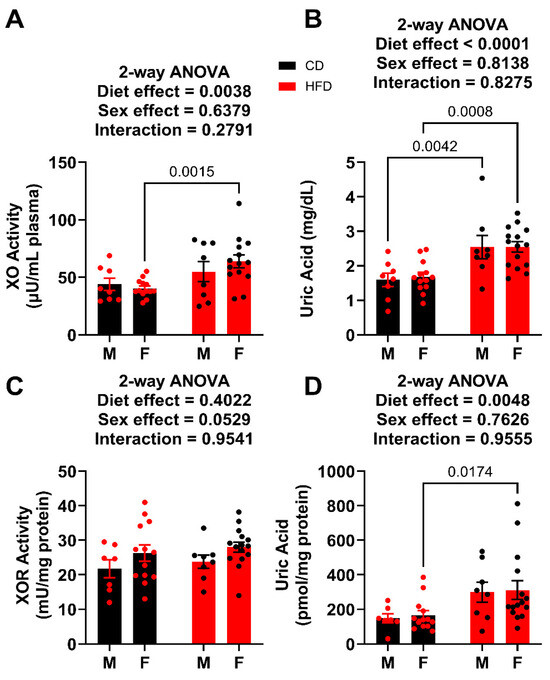
Figure 6.
XO activity and UA levels week 19. (A) Plasma XO activity. (B) Plasma UA levels. (C) Liver XOR activity. (D) Liver UA levels. For statistically significant differences, p values are reported. HFD males n = 8, control males n = 8, HFD females n = 15, and control females n = 13.
4. Discussion
The field of diet-induced obesity suffers from nearly exclusive use of male mice or rats; thus, information regarding female DIO responses is limited. The impact of this shortcoming in the field is especially prevalent when assessing UA levels in the circulation and tissues of female mice. The importance of assessing the impact of DIO on circulating UA content in preclinical models such as rodents (e.g., mice) is crucially important for the following reasons: (1) uric acid levels correlate positively with human obesity [5,21,22], as well as male rodent obesity [23,24]; (2) elevated UA has been reported to be tightly associated with obesity as well as its downstream metabolic and cardiovascular/renal consequences [25,26,27,28]; (3) elevated levels of UA have been reported to be pro-inflammatory and thus causative of the metabolic consequences of obesity [29,30]; and (4) there is great potential for modulating UA via off-label application of currently-approved pharmacologic agents (e.g., allopurinol, febuxostat, etc.), thus preventing or alleviating the metabolic dysfunction allied to clinical obesity. As such, understanding the impact of obesity on UA levels in preclinical models of both sexes is crucial to successfully addressing key experimental questions to move the field forward.
We previously reported that female mice (C57BL/6J) fed a high fat diet (60%) for 32 weeks did not demonstrate significant elevation in circulating UA levels [14]; however, this study suffered from the absence of a side-by-side male comparison cohort and utilized standard vivarium chow, containing 18% of calories derived from fat, as the control diet. When taken together, these limitations incentivized the pursuit of the study described herein, whereby we studied the impact of the 60% HFD on male and female and compared it to control mice being fed a matched, purified control diet containing 10% calories derived from fat.
When subjected to the 60% HFD, male mice gained weight at a faster rate than the female mice, as expected, (Figure 1). For example, males achieved significance from controls a week earlier than females, reaching an average of 40 g by week 12 on the diet. Females required 18 weeks on the HFD to reach the mean weight of 40 g. However, by the end of the study, the HFD male mice had gained an average of only 4 more grams than the HFD female mice. Feeding male mice the HFD resulted in a suppression of food intake [31,32], despite an overall greater calorie intake due to the greater energy density (5.24 kcals/g for the HFD vs. 3.85 kcals/g for the control diet) of the HFD (Figure 1). Conversely, the female mice fed the HFD did not demonstrate differences in grams of food consumed, exacerbating the energy intake, compared to control mice. It is important to note that conclusions regarding food consumption herein need to be tempered by the fact that each replicate is identified as a cage rather than a single mouse, meaning the n-values range from 3–4 for each group.
For this study, we utilized impairment in glucose tolerance as a benchmark for metabolic dysfunction. As it is established that female mice respond to diet-induced obesity at a slower rate than males, we aimed to assess and compare females to males both at an early time point as well as in a time frame whereby they present with similar metabolic dysfunction (e.g., an extended time on the diet for females where they present a similar GTT profile to the males). Therefore, the male data from the first GTT (week 10, Figure 2) provided the benchmark of glucose intolerance to determine when the female mice were deemed to be at metabolic dysfunction. While the HFD females at 10 weeks (Figure 2D) already showed an elevated fasting blood glucose and a strongly significant increase in AUC for the GTT compared to the age-matched females on the control diet, it was only ~60% of the AUC of the males. Following only 4 additional weeks on the diet, the GTT was repeated, (Figure 3). Based on analysis of AUC, there was no statistical difference between males and females. As such, we deemed the females who met the threshold of impaired glucose tolerance to be considered similar to the males. We let the mice recover from the GTT for 2 weeks and performed a body mass composition analysis before proceeding to sacrifice and tissue harvest for terminal endpoint comparisons.
Results from the echo-MRI demonstrated that fat accumulation was the principal difference in weight gain between the HFD and control mice for both males (Figure 4A) and females (Figure 4B). While there was a statistically significant greater lean mass for both males and females, it was slight in magnitude and thus of questionable biological relevance. For example, this increase in lean mass in the HFD groups could be caused by compensation for carrying the added weight resulting from the fat accretion. As expected, liver weights revealed that HFD mice (male and female, Figure 4C,D) had much greater mass compared to the controls, with the male HFD liver being twice the mass of the male control. Although we did not pursue examination of liver damage parameters, the hepatic response to HFD in both males and females resembled the classic fat deposition and development of non-alcoholic fatty liver disease (NAFLD) and there was trending elevation in circulating cholesterol and cholesterol esters in male mice and a statistically significant elevation of these parameters in the female mice, (Figure 5). This lack of difference found in circulating triglyceride levels has been previously reported in mice whereas this is what would be expected in the clinic [33,34].
Examination of the plasma taken during sacrifice (19 weeks) revealed no significant difference in XO activity between males, regardless of the diet. Conversely, the HFD males demonstrated significantly elevated UA levels compared to the age-matched male controls (Figure 6). This was consistent with what we previously reported [35,36]. The female HFD mice showed both elevated plasma XO activity and UA concentration compared to females on the control diet. While humans have normal UA ranging from 3.5 to 7.2 mg/dL for males and post-menopausal women, and 2.6–6.0 mg/dL for premenopausal women [37], mice are reported to have a normal circulating UA concentration range of 0.5–2.0 mg/dL [38]. Given this range, the mice on the control diets for both male and female would be within the normal levels, while the male and female HFD mice could be considered hyperuricemic. This observation is important as it, for the first time, demonstrates that diet-induced, obese female mice with similar metabolic dysfunction to age-matched, diet-induced obese males, are hyperuricemic.
Examination of liver XOR activity revealed no significant differences between HFD and controls, regardless of sex (Figure 6). As such, it could be expected that there would be no difference in liver UA levels; however, this was not the case as both male and female HFD mice demonstrated significant elevation (~2-fold) in UA content (UA/mg protein) when compared to their respective controls. This difference in UA levels, without any difference in XOR activity may be the result of changes to cellular clearance of UA [39]. If UA clearance (e.g., UA efflux transporters) or catabolism (e.g., uricase) is diminished, then UA could be elevated within the cells in the absence of alteration in UA production by XOR. This observation is important to the continued exploration of causation versus correlation regarding UA and the metabolic consequences of obesity, as it has been reported that intracellular hyperuricemia can be responsible for fat accumulation within the liver via ROS/JNK/AP-1 signaling [40]. Further studies are required to elucidate the mechanism(s) linking HFD to intracellular hyperuricemia and NAFLD/metabolic syndrome.
While we have shown that female mice respond to obesogenic feeding with elevated circulating UA, there are several limitations to our study. For example, we did not assess differences in expression or activity of urate oxidase between the sexes or within a sex and thus between lean and obese cohorts. This is important as urate oxidase catabolizes UA to allantoin and thus is a point of control for UA levels. In the same light, we did not assess UA or allantoin excretion or sex differences in this process (e.g., UA transporter expression and/or activity). This too, is another important point of control for circulating UA levels. In addition, we did not address the impact of sex hormones (e.g., estrogen) on UA production (e.g., hepatic XOR expression/activity) or UA transporters. This is important as we have previously reported that the hepatocyte XOR activity is a central driver in determining plasma UA content [36] and can be impacted by circadian rhythm [41]. Again, this is another critical point of regulation for circulating UA content. The limitations identified above make it clear that UA levels are carefully orchestrated via multiple points of control and a comprehensive understanding of UA homeostasis, or alteration (e.g., obesity) thereof, requires detailed accounting of all these factors. What we have accomplished herein is the first step that establishes a difference between controlled experimental groups and thus future study will be directed to identify the contributions from each of the pathways defined above.
In summary, we revealed, for the first time, that diet-induced, obese female mice with similar metabolic dysfunction to age-matched, diet-induced obese males, are hyperuricemic. This observation is of importance to the progression of the field, as exploration of the linkages between UA and the metabolic consequences of obesity are being examined and conclusions are being made that could be projected to clinical applications and must consider the impact on both males and females.
Author Contributions
Conceptualization, R.L. and E.E.K.; methodology, S.R.S., S.E.L., F.J.S., R.L. and E.E.K.; validation, R.L. and E.E.K.; formal analysis, A.P.G., S.R.S., S.E.L., M.R.G., M.F., F.J.S. and R.L.; investigation, A.P.G., S.E.L., R.L. and E.E.K.; resources, F.J.S. and R.L.; data curation, A.P.G., S.R.S., B.A.M., M.F., R.L. and E.E.K.; writing—original draft preparation, S.R.S., R.L. and E.E.K.; writing—review and editing, A.P.G., M.R.G., R.L. and E.E.K.; visualization, R.L. and E.E.K.; supervision, R.L. and E.E.K.; project administration, R.L. and E.E.K.; funding acquisition, E.E.K. All authors have read and agreed to the published version of the manuscript.
Funding
Research reported in this publication was supported by the National Institutes of Health under Award Number R01 DK124510-01 and R01 HL153532-01A1 (EEK), R35 GM119528 (RL), R01HL162787 (MF), R01GM125944 (FJS). In addition, support was also provided via the WVU Office of Research and Graduate Education Synergy Grant (EEK and RL).
Institutional Review Board Statement
All animal studies were conducted under the approval of the West Virginia University Institutional Animal Care and Use Committee (protocol# 1604002026, date: 5 October 2022).
Data Availability Statement
The original contributions presented in the study are included in the article, further inquiries can be directed to the corresponding authors.
Conflicts of Interest
F.J.S. and M.F. acknowledge financial interest in Creegh Pharmaceuticals, Inc. F.J.S. has financial interest in Furanica Inc.
Correction Statement
This article has been republished with a minor correction of the information included in the Institutional Review Board Statement. This change does not affect the scientific content of the article.
Abbreviations
HFD (high fat diet); GTT (glucose tolerance test); TG (triglycerides); UA (uric acid); XDH (xanthine dehydrogenase); XO (xanthine oxidase); XOR (xanthine oxidoreductase).
References
- Hall, K.D. Did the Food Environment Cause the Obesity Epidemic? Obesity 2018, 26, 11–13. [Google Scholar] [CrossRef] [PubMed]
- Reuter, T. Diet-induced models for obesity and type 2 diabetes. Drug Discov. Today Dis. Models 2007, 4, 3–8. [Google Scholar] [CrossRef]
- Lasker, S.; Rahman, M.M.; Parvez, F.; Zamila, M.; Miah, P.; Nahar, K.; Kabir, F.; Sharmin, S.B.; Subhan, N.; Ahsan, G.U.; et al. High-fat diet-induced metabolic syndrome and oxidative stress in obese rats are ameliorated by yogurt supplementation. Sci. Rep. 2019, 9, 20026. [Google Scholar] [CrossRef] [PubMed]
- Li, F.; Chen, S.; Qiu, X.; Wu, J.; Tan, M.; Wang, M. Serum Uric Acid Levels and Metabolic Indices in an Obese Population: A Cross-Sectional Study. Diabetes Metab. Syndr. Obes. 2021, 14, 627–635. [Google Scholar] [CrossRef] [PubMed]
- Li, S.; Feng, L.; Sun, X.; Ding, J.; Zhou, W. Association between serum uric acid and measures of adiposity in Chinese adults: A cross-sectional study. BMJ Open 2023, 13, e072317. [Google Scholar] [CrossRef] [PubMed]
- Konda, P.Y.; Poondla, V.; Jaiswal, K.K.; Dasari, S.; Uyyala, R.; Surtineni, V.P.; Egi, J.Y.; Masilamani, A.J.A.; Bestha, L.; Konanki, S.; et al. Pathophysiology of high fat diet induced obesity: Impact of probiotic banana juice on obesity associated complications and hepatosteatosis. Sci. Rep. 2020, 10, 16894. [Google Scholar] [CrossRef]
- Nakagawa, T.; Hu, H.; Zharikov, S.; Tuttle, K.R.; Short, R.A.; Glushakova, O.; Ouyang, X.; Feig, D.I.; Block, E.R.; Herrera-Acosta, J.; et al. A causal role for uric acid in fructose-induced metabolic syndrome. Am. J. Physiol. Ren. Physiol. 2006, 290, F625–F631. [Google Scholar] [CrossRef]
- Sánchez-Lozada, L.G.; Tapia, E.; Bautista-García, P.; Soto, V.; Avila-Casado, C.; Vega-Campos, I.P.; Nakagawa, T.; Zhao, L.; Franco, M.; Johnson, R.J. Effects of febuxostat on metabolic and renal alterations in rats with fructose-induced metabolic syndrome. Am. J. Physiol. Ren. Physiol. 2008, 294, F710–F718. [Google Scholar] [CrossRef]
- Nishikawa, T.; Nagata, N.; Shimakami, T.; Shirakura, T.; Matsui, C.; Ni, Y.; Zhuge, F.; Xu, L.; Chen, G.; Nagashimada, M.; et al. Xanthine oxidase inhibition attenuates insulin resistance and diet-induced steatohepatitis in mice. Sci. Rep. 2020, 10, 815. [Google Scholar] [CrossRef]
- Zhang, Q.; Ma, X.; Xing, J.; Shi, H.; Yang, R.; Jiao, Y.; Chen, S.; Wu, S.; Zhang, S.; Sun, X. Serum Uric Acid Is a Mediator of the Association Between Obesity and Incident Nonalcoholic Fatty Liver Disease: A Prospective Cohort Study. Front. Endocrinol. 2021, 12, 657856. [Google Scholar] [CrossRef]
- Nakatsu, Y.; Seno, Y.; Kushiyama, A.; Sakoda, H.; Fujishiro, M.; Katasako, A.; Mori, K.; Matsunaga, Y.; Fukushima, T.; Kanaoka, R.; et al. The xanthine oxidase inhibitor febuxostat suppresses development of nonalcoholic steatohepatitis in a rodent model. Am. J. Physiol. Gastrointest. Liver Physiol. 2015, 309, G42–G51. [Google Scholar] [CrossRef] [PubMed]
- Wan, X.; Xu, C.; Lin, Y.; Lu, C.; Li, D.; Sang, J.; He, H.; Liu, X.; Li, Y.; Yu, C. Uric acid regulates hepatic steatosis and insulin resistance through the NLRP3 inflammasome-dependent mechanism. J. Hepatol. 2016, 64, 925–932. [Google Scholar] [CrossRef]
- Xu, C.; Wan, X.; Xu, L.; Weng, H.; Yan, M.; Miao, M.; Sun, Y.; Xu, G.; Dooley, S.; Li, Y.; et al. Xanthine oxidase in non-alcoholic fatty liver disease and hyperuricemia: One stone hits two birds. J. Hepatol. 2015, 62, 1412–1419. [Google Scholar] [CrossRef] [PubMed]
- Lewis, S.E.; Li, L.; Fazzari, M.; Salvatore, S.R.; Li, J.; Hileman, E.A.; Maxwell, B.A.; Schopfer, F.J.; Arteel, G.E.; Khoo, N.K.H.; et al. Obese female mice do not exhibit overt hyperuricemia despite hepatic steatosis and impaired glucose tolerance. Adv. Redox Res. 2022, 6, 100051. [Google Scholar] [CrossRef]
- Tam, H.K.; Kelly, A.S.; Fox, C.K.; Nathan, B.M.; Johnson, L.A. Weight Loss Mediated Reduction in Xanthine Oxidase Activity and Uric Acid Clearance in Adolescents with Severe Obesity. Child. Obes. 2016, 12, 286–291. [Google Scholar] [CrossRef] [PubMed]
- Scheepers, L.E.; Boonen, A.; Pijnenburg, W.; Bierau, J.; Staessen, J.A.; Stehouwer, C.D.; Thijs, C.; Arts, I.C. Associations of plasma uric acid and purine metabolites with blood pressure in children: The KOALA Birth Cohort Study. J. Hypertens. 2017, 35, 982–993. [Google Scholar] [CrossRef]
- Lewis, S.E.; Rosencrance, C.B.; De Vallance, E.; Giromini, A.; Williams, X.M.; Oh, J.Y.; Schmidt, H.; Straub, A.C.; Chantler, P.D.; Patel, R.P.; et al. Human and rodent red blood cells do not demonstrate xanthine oxidase activity or XO-catalyzed nitrite reduction to NO. Free Radic. Biol. Med. 2021, 174, 84–88. [Google Scholar] [CrossRef]
- Purnamasari, D.; Umpuan, A.R.M.; Tricaesario, C.; Wisnu, W.; Tarigan, T.J.E.; Tahapary, D.L.; Muhadi, M. The role of high fat diet on serum uric acid level among healthy male first degree relatives of type 2 diabetes mellitus. Sci. Rep. 2023, 13, 17586. [Google Scholar] [CrossRef] [PubMed]
- Seifi, N.; Nosrati, M.; Koochackpoor, G.; Aghasizadeh, M.; Bahari, H.; Namdar, H.B.; Afkhami, N.; Darban, R.A.; Azarian, F.; Ferns, G.A.; et al. The association between hyperuricemia and insulin resistance surrogates, dietary- and lifestyle insulin resistance indices in an Iranian population: MASHAD cohort study. Nutr. J. 2024, 23, 5. [Google Scholar] [CrossRef]
- Lin, Z.J.; Zhang, B.; Liu, X.Q.; Yang, H.L. Abdominal fat accumulation with hyperuricemia and hypercholesterolemia quail model induced by high fat diet. Chin. Med. Sci. J. 2009, 24, 191–194. [Google Scholar] [CrossRef]
- Yoo, H.G.; Lee, S.I.; Chae, H.J.; Park, S.J.; Lee, Y.C.; Yoo, W.H. Prevalence of insulin resistance and metabolic syndrome in patients with gouty arthritis. Rheumatol. Int. 2011, 31, 485–491. [Google Scholar] [CrossRef] [PubMed]
- Chang, J.B.; Chen, Y.L.; Hung, Y.J.; Hsieh, C.H.; Lee, C.H.; Pei, D.; Lin, J.D.; Wu, C.Z.; Liang, Y.J.; Lin, C.M. The Role of Uric Acid for Predicting Future Metabolic Syndrome and Type 2 Diabetes in Older People. J. Nutr. Health Aging 2017, 21, 329–335. [Google Scholar] [CrossRef]
- Tsushima, Y.; Nishizawa, H.; Tochino, Y.; Nakatsuji, H.; Sekimoto, R.; Nagao, H.; Shirakura, T.; Kato, K.; Imaizumi, K.; Takahashi, H.; et al. Uric acid secretion from adipose tissue and its increase in obesity. J. Biol. Chem. 2013, 288, 27138–27149. [Google Scholar] [CrossRef]
- DeBosch, B.J.; Kluth, O.; Fujiwara, H.; Schürmann, A.; Moley, K. Early-onset metabolic syndrome in mice lacking the intestinal uric acid transporter SLC2A9. Nat. Commun. 2014, 5, 4642. [Google Scholar] [CrossRef]
- Jia, G.; Habibi, J.; Bostick, B.P.; Ma, L.; DeMarco, V.G.; Aroor, A.R.; Hayden, M.R.; Whaley-Connell, A.T.; Sowers, J.R. Uric acid promotes left ventricular diastolic dysfunction in mice fed a Western diet. Hypertension 2015, 65, 531–539. [Google Scholar] [CrossRef]
- Kanbay, M.; Jensen, T.; Solak, Y.; Le, M.; Roncal-Jimenez, C.; Rivard, C.; Lanaspa, M.A.; Nakagawa, T.; Johnson, R.J. Uric acid in metabolic syndrome: From an innocent bystander to a central player. Eur. J. Intern. Med. 2016, 29, 3–8. [Google Scholar] [CrossRef] [PubMed]
- Raya-Cano, E.; Vaquero-Abellán, M.; Molina-Luque, R.; De Pedro-Jiménez, D.; Molina-Recio, G.; Romero-Saldaña, M. Association between metabolic syndrome and uric acid: A systematic review and meta-analysis. Sci. Rep. 2022, 12, 18412. [Google Scholar] [CrossRef]
- Ebrahimpour, P.; Fakhrzadeh, H.; Heshmat, R.; Bandarian, F.; Larijani, B. Serum uric acid levels and risk of metabolic syndrome in healthy adults. Endocr. Pract. 2008, 14, 298–304. [Google Scholar] [CrossRef] [PubMed]
- Pirola, L.; Ferraz, J.C. Role of pro- and anti-inflammatory phenomena in the physiopathology of type 2 diabetes and obesity. World J. Biol. Chem. 2017, 8, 120. [Google Scholar] [CrossRef]
- Perlstein, T.S.; Gumieniak, O.; Hopkins, P.N.; Murphey, L.J.; Brown, N.J.; Williams, G.H.; Hollenberg, N.K.; Fisher, N.D. Uric acid and the state of the intrarenal renin-angiotensin system in humans. Kidney Int. 2004, 66, 1465–1470. [Google Scholar] [CrossRef]
- Altherr, E.; Rainwater, A.; Kaviani, D.; Tang, Q.; Güler, A.D. Long-term high fat diet consumption reversibly alters feeding behavior via a dopamine-associated mechanism in mice. Behav. Brain Res. 2021, 414, 113470. [Google Scholar] [CrossRef]
- Huang, K.P.; Ronveaux, C.C.; Knotts, T.A.; Rutkowsky, J.R.; Ramsey, J.J.; Raybould, H.E. Sex differences in response to short-term high fat diet in mice. Physiol. Behav. 2020, 221, 112894. [Google Scholar] [CrossRef] [PubMed]
- Spitler, K.M.; Shetty, S.K.; Cushing, E.M.; Sylvers-Davie, K.L.; Davies, B.S.J. Chronic high-fat feeding and prolonged fasting in liver-specific ANGPTL4 knockout mice. Am. J. Physiol. Endocrinol. Metab. 2021, 321, E464–E478. [Google Scholar] [CrossRef]
- Gao, S.; He, L.; Ding, Y.; Liu, G. Mechanisms underlying different responses of plasma triglyceride to high-fat diets in hamsters and mice: Roles of hepatic MTP and triglyceride secretion. Biochem. Biophys. Res. Commun. 2010, 398, 619–626. [Google Scholar] [CrossRef]
- Kelley, E.E.; Baust, J.; Bonacci, G.; Golin-Bisello, F.; Devlin, J.E.; St Croix, C.M.; Watkins, S.C.; Gor, S.; Cantu-Medellin, N.; Weidert, E.R.; et al. Fatty acid nitroalkenes ameliorate glucose intolerance and pulmonary hypertension in high-fat diet-induced obesity. Cardiovasc. Res. 2014, 101, 352–363. [Google Scholar] [CrossRef] [PubMed]
- Harmon, D.B.; Mandler, W.K.; Sipula, I.J.; Dedousis, N.; Lewis, S.E.; Eckels, J.T.; Du, J.; Wang, Y.; Huckestein, B.R.; Pagano, P.J.; et al. Hepatocyte-Specific Ablation or Whole-Body Inhibition of Xanthine Oxidoreductase in Mice Corrects Obesity-Induced Systemic Hyperuricemia Without Improving Metabolic Abnormalities. Diabetes 2019, 68, 1221–1229. [Google Scholar] [CrossRef]
- Desideri, G.; Castaldo, G.; Lombardi, A.; Mussap, M.; Testa, A.; Pontremoli, R.; Punzi, L.; Borghi, C. Is it time to revise the normal range of serum uric acid levels? Eur. Rev. Med. Pharmacol. Sci. 2014, 18, 1295–1306. [Google Scholar] [PubMed]
- Watanabe, S.; Kang, D.H.; Feng, L.; Nakagawa, T.; Kanellis, J.; Lan, H.; Mazzali, M.; Johnson, R.J. Uric acid, hominoid evolution, and the pathogenesis of salt-sensitivity. Hypertension 2002, 40, 355–360. [Google Scholar] [CrossRef]
- DeVallance, E.R.; Schmidt, H.M.; Seman, M.; Lewis, S.E.; Wood, K.C.; Vickers, S.D.; Hahn, S.A.; Velayutham, M.; Hileman, E.A.; Vitturi, D.A.; et al. Hemin and iron increase synthesis and trigger export of xanthine oxidoreductase from hepatocytes to the circulation. Redox Biol. 2023, 67, 102866. [Google Scholar] [CrossRef]
- Xie, D.; Zhao, H.; Lu, J.; He, F.; Liu, W.; Yu, W.; Wang, Q.; Hisatome, I.; Yamamoto, T.; Koyama, H.; et al. High uric acid induces liver fat accumulation via ROS/JNK/AP-1 signaling. Am. J. Physiol. Endocrinol. Metab. 2021, 320, E1032–E1043. [Google Scholar] [CrossRef]
- Vítek, L.; Haluzík, M. The role of bile acids in metabolic regulation. J. Endocrinol. 2016, 228, R85–R96. [Google Scholar] [CrossRef] [PubMed]
Disclaimer/Publisher’s Note: The statements, opinions and data contained in all publications are solely those of the individual author(s) and contributor(s) and not of MDPI and/or the editor(s). MDPI and/or the editor(s) disclaim responsibility for any injury to people or property resulting from any ideas, methods, instructions or products referred to in the content. |
© 2024 by the authors. Published by MDPI on behalf of the Gout, Hyperuricemia and Crystal Associated Disease Network. Licensee MDPI, Basel, Switzerland. This article is an open access article distributed under the terms and conditions of the Creative Commons Attribution (CC BY) license (https://creativecommons.org/licenses/by/4.0/).

