Article

Prediction of Heat Transfer During Condensation in Annuli

Engineering Research Associates, 10 Dahlia Lane, Redding, CT 06896, USA
J. Exp. Theor. Anal. 2024, 2(4), 134-151; https://doi.org/10.3390/jeta2040011
Submission received: 14 October 2024 / Revised: 14 November 2024 / Accepted: 28 November 2024 / Published: 3 December 2024

Abstract

:
Many applications involve condensation in annuli; therefore, accurate prediction of heat transfer is important. While there have been a large number of experimental studies on condensation in tubes and several well-verified correlations are available for them, there have been very few experimental studies on annuli, and no well-verified correlation is available for prediction of heat transfer during condensation in annuli. This research was done to identify reliable correlations for this purpose and to develop a new one if needed. Literature was surveyed to identify experimental studies, test data, and predictive methods. Test data was compared to general correlations which have had considerable verification with data for condensation in channels. None of them was found fully satisfactory. A new correlation was developed by modifying the present author’s published correlation for condensation in tubes. It gives a MAD of 19.2% with available data from eight sources. Deviations of other correlations were much higher. The occurrence of surface tension effects and mini/macro channel boundary are investigated. The results of this research are presented and discussed.

1. Introduction

Many applications involve condensation in annuli; therefore, accurate prediction of heat transfer during condensation in annuli is needed. However, no well-verified correlation for this purpose is available. On the other hand, there have been a large number of experimental studies on condensation in tubes, and several well-verified correlations are available for them. It is well known that heat transfer during single-phase flow in annuli is satisfactorily predicted by correlations for tubes by using an equivalent diameter. Data for heat transfer during boiling in annuli have been satisfactorily predicted by correlations for tube by using them with an equivalent diameter, for example in Shah [1]. It may therefore be expected that heat transfer in condensation in annuli may be correctly predicted by correlations for tubes with a suitable equivalent diameter. Some authors have shown encouraging results with this approach through analysis of a limited amount of data, for example Cavallini et al. [2]. Whether this approach is generally valid and, if so, which equivalent diameter to use is not known. The present research was undertaken to answer these questions, to identify reliable correlations, and to develop a new one if needed. Literature was surveyed to identify experimental studies, test data, and predictive methods. Test data was compared to general correlations which have had considerable verification with data for condensation in channels. None of them was found fully satisfactory. Among these, the Shah [3] correlation gave the best agreement. A new correlation was developed by modifying it. It gave a MAD of 19.2% with available data from eight sources. Deviations of other correlations were much higher.
A related question is the effect of surface tension and the threshold for its occurrence in annuli. During condensation inside tubes, Shah [4] determined that surface tension effects can become dominant at WeGT < 100 and thus it is the boundary between macro and minichannels for condensation in tubes. Whether it is also the boundary for condensation in annuli is investigated.
The results of these researches are presented and discussed in the following. Before doing that, previous work is briefly reviewed.

2. Previous Work

Previous work on condensation in channels has most recently been reviewed by Shah [5].

2.1. Experimental Studies

The experimental studies that were found in literature are listed in Table 1 together with the range of parameters covered in them. There are a total of ten studies. Among these, Hashizume [6] and Cavallini et al. [2] do not provide data in analyzable form. Hence only eight of them give data which can be analyzed. In all of these studies, condensation occurred on the outer surface of the inner tube. Two of the studies were for vertical downflow, while the others were for horizontal flow. Fluids were water, ammonia, and halocarbon refrigerants. All fluids were single-component except for R-410A, which is a zeotropic mixture. However, its condensation involves negligible mass transfer effect, as its glide is only about 0.1 K. All fluids were free of contaminants such as compressor oil.
Among these studies, the most recent is that of Ruzaikin et al. [7]. They performed tests with two different annuli, one with annular gap of 2.5 mm and the other with annular gap of 1 mm, the latter being the smallest annular gap in the entire database. The tests were done using ammonia. Data for condensation of ammonia are scarce even for tubes. Hence these data are of special interest. Cooling fluid flowed through the inner tube while ammonia flowed in the annular gap. Condensation occurred on the outer surface of the inner tube. The outer tube was insulated. Wall surface temperatures were measured with thermocouples, and the condensing heat transfer coefficient was calculated using these measured wall temperatures. This method usually gives more accurate results than obtained by the method in which the overall heat transfer coefficient is measured and the condensing heat transfer coefficient calculated from it. All the other data analyzed in this paper were obtained by the latter method except those of Miropoloskiy et al., for which the methodology is not stated.
Table 1. Published experimental studies on condensation in annuli and their range of parameters. Condensation occurred on the inner tube in all studies.
SourceDout/Din
mm/mm
(Flow Direction)
Dhyd
(DHP)
mm
FluidprG
kg·m−2 s−1
xReLTWeGTFrLTAre Analyzable Data Provided?
Li et al. [8]17/12.7
(H)
4.3
(10.5)
R-410A0.4347
0.5542
75
225
0.2
0.8
8830
26482
76
693
0.15
1.3
Yes
Borchmann [9]38/ 31.2
(H)
6.8
(15.0)
R-110.037329
286
0.55
1.0
1245
12278
39
3747
0.006
0.59
Yes
He et al. [10]22.0/16.0 (H)6.0 (14.2)R-410A0.554254
96
0.12
0.76
8628
15333
55
176
0.055
0.175
Yes
Tang et al. [11]26.0/19.05 (H)6.95
(16.4)
R-134A0.284650
100
0.50
0.60
5436
10844
55
221
0.029
0.116
Yes
25.0/19.05 (H)5.9
(13.7)
R-134A0.284652
108
0.54746
9781
51
218
0.038
0.160
Yes
Wang et al. [12])26.0/15.8
(H)
10.2 (27.0)R-110.05913
103
0.51151
9198
8
538
0.00084
538
Yes
Chen et al. [13]17.0/12.7
(H)
4.3
(10.1)
R-4100.554238
227
0.454255
25588
19
706
0.038
1.36
Yes
R-220.345352
247
0.454004
18985
29
649
0.053
1.2
Yes
25.0/12.7
(H)
12.3
(38.1)
R-4100.55429
56
0.45
0.65
3692
24110
3
129
0.00067
0.029
Yes
R-220.345318
41
0.453896
11811
6
52
0.0012
0.011
Yes
Miropoloskiy et al. [14]21.7/18.0
(VD)
3.7
(8.16)
Water0.0361
0.4523
100
600
0.02
0.99
5115
42884
56
805
0.34
14.7
Yes
Ruzaikin et al. [7]8.0/6.0
(H)
2.0
(4.7)
NH30.1609
0.2593
80
200
0.13
0.78
1613
3707
52
359
1.1
6.3
Yes
11.0/6.0
(H)
5.0
(14.2)
0.1221
0.2032
41
122
0.09
0.80
1728
6151
44
300
0.100
0.987
Yes
Cavallini et al. [2]38.5/24.0
(VD)
14.5
(37.8)
R-110.0236
0.0329
58
187
0.47
1.0
No
R-1130.0295
0.0410
63
223
0.11
1.0
No
Hashizume [6]25.0/15.88
(H)
9.12.
(23.4)
R-220.2710
0.3458
No

2.2. Correlations

No correlations have been proposed specifically for annuli. A few authors compared a limited amount of data with correlations for tubes as described below.
Cavallini et al. [2] condensed R-11 and R-113 in a vertical annulus. The data were compared to the correlation of Shah [15] using DHYD as the equivalent diameter. Data were over-predicted by 20% to 25%. The Shah [15] correlation is given by the following equation.
h T P = h L S 1 + 3.8 / Z 0.95
where hLS is the superficial heat transfer coefficient of the liquid phase given by
h L S = 0.023 R e L S 0.8 P r L 0.4 k L / D
Z is the correlating parameter introduced by Shah [15] defined as
Z = ( 1 / x 1 ) 0.8 p r 0.4
Miropoloskiy et al. [14] compared their data for water with the correlation of Ananiev et al. [16]; satisfactory agreement was reported. For equivalent diameter, they used (DHYD. ε) where ε is the void fraction. The Ananiev et al. correlation for tubes is given by the following equation.
h T P = h L T ρ L ρ T P 0.5
where hLT is the heat transfer coefficient assuming that all mass is flowing as liquid. ρTP is the density of vapor-liquid mixture calculated by the homogeneous model as below.
ρ T P = ρ G ρ L ρ G + x ρ L ρ G
Shah [3] gave a correlation which was verified with a vast amount of data for condensation in channels. Included in the data were those of Borchman [9] and Li et al. [8] for annuli; both were in satisfactory agreement with the correlation. The Shah [3] correlation uses the following two equations.
h I = h L S 1 + 3.8 Z 0.95 μ L 14 μ G ( 0.0058 + 0.557 p r )
h Nu = 1.32 R e L S 1 / 3 ρ L ( ρ L ρ G ) g k L 3 μ L 2 1 / 3
Equation (7) is the Nusselt equation for laminar condensation in vertical tubes, with the constant increased by 20% as recommended by McAdams [17].
There are three regimes of heat transfer in this correlation.
In Regime I,
h T P = h I
In Regime II,
h T P = h I + h N u
In Regime III:
h T P = h N u
Separate criteria are given for determining the heat transfer regimes in horizontal and vertical downflow. These depend mainly on the dimensionless vapor velocity Jg which is defined below.
J g = x G g D ρ G ρ L ρ G 0.5
An important factor determining heat transfer in horizontal channels is Weber number WeGT,
W e G T = G 2 D ρ G σ
when WeGT < 100, surface tension effects become significant if at the same time FrLT < 0.026 and heat transfer Regime is I. FrLT is defined as
F r L T = G 2 g D ρ L 2
In the Shah correlation, DHP is used as the equivalent diameter in calculating hLS; DHYD is used as equivalent diameter in all other parameters. Definitions of these equivalent diameters are
D H P = 4 × F l o w   a r e a P e r i m e t e r   w i t h   h e a t   t r a n s f e r
D H Y D = 4 × F l o w   a r e a W e t t e d   P e r i m e t e r
Many other correlations have been proposed for condensation in tubes. Among these, those which were reported to be in agreement with a wide range of data from many sources are Kim and Mudawar [18], Dorao and Fernandino [19], Hosseini et al. [20], Moradkhani et al. [21], Nie et al. [22], Marinheiro et al. [23], and Moser et al. [24]. Correlation of Traviss et al. [25] was derived from a theoretical analysis with many simplifying assumptions.

3. Data Analysis

The available analyzable test data are listed in Table 1. They were analyzed in two stages. In the first stage, the test data were compared to the correlations for tubes mentioned in Section 2.2. As none of those correlations gave satisfactory agreement with data, further analyses were done in which attempts were made to develop an accurate method for predicting heat transfer in annuli.

3.1. Comparison with Correlations for Tubes

3.1.1. Calculation Methodology

In calculations with the Shah [3] correlation, DHP was used in calculating single-phase heat transfer coefficient and Reynolds number as required by it. DHYD was used throughout with all other correlations. Kim and Mudawar [18], Dorao and Fernandino [19], Hosseini et al. [20], Moradkhani et al. [21], and Marinheiro et al. [23] had specified use of DHYD throughout. Others had not specified the equivalent diameter to be used.
Where the authors reported mean heat transfer coefficients, data were analyzed using the arithmetic mean quality. All the data were for mean heat transfer coefficients except those of Miropoloskiy et al. and Borchmann.
Miropoloskiy et al. [14] have reported their data in terms of (hTP/hLT). To get hTP from their data, hLT was calculated with Equation (2) by substituting ReLT in place of ReLS. DHYD was used as equivalent diameter in these calculations. Only data for ReLT > 2300 were analyzed, as the formula used by them to calculate hLT in this range was not clear.
All properties were obtained from REFPROP 9.1, Lemmon et al. [26]. All properties used were at saturation temperature. Deviations of correlations were calculated as below.
Mean absolute deviation (MAD) is defined as
M A D = 1 N 1 N A B S h p r e d i c t e d h m e a s u r e d / h m e a s u r e d
Average deviation (AD) is defined as
A D = 1 N 1 N h p r e d i c t e d h m e a s u r e d / h m e a s u r e d

3.1.2. Results of Data Analysis

The results of data analysis are given in Table 2. It is seen that for all data, the Shah [3] correlation has the least MAD at 25.3%. The next best are Dorao & Fernadino and Hosseini et al. with MAD of 27.2% and 28.5%, respectively.
Table 2 does not include the results for the correlation of Traviss et al. and Nie et al., as they had large deviations with most data.
While the overall accuracy of all correlations is fair to poor, many of the data sets give good agreement with some correlations. On the other hand, some of the data sets show poor agreement with all correlations.
While the Shah correlation has the least MAD, better accuracy is needed. Attempts were therefore made to develop a more accurate correlation as described below.

3.2. Development of Improved/New Correlation

As the Shah [3] correlation had given the best results, efforts were directed to improve its accuracy. Several approaches were tried.

3.2.1. First Approach

The first approach tried was to use DHYD throughout the calculations instead of using DHP in some places and DHYD in some places as required. The results with this approach are seen in Table 3. Deviations of some data sets improved while those of others increased. For all data, the MAD with this approach improved to 23.0% compared to 25.3% with the published correlation.

3.2.2. Second Approach

The next approach tried was to use a single-phase heat transfer correlation developed by Alferov and Rybin [27] in place of the Dittus–Boelter equation, Equation (2). They performed tests with water flowing in vertical annuli in which the inner tube had OD of 15 mm while annular gaps were 1, 1.5, 3, and 5 mm. In some tests, only the inner tube was heated; in some, only the outer tube was heated; and in some tests, both tubes were heated. They developed the following correlation for single-phase heat transfer.
h L T = 0.023 E G D H Y D μ L 0.8 P r L 0.4 k L / D H Y D
If only the inner tube is heated,
E = D O U T D I N 1 0.12
This relation was shown to be also in good agreement with data from three other sources in which (DOUT/DIN) varied from 1.24 to 1.375. Thus, for all data for heating on inner tube only, (DOUT/DIN) ranged 1.13–1.67. With heating on outer tube only and with heating on both tubes, E = 1.
Calculations were done with the Shah [3] correlation using the Alferov & Rybin correlation to calculate the single-phase heat transfer coefficient. As seen in Table 3, this approach resulted in MAD of 23.2% with all data. This is an improvement over the result with the published Shah correlation.

3.2.3. Third Approach

While developing correlations for saturated and subcooled boiling heat transfer, the present author had obtained good agreement with data for annuli by calculating single-phase heat transfer using DHYD for larger annular gaps and DHP for smaller annular gaps. For example, the Shah [28] correlation for subcooled boiling in channels calculates single-phase heat transfer coefficient of liquid as below.
Use DHYD when annular gap > 3 mm.
Use DHP when annular gap < 3 mm.
It was decided to try out this approach. Study of the results in Table 3 shows that for most data sets, use of DHYD throughout gives comparable or lower deviations than while using DHP. A notable exception is the data of Ruzaikin et al. for the annulus with 1 mm gap, for which use of DHP for calculating the single-phase heat transfer coefficient gives much lower deviations. The data set with the next smallest annular gap (1.85 mm) is that of Miropoloskiy et al., which has much lower deviation when using DHYD throughout. Using DHP for the 1 mm gap annulus and DHYD for all other data, the resulting MAD for all data is 19.2%. This is much lower than the MAD of 25.2% of the Shah [3] correlation. It is also well below the MAD of 23.0 and 23.2 percent of the other two approaches that were tried.

3.2.4. Selected New Correlation

As seen in Section 3.2.3, the third approach gives significantly lower MAD for the database compared to the other three approaches. Therefore, the new correlation should be based on it.
The data of Miropoloskiy et al. for 1.85 mm annular gap give good result using DHYD, while the data of Ruzaikin et al. for 1 mm annular gap give good agreement using DHP. Hence the transition point is somewhere between 1 mm and 1.85 mm annular gap. Until more data are available within this range, the transition point may tentatively be taken midway between them at 1.5 mm annular gap. Thus, the new correlation is as follows:
For annuli with annular gap > 1.5 mm, use DHYD throughout in the Shah [3] correlation.
For annuli with annular gap < 1.5 mm, use the Shah [3] correlation without any change, i.e., use DHP in calculating single-phase heat transfer coefficient; use DHYD in all other calculations.
The results using this modified/new correlation are listed in Table 3. It is seen that the MAD of the new correlation is 19.2%, well below that of the published correlation as well as those of the other two approaches that were tried.
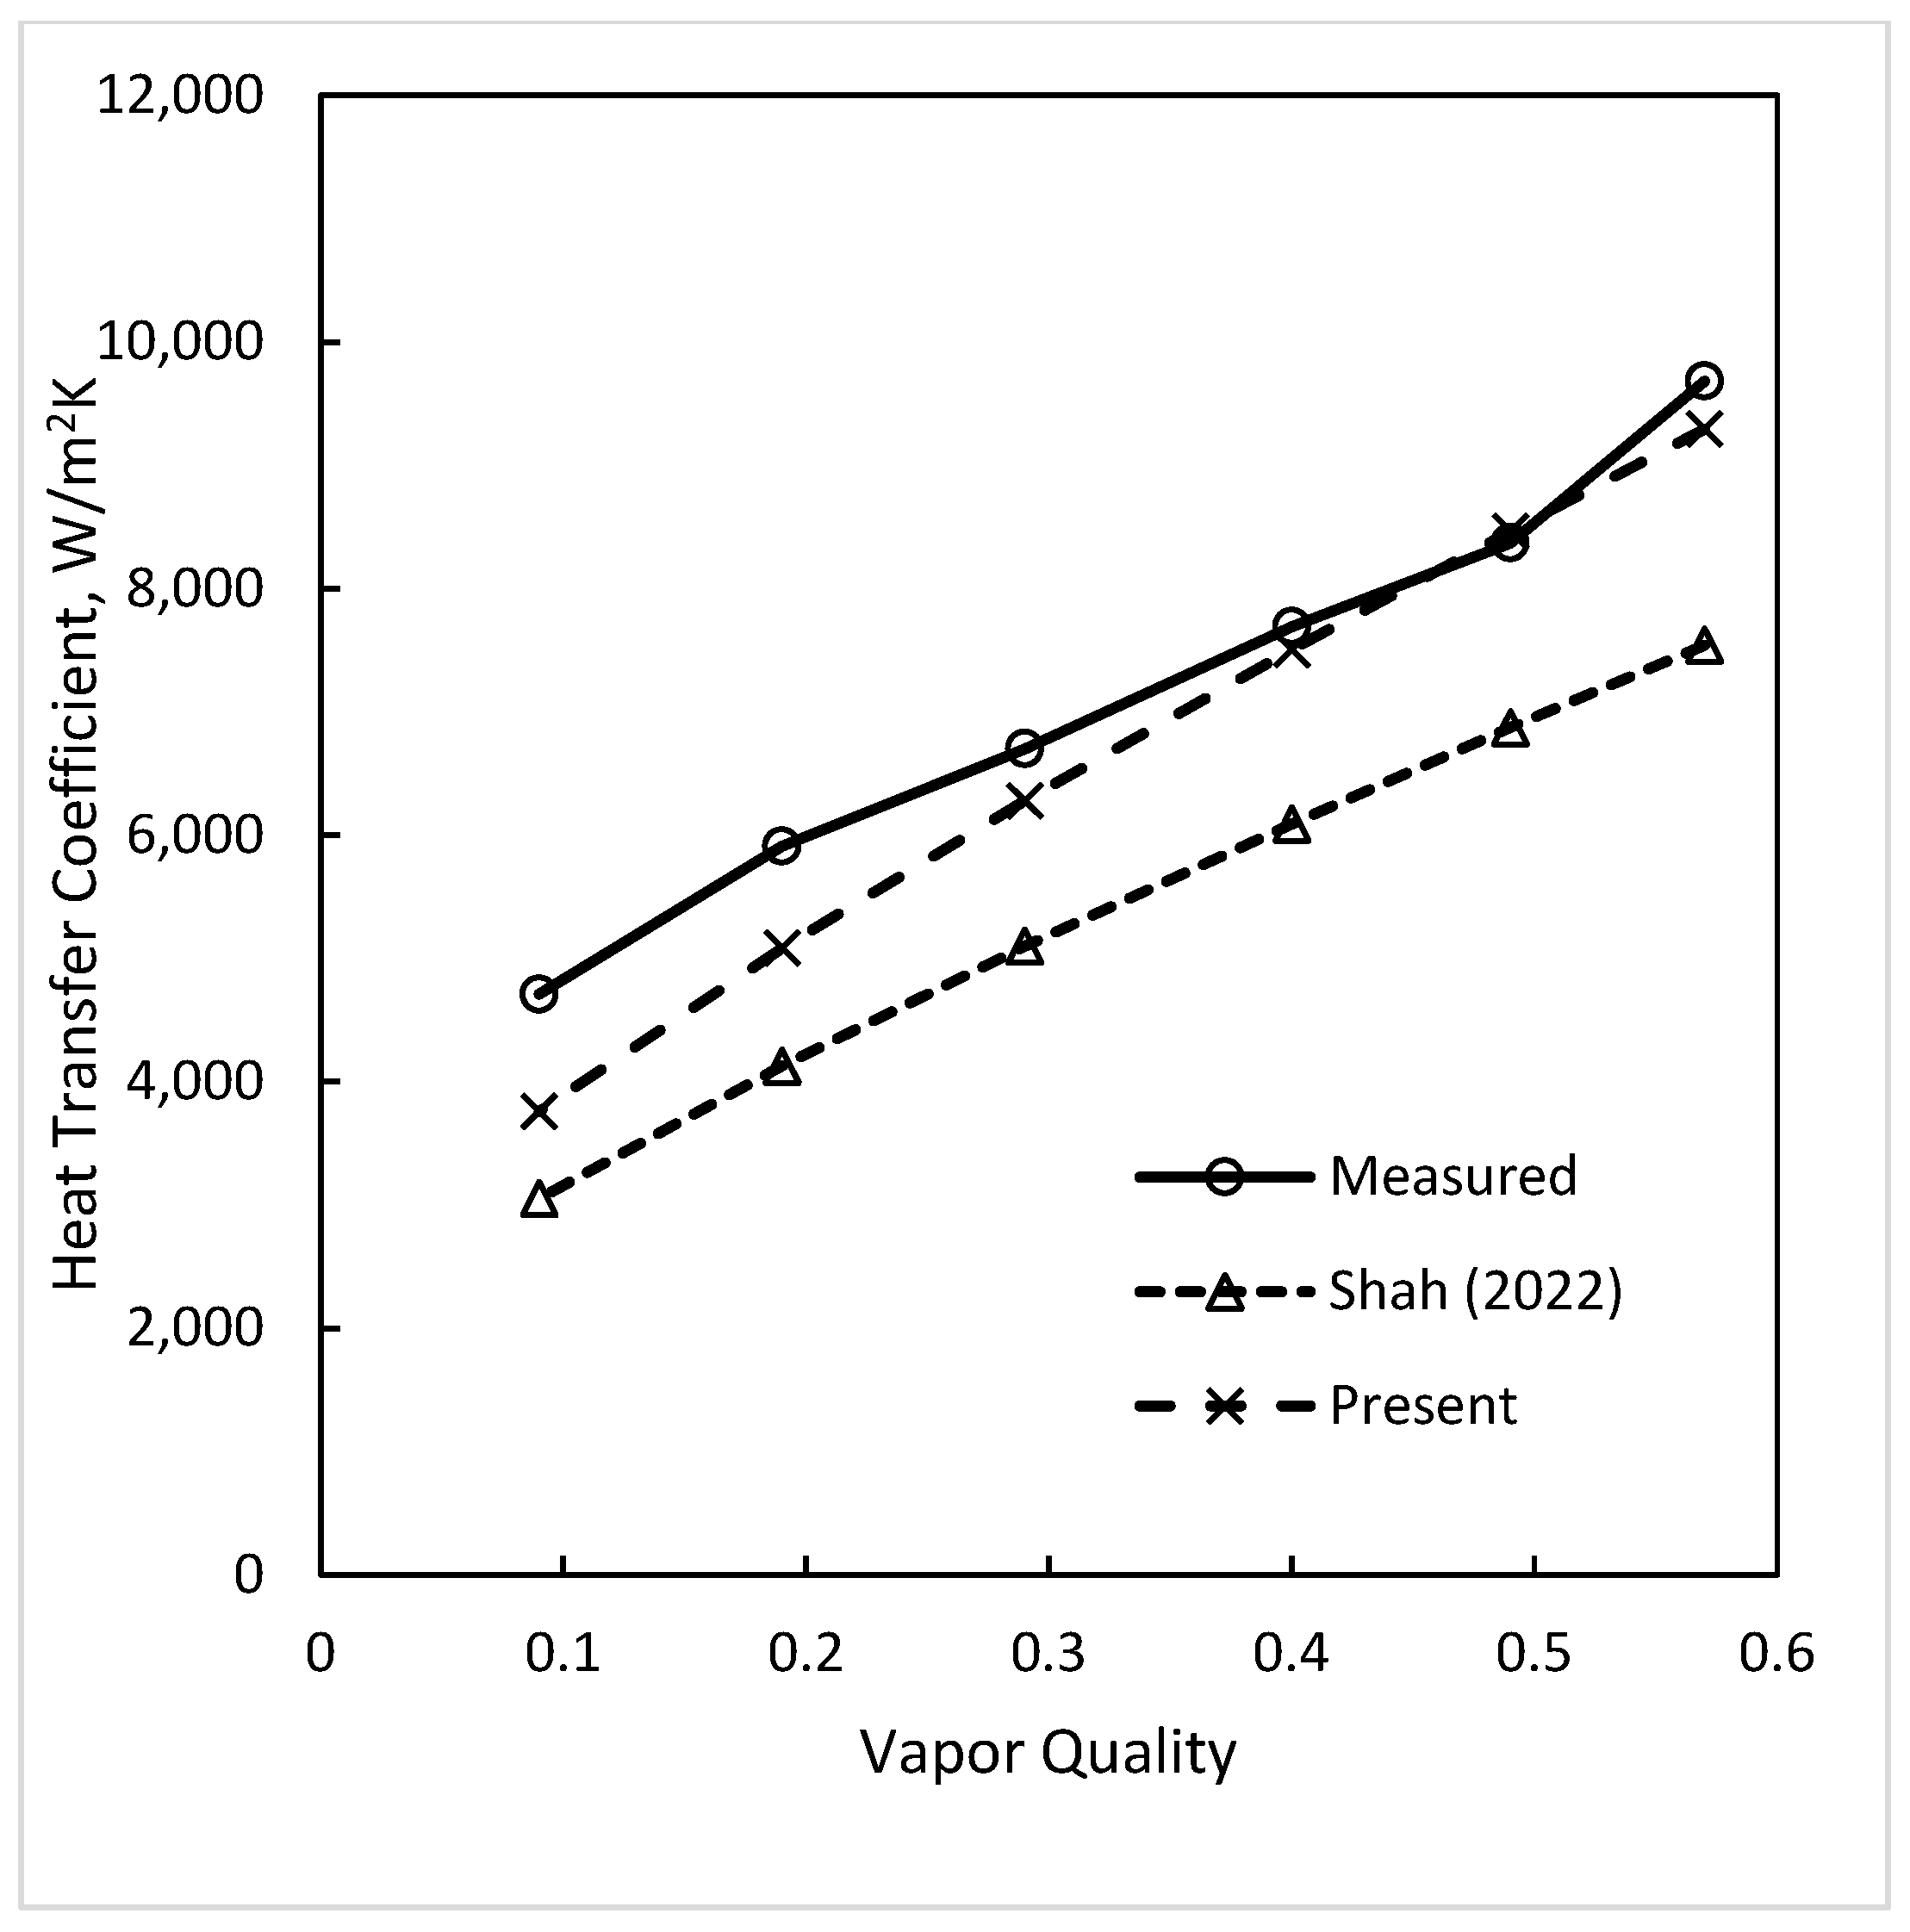
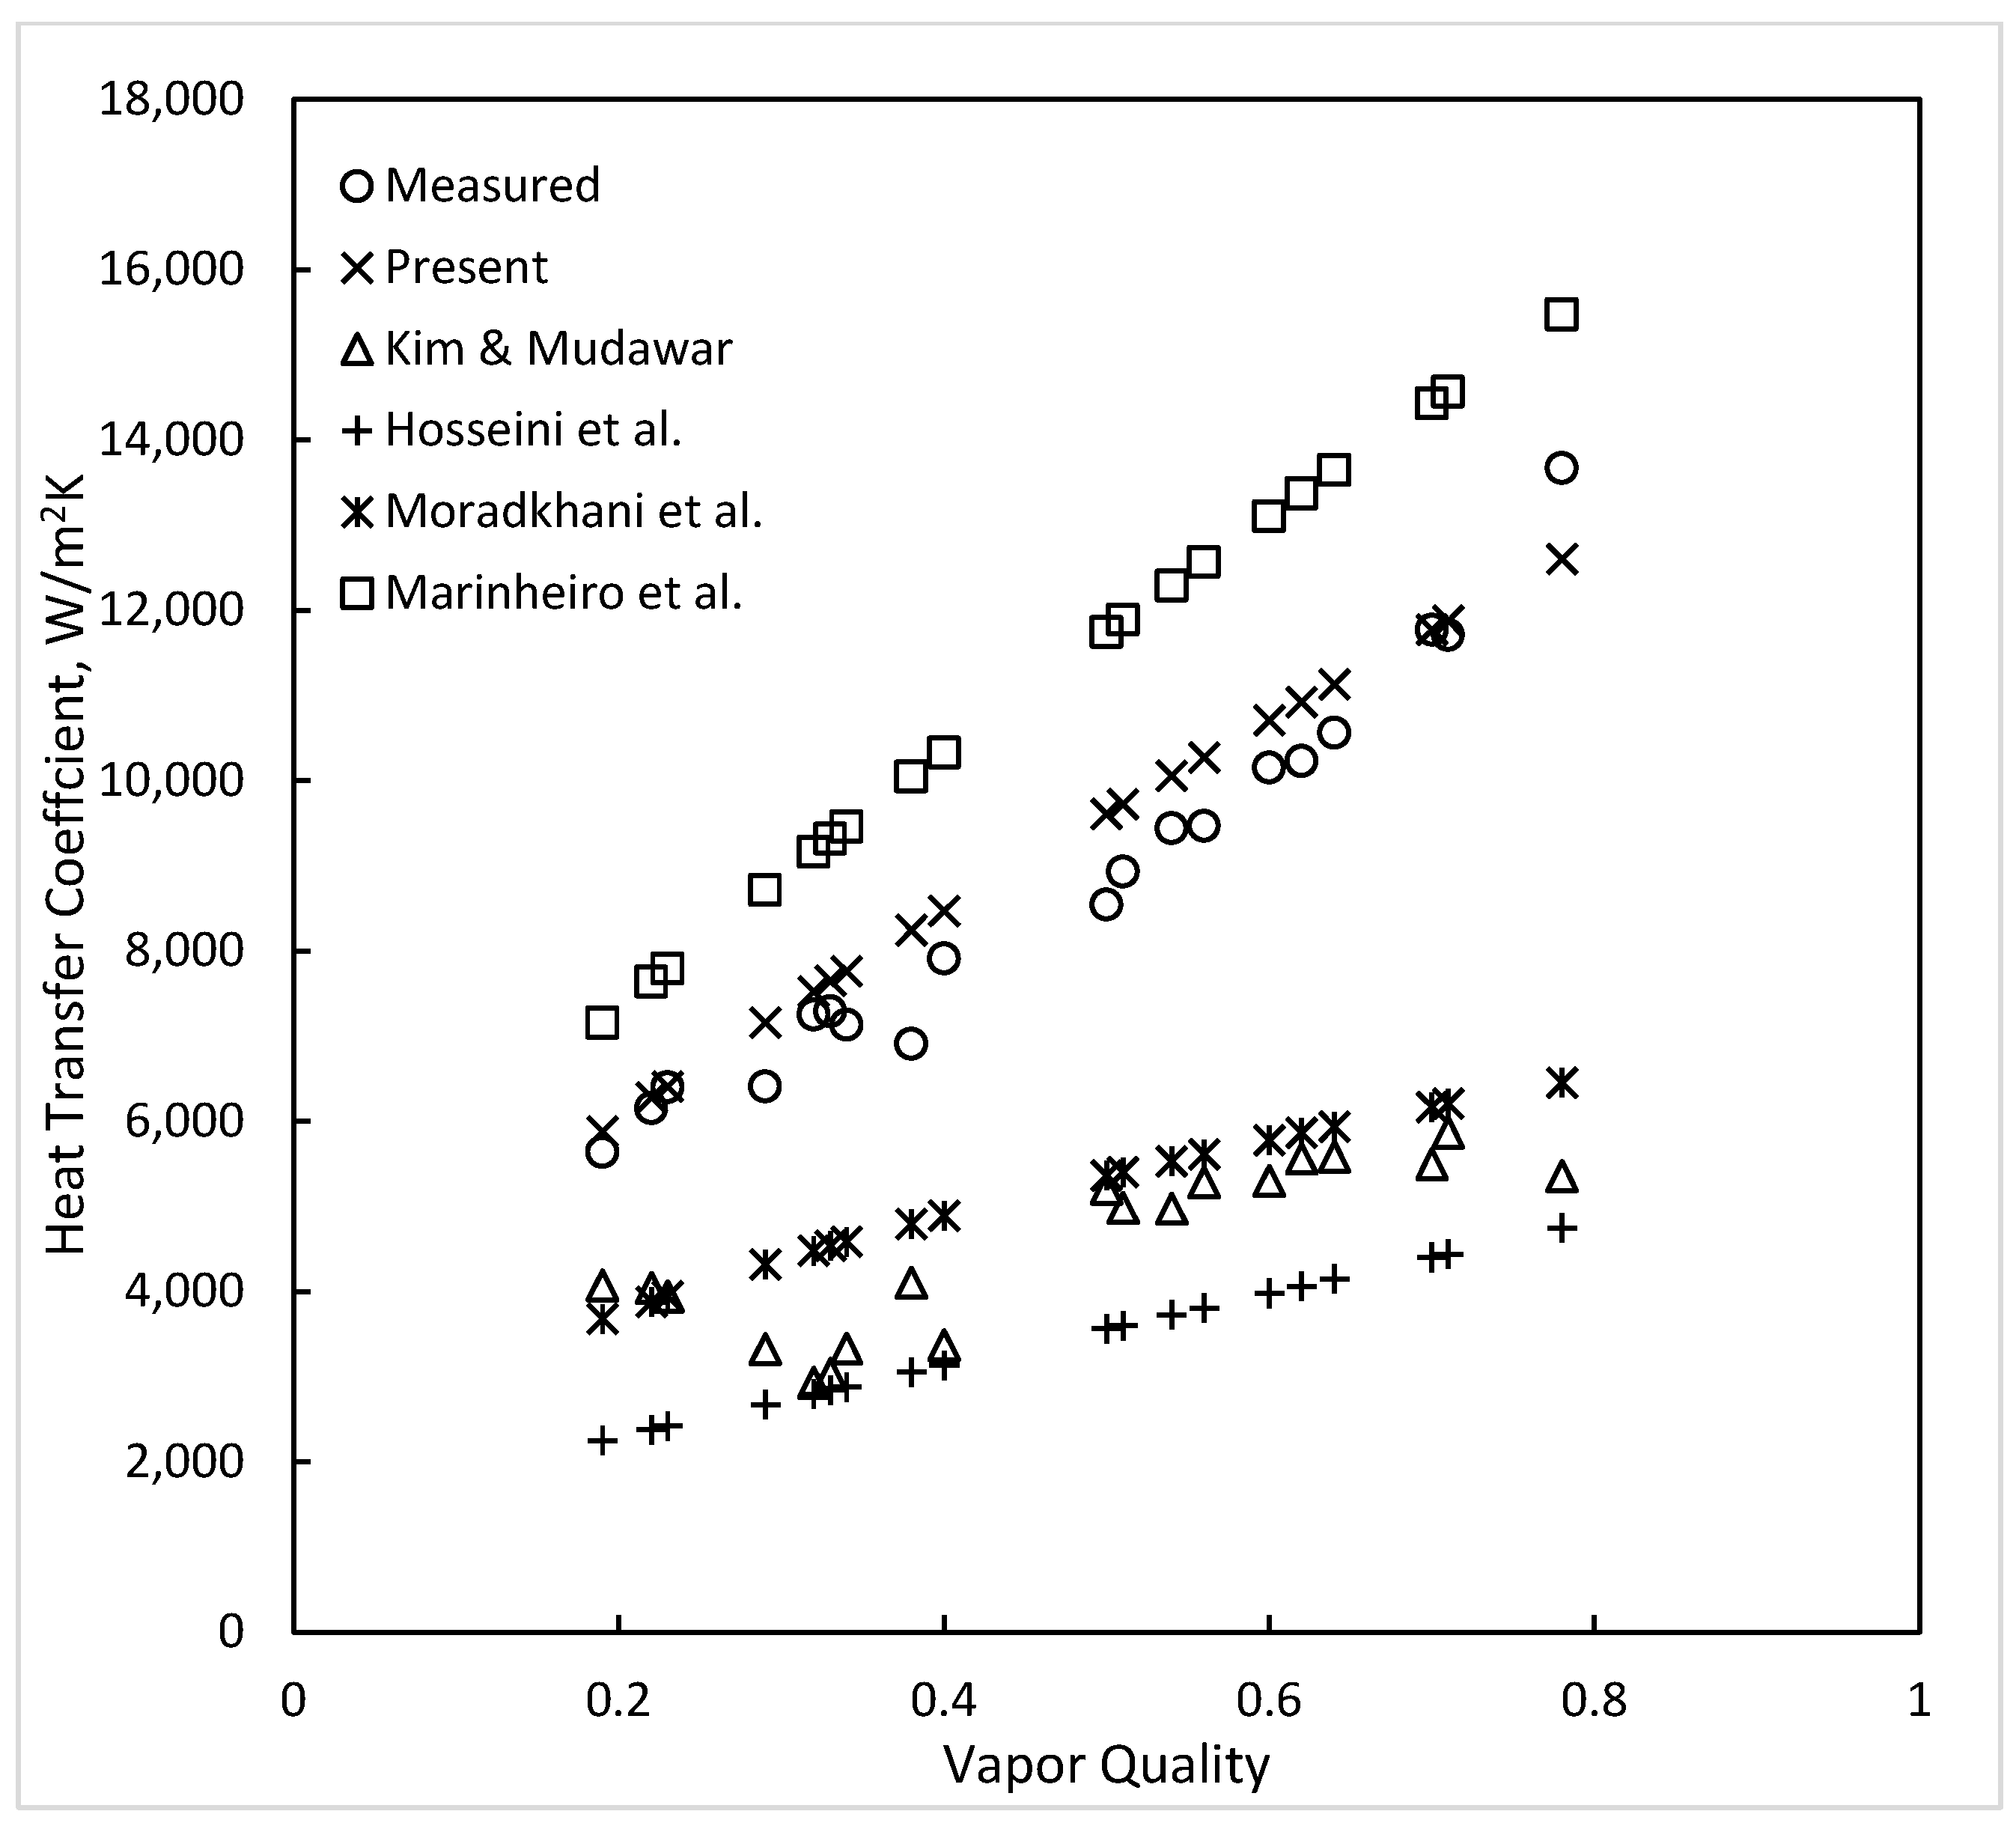
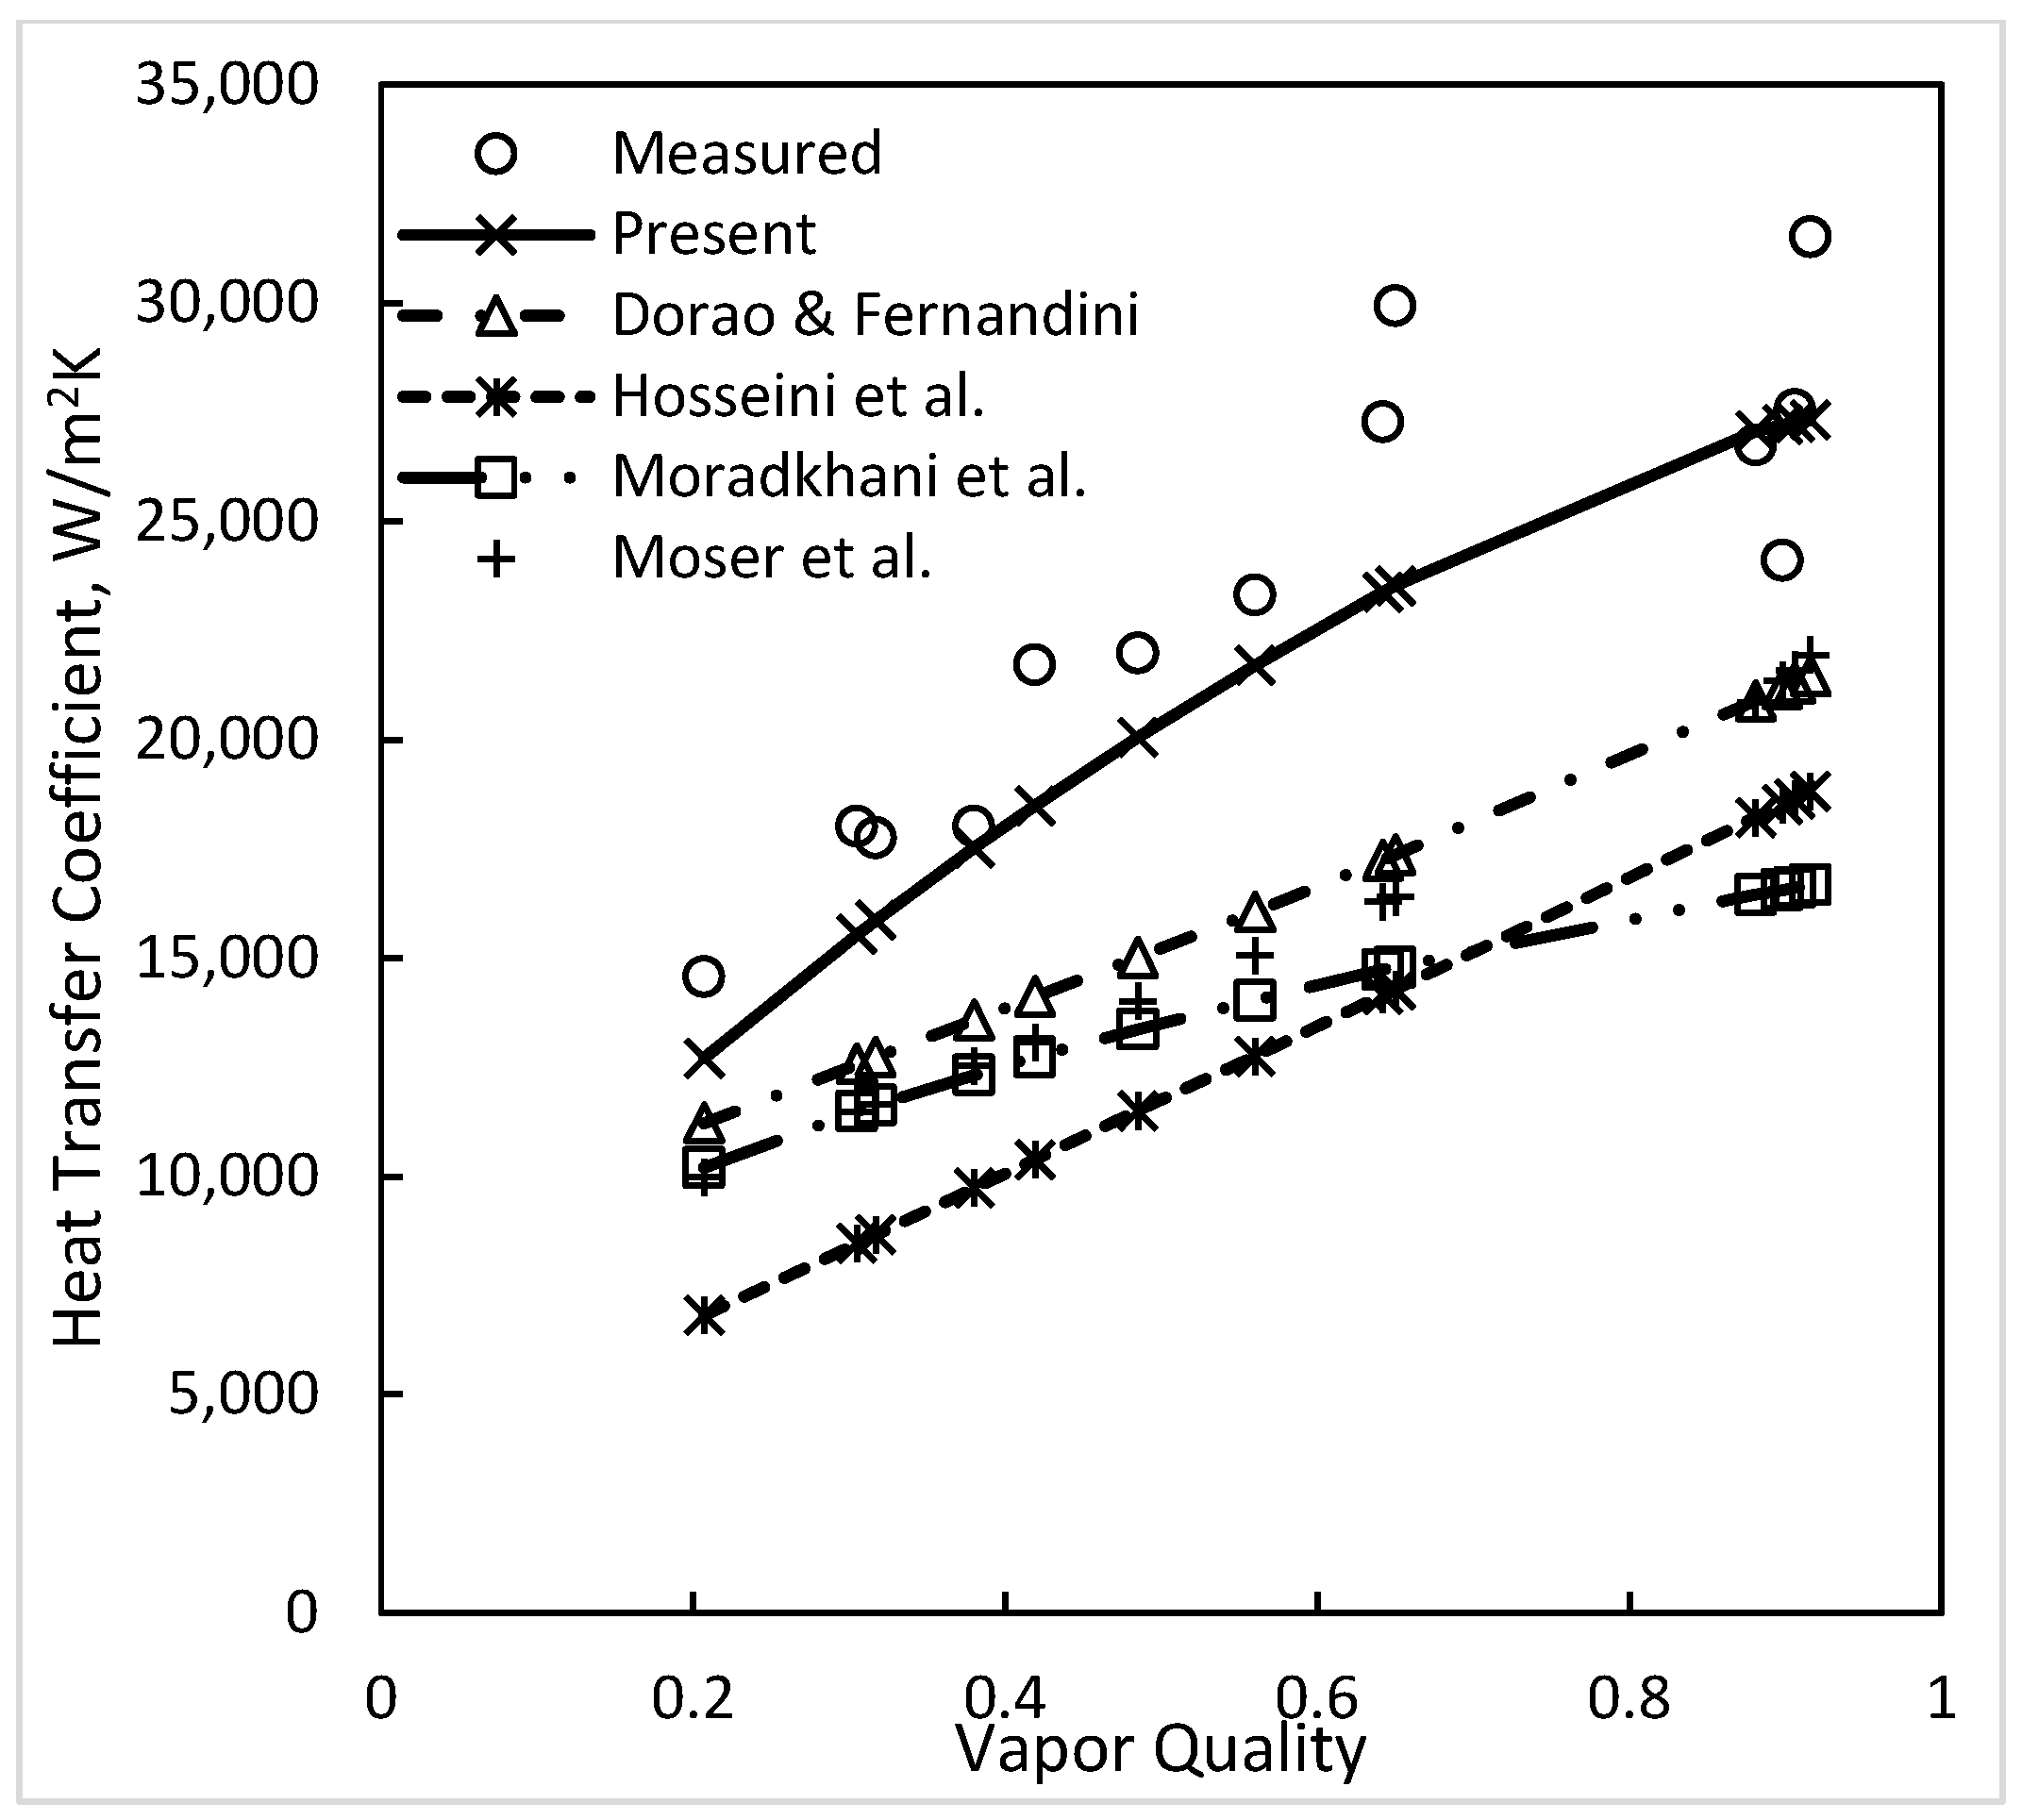
Figure 1, Figure 2, Figure 3, Figure 4, Figure 5 and Figure 6 illustrate the greater accuracy of the new correlation compared to Shah [3] correlation as well as other correlations.

4. Discussion

4.1. Accuracy of Test Data

Some of the data analyzed seem to be inaccurate as discussed below.
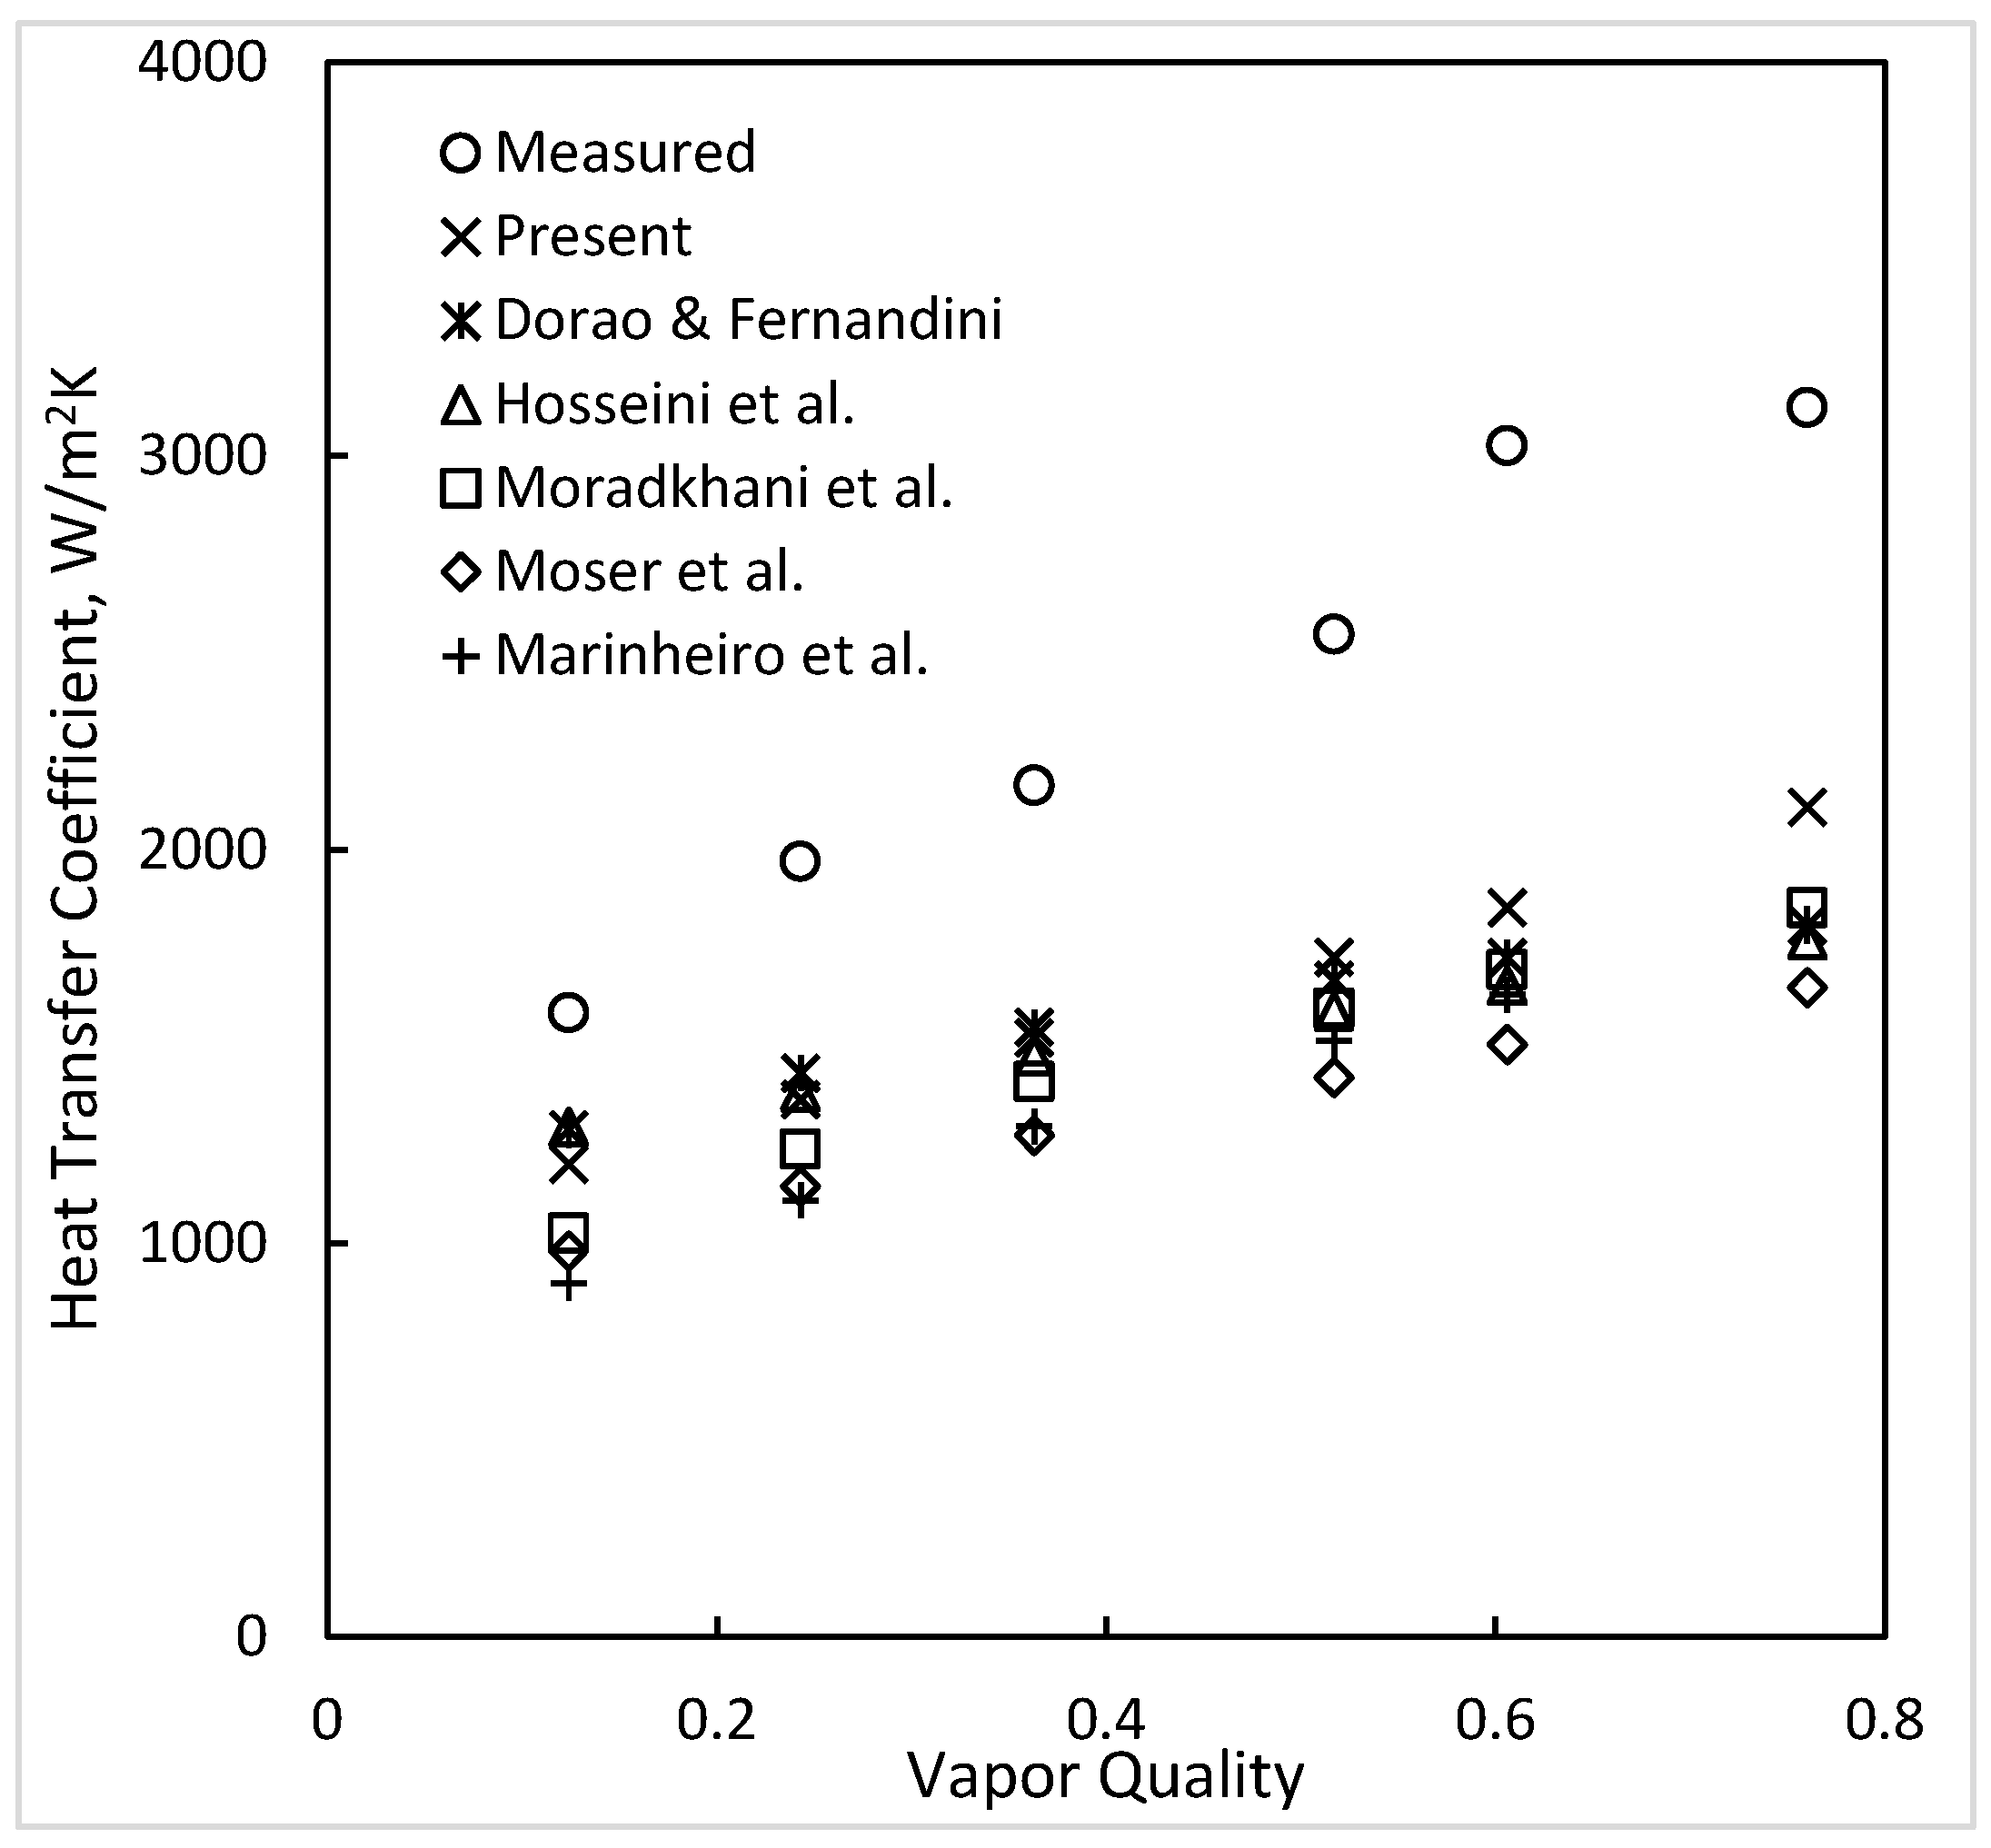
Figure 7 shows the comparison of the data of He et al. [9] with a number of correlations. It is seen that all correlations considerably underpredict the data. Further, all correlations underpredict the data by 30 to 40 percent. The fact that all correlations underpredict and agree among themselves suggests that these data may be inaccurate.
He et al. had reported good agreement with the correlation of Cavallini et al. [29]. This correlation has two regimes, ΔT-independent and ΔT-dependent. Present calculations showed that all their data fall in the latter regime. The formula for the ΔT-dependent regime requires the insertion of ΔT. He et al. also reported good agreement with three other correlations; all of them require insertion of ΔT. As ΔT is unknown, proper evaluation requires iterative calculations with assumed ΔT. He et al. have not stated that they did iterative calculations. It appears that they substituted the measured ΔT in the formulas during their evaluation. This will naturally give good agreement with data.
The data of Wang et al. [12] are also grossly underpredicted by almost all correlations. Therefore, these data are also suspected to be inaccurate.
Tang et al. [11] performed tests with two annuli. The diameter of the inner tube was 19 mm for both annuli. The diameter of the external tube was 26 mm in the first annulus and 25 mm in the second annulus; DHYD of the two were 6.95 mm and 5.95 mm, respectively. The fluid and operating conditions in the two annuli were the same. Experience with both single-phase and condensing flow indicates that the heat transfer coefficient increases with decreasing diameter. Yet the reported heat transfer coefficients for the 5.95 mm hydraulic diameter annulus are 25–45 percent lower than those in the annulus with 6.95 mm hydraulic diameter. As seen in Table 2, the data for the 25 mm diameter outer tube are greatly overpredicted by most of the correlations. It therefore appears that the data for the annulus with the 25 mm diameter outer tube are very inaccurate.
If the data mentioned above as probably inaccurate are not considered, the MAD of the present correlation becomes 16.1%. The deviations of most other correlations also become lower.

4.2. Effect of Surface Tension, Mini/Macro Channel Boundary

The Shah [3] correlation provides a criterion for determining the mini/macro channel boundary during condensation in tubes and includes a method to calculate heat transfer in the minichannel regime. These are incorporated into the present correlation for application to annuli. It is therefore necessary to know whether the methodology for tubes also works for annuli. This investigation was done and reported in the following. First, some background is provided.
Channels with hydraulic diameter ≤3 mm are generally considered to be minichannels. This boundary was suggested by Kandlikar [30] without any consideration of surface tension effects. Many authors regard minichannels to be those in which heat transfer is affected by surface tension and as a result the correlations based on macro channel data fail. A number of criteria have been proposed for the mini/macro boundary based on the Bond number and its equivalent confinement number and Eotvos number. Bond number Bd is the ratio of gravity forces to surface tension forces defined as below.
B d = g D 2 ρ L ρ G σ
The relation between Bond number Bd, confinement number Co, and Eotvos number Eo is expressed by the following equation.
E o = B d 8 = 1 8 C o 2
Several definitions of Eo have been given by different authors. The definition used above is that given by Brauner and Ullman [31], who gave a criterion for mini/macro channel boundary based on this definition. Similarly, there are several definitions of Co in the literature. The definition used here is that given by Kew and Cornwell [32] who gave a criterion for the mini/macro channel boundary based on this definition. Ong and Thome [33] have also used the same definitions of Eo and Co as in this paper.
Some criteria have been based on the capillary number, also known as the Laplace constant. Shah [5,34] reviewed the evaluation of these criteria against experimental data by various authors. None of them was found satisfactory.
For condensation in tubes, Shah [4] determined that surface tension effects can become important when the ratio of inertia force to surface tension force becomes low. Weber number WeGT is that ratio. This factor is included in the Shah [3] correlation. According to it, surface tension effects enhance heat transfer in horizontal tubes when all these three conditions are met: Shah correlation’s heat transfer regime is I, FrLT < 0.026, and WeGT < 100. Surface tension has no effect in vertical flow. This criterion was verified in Shah [3] with data for 51 fluids from 130 sources. It was shown that all other correlations underpredict data when this criterion is met.
It is important to know whether this criterion for tubes is applicable to annuli and whether the Shah correlation gives satisfactory results for annuli under this condition. To find that, the data analyzed during the present research were carefully examined. The range of FrLT and WeGT in the data are listed in Table 1 and Table 4. Several data sets included WeGT < 100, but for all such data the heat transfer regime was II. There were no data for which Shah’s heat transfer regime is I together with FrLT < 0.026 and WeGT < 100. Hence, according to this criterion, none of the annuli data analyzed fall into minichannel category. Nevertheless, the data for WeGT < 100 were reviewed to see whether any enhancement due to surface tension may have occurred.
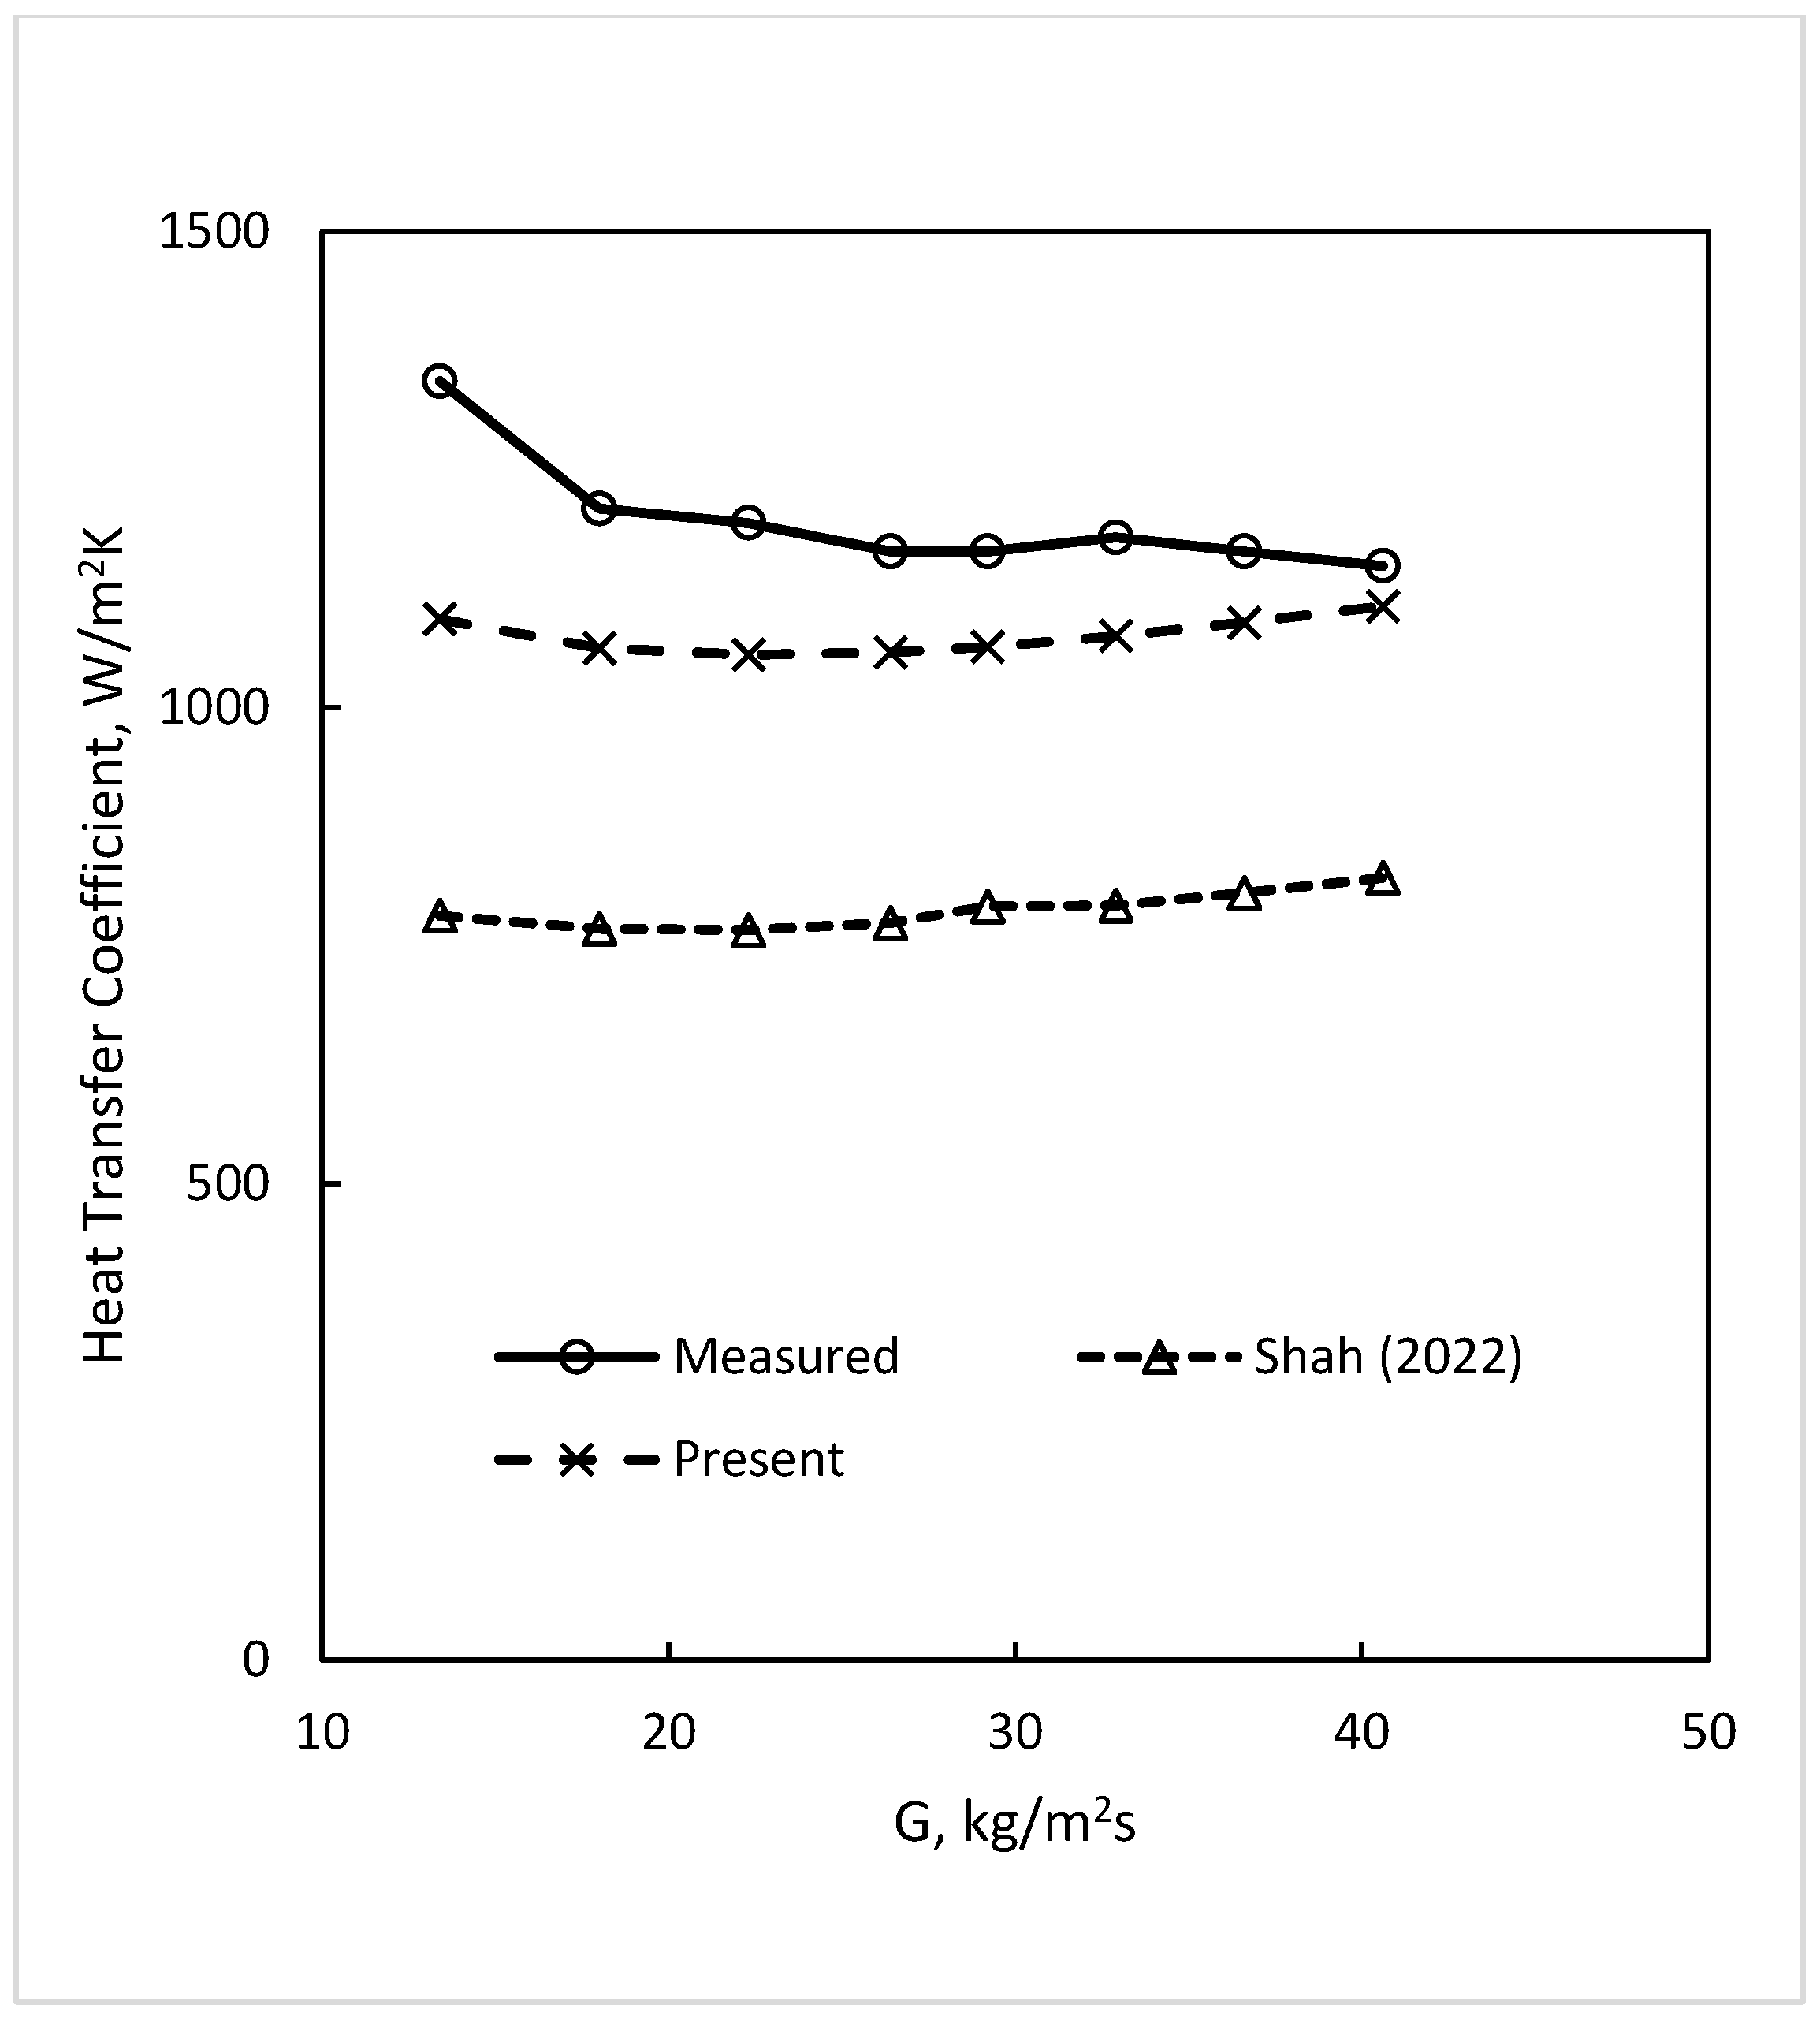
Figure 8 shows data of Ruzaikin et al. at WeGT = 50. The Shah correlation heat transfer regime is II. Hence, according to the present correlation, these data are in the macro channel regime and there is no enhancement due to surface tension. The present correlation is seen to be in close agreement with the data, thus showing that the mini/macro boundary according to this correlation is correct.
Figure 9 and Figure 10 show the data of Chen et al. for R-410A and R-22 as a function of Weber number. For all these data, WeGT < 100 and the heat transfer regime is II. Hence, according to the present correlation, these data are in the macro channel regime and therefore surface tension has no effect. It is seen that the present correlation is in good agreement with these data. This indicates that the mini/macro channel demarcation according to the present correlation is valid.
As there are no data in the minichannel regime, the applicability of the present correlation to annuli in the minichannel regime remains to be confirmed. This can be done only when such data become available.

4.3. Design Recommendation

The present correlation is recommended for condensation in annuli in which only the inner tube is cooled. Caution should be exercised in the minichannel regime of the present correlation, as none of the data analyzed were in that regime. The complete range of data analyzed is given in Table 4.
All data analyzed are for horizontal and vertical downflow. It should be used for only those orientations. Use for other orientations is not recommended.
As no data for annuli in which condensation occurred on the outer tube or both tubes have been analyzed, use of this correlation for such annuli is not recommended.

5. Conclusions

  • The literature on heat transfer during condensation in annuli was surveyed. It was found that there is no well-verified method for the prediction of heat transfer in annuli.
  • Analyzable data were found from eight sources, all for condensation on the inner tube. Those were compared to general correlations which had been verified with a wide range of data for condensation in tubes, using the equivalent diameter recommended by them for partially cooled channels. Considering all data, none of them gave good agreement, the best being the Shah [3] correlation with MAD of 25.3%.
  • A new correlation was developed by modifying the Shah (3) correlation. It gave a MAD of 19.2%. The MAD of other correlations were much higher. The data correlated included water, ammonia, and halocarbon refrigerants in vertical and horizontal annuli over a considerable range of flow rate and reduced pressure.
  • There is need for more test data to cover a wider range of conditions, especially very small annular gaps, to further verify and improve the new correlation. Data are also needed for annuli in which condensation occurs on the outer tube or on both tubes, and on flow directions other than horizontal and vertically downwards.

Funding

This research received no external funding.

Data Availability Statement

All data used in this research is from publications that have been cited in this paper and are publicly available to all.

Acknowledgments

The author thanks Vasyl Ruzaikin for kindly providing additional test data from his experimental study on condensation of ammonia in annuli.

Conflicts of Interest

The author declares no conflict of interest.

Nomenclature

ADAverage deviation, (-)
BdBond number, (-)
CoConfinement number, (-)
Ddiameter of tube, m
DHPequivalent diameter based on perimeter with heat transfer, m
DHYDhydraulic equivalent diameter, m
DINoutside diameter of the inner tube of annulus, m
DOUTinside diameter of the outer tube of annulus, m
EoEotvos number, (-)
FrLTFroude number, (-)
Gtotal mass flux (liquid + vapor), kg m−2 s−1
gacceleration due to gravity, m s−2
Hhorizontal
hheat transfer coefficient, W m−2 K−1
hIheat transfer coefficient given by Equation (6), W m−2 K−1
hLSheat transfer coefficient assuming liquid phase flowing alone in the tube, Wm−2 K−1
hLTheat transfer coefficient with total mass flowing as liquid, W m−2 K−1
hNuheat transfer coefficient given by Equation(7), the Nusselt equation, W m−2 K−1
hTPtwo-phase heat transfer coefficient, W m−2 K−1
Jgdimensionless vapor velocity defined by Equation (11)
kthermal conductivity, W m−1 K−1
MADmean absolute deviation, (-)
Nnumber of data points, (-)
ppressure, Pa
pccritical pressure, Pa
prreduced pressure = p/pc, (-)
PrPrandtl number, (-)
ReLSReynolds number assuming liquid phase flowing alone, = G (1 − x)DμL−1, (-)
ReLTReynolds number for all mass flowing as liquid = GDμL−1, (-)
TTemperature, K
TSATsaturation temperature, oC
Twwall temperature, oC
ΔT= (TSAT−Tw), K
WeGTWeber number for all mass flowing as vapor, defined by Equation (12), (-)
VDvertically downward
xvapor quality, (-)
ZShah’s correlating parameter defined by Equation (3), (-)
Greek
μdynamic viscosity, Pa·s
ρdensity, kg m−3
Mathematical symbol for summation
σSurface tension, Nm−1
Subscripts
Gvapor
Lliquid

References

  1. Shah, M.M. CHART correlation for saturated boiling heat transfer; equations and further study. ASHRAE Trans. 1982, 88, 165–196. [Google Scholar]
  2. Cavallini, A.; Frizzeri, S.; Rossetto, L. Condensation of refrigerants inside annuli. In Proceedings of the International Heat Transfer Conference, Munich, Germany, 6–10 September 1982; pp. 45–51. [Google Scholar] [CrossRef]
  3. Shah, M.M. Improved correlation for heat transfer during condensation in mini and macrochannels. Int. J. Heat Mass Transf. 2022, 194, 123069. [Google Scholar] [CrossRef]
  4. Shah, M.M. Comprehensive correlations for heat transfer during condensation in conventional and mini/micro channels in all orientations. Int. J. Refrig. 2016, 67, 22–41. [Google Scholar] [CrossRef]
  5. Shah, M.M. Two-Phase Heat Transfer; John Wiley & Sons: Hoboken, NJ, USA, 2021. [Google Scholar]
  6. Hashizume, K. Local two-phase heat transfer in double-tube heat exchanger. In Heat Exchangers Theory and Practice; Taborek, J., Hewitt, G.F., Afgan, N., Eds.; Hemisphere Publishing Corporation: New York, NY, USA, 1981. [Google Scholar]
  7. Ruzaikin, V.; Lukashov, I.; Breus, A.; Tsegelnyk, Y.; Plankovskyy, S. Ammonia condensation in the horizontal and vertical straight inner-grooved tubes and annuli. Int. J. Heat Mass Transf. 2024, 233, 126031. [Google Scholar] [CrossRef]
  8. Li, W.; Wang, J.; Guo, Y.; Gu, Z.; Wang, X.; Sun, Z.; Tang, W.; Kukulka, D.J. Two-phase heat transfer of R410A in annuli outside enhanced tubes with micro-fin and dimple. Int. J. Heat Mass Transf. 2021, 175, 121370. [Google Scholar] [CrossRef]
  9. Borchman, J. Heat transfer of high velocity vapors condensing in annuli. ASHRAE Trans. 1967, 73, VI. 2.1–VI. 2.13. [Google Scholar]
  10. He, Y.; Wu, J.; Li, W.; Dou, B.; Zheng, B.; Zhang, J.; Tang, W. Condensation heat transfer on the outer surface of a horizontal annulus having surface enhancement. Int. J. Heat Mass Transf. 2023, 201, 123588. [Google Scholar] [CrossRef]
  11. Tang, W.; Kulkuka, D.J.; Li, W.; Smith, R. Comparison of the evaporation and condensation heat transfer coefficients on the external surface of tubes in the annulus of a tube-in-tube heat exchanger. Energies 2020, 13, 952. [Google Scholar] [CrossRef]
  12. Wang, S.; Zhou, X.; Lin, P.; Deng, S.; Yang, X. Forced convective condensation of nonazeotropic refrigerant mixtures in horizontal annulus with petal shaped fin tubes. J. Therm. Sci. 1995, 4, 169–173. [Google Scholar] [CrossRef]
  13. Chen, J.X.; Chen, X.; He, Y.; Kukulka, D.; Li, W.; Liu, L.; Ma, L.; Smith, R.; Zhang, B. Investigation on flow condensation of refrigerant in annulus of smooth and enhanced tube-in-tube heat exchanger. Heat Mass Transf. 2019, 55, 223–234. [Google Scholar] [CrossRef]
  14. Miropoloskiy, Z.L.; Shneerova, R.I.; Teputnev, V.V. The influence of steam flowing and condensing in a duct on heat transfer to liquid film. In Proceedings of the International Heat Transfer Conference Digital Library, Toronto, ON, Canada, 7–11 August 1978; Volume 2, pp. 431–436. [Google Scholar]
  15. Shah, M.M. A general correlation for heat transfer during film condensation inside pipes. Int. J. Heat Mass Transf. 1979, 22, 547–556. [Google Scholar] [CrossRef]
  16. Ananiev, E.P.; Boyko, I.D.; Kruzhilin, G.N. Heat transfer in the presence of steam condensation in horizontal tubes. Int. Dev. Heat Transf. 1961, 2, 290–295. [Google Scholar]
  17. McAdams, W. Heat Transmission, 3rd ed.; McGraw-Hill: New York, NY, USA, 1954. [Google Scholar]
  18. Kim, S.; Mudawar, I. Universal approach to predicting heat transfer coefficient for condensing mini/micro-channel flow. Int. J. Heat Mass Transf. 2013, 56, 238–250. [Google Scholar] [CrossRef]
  19. Dorao, C.A.; Fernandino, M. Simple and general correlation for heat transfer during flow condensation inside plain pipes. Int. J. Heat Mass Transf. 2018, 122, 290–305. [Google Scholar] [CrossRef]
  20. Hosseini, S.H.; Moradkhani, M.A.; Valizadeh, M.; Zendehboudi, A.; Olazar, M. A general heat transfer correlation for flow condensation in single port mini and macro channels using genetic programming. Int. J. Refrig. 2020, 119, 376–389. [Google Scholar] [CrossRef]
  21. Moradkhani, M.A.; Hosseini, S.H.; Song, M. Robust and general predictive models for condensation heat transfer inside conventional and mini/micro channel heat exchangers. Appl. Therm. Eng. 2022, 201, 117737. [Google Scholar] [CrossRef]
  22. Nie, F.; Wang, H.; Zhao, Y.; Song, Q.; Yan, S.; Gong, M. A universal correlation for flow condensation heat transfer in horizontal tubes based on machine learning. Int. J. Therm. Sci. 2023, 184, 107994. [Google Scholar] [CrossRef]
  23. Marinheiro, M.M.; Marchetto, D.B.; Furlan, G.; de Souza Netto, A.T.; Tibiriçá, C.B. A robust and simple correlation for internal flow condensation. Appl. Therm. Eng. 2024, 236, 121811. [Google Scholar] [CrossRef]
  24. Moser, K.W.; Webb, R.L.; Na, B. A new equivalent Reynolds number model for condensation in smooth tubes. J. Heat Transf. 1998, 120, 410–416. [Google Scholar] [CrossRef]
  25. Traviss, D.; Rohsenow, W.; Baron, A. Forced-convection condensation inside tubes: A heat transfer equation for condenser design. ASHRAE Trans. 1973, 79, 157–165. [Google Scholar]
  26. Lemmon, E.W.; Huber, L.; McLinden, M.O. NIST Reference Fluid Thermodynamic and Transport Properties; REFPROP Version 9.1; NIST: Gaithersburg, MD, USA, 2013. [Google Scholar]
  27. Alferov, N.S.; Rybin, R.A. Heat transfer in annular channel. In Convective Heat Transfer in Two-Phase and One Phase Flows; Borishanskii, V.M., Paleev, I.I., Eds.; Israel Program for Scientific Translations: Jerusalem, Israel, 1969; pp. 115–134. [Google Scholar]
  28. Shah, M.M. Further study and development of correlations for heat transfer during subcooled boiling in plain channels. Fluids 2023, 8, 245. [Google Scholar] [CrossRef]
  29. Cavallini, A.; Del Col, D.; Doretti, L.; Matkovic, M.; Rossetto, L.; Zilio, C. Condensation in horizontal smooth tubes: A new heat transfer model for heat exchanger design. Heat Transf. Eng. 2006, 27, 31–38. [Google Scholar] [CrossRef]
  30. Kandlikar, S.G. Fundamental issues related to flow boiling in mini channels and micro channels. Exp. Therm. Fluid Sci. 2002, 26, 389–407. [Google Scholar] [CrossRef]
  31. Brauner, N.; Ullmann, A. The prediction of flow boiling maps in minichannels. In Proceedings of the 4th Japanese-European Two-Phase Flow Group Meeting, Kyoto, Japan, 24–28 September 2006. [Google Scholar]
  32. Kew, P.; Cornwell, K. Correlations for prediction of flow boiling heat transfer in small-diameter channels. Appl. Therm. Eng. 1997, 17, 705–715. [Google Scholar] [CrossRef]
  33. Ong, C.L.; Thome, J.R. Macro-to-microchannel transition in two-phase flow: Part 1—Two-phase flow patterns and film thickness measurements. Exp. Therm. Fluid Sci. 2011, 35, 37–47. [Google Scholar] [CrossRef]
  34. Shah, M.M. Applicability of correlations for boiling/condensing in macrochannels to minichannels. Heat Mass Transf. Res. J. 2018; 2, 20–32. [Google Scholar]
Figure 1. Comparison of the new correlation and the Shah [3] correlation with the data of Moriploskiy et al. [14] for steam in an annulus. TSAT = 170 °C, G = 100 kg/m2 s.
Jeta 02 00011 g001
Figure 2. An example of the improvement in predictions of the Shah [3] correlation by modifying it to use DHYD for all parameters. Data of Miropoloskiy et al. [14]. TSAT = 170 °C, G = 200 kg/m2s.
Jeta 02 00011 g002
Figure 3. Comparison of the Shah [3] and the present correlation with the data of Ruzaikin et al. [7] for ammonia in an annulus with gap 2.5 mm. TSAT = 55 °C, G = 122 kg/m2s.
Jeta 02 00011 g003
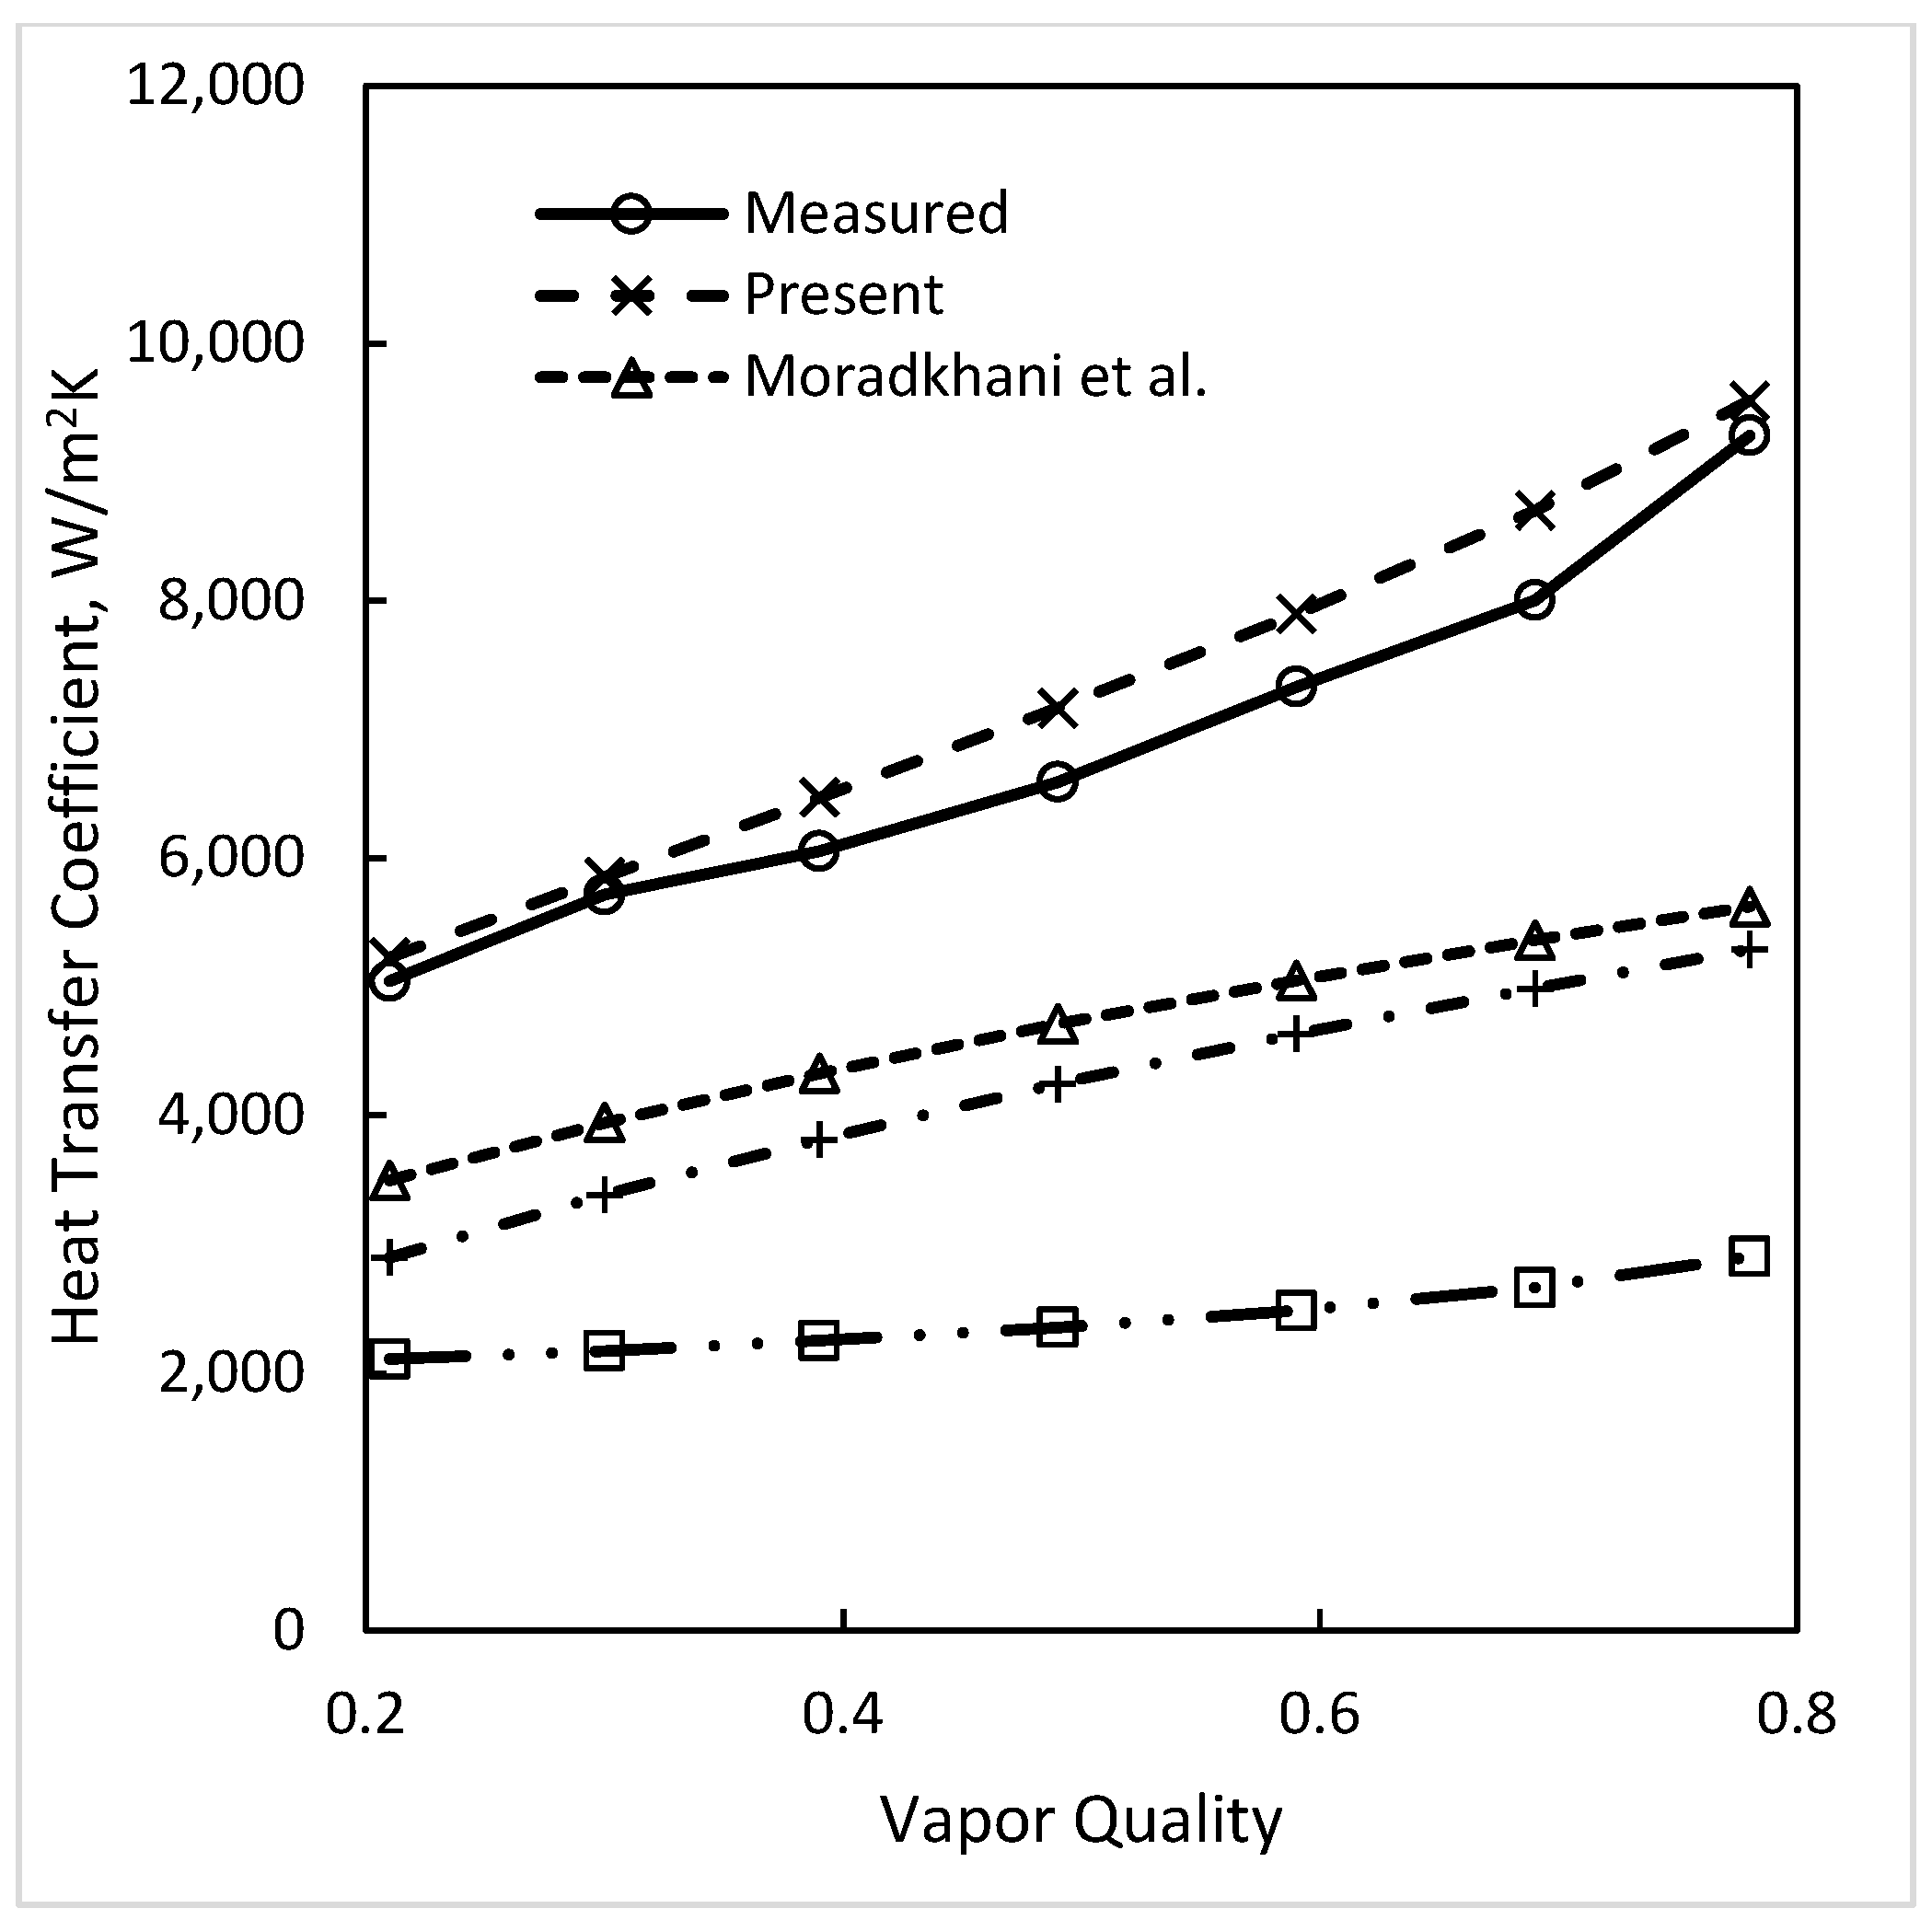
Figure 4. Comparison of the data of Ruzaikin et al. [7] for the annulus with annular gap of 1 mm with the present and other correlations. TSAT = 65 °C, G = 160 kg/m2 s. Including correlations of Hosseini et al. [20], Moradkhani et al. [21], Marinheiro et al. [23].
Jeta 02 00011 g004
Figure 5. Comparison of the Shah [3] and present correlations with data of Chen et al. [13]) for R-22 in an annulus with annular gap of 6.15 mm. Fluid R-22, TSAT = 45 °C, average quality 0.45.
Jeta 02 00011 g005
Figure 6. Comparison of the new and some published correlations with the data of Miropoloskiy et al. [14] TSAT = 234 °C, G = 200 kg/m2 s. Including correlations of Hosseini et al. [20], Moradkhani et al. [21], Moser et al. [24].
Jeta 02 00011 g006
Figure 7. Comparison of the data of He et al. [10] with various correlations. TSAT = 45 °C, G = 94 kg/m2 s. Including correlations of Hosseini et al. [20], Moradkhani et al. [21], Marinheiro et al. [23], Moser et al. [24].
Jeta 02 00011 g007
Figure 8. Data of Ruzaikin et al. [7] compared to various correlations. Annular gap 2.5 mm, TSAT = 55 °C, G = 50 kg/m2 s, WeGT = 50, Shah heat transfer regime II. Including correlations of Moradkhani et al. [21].
Jeta 02 00011 g008
Figure 9. Data of Chen et al. [13] for R-410A compared to various correlations. DHYD = 12.3 mm, TSAT = 45 °C, average quality 0.45, heat transfer Regime II. Including correlations of Moradkhani et al. [21], Marinheiro et al. [23], Moser et al. [24].
Jeta 02 00011 g009
Figure 10. Data of Chen et al. [13] for R-22 compared to various correlations. DHYD = 12.3 mm, TSAT = 45 °C, average quality 0.45, heat transfer Regime II. Including correlations of Hosseini et al. [20], Moradkhani et al. [21], Marinheiro et al. [23], Moser et al. [24].
Jeta 02 00011 g010
Table 2. Results of comparison of test data for annuli with various correlations.
SourceDout/Din
mm/mm
(Orient.)
Dhyd
(DHP)
mm
FluidNDeviation, %
Mean Absolute
Average
Kim & Mudawar [18]Ananiev et al. [16]Dorao & Fernandino [19]Hosseini et al. [20]Moradkhani et al. [21]Moser et al. [24]Marinheiro et al. [23]Shah [3]New Correlation
Li et al. [8] *17/12.7 (H)4.3
(10.5)
R-410A1310.1
−6.2
12.5
−9.0
24.9
24.9
17.7
17.7
29.3
29.3
22.9
22.1
21.3
21.3
10.5
5.2
17.8
15.6
Borchmann [9] 38/ 31.2
(H)
6.8
(15.0)
R-11513.1
−6.5
28.1
−28.1
33.5
−33.5
16.6
−16.3
5.6
−2.0
20.9
−20.9
24.3
−24.3
30.3
−30.3
24.1
−17.1
He et al. [10]22.0/16.0 (H)6.0 (14.2)R-410A1853.2
−53.3
66.8
−66.1
36.4
−36.4
30.1
−30.1
44.6
−44.6
50.9
−50.9
47.6
−47.6
46.5
−46.5
33.0
−33.0
Tang et al. [11]26.0/19.05 (H)6.95
(16.4)
R-134a618.1
−18.1
29.3
−29.3
29.4
29.4
61.1
61.1
16.3
16.3
7.6
5.3
16.5
16.5
14.5
14.5
41.7
41.7
25.0/19.05 (H)5.9
(13.7)
R-134a720.7
20.7
10.4
10.1
77.2
77.2
129.2
129.2
62.2
62.2
52.1
52.1
65.4
65.4
52.0
52.0
87.7
87.7
Wang et al. [12]26.0/15.8
(H)
10.2 (27.0)R-111062.2
−25.4
64.0
−64.0
34.6
−34.6
40.0
−40.0
38.9
−38.9
55.9
−55.9
44.6
−44.6
46.8
−46.8
31.5
−31.5
Chen et al. [13]17.0/12.7
(H)
4.3
(10.1)
R-410A912.3
0.9
23.6
−15.6
23.2
22.6
22.2
22.2
28.1
20.9
29.7
18.4
22.6
16.3
11.7
−6.6
19.9
13.7
R-22825.9
17.4
21.6
−16.7
18.0
17.8
9.0
8.7
24.7
19.1
23.7
10.2
21/8
18.0
7.8
−6.8
16.3
12.6
25.0/12.7
(H)
12.3
(38.1)
R-4102249.8
−32.9
76.5
−76.5
33.3
−31.2
42.9
−42.9
49.1
−49.1
4.3
−64.3
53.1
−53.1
45.7
−45.7
27.6
−25.7
R-228130.1
122.5
76.3
−76.3
22.5
−22.5
53.7
−53.7
45.7
−45.7
64.9
−64.9
48.2
−48.2
34.1
−34.1
9.9
−9.9
Miropoloskiy et al. [14]21.7/18.0
(VD)
3.7
(8.16)
Water9620.7
18.9
12.2
0.3
27.9
−17.4
29.0
−23.0
28,1
−19.7
26.8
−26.8
27.6
−21.7
23.7
−23.7
12.7
−10.6
Ruzaikin et al. [7]8.0/6.02.0
(4.7).
NH36062.0
62.0
32.4
32.3
29.2
29.2
13.4
−2.7
55.3
55.3
18.3
17.3
31.1
31.1
34.9
34.7
15.0
13.1
11.0/6.05.0
(14.2)
5032.3
20.5
24.8
−24.4
11.9
4.0
22.8
−1.7
20.6
−20.5
31.4
−31.4
15.5
−12.8
15.0
−3.6
15.0
−3.6
All sources 31238.1
18.2
30.2
−13.1
27.2
−1.2
28.5
−9.9
35.5
−3.2
31.8
−18.2
30.4
−8.7
25.3
−26.5
19.2
−2.4
Table 3. Comparison of deviations from data of the published Shah [25] correlation and its modification.
SourceDout/Din
Mm/mm
(Orient.)
Dhyd
(DHP)
mm
Fluid
(Glide, K) **
NDeviation, %
Mean Absolute (Upper Line)
Average (Lower Line)
Shah [3] PublishedShah [3]
DHYD Used Throughout
Shah [3] with Alferov-Rybin Cor.New Correlation
Li et al. [8]17.0/12.7
(H)
4.3
(10.5)
R-410A
(0.1)
1310.5
5.2
17.8
15.6
12.6
6.1
17.8
15.6
Borchmann [9]38/ 31.2
(H)
6.8
(15.0)
R-11530.3
−30.3
24.1
−17.1
31.4
−31.1
24.1
−17.1
He et al. [10]22.0/16.0 (H)6.0 (14.2)R-410A
(0.1)
1846.5
−46.5
33.0
−33.0
40.2
−40.2
33.0
−33.0
Tang et al. [11]26.0/19.05 (H)6.95
(16.4)
R-134a614.5
14.5
41.7
41.7
25.3
25.3
41.7
41.7
25.0/19.05 (H)5.9
(13.7)
R-134a752.0
52.0
87.7
87.7
63.8
63.8
87.7
87.7
Wang et al. [12]26.0/15.8
(H)
10.2 (27.0)R-111046.8
−46.8
31.5
−31.5
35.0
−35.0
31.5
−31.5
Chen et al. [13]17.0/12.7
(H)
4.3
(10.1)
R-410911.7
−6.6
19.9
13.7
13.7
0.3
19.9
13.7
R-2287.8
−6.8
16.3
12.6
7.7
−1.1
16.3
12.6
25.0/12.7
(H)
12.3
(38.1)
R-4102245.7
−45.7
27.6
−25.7
27.1
−24.8
27.6
−25.7
R-22834.1
−34.1
9.9
−9.9
9.9
−9.9
9.9
−9.9
Miropoloskiy et al. [14]21.7/18.0
(VD)
3.7
(8.16)
Water9623.7
−23.7
12.7
−12.6
26.0
−26.0
12.7
−12.6
Ruzaikin et al. [7]8.0/6.0
(H)
2.0
(4.7)
Ammonia6015.0
13.1
34.9
34.7
14.8
−5.7
15.0
13.1
11.0/6.0
(H)
5.0
(14.2)
5024.7
−24.3
15.0
−3.6
19.1
18.0
15.0
−3.6
All sourcesMAD %, giving equal weight to each data point31225.3
−26.5
23.0
1.7
23.2
−9.2
19.2
−2.4
** Glide give only for mixtures.
Table 4. Complete range of data for which the present correlation has been verified. All annuli were cooled only on the inner tube.
ParameterRange
DHYD, mm2.0–12.3
DHP, mm8.2–27.0
Annular gap, mm1.0–6.15
DOUT/DIN1.2–1.97
FluidsWater, ammonia, R-11, R-22, R-113, R-134a, R-410A
Flow directionHorizontal, vertical downwards
pr0.0236–0.5542
G, kg/m2 s9–600
x0.02–1.0
ReLT1245–42,884
WeGT8–805
FrLT0.00084–338
Disclaimer/Publisher’s Note: The statements, opinions and data contained in all publications are solely those of the individual author(s) and contributor(s) and not of MDPI and/or the editor(s). MDPI and/or the editor(s) disclaim responsibility for any injury to people or property resulting from any ideas, methods, instructions or products referred to in the content.