
Statistical Evaluation of the Accuracy of Consumer Drone Photogrammetry at a Romanesque Church in Eastern Bavaria (Germany)

1
Z V—Zentrallabor & Geo-Erkundung, Bavarian State Department for Monuments and Sites (BLfD), Hofgraben 4, 80539 Munich, Germany
2
Department for Earth and Environmental Sciences, Institute for Geophysics, Ludwig-Maximilians-University Munich, Theresienstr. 41/IV, 80333 Munich, Germany
3
geo-konzept GmbH, Wittenfelder Str. 28, 85111 Adelschlag, Germany
*
Author to whom correspondence should be addressed.
NDT 2024, 2(2), 76-86; https://doi.org/10.3390/ndt2020005
Submission received: 22 March 2024
/
Revised: 3 April 2024
/
Accepted: 4 April 2024
/
Published: 11 April 2024
Abstract
:For several years, photogrammetric surveys are quite often applied for surveying cultural heritage. For a detailed and accurate result, it is indispensable that the calculated point cloud represents the original geometry of the building in high quality, with vertical and horizontal structures in the same manner. Whereas many published papers in the field of digital heritage documentation are dealing with creating such models or using photogrammetric data for damage detection, only a few papers are investigating the crucial fact of accuracy and how it can be influenced by the used camera resolution. We want to present a case study, in which we compare the photogrammetric point cloud of a normal consumer drone with a high-end device. Beside the actual survey results showing the details of a Romanesque church, a statistical calculation of deviation is shown. It becomes evident that there is only a difference within some millimetres between the corresponding point clouds in most parts of the monument. Hence, it can be stated that, for most applications in heritage protection, affordable consumer unmanned aerial vehicles (UAVs) are sufficient. Only if faint details have to be resolved will a better resolution of the mounted camera be required.
1. Introduction
For many applications in modern cultural heritage management, high-resolution surveys, showing even fine details of the building construction and its state of preservation, are required. For several decades, digital methods as total stations and laser scanning have been standard and reliable methods. Especially for terrestrial laser scanning (TLS), several case studies treating historical monuments are published from all over the world, e.g., China [1], Turkey [2], Syria [3], or Poland [4]. The advantage of such remote approaches, compared with manual surveys directly at the facades, is that no additional equipment, e.g., ladders or scaffolds, are needed. Besides saving time, occupational safety is increased and costs are reduced dramatically. For some years, the development of affordable, powerful, and reliable unmanned aerial vehicles (UAVs) opens new possibilities within digital heritage documentation. The use of drone photogrammetry or structure from motion (SfM) mainly covers the field of the so-called building information modelling (BIM) and construction research (e.g., [5,6,7,8,9,10]). Another common task is damage detection, which is published, for example, for Italy [11,12,13], Germany [14,15,16], or Turkey [17].
A detailed and mathematical evaluation of accuracy is mainly limited to the comparison of SfM and TLS, e.g., in Thailand [18], Tibet [19], Georgia [20] and Italy [21]. In contrast, the scope of the presented paper is to analyse the influence of different camera types on the results in mapping a historical building statistically. The main advantage of using photogrammetry instead of TLS is that not only the vertical facades of a historic building, but, furthermore, also the roofs and other horizontal parts can be mapped in detail. Furthermore, RGB colour information can be added to the point cloud from the individual photos directly.
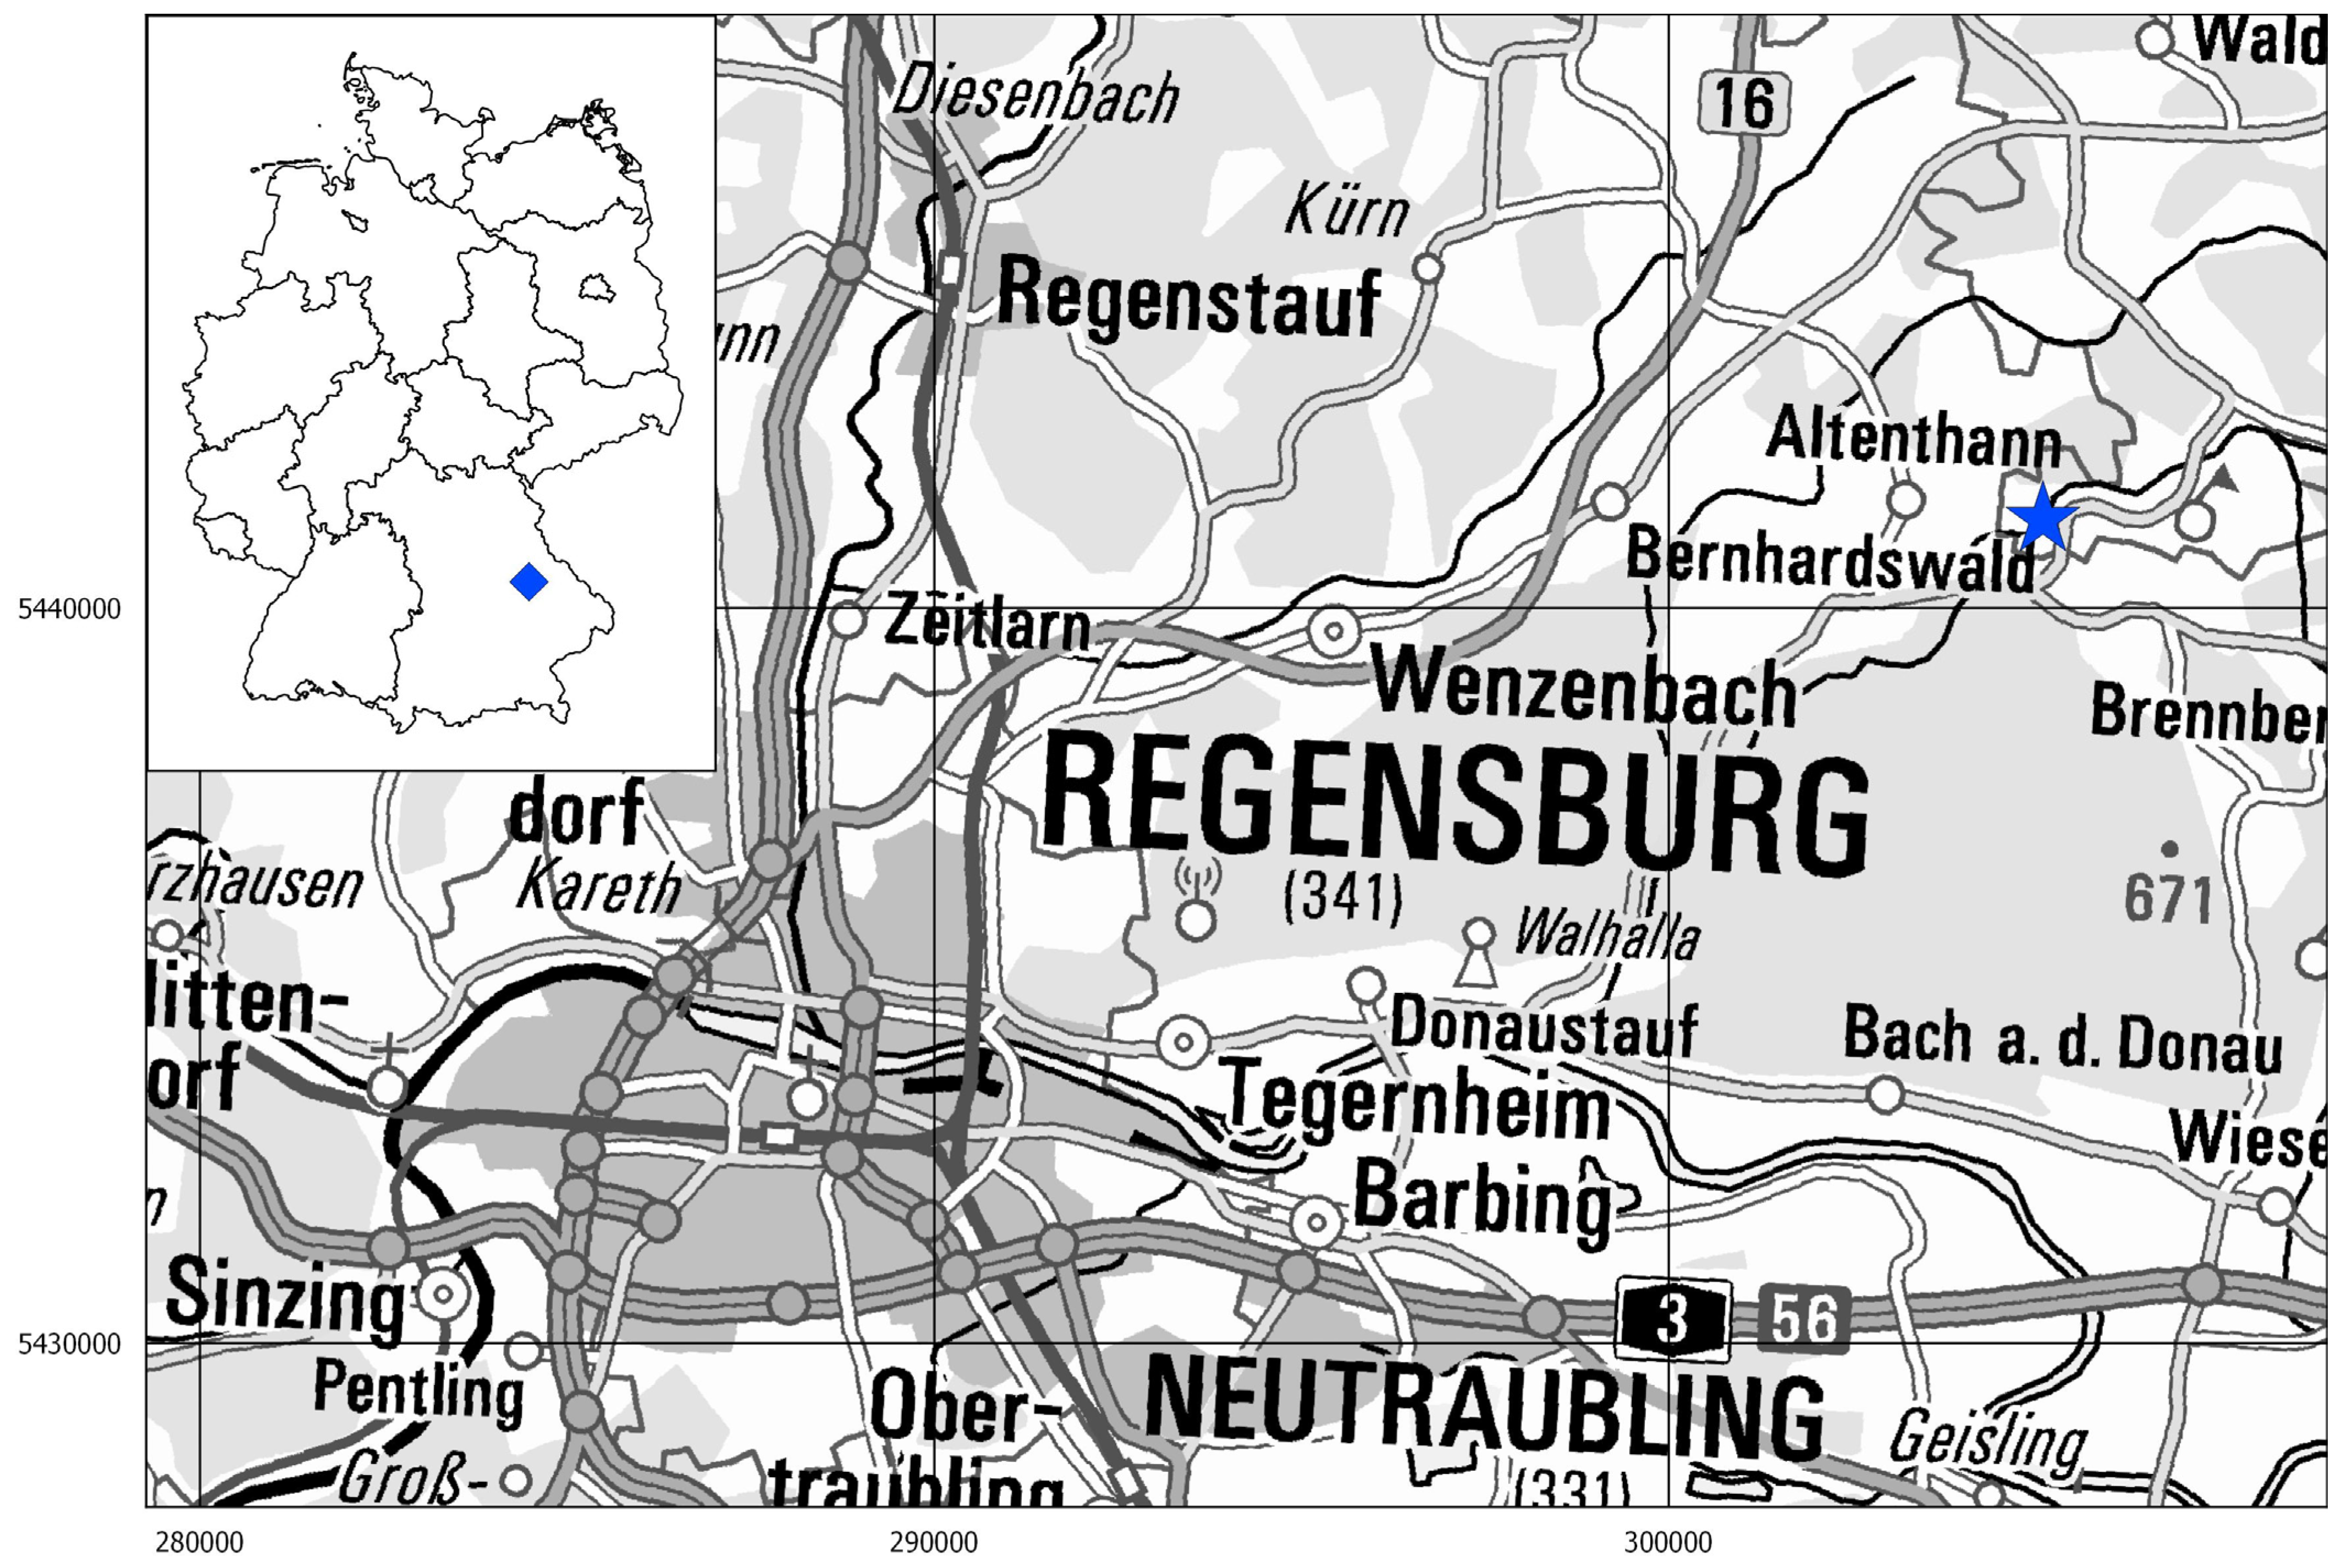
For our analysis, we chose the small church St. Ägidius in Schönfeld as the test site. It has a quite simple geometry and, hence, is very suitable for evaluating even subtle deviations between the datasets. Schönfeld is located approximately 19 km northeast of Regensburg in the Upper Palatinate in Eastern Bavaria (Figure 1). The region between the rivers Danube and Regen is named “Falkensteiner Vorwald” [22]. The church St. Ägidius itself is situated in a rural area at a slightly inclined slope towards the Ottenbach.
In medieval times (12th and 13th century), a local noble family, being ministry officials of the bishop of Regensburg, had their residence there. Therefore, St. Ägidius possibly had been a former castle chapel [23,24]. It is unknown when the castle in Schönfeld was abandoned. However, it was supposedly quite early, as, already in 1568, Philipp Apian only named the church St. Ägidius in his “Landtafeln”, the first maps of Bavaria [24]. For this reason, there are doubts about the existence of such a castle and St. Ägidius is assigned to the so-called solitary fortified churches or churches with a secular upper floor [25]. These sacral buildings are mainly located in the region ”Altbayern” (i.e., the origin regions of Bavaria) and there is a cluster in the hilly country of the Eastern Upper Palatinate, the central Altmühl valley, the area between the Danube and Altmühl, and around Regensburg. Today, 88 churches with a secular upper floor are preserved in Bavaria and 66% of these belong to the Diocese Regensburg [25].
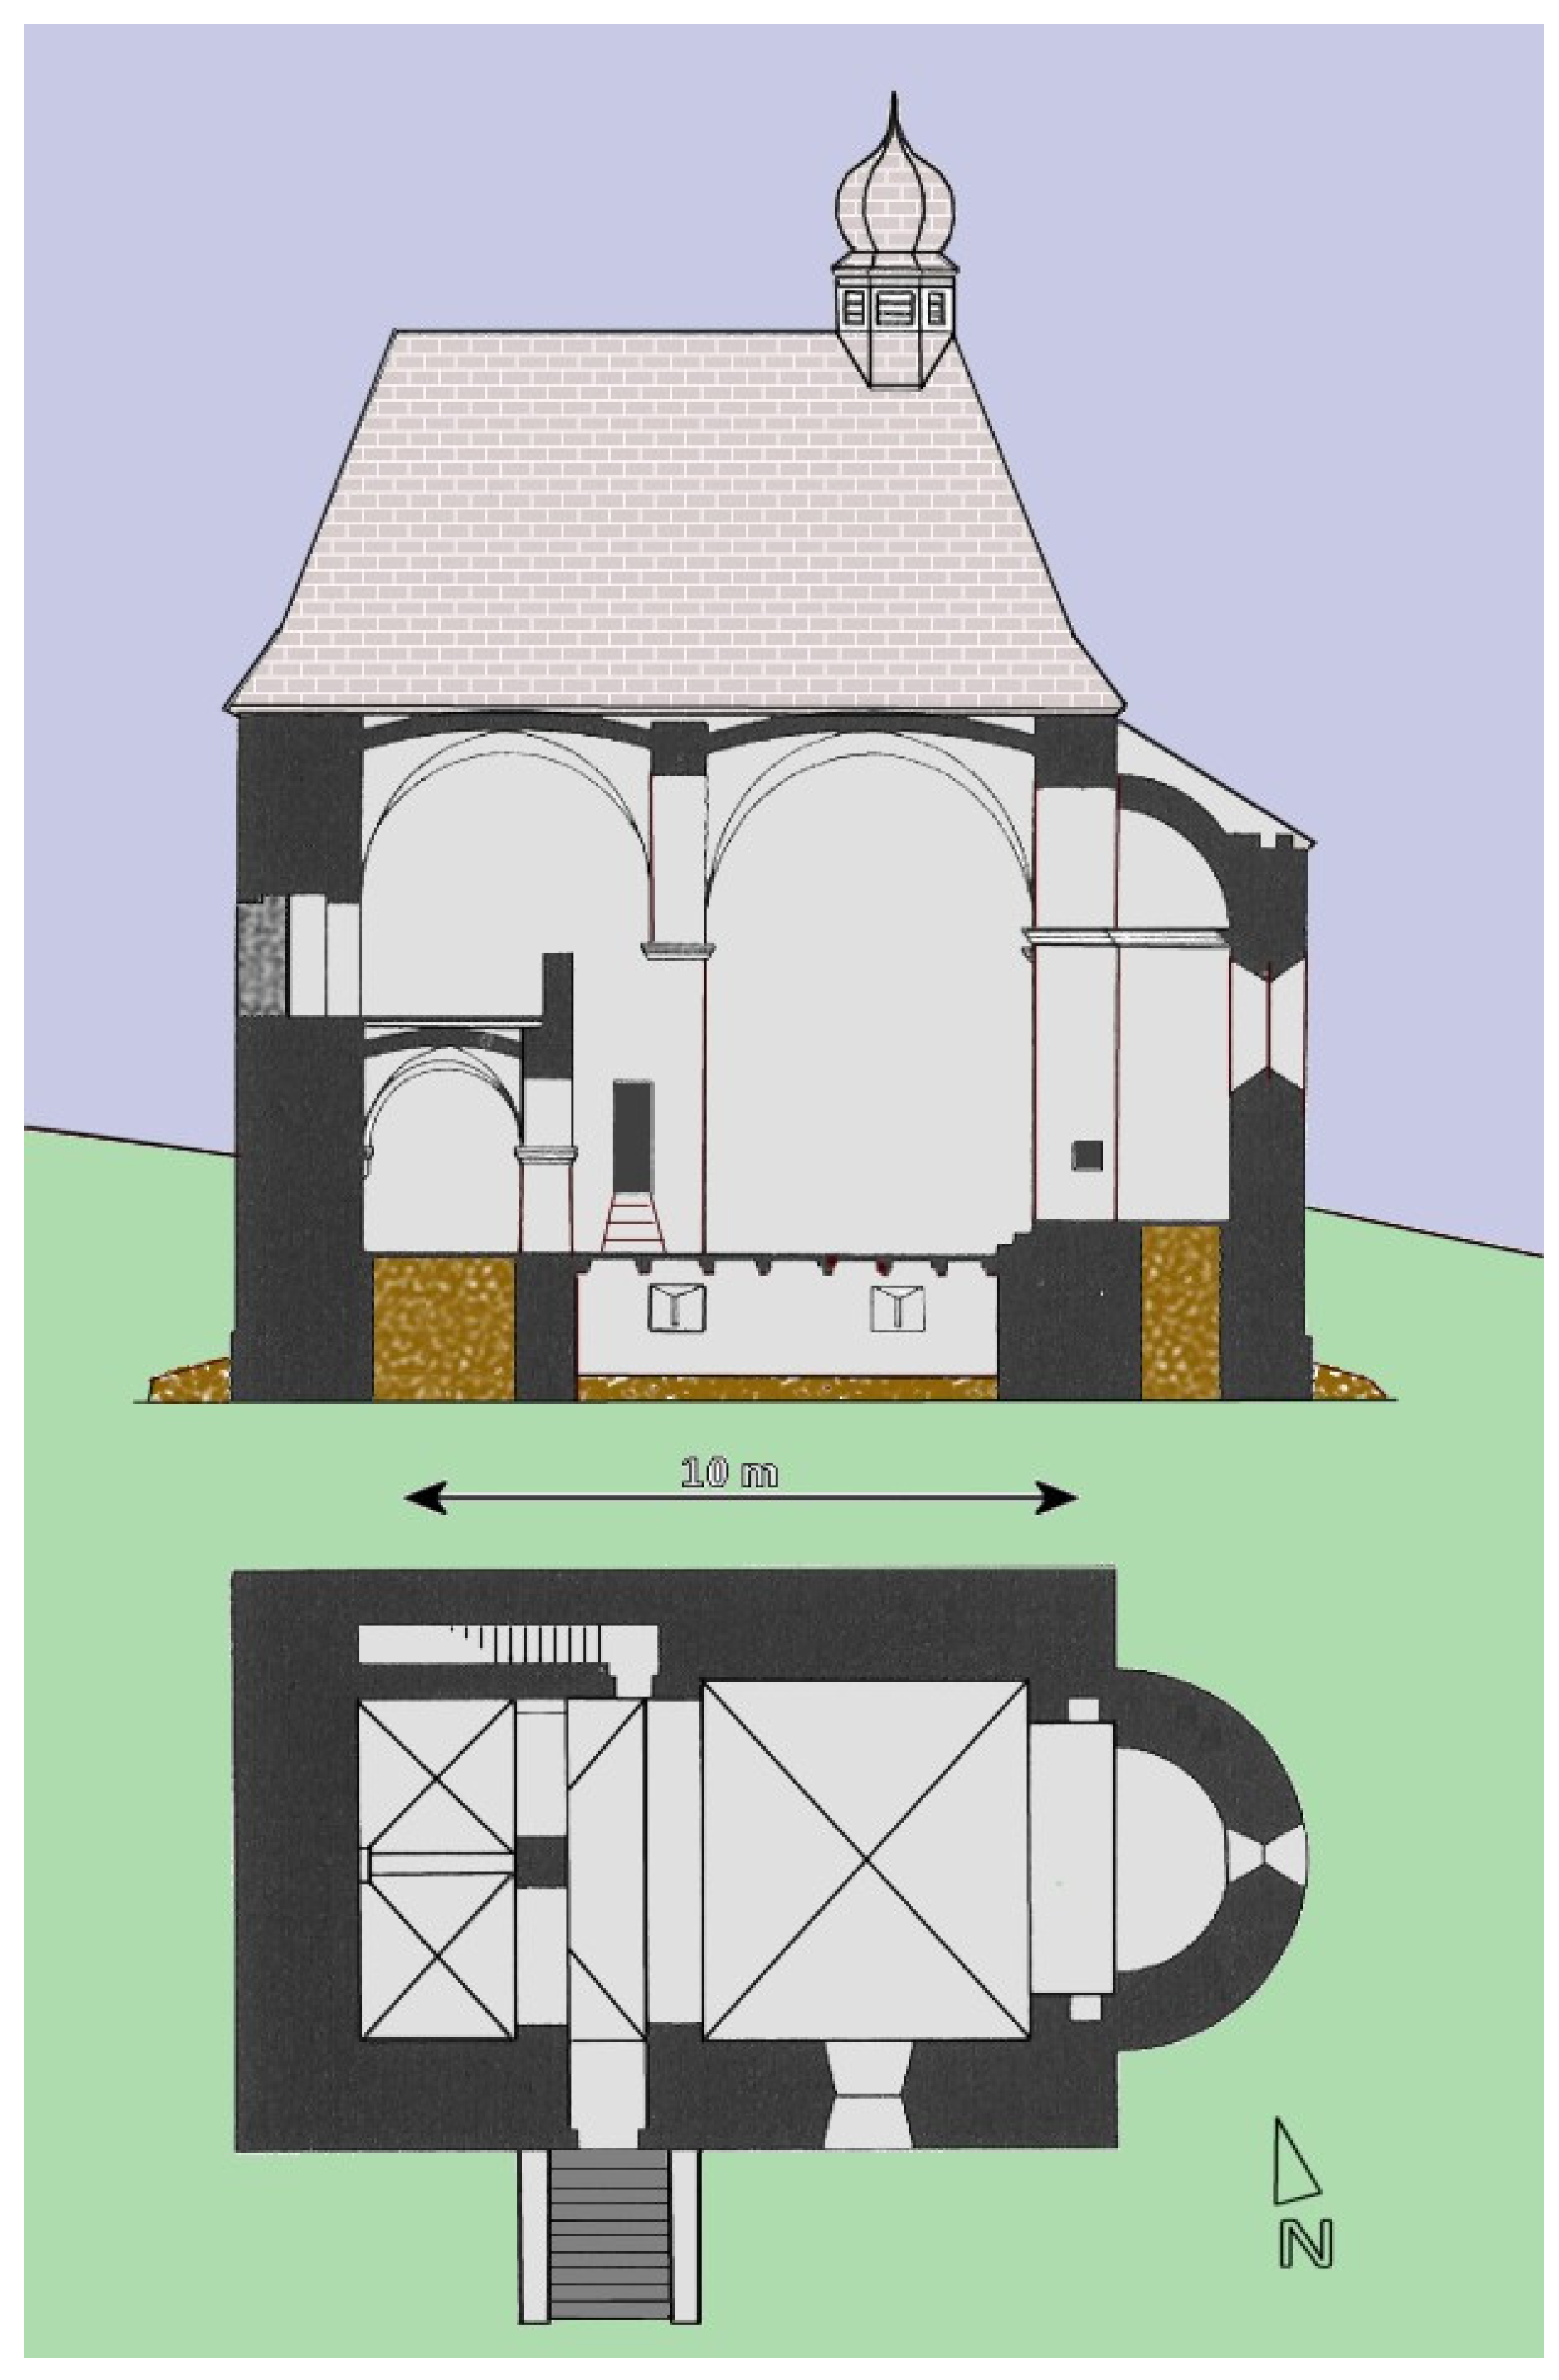
St. Ägidius in Schönfeld was built in 1160/70 as a Romanesque hall church. It is single-nave and has a semi-circular indented apse towards the East [23,24]. The walls consist of coarse-grained granite blocks that are carefully hewn and stacked nearly mortarless [25,26]. The interior comprises two trusses that are separated by a traverse arch. The latter rests on a pilaster in the South and an impost in the North. The impost results from a jutty, hiding a staircase to the western gallery [23,24]. In former times, the gallery was additionally accessible via a high entrance in the western wall that is, nowadays, bricked up. The nave has a size of 9.5 × 14.3 m and a height of 8.57 m; the outer walls are 1.7 m thick [24]. The church can be entered through a Romanesque round-arched portal in the south, which is accessible by 10 steps, as the nave is lying 1.8 m above the surrounding level. The reason is a secular cellar below the church, a detail that is very uncommon [24]. Only two windows are illuminating the nave: two Romanesque ones on the southern side, of which one is partly bricked today, and a low-lying, bigger Baroque one. There is a historical tradition that the wall had to be blasted for opening the Baroque window because of its thickness [26]. The apse has another Romanesque window [23,24]. The hipped roof is covered by cut stone shingles; its ridge turret with a small dome is claimed to have been erected in the 18th century [23] or even later in 1853 [26]. Nowadays, the former secular upper floor is removed [25]. Figure 2 shows the layout and a cross-section of St. Ägidius to visualise all the above-mentioned building details.
2. Materials and Methods
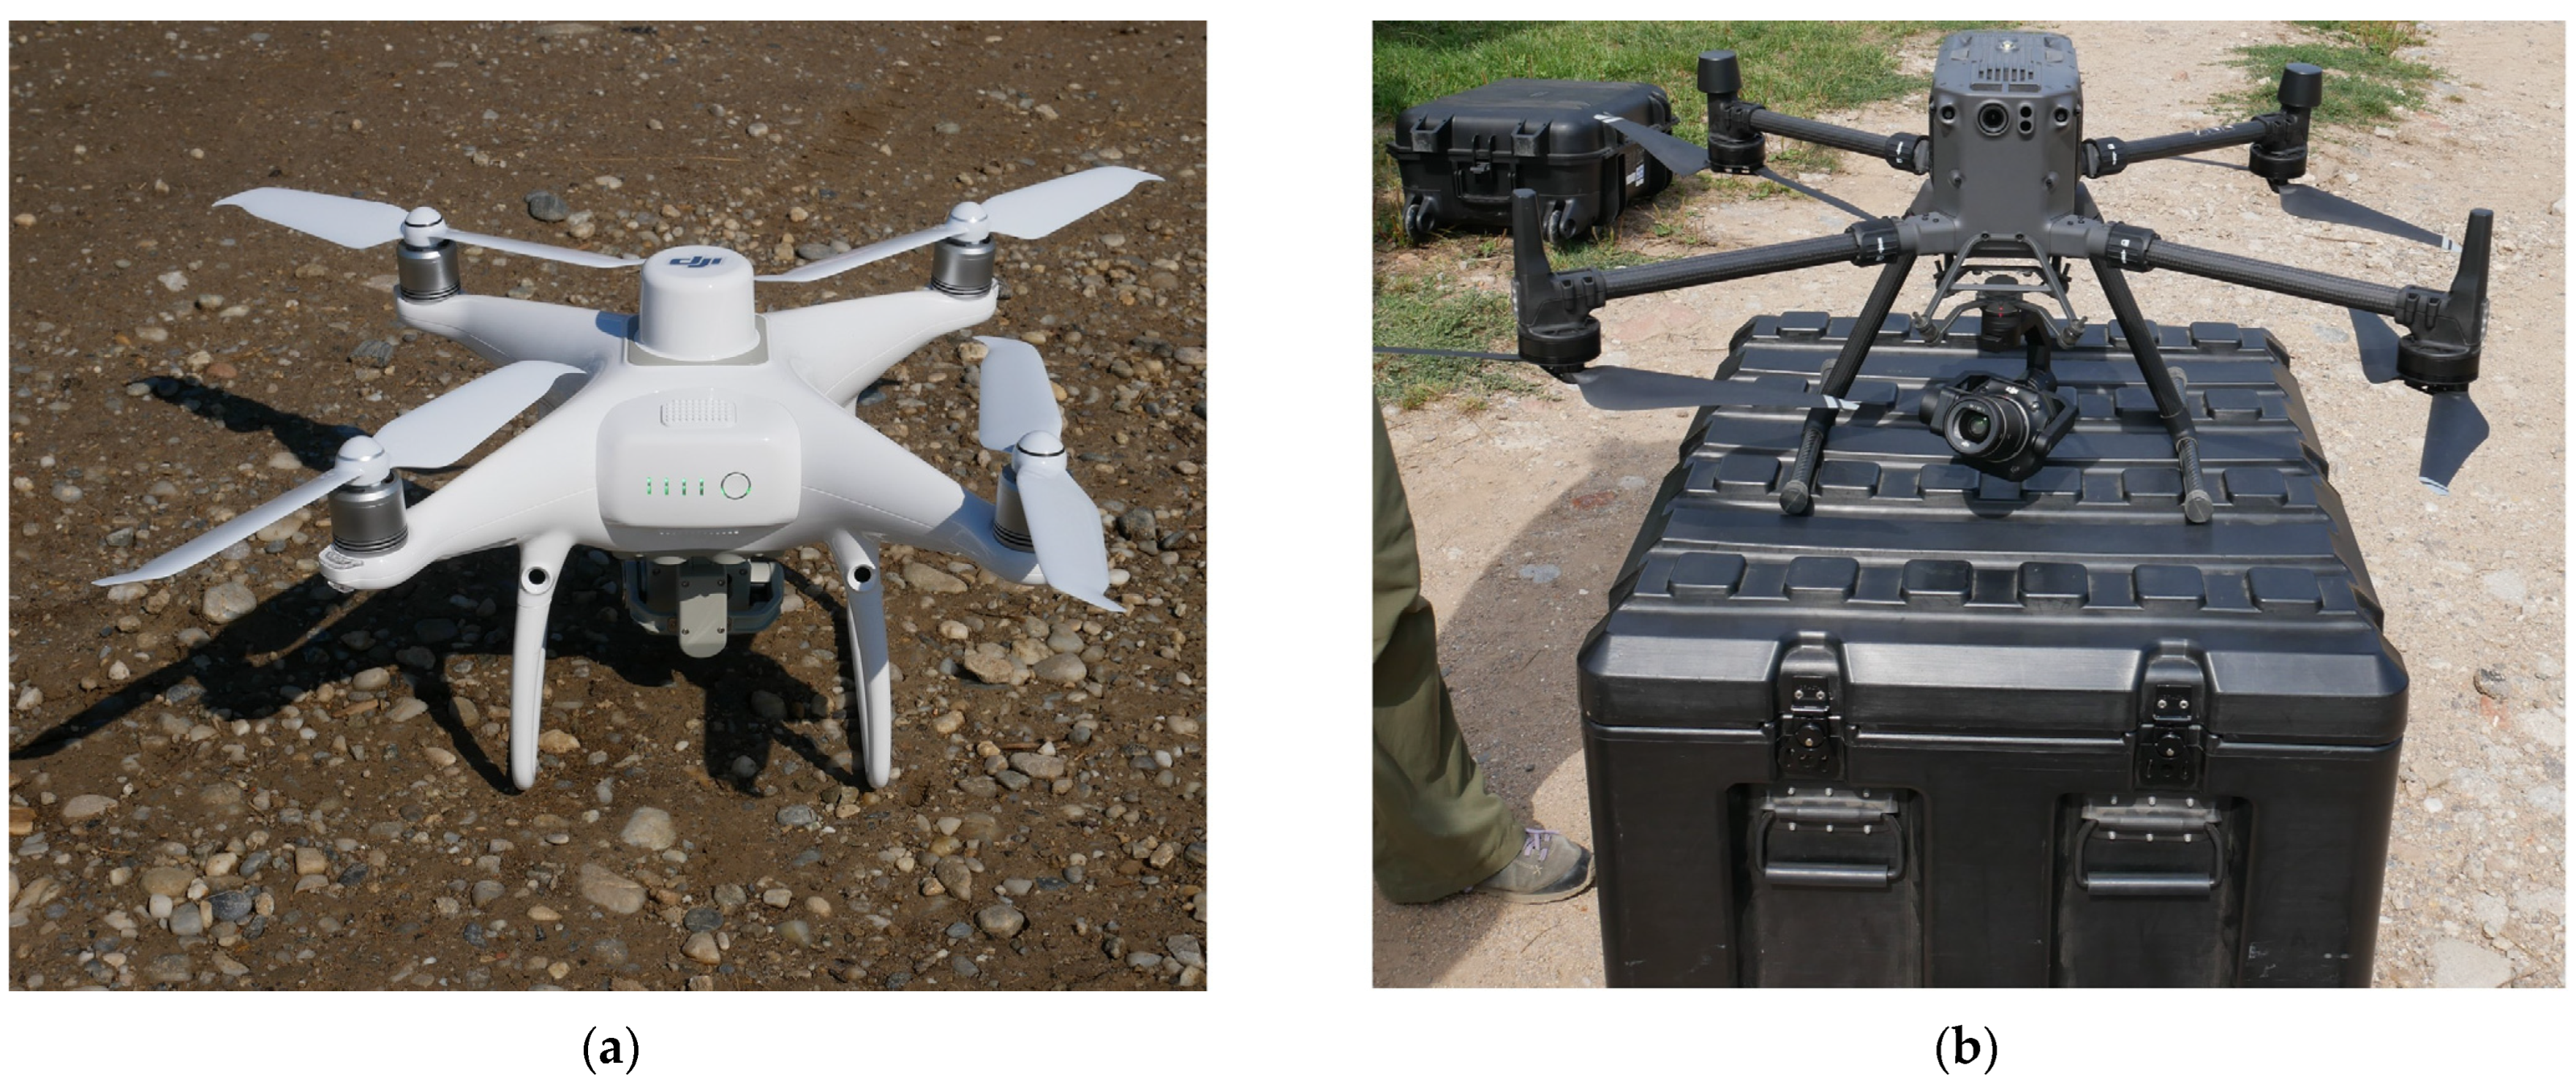
The photogrammetric survey at Schönfeld comprised two parts: the church was mapped with a DJI P4RTK, a standard consumer UAV system, and a DJI M300 equipped with a Zenmuse P1 camera, a high-end device. The aim was to evaluate if there is a difference in data quality and accuracy depending on the resolution of the individual images, as well as the different acquisition modes.
The DJI P4RTK is a 2 kg maximum take-off-weight (MTOW) consumer drone that is widespread in the field of historical monument research (Figure 3a). It is equipped with a permanently installed camera that uses a 1″ CMOS sensor resulting in 20 Megapixel resolution and a lens with 8.8 mm focal length (see Table 1 for comparison) [28]. Due to its global shutter, the single images can be taken without stopping the drone, as no blur effect that is typical for rolling shutter cameras is occurring. The camera mode was set to automatic mode to gather images in best available quality. The SfM mapping was executed in a cross-grid manner in 40 m flight altitude and 85% overlap in both directions. This automatic flight was planned in the app “DJI Pilot”. In total, 59 single images with nadir camera angle were taken in this flight. For a better mapping of the vertical structures like the facades of the church, a manual circular flight with oblique camera angle in 360° around the object gathered 31 additional photos. The latter should imitate the Smart Oblique mode of the M300 described below. This results in a ground-sampling distance (GSD) of 9 mm and a coverage of every part of the church by more than nine single images.
The DJI Matrice 300 RTK is an industrial drone of 9 kg MTOW that can be equipped with exchangeable cameras (Figure 3b). For the purpose in Schönfeld, we mounted a Zenmuse P1 camera that uses a full-frame sensor of 45 Megapixel resolution and a 35 mm lens (Table 1) [29]. The camera was set to a semi-automatic shutter-priority mode with an ISO value of 400 and a shutter of 1/1000 s. The “DJI Pilot” app for the Zenmuse P1 offers a special operation mode called Smart Oblique mode. In this acquisition mode, the camera is steered automatically in a way that photos from varying angles are taken, always showing the target object in the centre. Hence, a combination of nadir images and oblique ones with different inclination angles ranging from −45° to −90° is generated in one cross-grid flight [30]. This mode generates a huge number of photos: in our case study, it comprises 304 individual photos. The survey in Schönfeld was executed in 50 m altitude with an image overlap of 85%. This results in a GSD of 6 mm, despite the 10 m higher flight altitude, and, again, a coverage of the church by more than nine images from all directions.
Despite the utilised UAVs already providing co-ordinates for the data in RTK accuracy (RTK = Real Time Kinematic, i.e., <5 cm accuracy), four ground control points (GCPs) were lain out equally distributed around the church in Schönfeld to guarantee that the resulting point clouds are comparable with regard to their location. A Stonex S900A, an RTK-GNSS-system (GNSS = Global Navigation Satellite System), was used to survey the GCPs afterwards. During data processing of the photogrammetric flights in Agisoft Metashape, for both datasets, the same parameters were applied to prevent a difference in the point clouds caused by processing.
3. Results
The resulting point cloud of the P4RTK data comprises approximately five million points. In contrast, the dataset produced with the Zenmuse P1 camera has more than twice the amount of points and twice the average point density due to the high resolution of the sensor. Table 2 shows the detailed parameters for the two point clouds.
Comparing the output of the surveys reveals that the church St. Ägidius is represented very well in both datasets (Figure 4a,b). Even fine details like the golden spheres at the top of the roof and the ridge turret are visualised in the 3D models (Figure 4c,f). Furthermore, the damage and areas of repair work, for example, the bricked-up high entrance in the west (Figure 4d,g), as well as the parts of the roof covered by moss or missing slats (Figure 4e,h), can be identified in the photogrammetric data. Due to the acquisition geometry in oblique from above, there are some empty areas in the point cloud near to the protruding roof of the church’s nave and apse.
A detailed comparison of the two point clouds shows that the window recesses and the golden spheres especially are better represented by the Zenmuse P1 data, because this camera could be operated in the highly sophisticated Smart Oblique Capture mode. A huge restriction of the mode, nevertheless, is that the UAV must be partly operated far away from the real object above nearby buildings and estates to guarantee a view of the target from all perspectives. For the example of St. Ägidius in Schönfeld, this is as far as 83 m, compared to 23 m for the DJI P4RTK flight. Sometimes, such a large operation radius can cause problems with the surrounding neighbours or might even be impossible due, for example, vegetation, roads, or power lines. Another crucial difference between the two datasets is that the different camera settings (i.e., the automatic mode for P4RTK and shutter priority for Zenmuse P1) cause variations in the colours of the models. Partly, the vertical facades appear slightly overexposed in the P4RTK model due to the strong sunlight illumination at the acquisition time in August 2022 that causes problems for the automatic white balance.
4. Discussion
Until now, most comparisons of photogrammetric point clouds had been with those of TLS. The published research in this field mentions deviations of 1–3 cm [18,19,20,21]. In contrast, we want to evaluate the difference between two point clouds of photogrammetric flights, but with different camera types. The statistical calculations presented in the following were mainly executed in the free software CloudCompare v.2.12.4 [31]. To create comparable datasets, both point clouds were limited to the same extent covering only the church and the surrounding flat terrain including a small heap of earth and, of course, the location of the GCPs.
The statistical calculation of the deviation between the two results is based on a point–mesh difference. This prevents, contrary to a point–point calculation, the generation of any artificial error simply by small variations in the point distribution. As a base mesh, the Zenmuse P1 data were used; the P4RTK data served as the point cloud to be compared. The colourised difference is shown in Figure 5.
A statistical analysis reveals that the mean deviation is 0.1 cm at a standard deviation of 2 cm. The maximum occurring error is 15.3 cm. This results in a nearly perfect Gaussian spreading of the error. It becomes evident that, already within the range of ±5 mm, more than 50% of the data can be found. In a range of ±2 cm, even 99% of the data occurs and errors beyond this value mainly concern the window recesses and the tip of the ridge turret (Figure 5d). Hence, these maximum values are governed rather by the different acquisition geometry than by the data quality itself: The Smart Oblique mode of the Zenmuse P1 produces images with shallower inclination angles in more diverse perspectives than the crossgrid flight of the P4RTK combined with some manual oblique photos. This fact can also be seen at the church spire that is better represented by the higher resolution and number of points of the Zenmuse P1. Another influencing factor could be the varying acquisition mode resulting in some problems with the white balance for the P4RTK, as the error is higher in regions that are in direct sunlight. Furthermore, the slightly different acquisition time may not be totally disregarded here: both flights were executed around noon with a steep sun angle in August. However, within the 30 mins in-between the first and last photo of the two flights, the shadow has slightly moved. This also causes differences in the photogrammetric model.
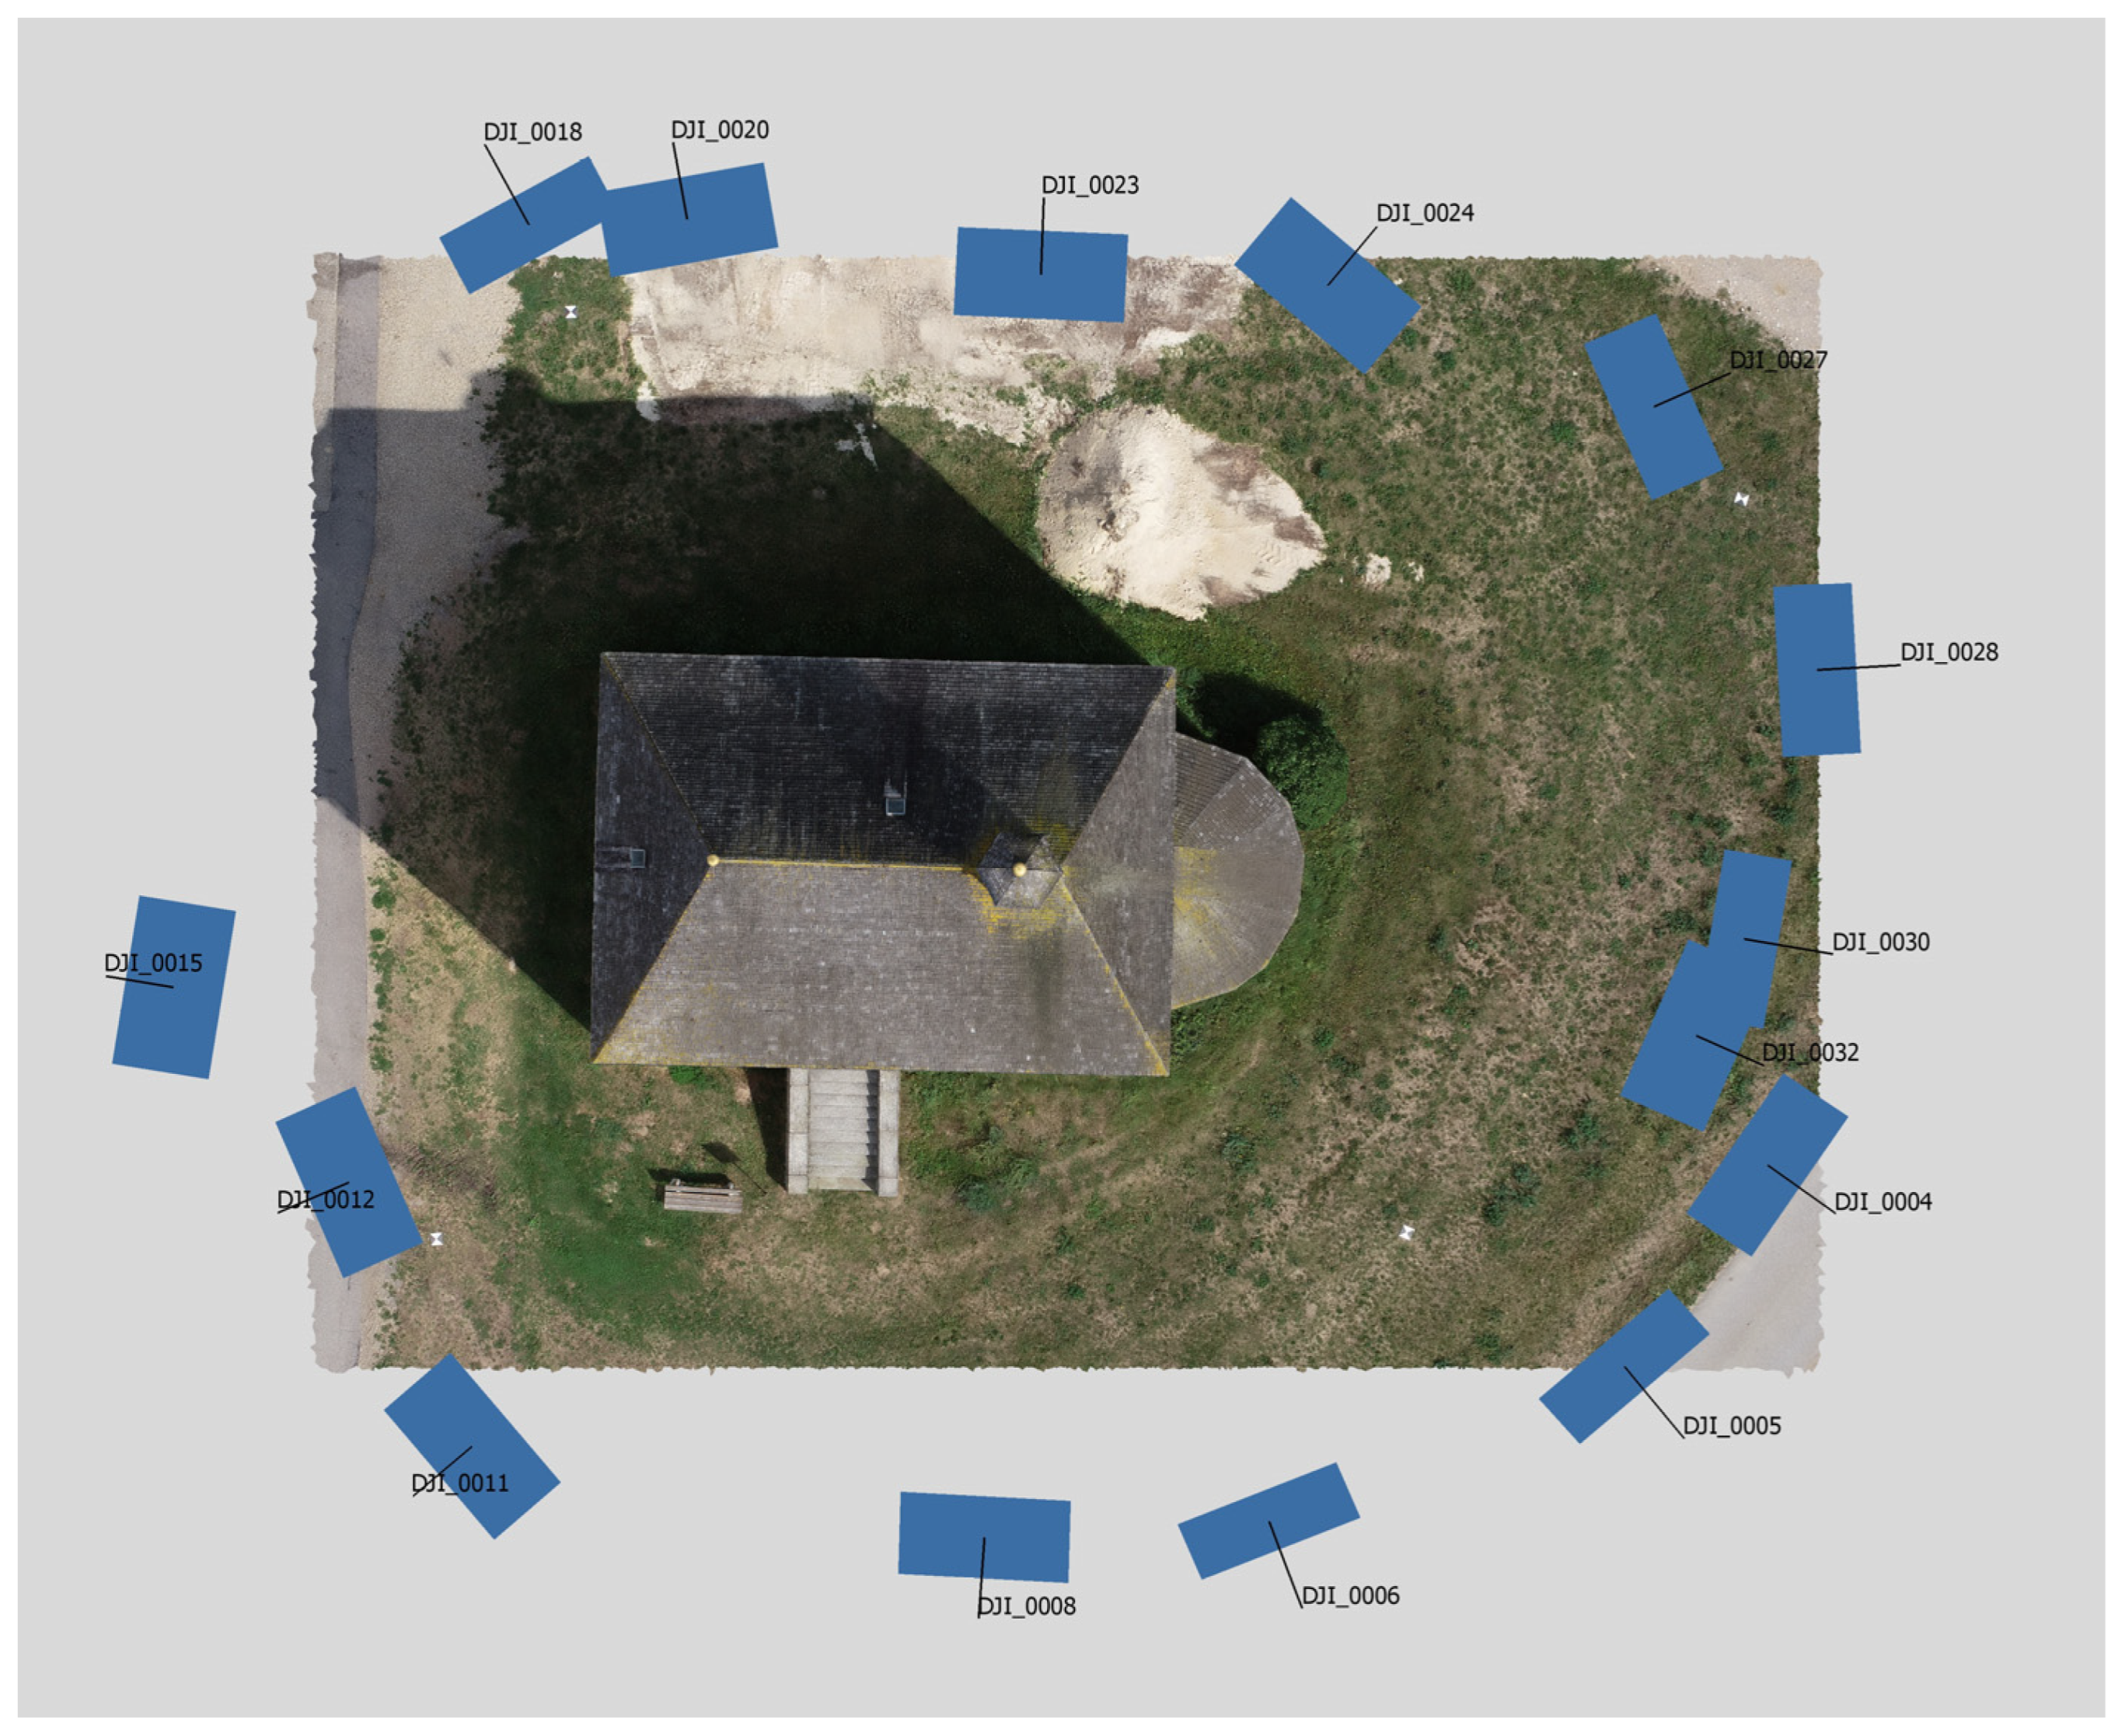
An in-depth analysis of the error distribution reveals that the southern roof of the nave appears with higher values than the other ones (Figure 5b). Due to the manual acquisition of oblique images with the P4RTK, the distance in-between them varies and is a bit larger in the south (Figure 6).
This causes a larger error in the data. The same effect occurs at the northwestern corner of the nave. As this is the quoin of the church, the influence is not as strong as for the roof and the error is not significantly raised here. However, in this area, the error of the ground points surrounding the building is higher. At the vertical facades, there is an observable difference between the higher parts and lower ones. Again, this is an effect of the shallower and more versatile inclination angles of the Zenmuse P1 survey. Further regions with enhanced deviations are the orthogonal corners of the nave. These negative error values are induced by two factors: the Zenmuse P1 produces a higher point density in the data due to the better resolution of the sensor and, furthermore, the M300 flight consisted of more individual images, also improving the quality at the sharp edges.
The absolute accuracy of the georeferenced data was evaluated at the GCPs. For this task, only three of the points could be used, as the northwestern GCP has reduced accuracy in the GNSS survey due to a shadowing of satellites by the nearby buildings. The single values for the error are given in Table 3:
Table 3 shows that the difference in accuracy between the two flights is negligible. Although those of the M300 data, especially in 3D, are a little better than those for the P4RTK, all single error values are within the RTK accuracy of the GNSS survey.
We executed further accuracy and deviation tests, based on the digital elevation models (DEMs) in the area of a heap of earth nearby to the church. The subtraction of the P4RTK DEM from the M300 DEM results in the following statistical parameters (Table 4):
The maximum values in the deviation occur around the edges of the heap in the flat grass and in small depressions at its slopes. As these are areas that are partly shadowed—especially near the church—once more, the phenomena of the sophisticated Smart Oblique Capture mode of the Zenmuse P1 resulting in more individual photos becomes evident, as the corresponding DEM bares more details than the one of the P4RTK. We also took into account the cubature volumes of the heap of earth. Whereas the stockpile of the P4RTK survey results in 10.27 m3, the M300 data reveal 10.44 m3. This means a difference of 0.17 m3 or 1.6% related to the M300 volume; therefore, this deviation is also negligible.
5. Conclusions
The discussed statistical assessment reveals that there is only a small deviation of less than 2 cm between three-dimensional models produced by consumer drones and high-end industrial ones. Therefore, both datasets are quite similar and, for most applications in heritage protection, the cheaper UAV systems are sufficient. Only in the case where fine details and a high accuracy in all parts of a building are crucial for the outcome do we require drones that are more expensive. Small details like the globes at the church spire of St. Ägidius or the sharp edges of the vertical walls, especially, are better represented by the M300 system due to the higher resolution of the camera, as well as the more sophisticated flight-planning software that is available in these cases. Besides the cheaper price of consumer UAVs, the smaller size and weight of these systems play a significant role for heritage protection applications: as most of the relevant sites are located within settled areas, the legislative regulations for drone flights have to be taken into account [32]. These are much easier to fulfil with lightweight systems than with heavy ones.
Author Contributions
Conceptualization, R.L. and C.S.; methodology, R.L. and C.S.; data processing, R.L.; validation, A.S. and C.S.; writing—original draft preparation, R.L.; writing—review and editing, A.S. and C.S.; visualization, R.L.; project administration, R.L. All authors have read and agreed to the published version of the manuscript.
Funding
This research received no external funding.
Institutional Review Board Statement
Not applicable.
Informed Consent Statement
Not applicable.
Data Availability Statement
The data that support the findings of this study are available from the corresponding author upon reasonable request.
Acknowledgments
For a further review of the manuscript and layouting the final draft, we thank Tatjana Gericke (BLfD). We also thank the two anonymous reviewers for their valuable comments that are improving our manuscript significantly.
Conflicts of Interest
The authors declare no conflicts of interest.
References
- Xiao, Y.; Zhan, Q.; Pang, Q. 3D Data Acquisition by Terrestrial Laser Scanning for Protection of Historical Buildings. In Proceedings of the International Conference on Wireless Communications, Networking and Mobile Computing, Shanghai, China, 21–25 September 2007; pp. 5971–5974. [Google Scholar] [CrossRef]
- Yastikli, N. Documentation of cultural heritage using digital photogrammetry and laser scanning. J. Cult. Herit. 2007, 8, 423–427. [Google Scholar] [CrossRef]
- Gussone, M.; Heister, H.; Liebl, W.; Oberhollenzer, I.; Sack, D.; Shash, H. Laserscanning als Grundlage für Bauforschung und Schadenskartierung in Resafa/Syrien—Objektive Dokumentation oder/und Analyse der Konstruktion?/! In Von Handaufmaß bis High-Tech III: 3D in der Historischen Bauforschung; Heine, K., Rheidt, K., Riedel, A., Eds.; WBG Philipp von Zabern: Mainz, Germany, 2011; pp. 201–210. ISBN 978-3-8053-4332-9. [Google Scholar]
- Kwoczyńska, B.; Piech, I.; Śledź, J.; Litwin, U.; Obirek, P. The Use of Terrestrial Laser Scanning in Surveying Historic Buildings. In Proceedings of the 2016 Baltic Geodetic Congress (BGC Geomatics), Gdansk, Poland, 2–4 June 2016; pp. 263–268. [Google Scholar] [CrossRef]
- Drap, P.; Merad, D.; Boï, J.-M.; Seinturie, J.; Peloso, D.; Reidinger, C.; Vannini, G.; Nucciotti, M.; Pruno, E. Photogrammetry for Medieval Archaeology: A Way to Represent and Analyse Stratigraphy. In Proceedings of the 2012 18th International Conference on Virtual Systems and Multimedia, Milan, Italy, 2–5 September 2012; IEEE: Piscataway, NJ, USA; pp. 157–164. [Google Scholar] [CrossRef]
- Viberg, A.; Schultzén, J.; Wikström, A. Reconstructing the spatial layout of the church of St. Lawrence, Sigtuna, Sweden using ground-penetrating radar and photogrammetry. In Archaeological Prospection, Proceedings of the 10th International Conference, Vienna, Austria, 29 May–2 June 2013; Neubauer, W., Trinks, I., Salisbury, R.B., Einwögerer, C., Eds.; Ludwig Boltzmann Institute for Archaeological Prospection and Virtual Archaeology, Austrian Academy of Sciences: Vienna, Austria, 2013; pp. 74–76. ISBN 978-3-7001-7459-2. [Google Scholar] [CrossRef]
- Stal, C.; Lonneville, B.; Nuttens, T.; De Maeyer, P.; De Wulf, A. Highly Detailed 3D Modelling of Mayan Cultural Heritage Using an UAV. In Proceedings of the FIG Congress “Engaging the Challenges—Enhancing the Relevance”, Kuala Lumpur, Malaysia, 16–21 June 2014. [Google Scholar]
- Karachaliou, E.; Georgiou, E.; Psaltis, D.; Stylianidis, E. UAV for Mapping Historic Buildings: From 3D Modelling to BIM. ISPRS Arch. 2019, XLII-2/W9, 397–402. [Google Scholar] [CrossRef]
- Martínez-Carricondo, P.; Carvajal-Ramírez, F.; Yero-Paneque, L.; Agüera-Vega, F. Combination of nadiral and oblique UAV photogrammetry and HBIM for the virtual reconstruction of cultural heritage. Case study of Cortijo del Fraile in Níjar, Almería (Spain). Build. Res. Inf. 2019, 48, 140–159. [Google Scholar] [CrossRef]
- Solla, M.; Gonçalves, L.M.S.; Gonçalves, G.; Francisco, C.; Puente, I.; Providência, P.; Gaspar, F.; Rodrigues, H. A Building Information Modeling Approach to Integrate Geomatic Data for the Documentation and Preservation of Cultural Heritage. Remote Sens. 2020, 12, 28. [Google Scholar] [CrossRef]
- Dominici, D.; Alicandro, M.; Massimi, V. UAV photogrammetry in the post-earthquake scenario: Case studies in L’Aquila. Geomat. Nat. Hazards Risks 2017, 8, 87–103. [Google Scholar] [CrossRef]
- Germinario, C.; Gorrasi, M.; Izzo, F.; Langella, A.; Limongiello, M.; Mercurio, M.; Musmeci, D.; Santoriello, A.; Grifa, C. Damage Diagnosis of Ponte Rotto, a Roman Bridge Along the Ancient Appia. Int. J. Conserv. Sci. 2020, 11, 277–290. [Google Scholar]
- D’Amico, S.; Colica, E.; Galone, L.; Persico, R.; Venuti, V.; Caridi, F.; Foti, S.; Cantarella, C. Proximity Remote Sensing: Preliminary Results at The Batia Church (Tortorici, Sicily). J. Phys. Conf. Ser. 2022, 2204, 012087. [Google Scholar] [CrossRef]
- Linck, R. Mapping a UNESCO World-Heritage Site in 3D: Drone photogrammetry of a Rococo church in southern Bavaria. ISAP News 2019, 58, 15–20. [Google Scholar]
- Knepper, T.; Sidiropolou, D.; Dietzsch, J.; Fielauf, M.; Krekeler, A. Hochauflösendes Laserscanning und Fotogrammetrie als Grundlage der Restaurierungs- und Objektplanung in der Denkmalpflege. In Bildgebende Verfahren—Trends und Fallbeispiele zur Zerstörungsfreien Untersuchung und Erhaltung von Kulturerbe—Arbeitshefte des Brandenburgischen Landesamtes für Denkmalpflege und Archäologischen Landesmuseum, 1st ed.; Brandenburgisches Landesamt für Denkmalpflege und Archäologisches Landesmuseum, Ed.; Hendrik Bäßler: Berlin, Germany, 2021; Volume 61, pp. 162–174. ISBN 978-3-945880-90-6. [Google Scholar]
- Linck, R. Hoch hinaus im Allgäu: Drohnenfotogrammetrie der Burgruinen Eisenberg und Hohenfreyberg. Das Archäologische Jahr Bayern 2020, 2021, 185–188. [Google Scholar]
- Karataş, L.; Alptekin, A.; Yakar, M. Detection and documentation of stone material deterioration in historical masonry structures using UAV photogrammetry: A case study of Mersin Aba Mausoleum. Adv. UAV 2022, 2, 51–64. [Google Scholar]
- Manajitprasert, S.; Tripathi, N.K.; Arunplod, S. Three-Dimensional (3D) Modeling of Cultural Heritage Site Using UAV Imagery: A Case Study of the Pagodas in Wat Maha That, Thailand. Appl. Sci. 2019, 9, 3640. [Google Scholar] [CrossRef]
- Sun, Z.; Zhang, Y. Using Drones and 3D Modeling to Survey Tibetan Architectural Heritage: A Case Study with the Multi-Door Stupa. Sustainability 2018, 10, 2259. [Google Scholar] [CrossRef]
- Luhmann, T.; Chizhova, M.; Gorkovchuk, D. Fusion of UAV and Terrestrial Photogrammetry with Laser Scanning for 3D Reconstruction of Historic Churches in Georgia. Drones 2020, 4, 53. [Google Scholar] [CrossRef]
- Cavalagli, N.; Gioffrè, M.; Grassi, S.; Gusella, V.; Pepi, C.; Volpi, G.M. On the accuracy of UAV photogrammetric survey for the evaluation of historic masonry structural damages. Procedia Struct. Integr. 2020, 29, 165–174. [Google Scholar] [CrossRef]
- Bayerisches Landesamt für Umwelt—Naturräumliche Gliederung Bayerns. Available online: https://www.lfu.bayern.de/natur/naturraeume/doc/haupteinheiten_naturraum.pdf (accessed on 1 February 2023).
- Hager, G. Die Kunstdenkmäler des Königreichs Bayern—Oberpfalz & Regensburg Bd. I: Bezirksamt Roding; Verlag von R. Oldenbourg: München, Germany, 1905; pp. 135–139. [Google Scholar]
- Ernst, B. Burgenbau in der Südöstlichen Oberpfalz vom Frühmittelalter bis zur Frühen Neuzeit. Arbeiten zur Archäologie Süddeutschlands; Verlag Dr. Faustus: Büchenbach, Germany, 2003; Volume 16, pp. 267–269. [Google Scholar]
- Robl, W. Burggraf Heinrich III. von Regensburg und sein Erbe: Die romanischen Schutzkirchen in Altbayern. 2017. Available online: http://schutzkirchen.robl.de/schutzkirchen.pdf (accessed on 1 February 2023).
- Weininger, H. Die alte Kirche zu Schönfeld in der Oberpfalz. Westermanns Illus. Dtsch. Monatshefte 1860, 49, 376–378. [Google Scholar]
- Grund- und Aufriss von Sankt Ägidius. Hersenedis, 18 September 2008, CC-License. Available online: https://commons.wikimedia.org/wiki/File:Aegidius_Plan.jpg (accessed on 1 February 2023).
- DJI P 4 RTK. Available online: https://www.dji.com/de/phantom-4-rtk/info (accessed on 2 February 2023).
- DJI Enterprise. Zenmuse P1. Technische Daten. Available online: https://www.dji.com/de/zenmuse-p1/specs (accessed on 2 February 2023).
- Enterprise. Zenmuse P1. FAQ. Available online: https://www.dji.com/de/zenmuse-p1/faq (accessed on 2 February 2023).
- CloudCompare. Available online: https://www.danielgm.net/cc/ (accessed on 9 February 2023).
- EASA Pro. Drones & Air Mobility. Available online: https://www.easa.europa.eu/en/domains/civil-drones (accessed on 9 February 2023).
Figure 1.
Topographical map illustrating the location of the test site St. Ägidius in Schönfeld northeast of Regensburg (marked with blue star). Coordinate system WGS84/UTM33N (© Bayerische Vermessungsverwaltung). The top left corner marks the location within Germany (blue rectangle marks the test site) (© Bundesamt für Kartographie und Geodäsie, Frankfurt am Main, 2011).

Figure 2.
Layout and cross-section of St. Ägidius in Schönfeld [27].
Figure 2.
Layout and cross-section of St. Ägidius in Schönfeld [27].

Figure 3.
Unmanned aerial vehicle (UAV) systems used in Schönfeld: (a) DJI P4RTK, and (b) DJI M300 with Zenmuse P1 (Photos by: Andreas Stele, BLfD).
Figure 3.
Unmanned aerial vehicle (UAV) systems used in Schönfeld: (a) DJI P4RTK, and (b) DJI M300 with Zenmuse P1 (Photos by: Andreas Stele, BLfD).

Figure 4.
Comparison of the resulting 3D models of (a) DJI P4RTK, and (b) DJI M300 with Zenmuse P1. Both views from southeast. Detailed views taken from Zenmuse P1 result (c–e) and P4RTK (f–h): (c,f) medieval relief with a cross at the semi-circular entrance arch, (d,g) bricked-up Romanesque high entrance at western wall, and (e,h) missing slat in belfry of ridge turret. Partly, the difference in camera resolution can be observed.
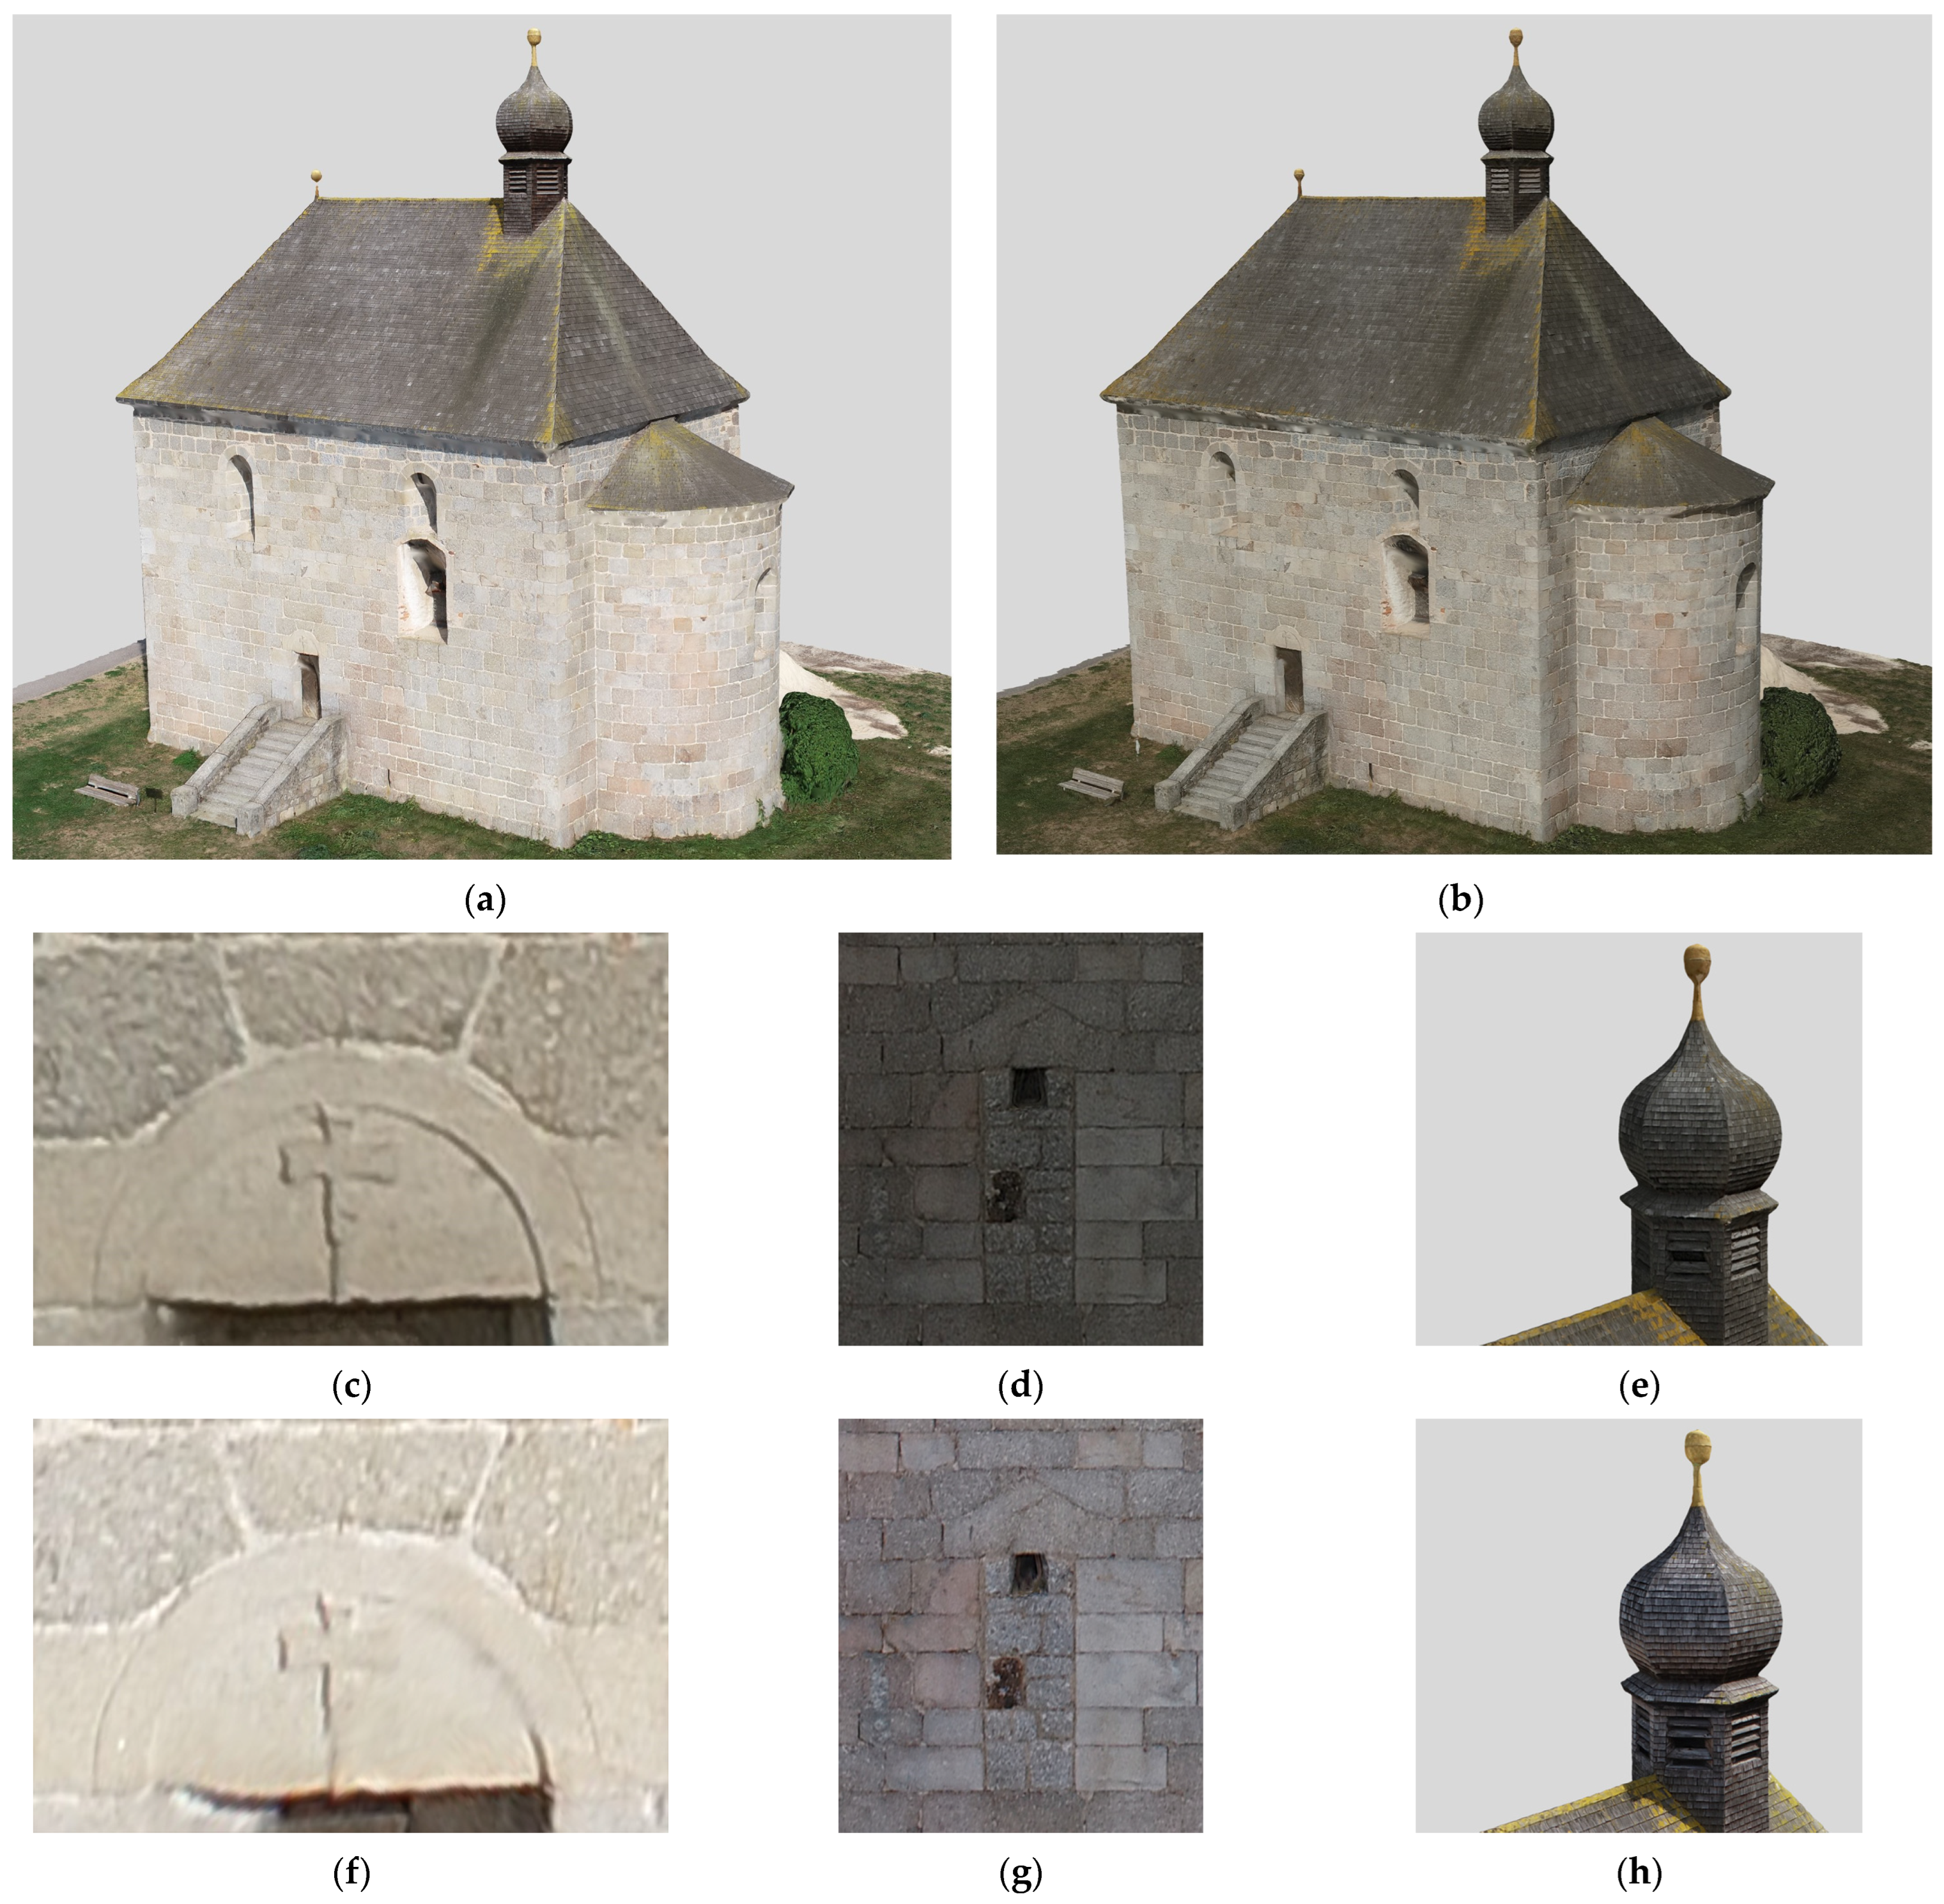
Figure 5.
Statistical calculation of the difference between the two photogrammetric point clouds as point–mesh deviation. The Zenmuse P1 data served as reference mesh, the P4RTK data as point cloud to compare: (a) view from south, (b) view from top with south up, (c) visualization of regions with maximum error in view from south, and (d) histogram. The histogram for (a–c) was clipped to ±1.2 cm, as the majority of error occurs within this range.
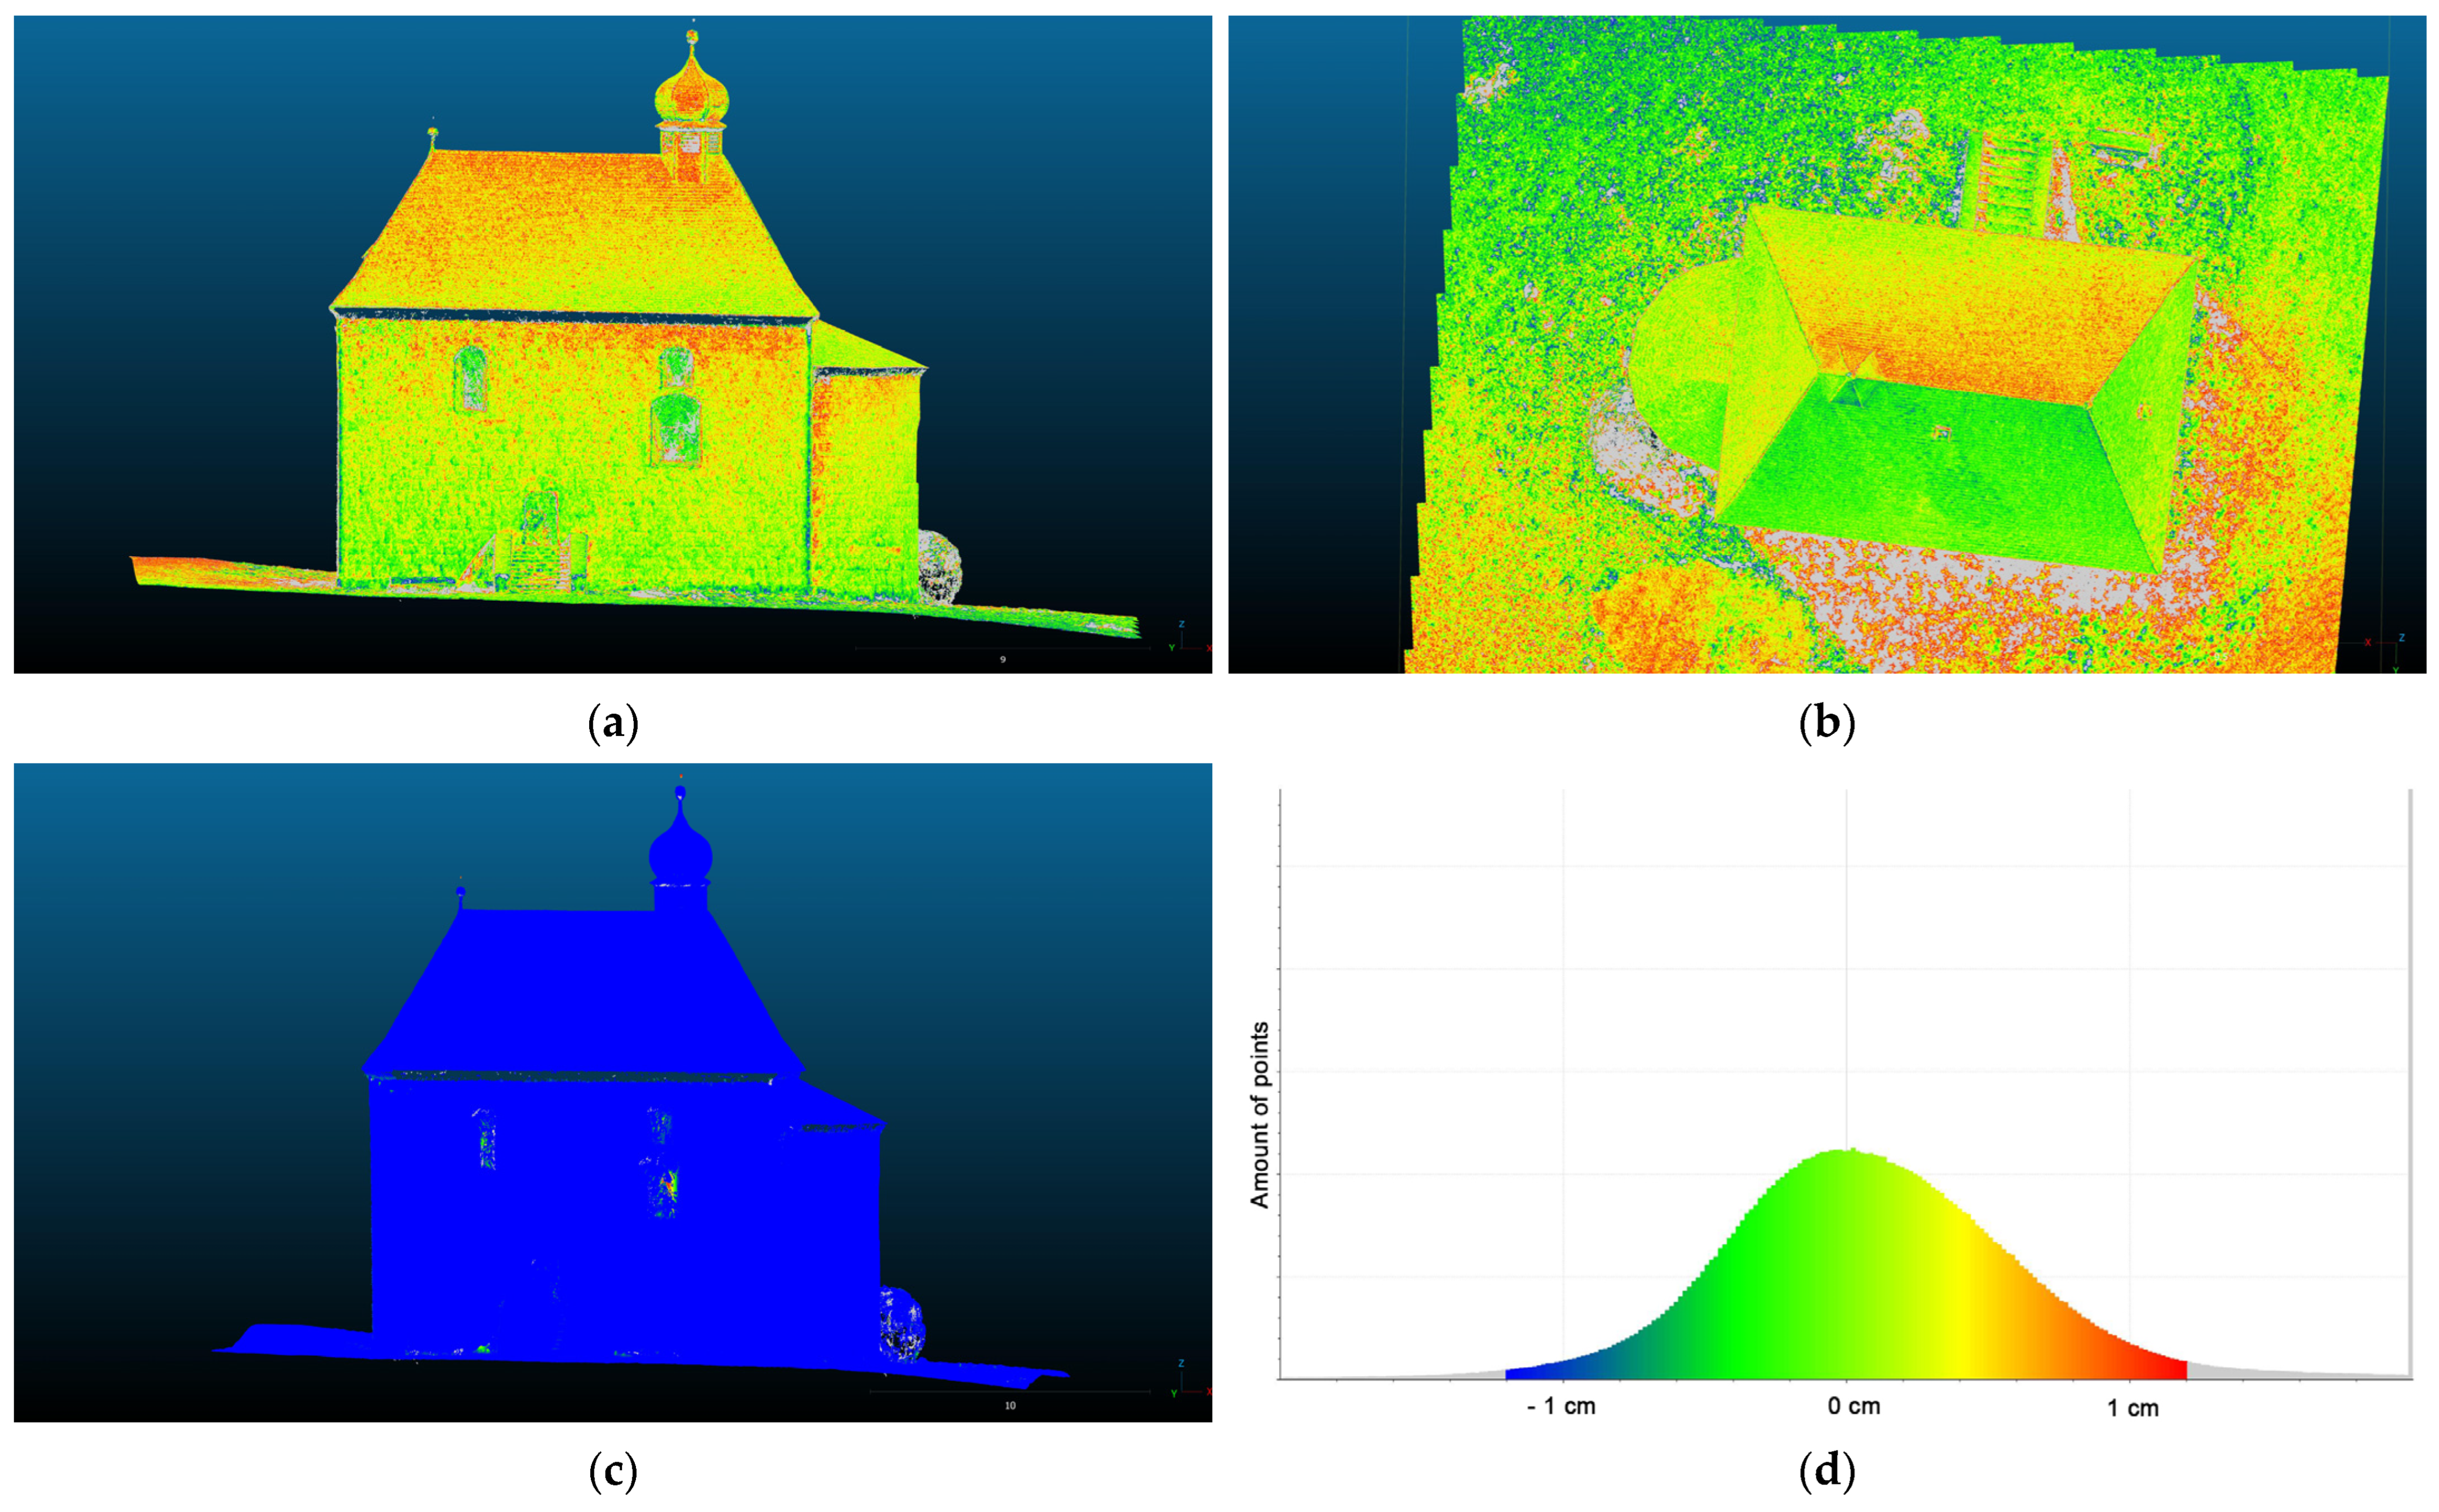
Figure 6.
Distribution of manual oblique photos for the DJI P4RTK survey to illustrate the varying distance in between. View from top; north is up.
Figure 6.
Distribution of manual oblique photos for the DJI P4RTK survey to illustrate the varying distance in between. View from top; north is up.

Table 1.
Comparison of the camera parameters and acquisition details for the drone models used for structure from motion (SfM) (camera parameters from [28,29]).
| DJI P4RTK | DJI M300 with P1 | |
|---|---|---|
| Sensor size | 13.1 × 8.8 mm | 35.9 × 24 mm |
| Effective pixels | 20 Megapixel | 45 Megapixel |
| Focal length * | 24 mm | 35 mm |
| Camera mode | Automatic | Shutter priority |
| Flight altitude | 40 m | 50 m |
| Image overlap | 85% | 85% |
| Number of images | 90 | 304 |
| Ground sampling distance | 9 mm | 6 mm |
* as 35 mm equivalent.
Table 2.
Resulting parameters of the point clouds used in this case study.
| DJI P4RTK | Zenmuse P1 | |
|---|---|---|
| Amount of points | 5,381,000 | 11,160,000 |
| Point density | 6138/m2 | 12,694/m2 |
Table 3.
Deviation in x-, y-, z-, and 3D direction at the GCPs compared with the GNSS survey. Values are average of the three reference points.
Table 3.
Deviation in x-, y-, z-, and 3D direction at the GCPs compared with the GNSS survey. Values are average of the three reference points.
| DJI P4RTK | DJI M300 with P1 | |
|---|---|---|
| Δx | 1.1 cm | 0.7 cm |
| Δy | 1.3 cm | 1.4 cm |
| Δz | 0.2 cm | 0.4 cm |
| Δ3D | 1.7 cm | 0.8 cm |
Table 4.
Statistical parameters of the digital elevation models (DEM) difference at the heap of earth.
Table 4.
Statistical parameters of the digital elevation models (DEM) difference at the heap of earth.
| Minimum | −1.3 cm |
| Maximum | 9.3 cm |
| Mean | 0.4 cm |
| Median | 0.4 cm |
| Standard deviation | 0.8 cm |
Disclaimer/Publisher’s Note: The statements, opinions and data contained in all publications are solely those of the individual author(s) and contributor(s) and not of MDPI and/or the editor(s). MDPI and/or the editor(s) disclaim responsibility for any injury to people or property resulting from any ideas, methods, instructions or products referred to in the content. |
© 2024 by the authors. Licensee MDPI, Basel, Switzerland. This article is an open access article distributed under the terms and conditions of the Creative Commons Attribution (CC BY) license (https://creativecommons.org/licenses/by/4.0/).
Share and Cite
MDPI and ACS Style
Linck, R.; Stele, A.; Schimmer, C. Statistical Evaluation of the Accuracy of Consumer Drone Photogrammetry at a Romanesque Church in Eastern Bavaria (Germany). NDT 2024, 2, 76-86. https://doi.org/10.3390/ndt2020005
AMA Style
Linck R, Stele A, Schimmer C. Statistical Evaluation of the Accuracy of Consumer Drone Photogrammetry at a Romanesque Church in Eastern Bavaria (Germany). NDT. 2024; 2(2):76-86. https://doi.org/10.3390/ndt2020005
Chicago/Turabian StyleLinck, Roland, Andreas Stele, and Christoph Schimmer. 2024. "Statistical Evaluation of the Accuracy of Consumer Drone Photogrammetry at a Romanesque Church in Eastern Bavaria (Germany)" NDT 2, no. 2: 76-86. https://doi.org/10.3390/ndt2020005