Abstract
This study addresses the scarcity of empirical findings on the determinants of discount rates in the Discounted Cash Flow (DCF) method, filling a crucial gap in the existing literature and enhancing the understanding of the valuation process from the perspectives of key stakeholders. Leveraging a unique dataset comprising market transactions enriched with expert-based valuation information, the study conducts a comprehensive counterfactual analysis of the fundamental determinants influencing both appraisal-based and transaction-based discount rates. The results reveal that appraisers and investors attribute different levels of importance to object-specific, locational, and macroeconomic variables. A type-specific analysis further reveals that locational and macroeconomic variables exert a greater influence on discount rates in the residential real estate segment. In contrast, object-specific characteristics hold significantly higher importance in explaining discount rates in the commercial real estate segment.
1. Introduction
Market values of income properties are frequently calculated using the Discounted Cash Flow (DCF) method, in which future cash flows are discounted to the present. Expanding upon this approach, the market value of an income property is essentially attributable to two key determinants: a depiction of future cash flows and the discount rate. Whereas cash flows can be derived relatively reliably using detailed rent roll information, object-specific quality criteria, or market data, defining accurate discount rates proves to be more complex. Explanations may include the disparity in discount rates among valuation methodologies, the limited availability of publicly accessible data regarding discount rates, and the divergent weightings assigned to the components of discount rates by the stakeholders involved.
Despite its widespread use in valuing income properties, the existing literature lacks empirical findings on the fundamental determinants of discount rates in the DCF method. This absence underscores the subjective nature of discount rates, implying their susceptibility to uncertainty and potential misjudgment. Furthermore, significant gaps remain in understanding how these fundamental determinants affect discount rates between residential and commercial real estate, as well as how appraisers and investors assign weights to this critical component driving market values of income properties.
This study aims to enhance the understanding of the valuation process in the real estate industry by providing comprehensive insights into the nuanced determinants of discount rates, thereby addressing a significant gap in the existing literature. Leveraging a unique dataset containing detailed property information over fourteen years, the study conducts a comprehensive counterfactual analysis of the fundamental determinants influencing appraisal-based and transaction-based discount rates in the DCF method. While appraisal-based discount rates reflect appraisers’ expert knowledge, transaction-based discount rates offer insights into how investors prioritize specific components of the discount rate. Extending the analysis to separately investigate the driving forces of both types of discount rates for specific real estate segments further ensures the validity and robustness of the findings. Additionally, various relative importance measures are utilized to assess the relevance of specific regressors across appraisers, investors, and real estate segments.
The contribution can be summarized as follows. First, by simultaneously analyzing two types of discount rates, the study provides an in-depth examination of the fundamental determinants, offering novel insights into the valuation process and its implications for market trends in real estate markets. Second, by distinguishing between residential and commercial real estate in the empirical analysis, the study offers empirical insights into how the factors influencing discount rates differ across real estate types. Third, by extending the analysis to explore the divergent weightings assigned to specific components by both appraisers and investors within distinct real estate segments, the study sheds light on how key stakeholders in the real estate industry evaluate and prioritize different factors of discount rates.
The results show that the relevance of regressors crucially depends on the real estate segment considered. Whereas discount rates of residential real estate are best explained by macroeconomic determinants, more weight is attached to object-specific characteristics in the commercial real estate segment. Moreover, the findings indicate that investors prioritize variables associated with market dynamics, while appraisers assign greater significance to a diverse set of variables that characterize a specific real estate asset.
The remainder of this study is organized as follows: The second section presents the theoretical framework and analyzes both appraisal-based and transaction-based discount rates, followed by an examination of guidelines and practices. The third section offers a review of the literature, while the fourth section outlines the methodology. The fifth section elucidates the dataset, and the sixth section summarizes the empirical findings.
2. Discount Rates
Discounting, integral to macroeconomic and asset pricing theories, finds its roots in the derivation of a stochastic discount factor, typically grounded in the consumption–saving tradeoff. Within this context, employing a power utility function, the discount factor () signifies the marginal rate of substitution of consumption between at least two periods, expressed as , where is a power utility function and is a subjective discount factor. Expanding upon this theoretical framework leads to the establishment of the law of one price, asserting that assets with identical payoffs share the same price [1]. A similar inference is derived from Fama (1970) [2], establishing an efficient market model where asset prices incorporate all pertinent information. Consequently, employing a constant discount factor allows the expression of the current asset value as the sum of the expected present values of all future cash flows.
The discount factor assumes a crucial role by assigning specific weights to future payoffs, cash flows, or dividend streams depending on the considered asset. The intrinsic connection between the discount factor and the time dimension becomes evident when defining the latter as follows:
where represents the discount rate of asset and indicates time. is also known as the required rate of return, which imparts an economic meaning to the underlying time value of money.
According to Fisher (1930) [3], the nominal discount rate, or the required rate of return more generally, consists of compensation for lost liquidity, inflation, and risk-taking. Therefore, the required rate of return is expressed as follows:
where is the risk-free rate capturing the compensation for lost liquidity, is a compensation for inflation, and is an asset-specific risk premium for risk-taking [4].
In the real estate industry, the significance of the discount rate is particularly evident in light of the chosen valuation method. Essentially, the application of a valuation method should produce an accurate estimate of assets’ market price while reflecting market fundamentals [5]. Given real estate objects’ unique characteristics in combination with high transaction costs and, in this regard, incomplete transaction price data, a real estate valuation is an estimate for the likely selling price derived from comparable market evidence [6].
This study centers on the commonly used Discounted Cash Flow (DCF) method, employed for calculating the present value of income properties that generate cash flows and are typically owned by commercial investors such as banks, insurance companies, and pension funds:
where is the resulting present value, or market value more generally, of a real estate object at time , are object-specific cash flows and the discount rate is represented by . For consistency, the application of the DCF method requires considering both and , either in nominal or real terms. In Equation (3), represents a summary term comprising a set of object-specific incomes and costs. Examples are rental revenues, vacancy costs, or refurbishment costs that can be mapped over time, which allows the entire life cycle of a real estate object to be derived using the DCF method [7]. In this context, the discount rate yields a rate that reflects the expected required return based on the property’s specific risk profile. This approach contrasts with the application of capitalization rates (cap rates), which considers only the initial periodic Net Operating Income (NOI) to derive the market value of an income property. The absence of a temporal dimension, coupled with the assumption of a fixed NOI growth rate, implies that the cap rate converges with the discount rate in the DCF method only when cash flows are nominally constant, thereby imposing a growth rate of zero. To see this, one can rewrite the present value of a given real estate object as or equivalently as , where is an imposed constant annual growth rate. From the last expression, it follows that only if , the application of the discount rate from the DCF method or cap rates result in the same present value () [8].
In order to derive the market value using the DCF method, appraisers require detailed object information to objectivize their valuation. While actual rents together with market rents resulting from property managers’ rent rolls allow a precise depiction of incomes, past accounting figures are used as reference values to map vacancy or running costs. Additionally, object data, such as the construction and past refurbishment date, together with refurbishment plans are used to accurately map refurbishment costs. Finally, any appraiser sets a discount rate, the appraisal-based discount rate (), which represents an educated estimate of the accurate discount rate for a given real estate object.
Given the limited availability of publicly accessible data regarding discount rates, appraisers often set using a benchmark approach or internal methodologies. The former approach considers historical valuations for similar objects, while the latter encompasses internal guidelines, incorporating object-specific characteristics and current market circumstances. In any case, is based on appraisers’ expert knowledge but may not accurately display the heterogeneous character of a real estate object, current market tendencies, or investors’ perception of risk.
This critical gap is addressed by incorporating transaction-based discount rates (), implicitly derived through real market transactions. Specifically, is determined when an asset undergoes evaluation using the DCF method and is traded in open market transactions. These discount rates provide valuable insights into investors’ sentiment, enhancing our understanding of how their perceived risk is formed, while also reflecting current market dynamics.
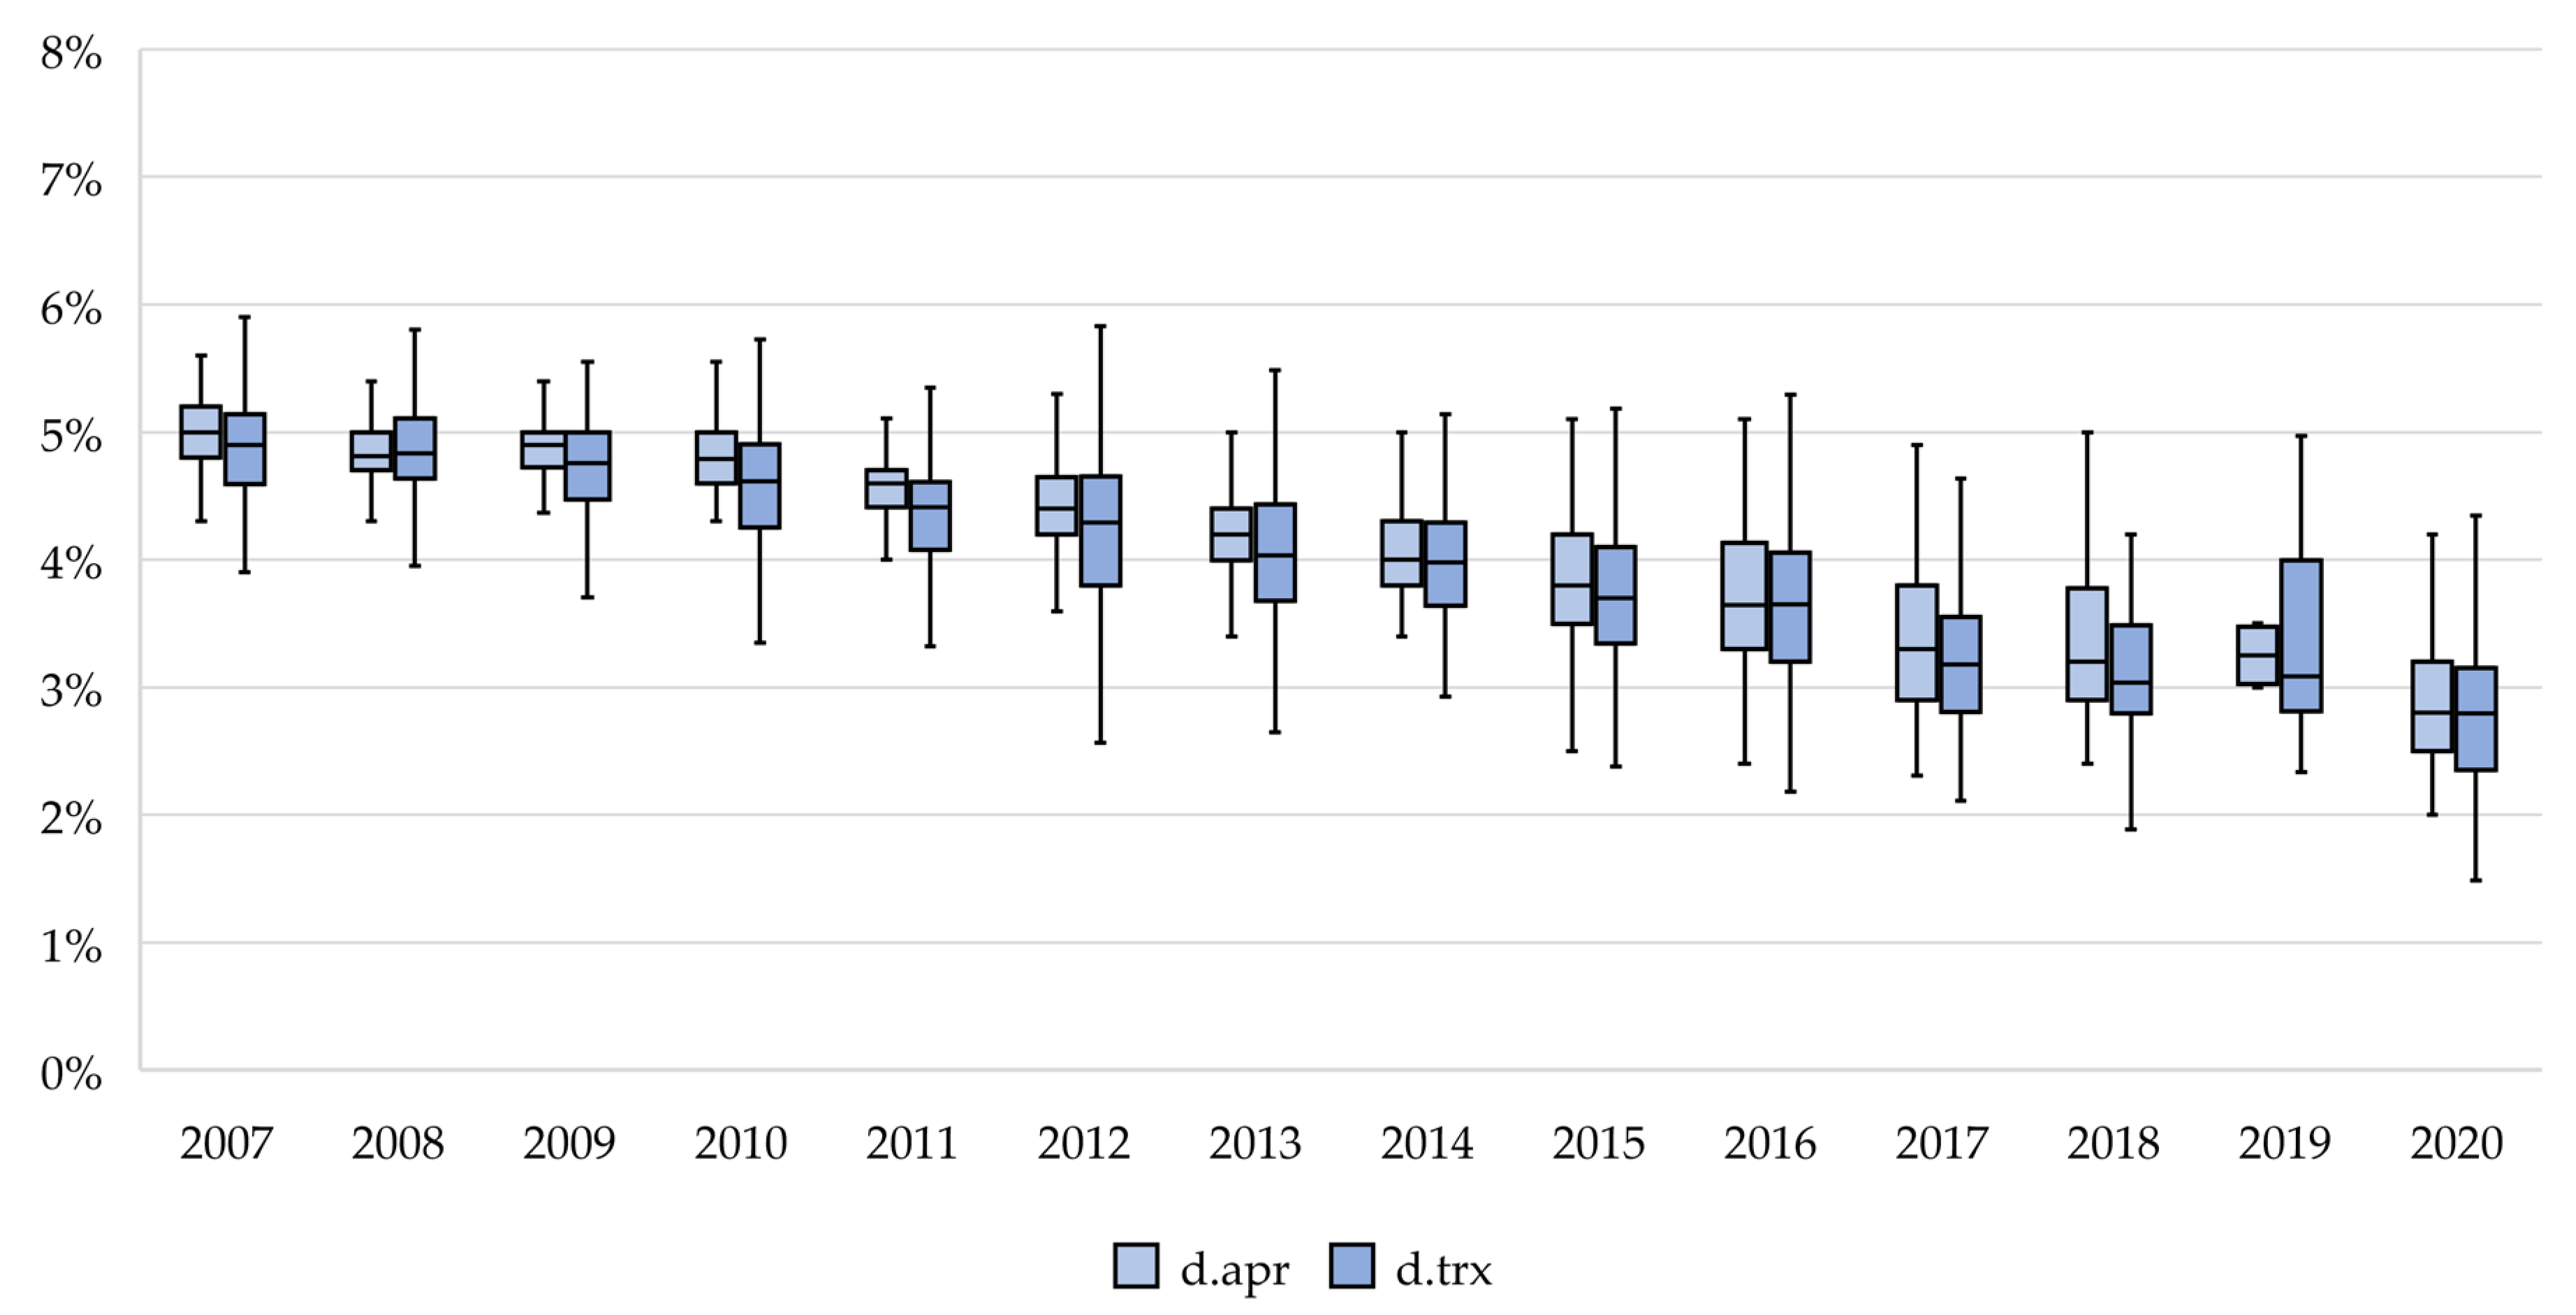
Figure 1 displays the development of transaction- and appraisal-based discount rates in Switzerland between 2007 and 2020. During this time frame, transaction-based discount rates decreased by 2.1 percentage points, i.e., from 4.9% in 2007 to 2.8% in 2020. The same trend can also be observed in appraisal-based discount rates, which declined from 5.1% in 2007 to 2.9% in 2020.
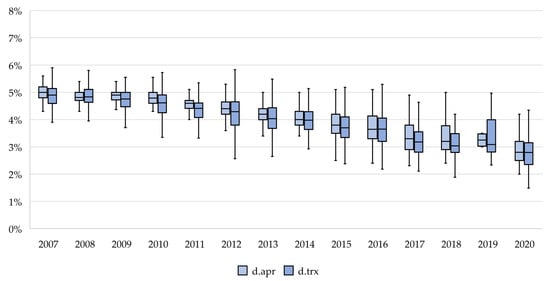
Figure 1.
Development of discount rates. Notes: Box plots visualize the distribution of transaction-based (d.trx) and appraisal-based (d.apr) discount rates (source: Wüest Partner) in Switzerland between 2007 and 2020. The displayed span of values extends from the 10th to the 90th percentile. Within the plot, the box ranges from the 30th to the 70th percentile, and the horizontal line within the box denotes the median (50th percentile).
The disparity between appraisal-based and transaction-based discount rates is a noteworthy trend, which can be attributed to multiple factors. First, appraisers may overestimate the risk-premium as a component of discount rates. In fact, Chaney and Hoesli (2012) [9] found that appraisers tend to overvalue economic risks and object-specific characteristics. Second, during a time of constantly declining interest rates, discount rates react with a time lag to changes in the interest rate environment. Between 2007 and 2020, yields on Swiss governmental bonds with 10-year maturity declined from 2.45% in January 2007 to −0.68% in January 2020. The literature in this regard speaks about appraisal smoothing, which states that appraisers attach more weight to past-related rather than present-related information, and numerous studies found empirical evidence for this phenomenon [10,11,12]. And third, increased willingness to pay of commercial real estate investors in light of the overall decline in interest rates between 2007 and 2020 resulted in increased transaction prices. Evidence for the latter is found in the balance sheet of Swiss pension funds, whose total share of real estate assets increased from 13.2% (79.7 billion Swiss Francs) in 2007 to 17.1% (140.1 billion Swiss francs) in 2020 [13].
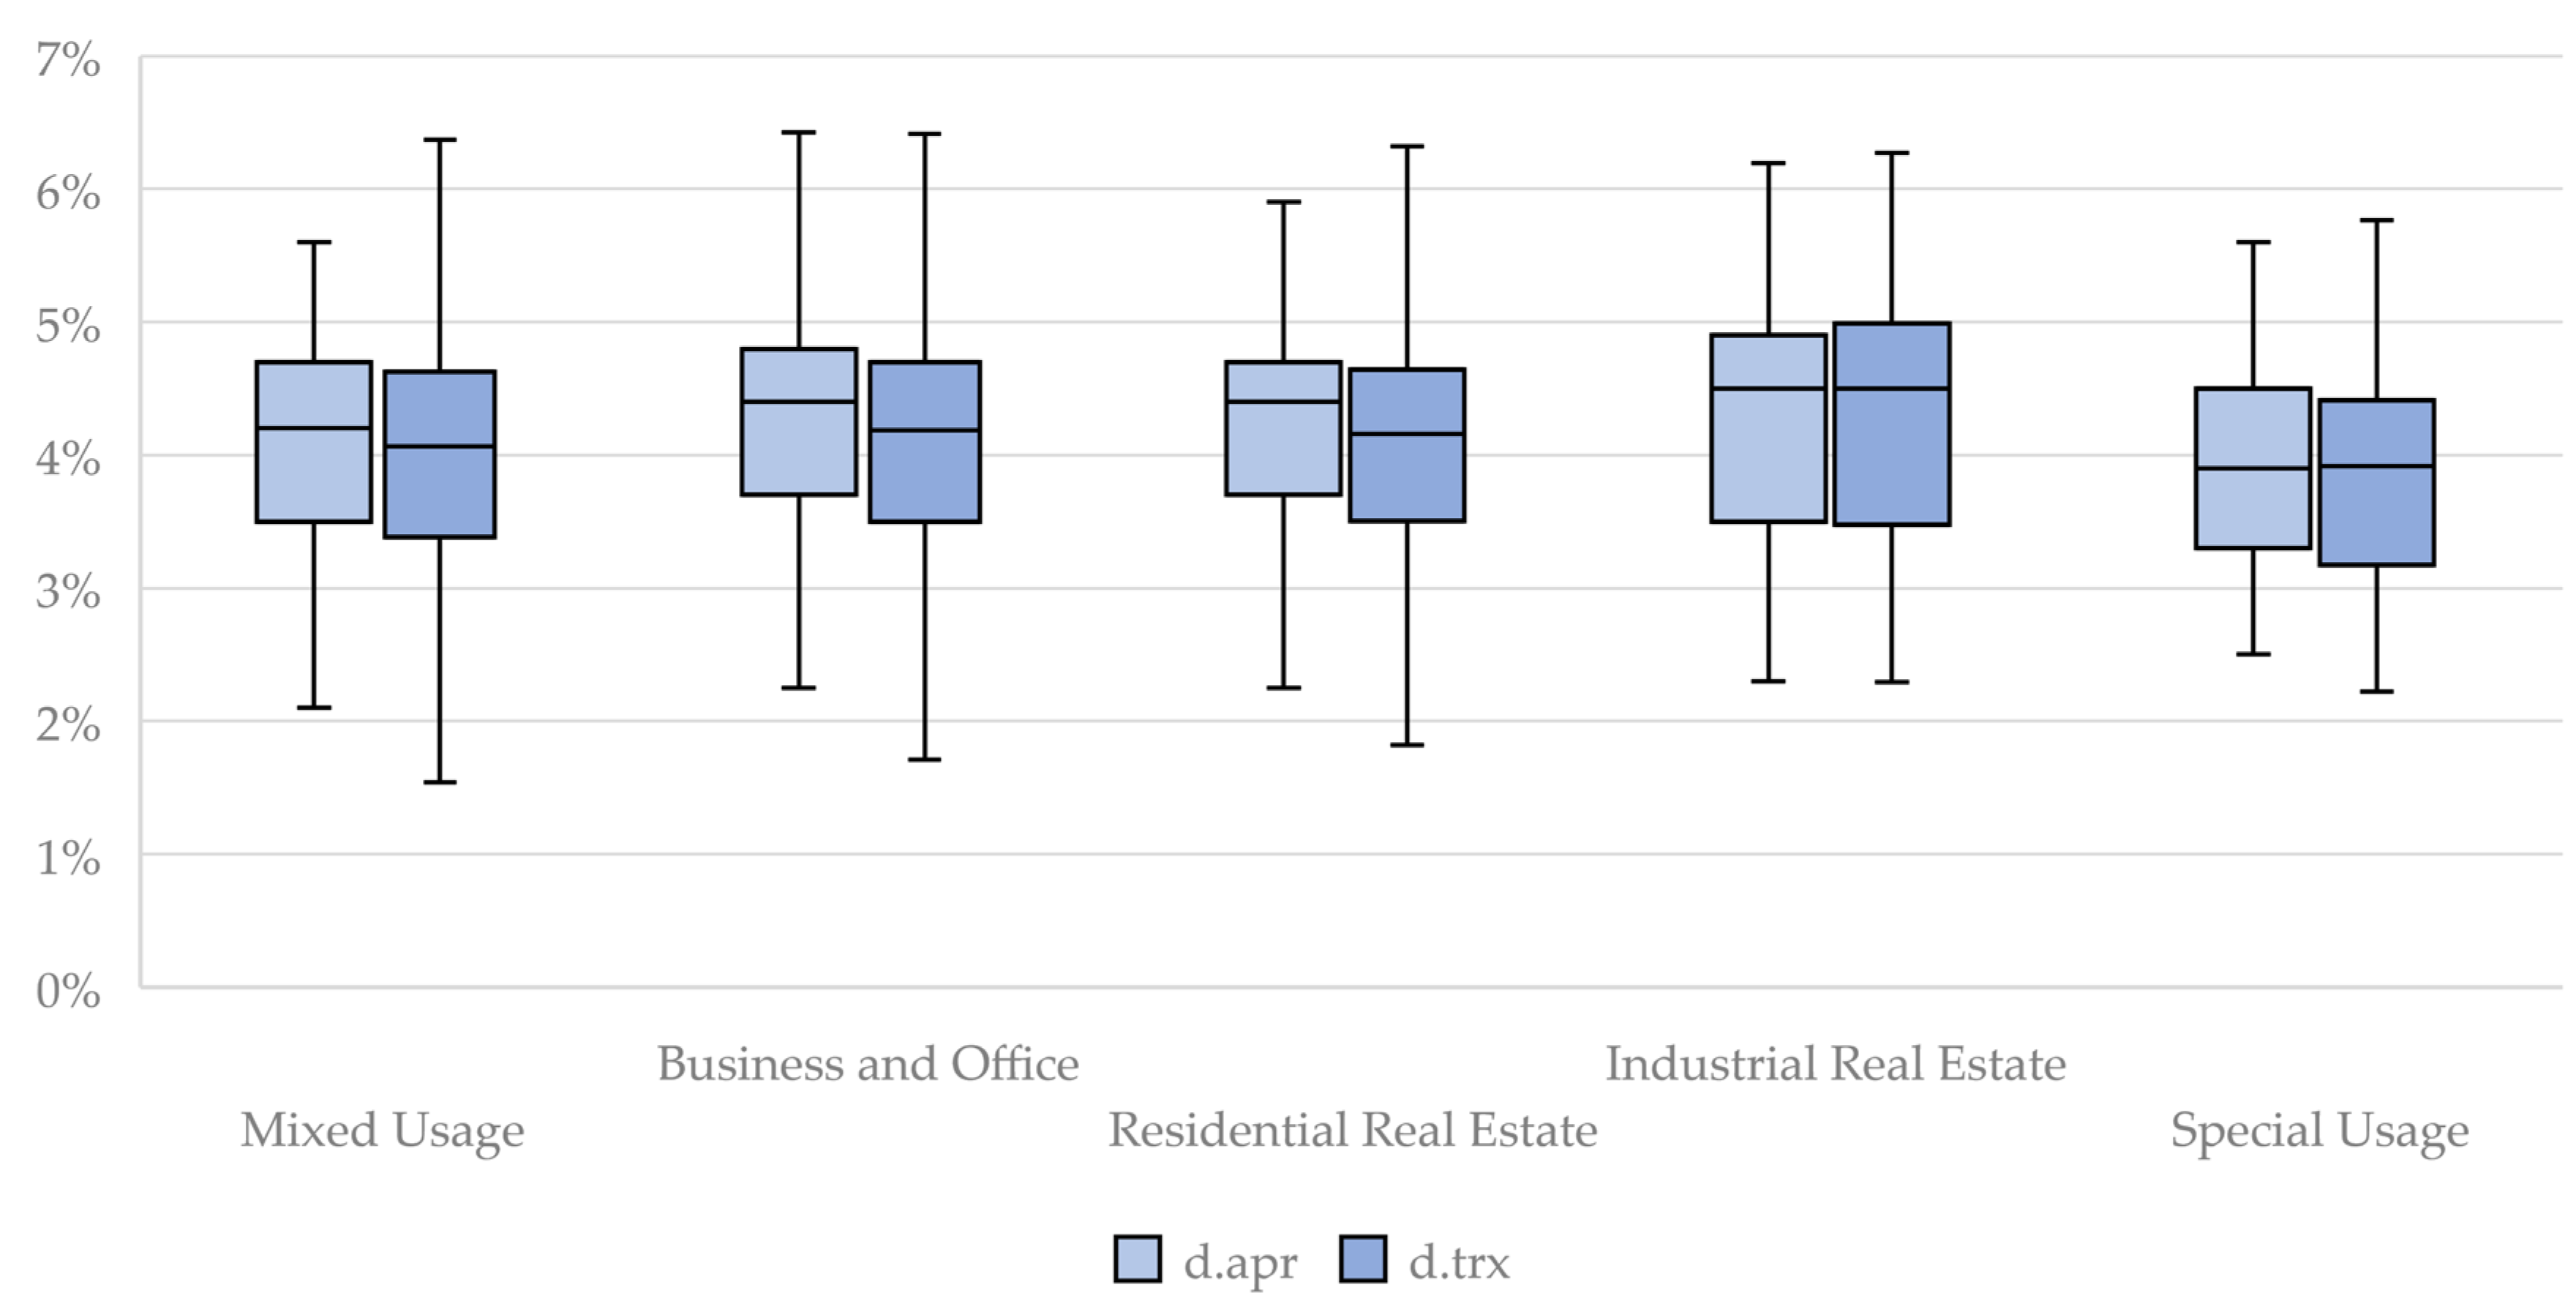
A differentiated picture emerges from Figure 2, which displays transaction-based and appraisal-based discount rates between 2007 and 2020 across different real estate types consisting of business and office properties, industrial real estate, special usage, mixed usage, and residential real estate. Objects are generally classified as residential real estate if the rental income from residential usages exceeds 80%. The same logic is applied to classify industrial real estate or business and office properties, with the latter type being determined by the proportion of office and business target rental incomes. Mixed-usage properties combine residential usage with industrial, commercial, or office usages. Special usages are those which, on the one hand, cannot be classified into the types already mentioned or, on the other hand, have a significant proportion of storage usage. Whereas the highest median discount rates are observed in industrial real estate, the lowest discount rates are found in special usages.
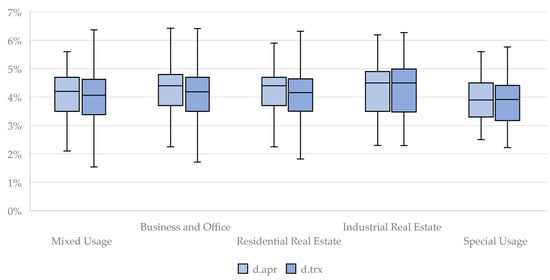
Figure 2.
Type-specific discount rates. Notes: Box plots visualize the distribution of transaction-based (d.trx) and appraisal-based (d.apr) discount rates (source: Wüest Partner) in Switzerland between 2007 and 2020 across different real estate types. Displayed real estate types consist of business and office properties, industrial real estate, special usage, mixed usage, and residential real estate. The displayed span of values extends from the 10th to the 90th percentile. Within the plot, the box ranges from the 30th to the 70th percentile, and the horizontal line within the box denotes the median (50th percentile).
Different discount rates across real estate types argue in favor of a varying risk premium across real estate types. The residential real estate segment, in particular, benefits from structural circumstances, such as low homeownership rates in Switzerland. Approximately 57.8% of Swiss residents in 2020 rented their living space [14], resulting in a sustained demand in the residential real estate segment, which is also reflected in low average vacancy rates ranging between 1.7% in 2020 and 1.1% in 2007 [15]. Furthermore, variations in transaction-based discount rates between real estate types may also be explained by type-specific regulations and uncertainty about future cash flows. Swiss residential rental contracts can generally be terminated within three or six months, which implies that the income generated from this particular usage moves very closely to market rents. Rental contracts for all other usages, on the other hand, run for a fixed maturity. The latter poses additional risks because tenants in these usages are often as important as market movements [16].
As a complex valuation method that requires a substantial amount of detailed data, the DCF method necessitates the formulation of guidelines for assessing the components of the discount rate in real estate valuations. According to the Royal Institution of Chartered Surveyors (2010, subsequently RICS) [17], the risk premium is categorized into market risks and object-specific risks. Market risks encompass factors such as illiquidity risks due to prolonged transaction durations, unavailability of financial resources, and the non-performance of market rental expectations, as well as locational, economic, and legislative risks. On the other hand, object-specific risks pertain to tenant defaults, re-letting uncertainties, ownership and management costs, and variations in lease structures, including lease breaks [17] (p. 9).
Guidelines also exist for the risk-free rate as a component of discount rates, aiming to portray a secure and maturity-equivalent return on the capital market. More specifically, the risk-free rate should reflect a feasible return at the valuation date and align with the investment’s duration [18] (p. 359). Real estate valuation, being a point-in-time assessment, requires a valuation date-specific risk-free rate. While empirical evidence for determining the precise risk-free rate in real estate valuations is limited, opting for a valuation date-specific risk-free rate allows for consideration of current market conditions and developments in the interest rate environment [19].
Furthermore, accounting standards offer some direction on discount rates in real estate valuations, albeit vaguely. For instance, according to the International Financial Reporting Standards (IFRS), discount rates under the DCF approach are expected to be presented as pre-tax and not adjusted for risks already factored into future cash flows [20] (p. 40). Although accounting standards do not explicitly dictate the elements of discount rates, they are implicitly influenced by the disclosure of market values in financial statements. While the US Generally Accepted Accounting Principles (GAAP) standard mandates the presentation of income property values using a historical cost model, the IFRS standard permits the disclosure of values based on fair value, with any resulting gains or losses accounted for in the income statement [21] (p. 97). Consequently, variations in the market values of income properties, potentially influenced by changes in discount rates, can be leveraged to secure external capital, which, in turn, may be reinvested in new opportunities or investments.
3. Review of Literature
The existing literature offers a broad variety of approaches to analyze the determinants of discount rates in the real estate industry. A frequently discussed question refers to the practicality of Sharpe’s (1964) [22] Capital Asset Pricing Model (CAPM) to derive the discount rate for various asset classes. Applying the CAPM to determine assets’ discount rate either follows the direct or the indirect approach. Whereas the direct approach hinges on an adequate approximation of market returns, the indirect approach builds upon asset returns using publicly available returns of similar asset classes. A famous example is given by Jud and Winkler (1995) [23], who focused on cap rates for offices, warehousing/distribution, retail, and apartments from 21 Metropolitan Statistical Area (MSA) in the United States (US) and found that cap rates are robustly associated with capital market returns but respond with significant adjustment lags. Using the CAPM to derive the discount rate of a given real estate object, either through a direct or indirect approach, is confounded by the specific character of real estate objects [24]. For example, the persisting heterogeneity among real estate objects renders it difficult to find adequate benchmark returns for an investor’s specific portfolio. Furthermore, the non-existence of chronological information for alternative real estate types impedes a valid estimation of asset betas. Finally, high transaction costs and long transaction durations, specific fiscal aspects, asymmetric information, risk-averse preferences of market participants, and homogenous beliefs about return distributions are further arguments against a meaningful application of the CAPM to determine the discount rate of real estate objects.
Given these arguments, the vast majority of studies in the relevant literature pursued the strategy to directly estimate assets’ discount rates, including versatile explanatory factors. Among those discount rates, cap rates are by far the most frequently analyzed type. For example, Chuangdumrongsomsuk and Fuerst (2017) [25] analyzed the determinants of transaction-based office cap rates in New York City, Chicago, and Los Angeles between 2000 and 2013 and found that office cap rates are largely driven by local and object-specific variables. Equivalently, MacDonald and Dermisi (2008) [26] focused on transaction-based cap rates for office buildings in Chicago between 1996 and 2007 and detected a robust association with object-specific variables and market forces, such as local vacancy rates and changes in financial sector employment.
A notable study that addressed a wider geographical range was conducted by Sivitanidou and Sivitanides (1999) [27]. The authors assessed the relevance of local-fixed and time-variant components of transaction-based office cap rates between 1985 and 1995 in 18 US MSAs. The authors found that office cap rates are significantly influenced by population growth and the risk-free rate, with the location of a property emerging as one of the strongest predictors of cap rates. Similarly, Chichernea et al. (2008) [28] analyzed the factors driving geographical cross-sectional variation of cap rates for multifamily properties across 34 MSAs in the US. The authors did not report a significant relationship between variables characterizing aggregated demand and average excess cap rates. However, the authors detected a robust and significant relevance of supply determinants, such as the regulation restrictiveness provided by Malpezzi (1996) [29]. The significance of supply determinants is supported by a broad part of the real estate literature and suggests an inefficient pricing mechanism across real estate markets at a given point in time [30].
Another study by Chervachidze and Wheaton (2010) [31] investigated whether standard explanatory factors of cap rates can reasonably be extended by additional macroeconomic determinants. In particular, the authors analyzed whether a certain measure for the general corporate risk premium and the growth rate of debt relative to the GDP contain additional explanatory power for cap rates. Using a dataset consisting of quarterly values capturing appraisal-based cap rates for the commercial real estate segment across 30 MSAs in the US from 1980 to 2009, the authors concluded that their sophisticated model displays a considerably larger predictive power than their baseline model across all subgroups of commercial real estate segments. In a similar vein, Larriva and Linnemann (2022) [32] discovered compelling indications of fund flows predicting transaction-based cap rates within the office and multifamily sector. In applying a Vector Error Correction Model (VECM) to a dataset capturing quarterly observations between 1993 and 2020, the authors concluded that their sophisticated model outperforms standard predictors as suggested by the relevant literature. Specifically, the authors found that explaining cap rates using cash flow, unemployment rates, and historical cap rates led to a more accurate estimation of cap rates compared to using risk premiums, return expectations, and past cap rates.
A recent study by Letdin et al. (2023) [33] analyzed approximately 8000 single-tenant retail property transactions from 2005 to 2019 in the US. Their main emphasis involved the analysis of the risk linked to tenant attributes while controlling for object-specific characteristics, deal and lease characteristics, local characteristics, and macroeconomic indicators. Using LASSO (Least Absolute Shrinkage and Selection Operator) regression techniques to adequately select the relevant predictors, the authors concluded that tenant credit-worthiness indicators, the ownership structure, and default risks are some of the primary drivers of cap rates.
When examining the geographical focus of the aforementioned studies, a considerable number of them concentrated on the US and its subregions. Despite being relatively less common, some studies have focused on the European continent. For instance, MacAllister and Nanda (2016) [34] addressed the question of whether foreign real estate investments are a driving force of cap rates. In focusing on the office market capturing 28 European cities from 15 countries between 1999 and 2013, the authors analyzed transaction-based cap rates from around 9000 office sales by means of a two-step estimation procedure. Although the results hardly depend on the country considered, the authors identified persistent effects stemming from foreign real estate investments on cap rates.
While the majority of existing studies have concentrated on cap rates, there are also a few studies that have examined the determinants of discount rates in DCF valuations. Gunnelin et al. (2004) [7] analyzed the main determinants of appraisal-based discount rates in the DCF procedure, capturing approximately 600 appraisal-based office valuations in the three largest cities of Sweden in 2000. The authors found that discount rates for office properties in rural areas are about 75 basis points higher than those in central locations. Furthermore, the authors observed a significant connection between lower discount rates and properties with higher market rents, while higher discount rates were associated with properties exhibiting a higher long-run vacancy rate.
The existing literature offers compelling insights into the fundamental determinants and mechanisms underlying either appraisal-based or transaction-based cap rates, utilizing a variety of explanatory factors. However, most studies have concentrated on a single property type, leaving a significant gap in understanding the practicality of fundamental determinants across different asset classes. This gap gains in relevance as even within studies focusing on similar asset classes, multifaceted representations of object-specific, locational, and macroeconomic variables can be observed [25,26,27,34]. While this observation is certainly also attributable to differing research questions being examined or varying datasets used, the question about the generalizability of the fundamental determinants of discount rates, or cap rates in this regard, has insufficiently received attention in the prevalent literature. The almost exclusive focus on transaction-based cap rates further raises questions about the decision-making of appraisers. Being obliged to provide an objective assessment of a given property, few empirical findings exist about how these critical stakeholders focus on fundamental determinants of discount rates and how the weight attached to factors varies among asset classes. More generally, varying perceptions among investors and appraisers have rarely been explored in the existing literature, which further underscores the subjective nature of discount rates in the real estate industry. Empirical findings on the fundamental factors influencing discount rates in DCF methods are scarce, prompting the question of the extent to which the driving forces of cap rates may be applied in this valuation method. Building on this, this study seeks to address these gaps by offering a rigorous analysis of the fundamental drivers of both appraisal-based and transaction-based discount rates across diverse real estate types using standardized data sources.
4. Methodology
The study applies a direct estimation approach, guided by theory and intuition, to estimate and compare the determinants of appraisal-based and transaction-based discount rates, exploiting their functional benefits expressed as a function of object-specific, locational, and macroeconomic variables:
This functional advantage is at the expense of heterogeneous discount rates across time, real estate types, and locations. To address these concerns, the methodology is based on theoretically and empirically grounded determinants of appraisal-based and transaction-based discount rates. The baseline estimation equation is summarized as follows:
where are discount rates , represented by appraisal-based and transaction-based discount rates, for asset at a given date ; is a constant; is a risk-free rate; represents inflation; is a vector of variables characterizing the risk premium; is a vector of control variables; and is an error term.
Since the underlying dataset (Section 5) contains real estate transactions throughout Switzerland over a period of fourteen years (2007 to 2020), some object-specific variables display a large variation. To diminish the influence of such variations, the baseline estimation equation will be constructed using robust regression techniques. Robust regressions are a fitting estimation technique to deal with heteroskedasticity or if any other fundamental assumptions, such as the normal distribution of the residuals, are unfulfilled by the data [35]. A commonly applied robust regression method is the M-estimation, which is a maximum likelihood estimation technique. The M-estimation minimizes the objective function , where summarizes the contribution of each residual to the objective function. Defining as the influence curve, differentiating the objective function with respect to , and setting the partial derivative to results in the following: , where the weight function is defined as with . These equations are solved with iteratively reweighted least-squares [36]. The subsequent estimation procedure applies Huber’s (1981) [37] M-estimations, which utilizes a weight function that assigns a weight of 1 to observations with small residuals while decreasing the weight as the residuals increase.
To control for the unobserved heterogeneity affecting either appraisal-based or transaction-based discount rates, dummy variables reflecting the respective real estate type, quarter, year, and region (Swiss cantons) are included. These variables are captured by in the estimation Equation (5). Regional dummy variables account for non-varying market-specific effects and prove to be relevant because, as an immovable asset bound to a specific location, income properties are directly affected by their location. In Switzerland specifically, local variations between discount rates may arise from the federal system, which specifies that the federal state and the 26 cantons are fiscal jurisdictions. These cantons may delegate some authority to their municipalities, resulting in a very heterogenous regulatory landscape affecting Swiss real estate markets [38]. For instance, significant inter-cantonal differences exist in the tax obligations incurred during the acquisition of a real estate asset, as well as the tax burdens associated with the ownership of such an asset. Including year and quarter dummy variables accounts for the seasonality in discount rates, as observed in Figure 1, while the inclusion of type-specific dummy variables accommodates variations in discount rates among real estate types (Figure 2).
Multifaceted Relative Importance (RI) measures are applied to deepen the understanding of how appraisers and investors weigh specific determinants of discount rates. The RI refers to an individual regressor’s contribution to a multiple regression model. While the end goal is to divide the overall into relative weights for each regressor, respective results either sum up to the respective or to 1.0 when weights are proportions [39]. Proportions of the RI will be displayed under the consideration of several RI measures. The first RI measure, last, which is also called “usefulness” by Darlington (1968) [40], is a type of metric that computes the fraction of the total variability in the response variable that is accounted for by each predictor variable when it is added to the model last. This metric is identical to the alteration in that arises from the inclusion of each predictor variable last. The second RI measure, first, calculates the proportion of variance in the response variable that is explained by each predictor variable when it is added to the model first. This metric quantifies the amount of variability in the response variable that is uniquely accounted for by each predictor variable when no other variables have been included in the model. The third measure, betasq, calculates the squared standardized beta coefficients for each predictor variable, which represent the strength and direction of the linear relationship between the predictor variable and the response variable, standardized by their standard deviation [41]. The fourth measure, car, is the correlation-adjusted marginal correlation (CAR-Score) by Zuber and Strimmer (2011) [42] and approximates the importance on the basis of a canonical ordering of grouped correlated predictors. Finally, the decomposition by Genizi (1993) [43], genizi, focuses on orthogonal compatibility and is based on a specially constructed orthonormal basis for the space of all predictors [44]. In order to make the RI across all variables comparable, proportional scaling on all RI measures considered is applied.
To assess the validity of the findings, the estimation approach, encompassing robust regression techniques and various RI measures, is applied to both a full-sample analysis and a type-specific analysis. The type-specific analysis delves deeper into the determinants of discount rates for different real estate types, encompassing residential and commercial real estate buildings. By disaggregating the data, the study aims to identify unique factors driving discount rates within distinct real estate types, providing a nuanced understanding of the critical role of object-specific, locational, and macroeconomic variables in shaping appraisal-based and transaction-based discount rates.
5. Data and Variable Description
The subsequent analysis utilizes a unique dataset containing detailed information on the transaction processes of income properties in Switzerland from 2007 to 2020. When a commercial investor wishes to buy or sell an income property, it is evaluated by an independent appraisal firm. After the transaction, the details are transmitted back to the appraiser, allowing refinement of the original valuation and the implicit derivation of transaction-based discount rates. The present dataset bundles detailed information throughout the appraisal and transaction process, containing detailed information reflecting appraisers’ expert knowledge enriched with transaction details. As every income property in the dataset has undergone both appraisal and market transactions, a robust foundation for conducting a counterfactual analysis of the determinants of appraisal-based and transaction-based discount rates is established.
Table 1 summarizes the variables for the subsequent analysis, while corresponding summary statistics are attached in Table A1 of Appendix A.1. Various macroeconomic and locational variables are taken into account that influence discount rates. To approximate a secure and maturity-equivalent return on the capital market, the risk-free rate is modeled using yields on government bonds with a 20-year maturity. This extended governmental bond maturity is selected based on the assumption that longer bond maturities and their associated higher interest rates more accurately capture investors’ return expectations, particularly during periods of expansionary monetary policy with declining interest rates. The quarterly level of inflation is used to represent the compensation for inflation, as established in Equation (2). This approach aligns with the available information for appraisers and investors, providing a practical method to account for the compensation demanded by investors and offering insight into how appraisers address inflation. Next, the estimation procedure accounts for real GDP growth rates, as the fundamental relationship between economic growth and changes in rental incomes shapes market participants’ expectations regarding future cash flows. Among the macroeconomic variables affecting discount rates, the study incorporates a variable indicating the absolute difference between quarterly growth rates of the Swiss Market Index (SMI) and yields on government bonds with a 20-year maturity (Spread). This variable serves as a measure of the economy-wide risk appetite as it compares returns on the stock market with those of risk-free bonds.

Table 1.
Variable description.
On a municipality level, yearly population growth rates and vacancy rates are accounted for to capture appraisers’ and investors’ expectations of rental growth in response to altered local conditions. The risk premium associated with a specific income property is determined by a set of variables unique to that object. This includes the object-specific vacancy rate, derived from detailed rent roll information. To account for locational characteristics influencing discount rates, the real estate type-specific micro- and macro-location ratings are included. Whereas the macro-location rating is a standardized assessment that reflects the quality of a municipality as a whole, the micro-location rating specifies the precise location of an income property within a particular municipality. The macro-location rating accounts for fundamental location-specific elements such as the municipality type, tax burden, labor market conditions, and price developments.
With the inclusion of the object-specific quality rating in the empirical analysis, a standardized assessment for evaluating the market value of an income property is accounted for. This rating encompasses information about the condition and standard. In alignment with the majority of analogous empirical studies, the age of a given income property is factored into the analysis. Specifically, the study considers a simplified economic age by taking into account the date of a complete refurbishment (a complete refurbishment refers to a comprehensive renovation of the interior as well as the exterior of a given object). The effective area, the size of a given object, is associated with the group of object-specific risk premiums, quantifying exposure to a specific location while accounting for diversification aspects. The study also assesses the significance of average rental contract durations. The inclusion of persistent contract durations offers insights into object-specific risks associated with re-letting or the planning for future incomes. The significance of average contract durations depends on the composition of usages within a particular object. Since residential housing contracts in Switzerland can generally be terminated within three months, average contract durations relate to commercial real estate, which is subject to a fixed maturity.
The present dataset encompasses a diverse range of fundamental drivers that characterize discount rates derived from the DCF method between 2007 and 2020. A crucial feature of this dataset lies in the incorporation of expert-based knowledge along with a limited set of additional sources. All data were sourced from federal administrations (SNB and Federal Statistical Office) or Wüest Partner, a leading real estate consulting firm in Switzerland. The use of a small number of sources standardizes the dataset, facilitating comparisons of specific variables across different real estate segments.
6. Empirical Results
The subsequent discussion of empirical findings first presents the results from applying the estimation approach to the full sample (Section 6.1), which contains income properties from various real estate types that have been part of market transactions between 2007 and 2020. Thereafter, the empirical investigation centers on a type-specific analysis (Section 6.2), considering residential and commercial real estate objects separately. Section 6.3 discusses the results when applying multifaceted RI measures to the findings presented in the previous sections.
6.1. Full-Sample Analysis
Table 2 displays the results when analyzing the determinants of appraisal-based (Model 1) and transaction-based (Model 2) discount rates for the full sample. The micro-location rating, the macro-location rating, and the object-specific rating are all inversely connected with appraisal-based and transaction-based discount rates. Whereas a one-unit increase in the macro-location rating has the potential to decrease both types of discount rates by approximately 3%, notable differences are observed in the context of the micro-location and the object-specific quality rating. Appraisers appear to place greater emphasis on the precise location of a given property than investors, which becomes apparent considering that a one-unit increase in the micro-location rating decreases appraisal-based discount rates by approximately 0.8% more than transaction-based discount rates. Regarding the object-specific quality rating, differences become even larger. A one-unit increase in the object-specific quality ratings decreases appraisal-based discount rates by approximately 3.9% and transaction-based discount rates by 2.3%.
Table 2.
Full-sample analysis.
Object-specific vacancy rates enter with a positive sign into the estimation equation for both types of discount rates, suggesting that appraisers and investors perceive persistent vacancy rates as an additional risk. The effective area, used as a proxy for the size of a property, displays a heightened sensitivity to transaction-based discount rates, underscoring investors’ heightened consideration of property size in their asset diversification and investment decisions. Interestingly, while the object-specific age shows the expected sign, its lack of significance suggests that age plays a subordinated role in determining discount rates in the DCF. This observation may inherently be tied to the DCF method, which explicitly accounts for depreciation over time, or routine maintenance and renovations already factored into the object-specific quality rating.
In the group of locational and macroeconomic determinants, several results are noteworthy. The risk-free rate enters the estimation equation with a positive coefficient, indicating a significant association between discount rates and changes in the interest rate environment. Notably, transaction-based discount rates exhibit a considerably larger interest rate sensitivity compared to appraisal-based discount rates. The analysis reveals that a 1 percentage point (pp) increase in long-term interest rates corresponds to an approximately 3% rise in appraisal-based discount rates and a 5% increase in transaction-based discount rates. This heightened sensitivity in transaction-based discount rates is attributed to their market-driven nature, leading to greater responsiveness to immediate market conditions and short-term fluctuations in interest rates.
Population growth, akin to the risk-free rate, appears to exert mixed effects on discount rates. The pronounced impact on transaction-based discount rates likely reflects investors’ heightened attention to local real estate market dynamics. Moreover, population growth can signal future shifts in market demand that are more relevant to investors than to appraisers, potentially leading the latter to underestimate local market dynamics.
This disparity in perception among market participants also raises questions about inflation’s role in discount rates. Appraisers traditionally integrate broader economic conditions, including inflation, into real estate valuations. In contrast, investors, with potential shorter investment horizons, prioritize current market conditions, where inflation’s influence on investment decisions is comparatively diminished. Additionally, in a declining inflationary environment, transaction-based metrics may exhibit reduced sensitivity to inflationary changes, especially if factors such as shifts in interest rates or changing investor expectations counteract inflation’s impact.
The coefficient associated with real GDP growth rates indicates that overall economic development in Switzerland positively influences discount rates. This finding supports the interpretation that a stronger economy enhances expectations of rental growth, thereby affecting discount rates accordingly. The significance of macroeconomic factors in discount rate determination is underscored by the substantial impact of the economy-wide risk premium (Spread), particularly notable in transaction-based discount rates. Similarly, the local vacancy rate shows a direct connection with discount rates, with a more pronounced effect observed in transaction-based discount rates.
6.2. Type-Specific Analysis
In order to further analyze the influence of specific variables on discount rates and to critically assess the presented coefficients from the full-sample analysis, Table 3 summarizes the results when applying the same empirical strategy separately for residential real estate and commercial real estate. The residential real estate segment exclusively encompasses residential buildings, whereas the commercial real estate segment contains a diverse range of real estate types, including business and office spaces, industrial real estate, and objects with mixed or special usages. All real estate types that are grouped to the commercial real estate segment contain a significant share of commercial usages. Variables are defined identically as in the full-sample analysis from Table 2.
Table 3.
Type-specific analysis.
Turning to the results for residential real estate detailed in Models (1) and (2) of Table 3. The micro-location and macro-location ratings are both inversely connected to discount rates, though appraisal-based discount rates show a stronger sensitivity to variations in these ratings. Notable disparities are observed specifically for the object-specific quality rating, which significantly impacts appraisal-based discount rates but has a negligible effect on transaction-based discount rates. The results further reveal that the object-specific age plays a minor role in explaining discount rates for the residential real estate segment. The same holds true for the object-specific vacancy rate, which does not significantly affect both types of discount rates. The object-specific vacancy rate may be a weak predictor of discount rates in the residential real estate segment due to local circumstances, such as relatively high tenant occupancy rates and the resulting low vacancy risk. Conversely, the size of residential real estate properties exhibits a significant positive association with discount rates, with transaction-based discount rates demonstrating greater sensitivity compared to appraisal-based discount rates.
Examining the macroeconomic determinants of discount rates in the residential real estate segment reveals a particularly notable effect of risk-free rates, approximated by long-term interest rates. An increase in long-term interest rates by 1 pp raises appraisal-based discount rates by approximately 2.2% and transaction-based discount rates by 5.7%. The considerably higher sensitivity of transaction-based discount rates to the long-term interest rates may be traced back to the Swiss regulatory environment, which states that residential rents are tied to the reference index. The reference index is a weighted average of mortgage interest rates in Switzerland. It is published quarterly and implies that tenants and owners have the right to enforce rent adjustments accordingly. If the reference index increases, owners can enforce an increase in rents, and vice versa for a decreasing reference index. Consequently, the interest rate environment plays a decisive role for income streams derived from residential real estate objects, which increases in relevance for investors and transaction-based discount rates.
As already observed in the full-sample analysis (Table 2), the impact of inflation on appraisal-based discount rates is statistically significant, whereas transaction-based discount rates show no significant connection with inflation. This result may be interpreted as evidence that appraisers tend to take a more comprehensive and forward-looking approach, whereas investors demonstrate greater responsiveness to short-term market dynamics. This picture is strengthened by the direct connection between GDP growth rates and appraisal-based discount rates. Notably, investors place a heightened emphasis on the local vacancy rate compared to appraisers. Explanations include that current vacancy rates have a direct impact on investors’ beliefs about future rental incomes, making them more sensitive to fluctuations in the communal vacancy rate.
Consider the determinants of discount rates in the commercial real estate segment, as summarized in Models (3) and (4) of Table 3. Several object-specific variables gain in significance and magnitude in the commercial real estate segment for both types of discount rates. Object-specific variables such as the micro- and macro-location rating, as well as the object-specific quality rating, exhibit sensitivities that are more than double those observed in the residential real estate segment (Models (1) and (2) of Table 3). Similarly, the significantly higher sensitivity of transaction-based discount rates compared to appraisal-based discount rates for commercial real estate suggests that investors prioritize object-specific characteristics more heavily. This can be attributed to the market’s immediate responsiveness to nuanced object-specific factors, reflecting investors’ perception of the impactful role of such characteristics in shaping the perceived value and performance of commercial real estate objects.
Rental contract durations play a pivotal role in the commercial real estate sector as they serve as critical indicators of future expected rental incomes. Models (3) and (4) in Table 3 include the duration of tenant contracts (Contract_dur) for income properties with commercial usages to evaluate this segment-specific characteristic. The estimated coefficients indicate that longer contract durations are associated with lower appraisal-based and transaction-based discount rates. Notably, appraisal-based discount rates demonstrate a higher sensitivity to persistent contract durations. This heightened sensitivity can be attributed to appraisers’ meticulous consideration of contract durations, acknowledging that stable or extended durations significantly impact overall cash flow stability and predictability, thus placing greater emphasis on this variable in the DCF method and the appraisal process.
Compared to the residential segment, the significance and relevance of macroeconomic variables have undergone a shift in the commercial real estate segment. Specifically, the sensitivity of the risk-free rate in elucidating discount rates for commercial real estate has waned, potentially reflecting investors’ heterogeneous return expectations for commercial properties and appraisers’ difficulty in finding adequate benchmark returns within this particular segment. In contrast, population and GDP growth have increased importance for both types of discount rates, with transaction-based discount rates displaying heightened sensitivities in comparison to appraisal-based discount rates. As these variables serve as indicators for future cash flow developments, it can be concluded that investors, in particular, place emphasis on local circumstances when making investment decisions. This emphasis on local factors is further underscored by the relevance of local vacancy rates, which contribute to an increase in both types of discount rates.
6.3. Relative Importance
To gain deeper insights into the determinants influencing discount rates, this section utilizes Relative Importance (RI) measures to analyze and compare the fundamental drivers of appraisal-based and transaction-based discount rates. While each RI measure has its unique attributes, the focus is on the average (avg) RI across all measures for variables grouped into object-specific, locational, and macroeconomic categories. Figure A1 in Appendix A.2 also visualizes the RI of the full set of variables, including control variables. While the RI of these control variables is displayed for completeness, they are not the primary focus of the interpretation.
First discussed are the findings presented in Table 4, which provides an overview of the RI values derived from the full-sample analysis. The average RI of object-specific variables is slightly higher for appraisal-based discount rates at 13.0% compared to 12.1% for transaction-based discount rates across all real estate types. Among these variables, the micro- and macro-location ratings, along with property size, exhibit the highest average RI. The micro-location rating has high relevance for appraisal-based discount rates, whereas property size plays a significant role in transaction-based discount rates. These findings suggest that appraisers prioritize quality criteria in determining risk premiums, while investors focus more on asset size and associated cluster risks. This distinction is also highlighted by the disparity in the RI for quality ratings, where overall property quality holds greater importance for appraisal-based discount rates (2.6%) than for transaction-based discount rates (0.9%).
Table 4.
Relative importance—full sample.
Table 4 further reveals that object-specific age and persistent vacancy rates show modest relevance in relation to discount rates. We conjecture that because discount rates in the DCF method do not explicitly account for risks already incorporated into cash flows, the relevance of age and vacancy rates is diminished. Additionally, differences in appraisers’ perspectives and investors’ perceptions of risks may further diminish the importance of these variables. The largest relevance is attached to macroeconomic variables, which in total contribute 29.8% (appraisal-based) and 34.2% (transaction-based) to the explained variance in discount rates across all considered measures. The risk-free rate is by far the most relevant determinant, amounting to an average RI of 18.0% for appraisal-based and 20.4% for transaction-based discount rates. GDP growth rates are also a particularly relevant determinant of discount rates, representing 6.4% (appraisal-based) and 6.9% (transaction-based) of the average RI across all real estate types.
The results from Table 4 indicate disparities in the attribution of relevance between appraisers and investors concerning object-specific, locational, and macroeconomic variables in the full-sample analysis. To further examine this observation, RI measures are applied separately to the residential and commercial real estate segment. Table 5 summarizes the results obtained through the analysis of RI measures for residential real estate objects. Respective RI values demonstrate a pattern that aligns closely with the previously discussed findings in Table 4. While the micro-location rating undergoes a notable decline in relevance, the overall results indicate that object-specific characteristics collectively account for approximately 8.6% (appraisal-based) or 6.1% (transaction-based) of the average RI across all measures considered in the residential real estate segment.
Table 5.
Relative importance—residential real estate.
The reduced significance of object-specific variables in explaining discount rates for residential real estate objects can be attributed to structural factors in Switzerland. Investments in residential real estate benefit from strong demand, supported by high tenant occupancy rates and consequently low vacancy risks. While residential real estate investments are generally perceived as low risk, the interpretation of object-specific variables varies notably between appraisers and investors. Appraisers prioritize micro-location and macro-location ratings, crucial for assessing the intrinsic value of residential properties within a broader market context. In contrast, investors place less emphasis on these ratings, potentially influenced by the historically low vacancy rates during the period under consideration. The lower risk of tenant turnover is also reflected in the diminished importance given to the object-specific quality rating, which conversely holds greater relevance for appraisers.
The predominant portion of the RI for residential discount rates (Table 5) is ascribed to macroeconomic variables, collectively contributing 30.2% in appraisal-based and 31.5% in transaction-based discount rates. Within this category, the risk-free rate stands out as the most critical determinant for both types of discount rates, with an average RI of approximately 20%. Given the perception of residential real estate as low risk, variations in discount rates are closely linked to the risk-free rate, a fundamental benchmark in the capital market. This significance is amplified by Switzerland’s regulatory framework, where rental payments are tied to the reference index, making interest rate fluctuations crucial for future rental incomes.
When examining the RI of specific determinants for the commercial real estate segment (Table 6), a different pattern emerges. Notably, the average relevance of object-specific characteristics is estimated to be 26.0% for appraisal-based discount rates and 24.6% for transaction-based discount rates. Among these characteristics, local quality ratings, particularly the micro-location and macro-location ratings, are particularly important for both types of discount rates. This heightened importance in the commercial segment can be attributed to businesses prioritizing strategic locations to attract customers or clients. The success of commercial real estate often hinges on factors such as the proximity to business centers, accessibility, and the economic vitality of the region, which are effectively captured by these locational ratings. Diving deeper, the results reveal that the micro-location rating is the most relevant predictor of both types of discount rates, with appraisers attaching an even greater weight to this particular rating. Investors, in particular, prioritize the macro-location rating more than appraisers, reflecting their commitment to thorough and systematic market analysis when making investment decisions.
Table 6.
Relative importance—commercial real estate.
Table 6 reveals significant divergences in RI values between appraisal-based and transaction-based discount rates for commercial real estate, particularly concerning the object-specific quality rating and size. Appraisers emphasize the object-specific quality rating, meticulously analyzing unique property characteristics to ensure a thorough and transparent appraisal. In contrast, the heightened relevance of size for transaction-based discount rates reflects the increased risk premium demanded by investors. Investors’ focus on size may be driven by diversification considerations and income potentials, as larger properties offer greater rental income opportunities due to their expanded tenant space but also introduce higher associated risks.
Table 6 shows a significant decline in the relevance of the risk-free rate, which is 15.0% for appraisal-based and 13.3% for transaction-based discount rates. While not significant in the estimation equations for commercial discount rates (Table 3), the risk-free rate remains the most relevant determinant, underscoring its role as a secure, maturity-equivalent return. Interestingly, GDP growth rates have gained importance in explaining discount rates for the commercial real estate segment. This increased relevance underscores the vital connection between commercial tenants, whose economic performance is closely tied to GDP growth, and the valuation of commercial properties. Thus, both appraisers and investors consider GDP growth rates crucial for determining discount rates, reflecting future income potentials and risks. Despite the shift in relevance between macroeconomic variables, their overall importance for discount rates in the commercial real estate segment remains substantial, averaging 28.6% for appraisal-based and 31.3% for transaction-based discount rates.
7. Conclusions
This study delves into the determinants of discount rates, a critical factor elucidating the market values of income properties. Despite their significance, there exists a notable dearth of empirical research on the factors influencing discount rates within the application of the discounted cash flow (DCF) method. Building on this, the study conducts a comprehensive counterfactual analysis of the driving forces behind both appraisal-based and transaction-based discount rates. By employing the estimation approach across the full sample and separately for the residential and commercial real estate segments, the empirical investigation provides valuable insights into the determinants influencing the decision-making process of key stakeholders in the real estate industry. This study not only deepens our understanding of the factors influencing discount rates but also contributes to the broader body of knowledge surrounding income properties’ market valuation.
The full-sample analysis reveals that both types of discount rates are significantly associated with object-specific, locational, and macroeconomic variables. Appraisal-based discount rates exhibit heightened sensitivity to the micro-location and the object-specific quality rating, reflecting appraisers’ adherence to professional standards. In contrast, investors prioritize object-specific vacancy rates and size, with the latter having the highest Relative Importance (RI) among object-specific variables, highlighting their emphasis on investment decisions and asset diversification. Additionally, macroeconomic variables indicate that transaction-based discount rates are more responsive to interest rate fluctuations, reflecting investors’ market-driven perception, whereas appraisers focus more on standardized object-specific characteristics.
Conducting the analysis across residential and commercial real estate segments revealed a lack of homogeneity in the impact of specific variables. In the residential segment, object-specific variables exhibit relatively low RI values of 8.6% for appraisal-based and 6.1% for transaction-based discount rates. This observation may be attributed to structural conditions in Switzerland, such as a high proportion of tenants in the population, leading to a perceived low risk in residential real estate investments. Macroeconomic variables dominate in the residential segment, accounting for a RI of 30.2% in appraisal-based and 31.5% in transaction-based discount rates. Among these, the risk-free rate emerges as a crucial determinant, with an average RI of approximately 20%. The significance of the risk-free rate is tied to Switzerland’s regulatory framework, where rental payments are linked to the reference index, making interest rate fluctuations pivotal for future rental incomes from residential real estate.
In the commercial real estate segment, the analysis underscores the growing importance of object-specific variables, particularly the micro- and macro-location ratings, as well as the object-specific quality rating. Their sensitivity is more than twice as high as in the residential segment, with transaction-based discount rates displaying a notably greater sensitivity compared to appraisal-based discount rates. This heightened sensitivity in transaction-based discount rates reflects the market’s immediate response to nuanced object-specific factors, emphasizing investors’ acknowledgment of these characteristics’ influential role in shaping perceived value and performance. On average, object-specific characteristics contribute 26.0% to appraisal-based and 24.6% to transaction-based discount rates in terms of RI values. The shift in relevance between macroeconomic variables does not substantially impact their overall contribution: 28.6% for appraisal-based and 31.3% for transaction-based discount rates in the commercial real estate segment.
This study illuminates crucial factors influencing the decision-making processes of appraisers and investors. Appraisers, mandated to derive objective valuations during the appraisal process and estimate likely selling prices for income properties, often face the challenge of incorporating the heterogeneous risk perceptions of commercial real estate investors and capturing market sentiment accurately. The findings of this study advocate for the application of type-specific methodologies when determining discount rates in the DCF method. For residential real estate, while object-specific and locational variables remain crucial, greater emphasis should be placed on fundamental macroeconomic determinants. Conversely, in the context of commercial real estate, standardized and widely accepted object-specific and locational variables may carry more weight, with macroeconomic variables playing a smaller yet still significant role. Additionally, the results question the applicability of commonly used determinants of discount rates in the literature, such as population growth and the age of the property. Appraisers may benefit from incorporating widely recognized indicators, such as GDP growth rates and appropriate risk-free rates, to more adequately derive discount rates.
Moving forward, it is essential for future research to expand upon this fruitful research topic, deepening our understanding of the underlying rationale and actions of these key stakeholders involved in the real estate industry. As of today, there is a limited availability of publicly accessible data regarding discount rates for the DCF method. Future research endeavors could benefit from incorporating datasets from multiple appraisal firms to enhance the generalizability of findings, capturing a broader spectrum of appraisers’ and investors’ perspectives and methodologies in real estate valuation. Especially in light of the recent increase in interest rates, extended knowledge about the determinants of discount rates will remain a topic of great interest for real estate practitioners and policymakers.
Funding
This research received no external funding.
Institutional Review Board Statement
Not applicable.
Informed Consent Statement
Not applicable.
Data Availability Statement
The datasets used and/or analyzed during the current study are available from the corresponding author on reasonable request.
Acknowledgments
I would like to thank Wüest Partner for providing the basic data.
Conflicts of Interest
The author declares no conflicts of interest.
Appendix A
Appendix A.1
Table A1.
Summary statistics.
Table A1.
Summary statistics.
| Variable Variable Name | Min. | Max. | Mean | Median | Std. Dev. |
|---|---|---|---|---|---|
| Transaction-based discount rate | 1.48 | 8.35 | 4.12 | 4.19 | 0.85 |
| Appraisal-based discount rate | 2.00 | 6.90 | 4.23 | 4.40 | 0.73 |
| Macro location rating Macro_R | 1.15 | 5.00 | 4.21 | 4.38 | 0.73 |
| Micro location rating Micro_R | 1.40 | 5.00 | 3.60 | 3.60 | 0.62 |
| Object quality Rating Object_R | 1.57 | 5.00 | 3.42 | 3.37 | 0.55 |
| Age Age | 0.00 | 100.00 | 30.09 | 27.00 | 20.86 |
| Effective area Eff_area | 60.00 | 73,383.00 | 3876.67 | 2085.00 | 5684.84 |
| Object-specific vacancy rate Vac_P | 0.00 | 100.00 | 7.31 | 0.78 | 16.54 |
| Yields on governmental bonds Govb_20Y | −0.41 | 3.42 | 1.42 | 1.33 | 1.11 |
| Population growth Pop_growth | −0.03 | 0.16 | 0.01 | 0.01 | 0.01 |
| Inflation rate Inflation | −1.37 | 2.97 | 0.14 | −0.03 | 0.96 |
| Real GDP growth GDP_growth | −3.27 | 3.12 | 0.53 | 0.94 | 1.63 |
| Vacancy rate Vac_M | 0.00 | 12.10 | 1.06 | 0.62 | 1.22 |
| Spread Spread | 0.11 | 19.69 | 4.15 | 2.90 | 4.32 |
| Average contract duration Contract_dur | 0.04 | 25.76 | 5.00 | 3.73 | 4.11 |
Notes: Summary statistics of variables for the empirical analysis. Except for average contract duration (Contract_dur), which pertains exclusively to the commercial real estate segment, all displayed values encompass the full sample, representing income properties from 2007 to 2020. Definition of variables according to Table 1.
Appendix A.2
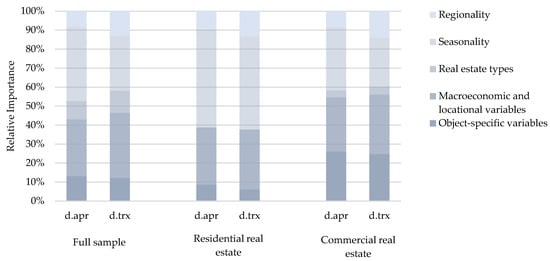
Figure A1.
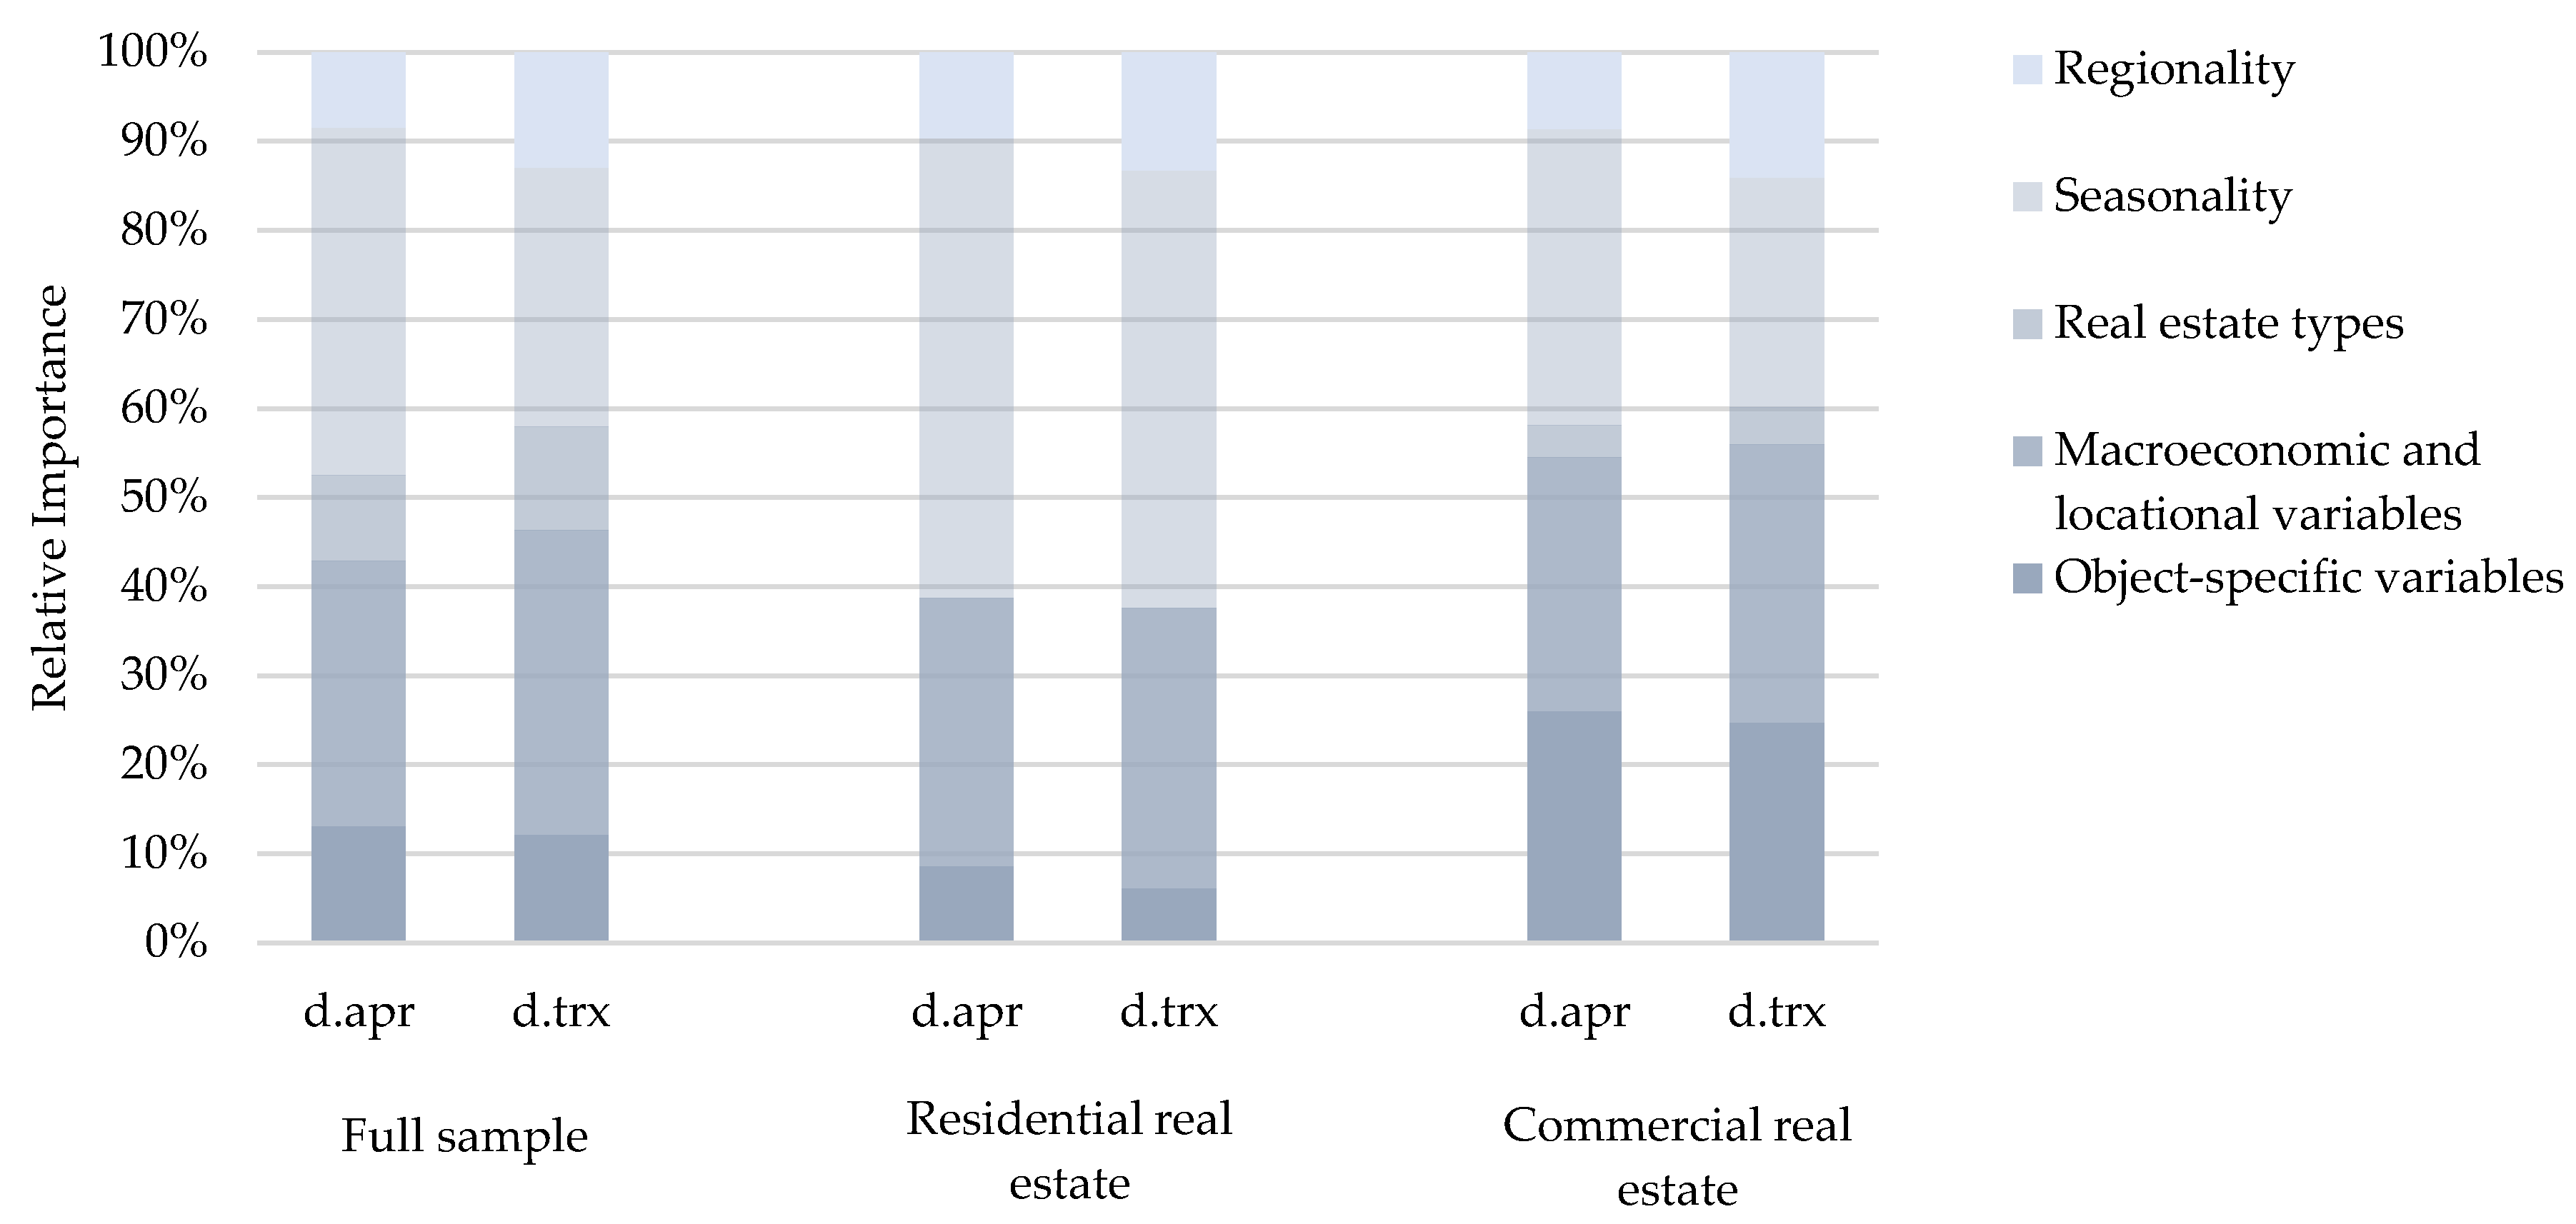
Relative Importance—Full set of Variables. Notes: average proportions of Relative Importance (RI) for appraisal-based (d.apr) and transaction-based discount rates (d.trx) across the RI measures last, first, betasq, genizi, and car, as elaborated in Section 4. The average RI is grouped into object-specific, macroeconomic, and locational variables, as well as control variables. The control variables include regionality (regional dummies), seasonality (time and quarter dummies), and real estate types (real estate type dummies). For models focused on residential real estate, real estate type dummies are not displayed, as the estimations in this segment only include residential real estate objects.
Figure A1.
Relative Importance—Full set of Variables. Notes: average proportions of Relative Importance (RI) for appraisal-based (d.apr) and transaction-based discount rates (d.trx) across the RI measures last, first, betasq, genizi, and car, as elaborated in Section 4. The average RI is grouped into object-specific, macroeconomic, and locational variables, as well as control variables. The control variables include regionality (regional dummies), seasonality (time and quarter dummies), and real estate types (real estate type dummies). For models focused on residential real estate, real estate type dummies are not displayed, as the estimations in this segment only include residential real estate objects.
References
- Cochrane, J.H.; Hansen, P.H. Asset Pricing Explorations for Macroeconomics. NBER Macroecon. Annu. 1992, 7, 115–165. [Google Scholar] [CrossRef]
- Fama, E. Efficient Capital Markets: A Review of Theory and Empirical Work. J. Financ. 1970, 25, 383–420. [Google Scholar] [CrossRef]
- Fisher, I. The Theory of Interest, as Determined by Impatience to Spend Income and Opportunity to Invest; The Macmillan Company: New York, NY, USA, 1930. [Google Scholar]
- Leskinen, N.; Vimpari, J.; Junnils, S. Using Real Estate Market Fundamentals to Determine the Correct Discount Rate for Decentralised Energy Investments. Sustain. Cities Soc. 2020, 53, 101953. [Google Scholar] [CrossRef]
- Assimakopoulos, V. Real Estate Appraisal: A Review of Valuation Methods. J. Prop. Invest. Financ. 2003, 21, 383–401. [Google Scholar]
- Adams, A.; Booth, P.M.; MacGregor, B.D. Property Investment Appraisal. Br. Actuar. J. 1999, 5, 955–982. [Google Scholar] [CrossRef]
- Gunnelin, A.; Hendershott, P.; Hoesli, M.; Söderberg, B. Determinants of Cross-Sectional Variation in Discount Rates, Growth Rates and Exit Cap Rates. Real Estate Econ. 2004, 32, 217–237. [Google Scholar] [CrossRef]
- Adams, A.F.; Jackson, J.D.; Cook, J.P. Capital Market Theory and Real Estate Valuation: A Case Study in Choosing an “Appropriate” Discount Rate. J. Forensic Econ. 2001, 14, 119–133. [Google Scholar] [CrossRef]
- Chaney, A.; Hoesli, M. Transaction-Based and Appraisal-Based Capitalization Rate Determinants; Swiss Finance Institute Research Paper Series No. 12–28; University of Aberdeen: Aberdeen, UK, 2012. [Google Scholar]
- Cho, Y.; Hwang, S.; Lee, Y. The Dynamics of Appraisal Smoothing. Real Estate Econ. 2013, 42, 497–529. [Google Scholar] [CrossRef]
- Cheng, P.; Lin, Z.; Liu, Y. Heterogeneous Information and Appraisal Smoothing. J. Real Estate Res. 2011, 33, 443–470. [Google Scholar] [CrossRef]
- Geltner, D.; MacGregor, B.D.; Schwann, G.M. Appraisal Smoothing and Price Discovery in Real Estate Markets. Urban Stud. 2003, 40, 1047–1064. [Google Scholar] [CrossRef]
- Federal Statistical Office (2007–2020): Pension Fund Statistics—Key Figure 2016 Figure 2017 Figure 2018 Figure 2019 Figure 2020/2007–2013. Available online: https://www.bfs.admin.ch/bfs/en/home/news/whats-new.gnpdetail.2022-0085.html (accessed on 30 June 2023).
- Federal Statistical Office (2022): Housing Conditions by Type of Resident and Type of Household. Available online: https://www.bfs.admin.ch/bfs/en/home/statistics/construction-housing/dwellings/housing-conditions/tenants-owners.html (accessed on 30 March 2024).
- Federal Statistical Office (2022b): Vacant Apartments and Development. Available online: https://www.bfs.admin.ch/bfs/de/home/statistiken/bau-wohnungswesen/wohnungen/leerwohnungen.assetdetail.27565789.html (accessed on 30 March 2024).
- Sivitanides, P.; Southard, J.; Torto, R.; Wheaton, W. The Determinants of Appraisal-Based Capitalization Rates. Real Estate Financ. 2001, 18, 27–38. [Google Scholar]
- Royal Institution of Chartered Surveyors. Discounted Cash Flow for Commercial Property Investments. RICS Guidance Note; Royal Institution of Chartered Surveyors: London, UK, 2010. [Google Scholar]
- Bienert, S.; Funk, M. Immobilienbewertung Osterreich; ÖVI Immobilienakademie: Wien, Austria, 2007. [Google Scholar]
- Haase, R. Immobilienbewertung: Eine kapitalmarktorientierte Ableitung des Basiszinssatzes. Swiss Real Estate J. 2014, 8, 4–12. [Google Scholar]
- PWC. Applying IFRS for the Real Estate Industry. 2023. Available online: https://www.pwc.ch/en/publications/2023/Applying%20IFRS%20for%20the%20real%20estate%20industry.pdf (accessed on 30 September 2023).
- PWC. IFRS and US GAAP: Similarities and Differences. 2016. Available online: https://www.pwc.ch/en/publications/2016/pwc-ifrs-us-gaap-similarities-and-differences-2016.pdf (accessed on 30 September 2023).
- Sharpe, W.F. Capital Asset Prices: A Theory of Market Equilibrium under Conditions of Risk. J. Financ. 1964, 19, 425–442. [Google Scholar]
- Jud, G.; Winkler, D. The Capitalization Rates of Commercial Properties and Market Returns. J. Real Estate Res. 1995, 10, 509–518. [Google Scholar] [CrossRef]
- Breidenbach, M.; Mueller, G.; Schulte, K. Determining Real Estate Betas for Markets and Property Types to set better Investment Hurdle Rates. J. Real Estate Portf. Manag. 2006, 12, 73–80. [Google Scholar] [CrossRef]
- Chuangdumrongsomsuk, M.; Fuerst, F. Determinants of Cap Rates in U.S. Office Markets. J. Real Estate Lit. 2017, 25, 267–282. [Google Scholar] [CrossRef]
- MacDonald, J.; Dermisi, S. Capitalization Rates, Discount Rates, Net Operating Income: The Case of Downtown Chicago Office Buildings. J. Real Estate Portf. Manag. 2008, 14, 363–374. [Google Scholar] [CrossRef]
- Sivitanidou, R.; Sivitanides, P. Office Capitalization Rates: Real Estate and Capital Market Influences. J. Real Estate Financ. Econ. 1999, 18, 297–322. [Google Scholar] [CrossRef]
- Chichernea, D.; Miller, N.; Fisher, J.; Sklarz, M.; White, B. A Cross-Sectional Analysis of Cap Rates by MSA. J. Real Estate Res. 2008, 30, 249–292. [Google Scholar] [CrossRef]
- Malpezzi, S. Housing Prices, Externalities, and Regulation in US Metropolitan Areas. J. Hous. Res. 1996, 7, 209–241. [Google Scholar]
- Maier, G.; Herath, S. Efficiency of the Real Estate Market: A Meta-Analysis. In Proceedings of the 17th Annual European Real Estate Society Conference in Milan, Milan, Italy, 23–26 June 2010. [Google Scholar]
- Chervachidze, S.; Wheaton, W. What Determined the Great Cap Rate Compression of 2000–2007, and the Dramatic Reversal During the 2008-2009 Financial Crisis? J. Real Estate Financ. Econ. 2010, 46, 208–231. [Google Scholar] [CrossRef]
- Larriva, M.; Linnemann, P. The Determinants of Capitalization Rates: Evidence from the US Real Estate Market. J. Prop. Investig. Financ. 2022, 40, 119–169. [Google Scholar] [CrossRef]
- Letdin, M.; Sirmans, G.S.; Smersh, G.; Zhou, T. The Role of Tenant Characteristics in Retail Cap Rate Variation. J. Real Estate Financ. Econ. 2023. [Google Scholar] [CrossRef]
- MacAllister, P.; Nanda, A. Do Foreign Buyers Compress Office Real Estate Cap Rates? J. Real Estate Res. 2016, 38, 569–594. [Google Scholar] [CrossRef]
- Susanti, Y.; Pratiwi, H.; Sulistijowati, H.S.; Liana, T. M-Estimation, S-Estimation, and MM-Estimation in Robust Regression. Int. J. Pure Appl. Math. 2014, 91, 349–360. [Google Scholar] [CrossRef]
- Fox, J.; Weisberg, S. Robust Regression in R, an Appendix to an R Companion to Applied Regression, 2nd ed.; McMaster University: Hamilton, ON, Canada, 2010. [Google Scholar]
- Huber, P.J. Robust Statistics; Wiley: Hoboken, NJ, USA, 1981. [Google Scholar]
- Basten, C.; Von Ehrlich, M.; Lassmann, A. Income Taxes, Sorting and the Costs of Housing: Evidence from Municipal Boundaries in Switzerland. Econ. J. 2017, 127, 653–687. [Google Scholar] [CrossRef]
- Braun, M.T.; Converse, P.D.; Oswald, F.L. The Accuracy of Dominance Analysis as a Metric to Assess Relative Importance: The Joint Impact of Sampling Error Variance and Measurement Unreliability. J. Appl. Psychol. 2019, 104, 593–602. [Google Scholar] [CrossRef]
- Darlington, R.B. Multiple Regression in Psychological Research and Practice. Psychol. Bull. 1968, 69, 161–182. [Google Scholar] [CrossRef] [PubMed]
- Grömping, U. Relative Importance for Linear Regression in R: The Package relaimpo. J. Stat. Softw. 2006, 17, 1–27. [Google Scholar] [CrossRef]
- Zuber, V.; Strimmer, K. High-dimensional Regression and Variable Selection using CAR Scores. Stat. Appl. Genet. Mol. Biol. 2011, 10. [Google Scholar] [CrossRef]
- Genizi, A. Decomposition of R2 in Multiple Regression with Correlated Regressors. Stat. Sin. 1993, 3, 407–420. [Google Scholar]
- Firth, D. Relative Importance of Explanatory Variables: An Annotated Bibliography. In Conference on Statistical Issues in the Social Sciences, Stockholm; Nuffield College: Oxford, UK, 1998; Available online: http://warwick.ac.uk/dfirth/papers/Stockholm1998.pdf (accessed on 30 July 2023).
Disclaimer/Publisher’s Note: The statements, opinions and data contained in all publications are solely those of the individual author(s) and contributor(s) and not of MDPI and/or the editor(s). MDPI and/or the editor(s) disclaim responsibility for any injury to people or property resulting from any ideas, methods, instructions or products referred to in the content. |
© 2024 by the author. Licensee MDPI, Basel, Switzerland. This article is an open access article distributed under the terms and conditions of the Creative Commons Attribution (CC BY) license (https://creativecommons.org/licenses/by/4.0/).