Article

Metamaterial Sensing of Cyanobacteria Using THz Thermal Curve Analysis

Department of Physics and Department of Energy Systems Research, Ajou University, Suwon 16499, Republic of Korea
*
Author to whom correspondence should be addressed.
These authors contributed equally to this work.
Biosensors 2024, 14(11), 519; https://doi.org/10.3390/bios14110519
Submission received: 27 August 2024 / Revised: 5 October 2024 / Accepted: 18 October 2024 / Published: 23 October 2024
(This article belongs to the Section Optical and Photonic Biosensors)

Abstract

:
In this study, we perform thermal curve analyses based on terahertz (THz) metamaterials for the label-free sensing of cyanobacteria. In the presence of bacterial films, significant frequency shifts occur at the metamaterial resonance, but these shifts become saturated at a certain thickness owing to the limited sensing volume of the metamaterial. The saturation value was used to determine the dielectric constants of various cyanobacteria, which are crucial for dielectric sensing. For label-free identification, we performed thermal curve analysis of THz metamaterials coated with cyanobacteria. The resonant frequency of the cyanobacteria-coated metasensor changed with temperature. The differential thermal curves (DTC) obtained from temperature-dependent resonance exhibited peaks unique to individual cyanobacteria, which helped identify individual species. Interestingly, despite being classified as Gram negative, cyanobacteria exhibit DTC profiles similar to those of Gram-positive bacteria, likely due to their unique extracellular structures. DTC analysis can reveal unique characteristics of various cyanobacteria that are not easily accessible by conventional approaches.

1. Introduction

As a consequence of global warming and eutrophication, cyanobacterial blooms have become a major environmental problem associated with freshwater systems [1,2,3,4,5], causing cyanobacteria to grow more rapidly and aquatic ecosystems to collapse because of a reduction in dissolved oxygen levels [6,7,8,9]. To mitigate the adverse effects of the accelerated growth rate of cyanobacteria in aquatic ecosystems, it is essential to establish methods to identify and classify different species of cyanobacteria. Microscopic techniques and polymerase chain reactions (PCR) have been widely used to identify cyanobacteria [10,11,12,13,14,15]. However, microscopic techniques are limited to identifying bacteria based on shape and color, and it may be difficult to distinguish cyanobacteria of the same shape and color [16]. Comparatively, PCR techniques are accurate but time-consuming and require specific DNA primers [17,18,19,20]. Therefore, it is imperative to develop an accurate tool to identify cyanobacterial species.
Terahertz (THz) metamaterials have recently been introduced as effective platforms for real-time sensitive microorganism detection [21,22,23,24,25,26,27,28]. Since metamaterial sensing involves dielectric sensing, determining the optical index of the target substances is the first step in practical sensor applications [29,30,31,32]. As microorganisms can now be classified based on their dielectric properties, bacteria have been found to exhibit higher dielectric constants than molds, whereas yeasts exhibit higher values than water [33]. The differences in the dielectric properties can be attributed to differences in the cell wall composition. Furthermore, we developed a label-free THz spectroscopic method for identifying individual bacterial species based on temperature-dependent peak shifts of metamaterials [34]. The differential thermal curves (DTC) of the metamaterial resonance were obtained by monitoring the temperature-dependent frequency shift, which provides unique fingerprints of individual microbes. Therefore, a novel THz-sensing technique for identifying microbial species based on their intrinsic properties will help prevent cyanobacterial blooms.
In this study, we used a metamaterial sensor to determine the dielectric constant of cyanobacteria by measuring the shift in the metamaterial resonance of four types of cyanobacteria. In addition, we monitored the THz transmission spectra when the metasensors coated with cyanobacteria were heated. This allowed us to address temperature-dependent changes in the cyanobacterial dielectric constant, which provides unique fingerprints for the label-free identification of cyanobacteria.

2. Experimental Setup

We determined the dielectric constants of the cyanobacterial layers using metasensors and performed THz thermal curve analysis for label-free identification. As schematically illustrated in Figure 1a, we coated the cyanobacterial films on a metamaterial pattern and recorded the metamaterial resonance (fR) shift as a function of the sample temperature from 25 to 160 °C. In general, a bacterial cell experiences multiple phases as its temperature rises, such as growth, thermal inactivation, DNA denaturation, and wall destruction [35,36,37]. Accordingly, significant changes in the THz dielectric constant should occur at the transition temperature between the multiple growth and death phases in cyanobacteria. Individual microbial species have different temperature-dependent characteristics; therefore, we can identify metamaterial resonances by measuring them at different temperatures without pretreatments such as labeling and DNA extraction.
Cyanobacterial samples from the Korean Collection for Type Cultures (Anabaena sp. AG10059, Aphanocapsa sp. AG10016, and Aphanothece sp. AG10010) and Freshwater Bioresources Culture Collection (Microcystis sp. FBCC-A68) were grown in 1 L of DI water mixed with 1.64 g of blue-green medium (BGII). To promote cyanobacteria growth, the temperature was maintained at 20 °C (Microcystis sp.), 25 °C (Anabaena sp. and Aphanothece sp.), and 30 °C (Aphanocapsa sp.) using a hot plate. They were grown for more than two weeks under 5000 lx of light illumination for 9–12 h each day, whereas it took almost a month to grow some species (e.g., Microcystis sp. and Aphanocapsa sp.). Using a conventional photolithography technique, we fabricated THz metamaterials on silicon substrates (0.5 mm thick), followed by metal evaporation of Cr/Au (10 nm/90 nm). It consisted of a 40 × 40 array of split-ring electrical resonators with a side arm length of 36 μm, line width of 4 μm, gap width of 3 μm, and periodicity of 50 μm.
A conventional THz time-domain spectroscopy (THz-TDS) system was used to measure the transmission amplitudes of the THz metamaterial devices [21,22,23,24,25]. The linearly polarized THz pulse was generated by illuminating a photoconductive antenna (GaAs) with a femtosecond laser (centered at λ = 800 nm). By varying the time delay between the THz pulse and femtosecond probe beam, time traces of the transmitted THz electric field were obtained, and the THz spectrum could then be derived from these time traces using a fast Fourier transform. The in situ THz absorption of the metamaterials coated with cyanobacteria was monitored using ceramic heaters to adjust the sample temperature. The THz pulses were focused on a metamaterial with a focusing area of 1 mm2. The ceramic heater was punctured at its center with a diameter of 2 mm to facilitate the transmission experiments. The temperature of the sample was monitored by using a temperature sensor attached to the ceramic heater (and confirmed by a pyrometer) and we recorded the transmission spectrum as a function of the measured temperature. We increased the temperature gradually (from 25 to 160 °C for 40 min); the temperature was uniform over the sample surface.
We measured the dielectric constants of the cyanobacterial layers using the saturation thickness response of metamaterial resonance [38]. Information on the dielectric constant (εr) of the target materials is crucial in dielectric sensing; however, these information have not been addressed for cyanobacteria in the THz frequency range. Metamaterial sensing has been proven to be an effective technique for obtaining the dielectric constants of polymer films and liquids. These methods are free from interference effects and do not require large sample quantities because the metamaterial sensing volume is quite confined near the gap structure. We measured the THz transmission amplitude of the metamaterial before and after deposition of the cyanobacterial layers, as shown in Figure 2. THz transmission spectra are shown with (red) and without (black) coating of the cyanobacterial film consisting of Anabaena sp. with a thickness of 4 μm. The cyanobacterial layer was deposited using the drop-casting method after rinsing the cyanobacterial solution by centrifugation at 12,000 rpm for 30 min (repeated three times). This process effectively removed the culture medium from the solution. We used metamaterials with a resonant frequency of 0.87 THz without coating of the cyanobacteria. Conversely, the resonance shift was measured at ~50 GHz when we coated Anabaena sp., as shown in Figure 2.
Several geometrical factors affect the resonant frequency (LC resonance frequency) of THz metamaterials, including the gap width, sidearm length, and refractive index of the substrate (nsub) [23,39,40]. A critical aspect of LC resonance is that it is influenced by the dielectric environment of the metamaterial; in other words, the resonant frequency of the metamaterial is inversely related to the effective refractive index neff. Here, neff is a linear combination of the refractive indices of the substrate and air refractive indices [41]. In metamaterial sensing, additional dielectric materials (such as cyanobacteria) change the effective dielectric constant in the gap areas of the metamaterial, causing a redshift in the THz transmission spectrum. As a result, the resonance shift (Δf) can be expressed by the following relationship: Δf/f0α(εrεair)/εeff [42], where α is the sensitivity coefficient, εair is the dielectric constant of air, and εeff (=neff2) is the effective dielectric constant without the dielectric film coating.
Figure 3a shows a plot of Δf as a function of deposition time (Ncy) of cyanobacteria films for Anabaena sp. We measured the changes in the THz spectrum transmitted through microgap metamaterials after the deposition of four different cyanobacteria prevalent in Korean rivers. The cyanobacteria were drop-cast from the solution at a density of 18 mg/mL. In each deposition, we used 5 μL solution to fill the area by using a polydimethylsiloxane (PDMS) well with a 2 mm diameter, followed by a drying process under ambient conditions. As we increased Ncy (i.e., with increasing layer thickness), Δf increased due to the change in the effective dielectric constant of the gap area. For dielectric constant measurements, we removed the culture medium completely, because it distorts dielectric values significantly. For that purpose, the cyanobacterial layer was deposited using the drop-casting method after rinsing the cyanobacterial solution by centrifugation at 12,000 rpm for 30 min (repeated three times). Δf was saturated at a specific thickness with a deposition time of Nsat because the effective sensing volume of the THz-metamaterial sensor is highly confined near the surface. We extracted the saturation value Δfsat using the following fittings: Δ f = Δ f sat ( 1 exp ( N film / N sat ) ) [22,23,39]. Δfsat of 54.9 GHz (black dashed line) was obtained, as shown in Figure 3a. We also performed similar experiments on other cyanobacterial species, as shown in Figure 3b–d, respectively, for Aphanocapsa sp., Aphanothece sp., and Microcystis sp. We used the same experimental conditions as for the Anabaena sp. case, including the solution density; however, the thicknesses varied depending on their individual sizes. The saturated frequency shifts were measured to be 31.3 GHz (Aphanocapsa sp.), 58.4 GHz (Aphanothece sp.), and 41.6 GHz (Microcystis sp.).
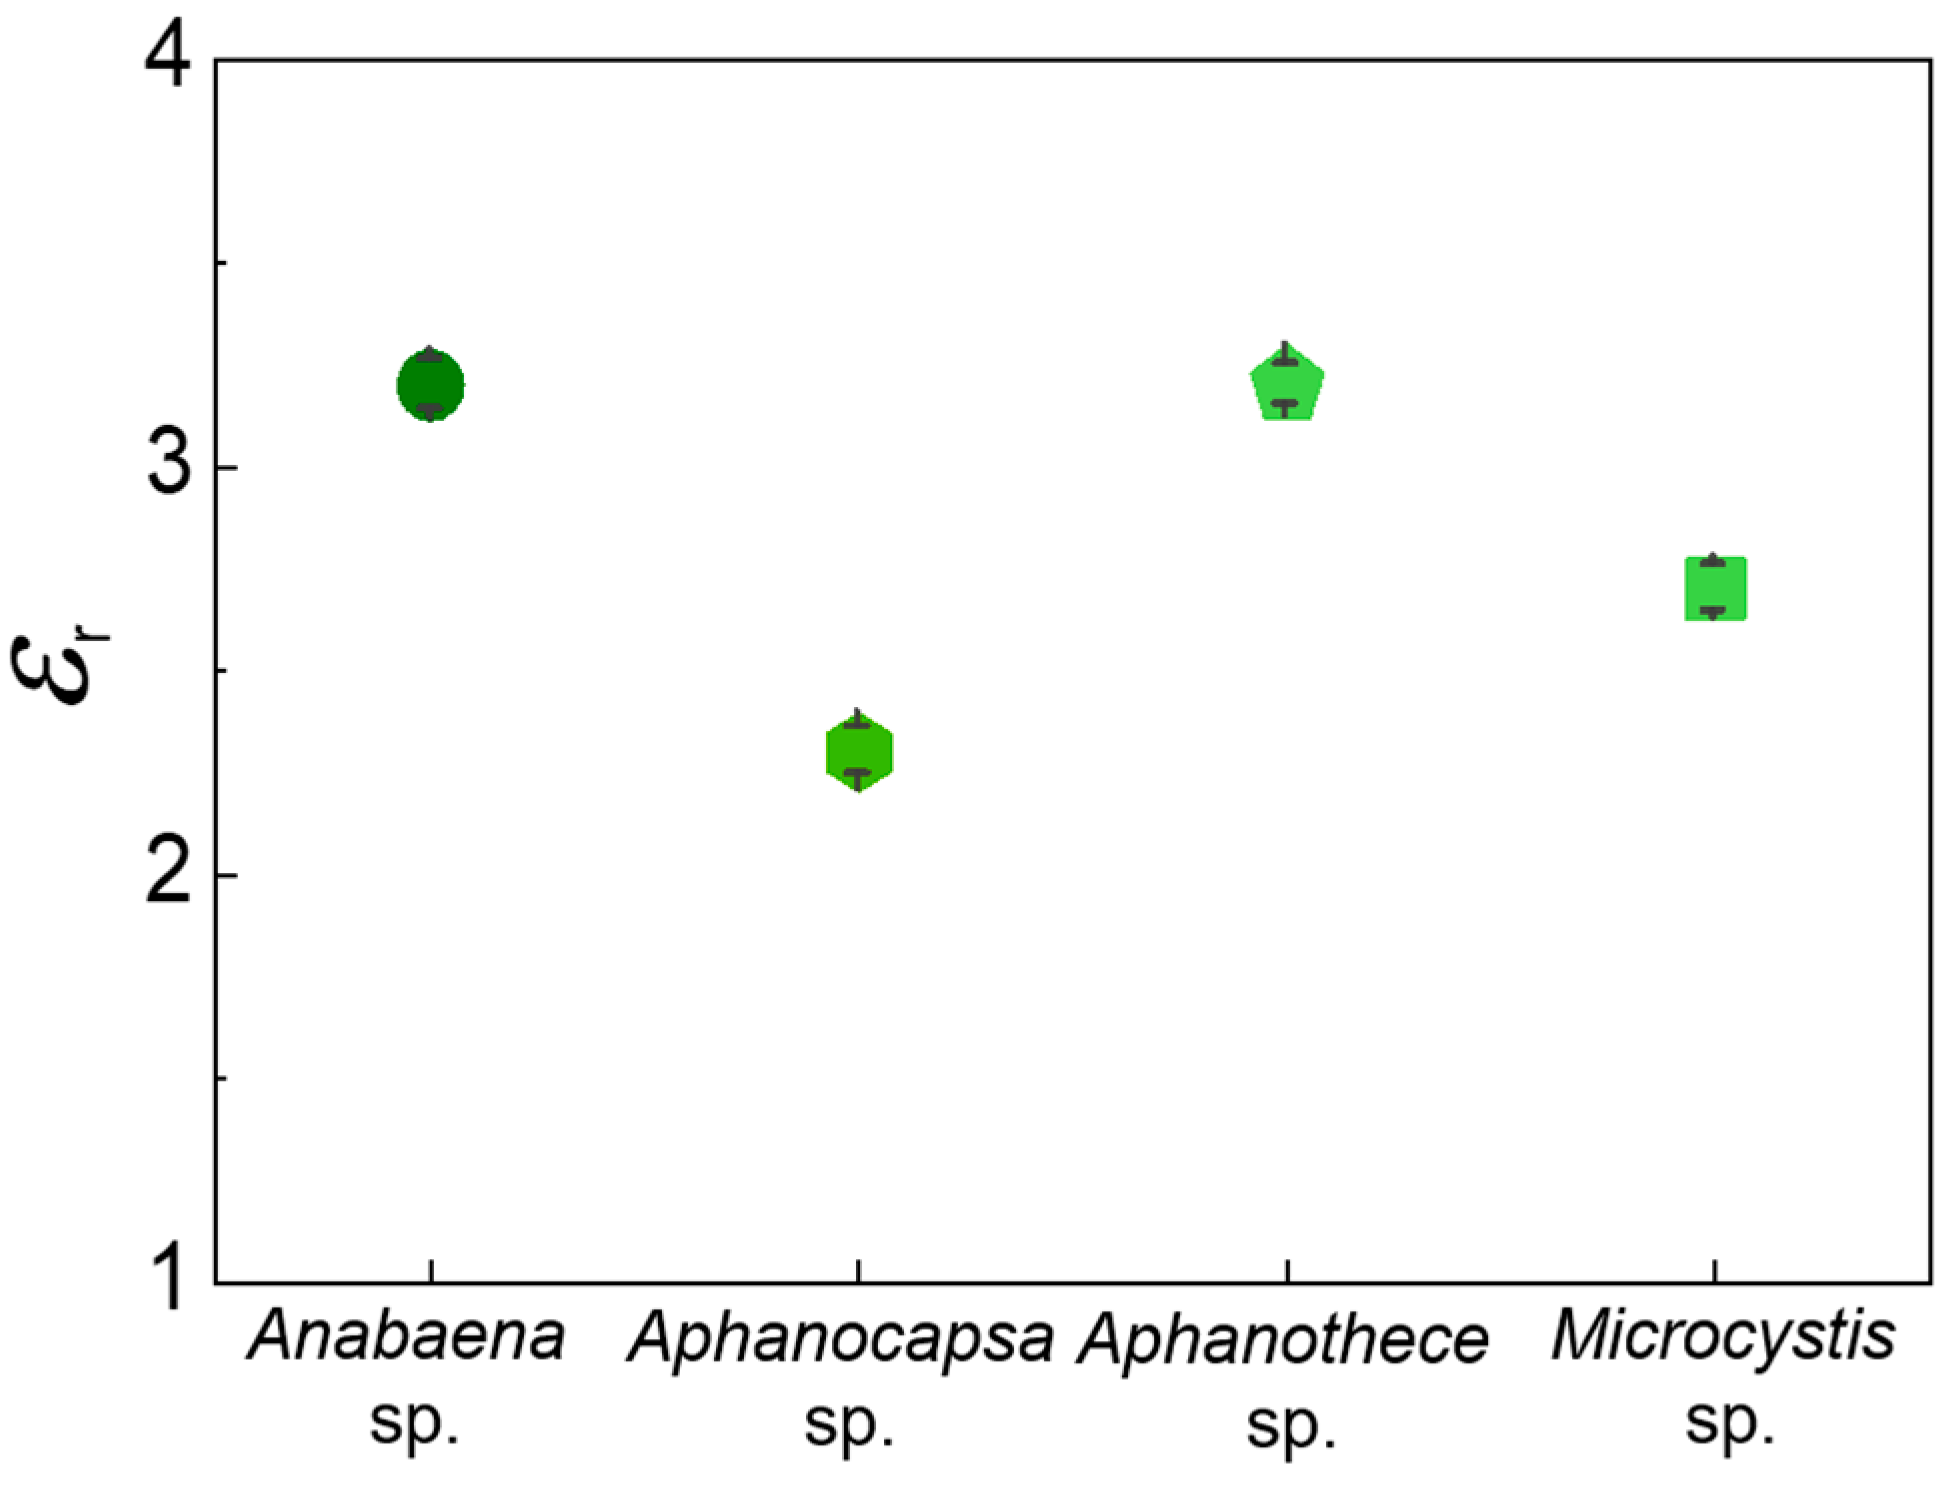
We determined the dielectric constant of cyanobacteria films, as shown in Figure 4, because it has a close correlation to Δfsat/f0 values. In our previous studies [21], we found an explicit correlation between the two quantities when the film was sufficiently larger than the saturated thickness. THz metamaterial sensors can be used to measure the dielectric constant of target materials without determining the precise thickness. Based on the relationship between εr and Δfsat/f0 for metamaterial devices used in this study: εr = 33.4·(Δf/f0) + 0.99 [38], the dielectric constants of cyanobacteria films were found from Δfsat/f0 to be 3.2 (Anabaena sp.), 2.3 (Aphanocapsa sp.), 3.2 (Aphanothece sp.), and 2.7 (Microcystis sp.). The results are summarized in Figure 4, addressing the dielectric information of cyanobacteria in the THz frequency range. Our results are consistent with the dielectric indexes of other bacterial films (2.0–2.7) reported previously [33], whereas the values for Anabaena sp. and Aphanothece sp. are relatively higher. Dielectric information is the first step in metamaterial sensing applications. If the target amount is given, careful measurement of the metamaterial resonant frequency shift would be useful in identifying individual cyanobacteria. In particular, it is useful for early identification of pathogen types because they can be classified in terms of their dielectric values [33]. Conversely, thermal curve analysis will provide a unique approach to label-free identification without knowing the amount of the target materials [34].
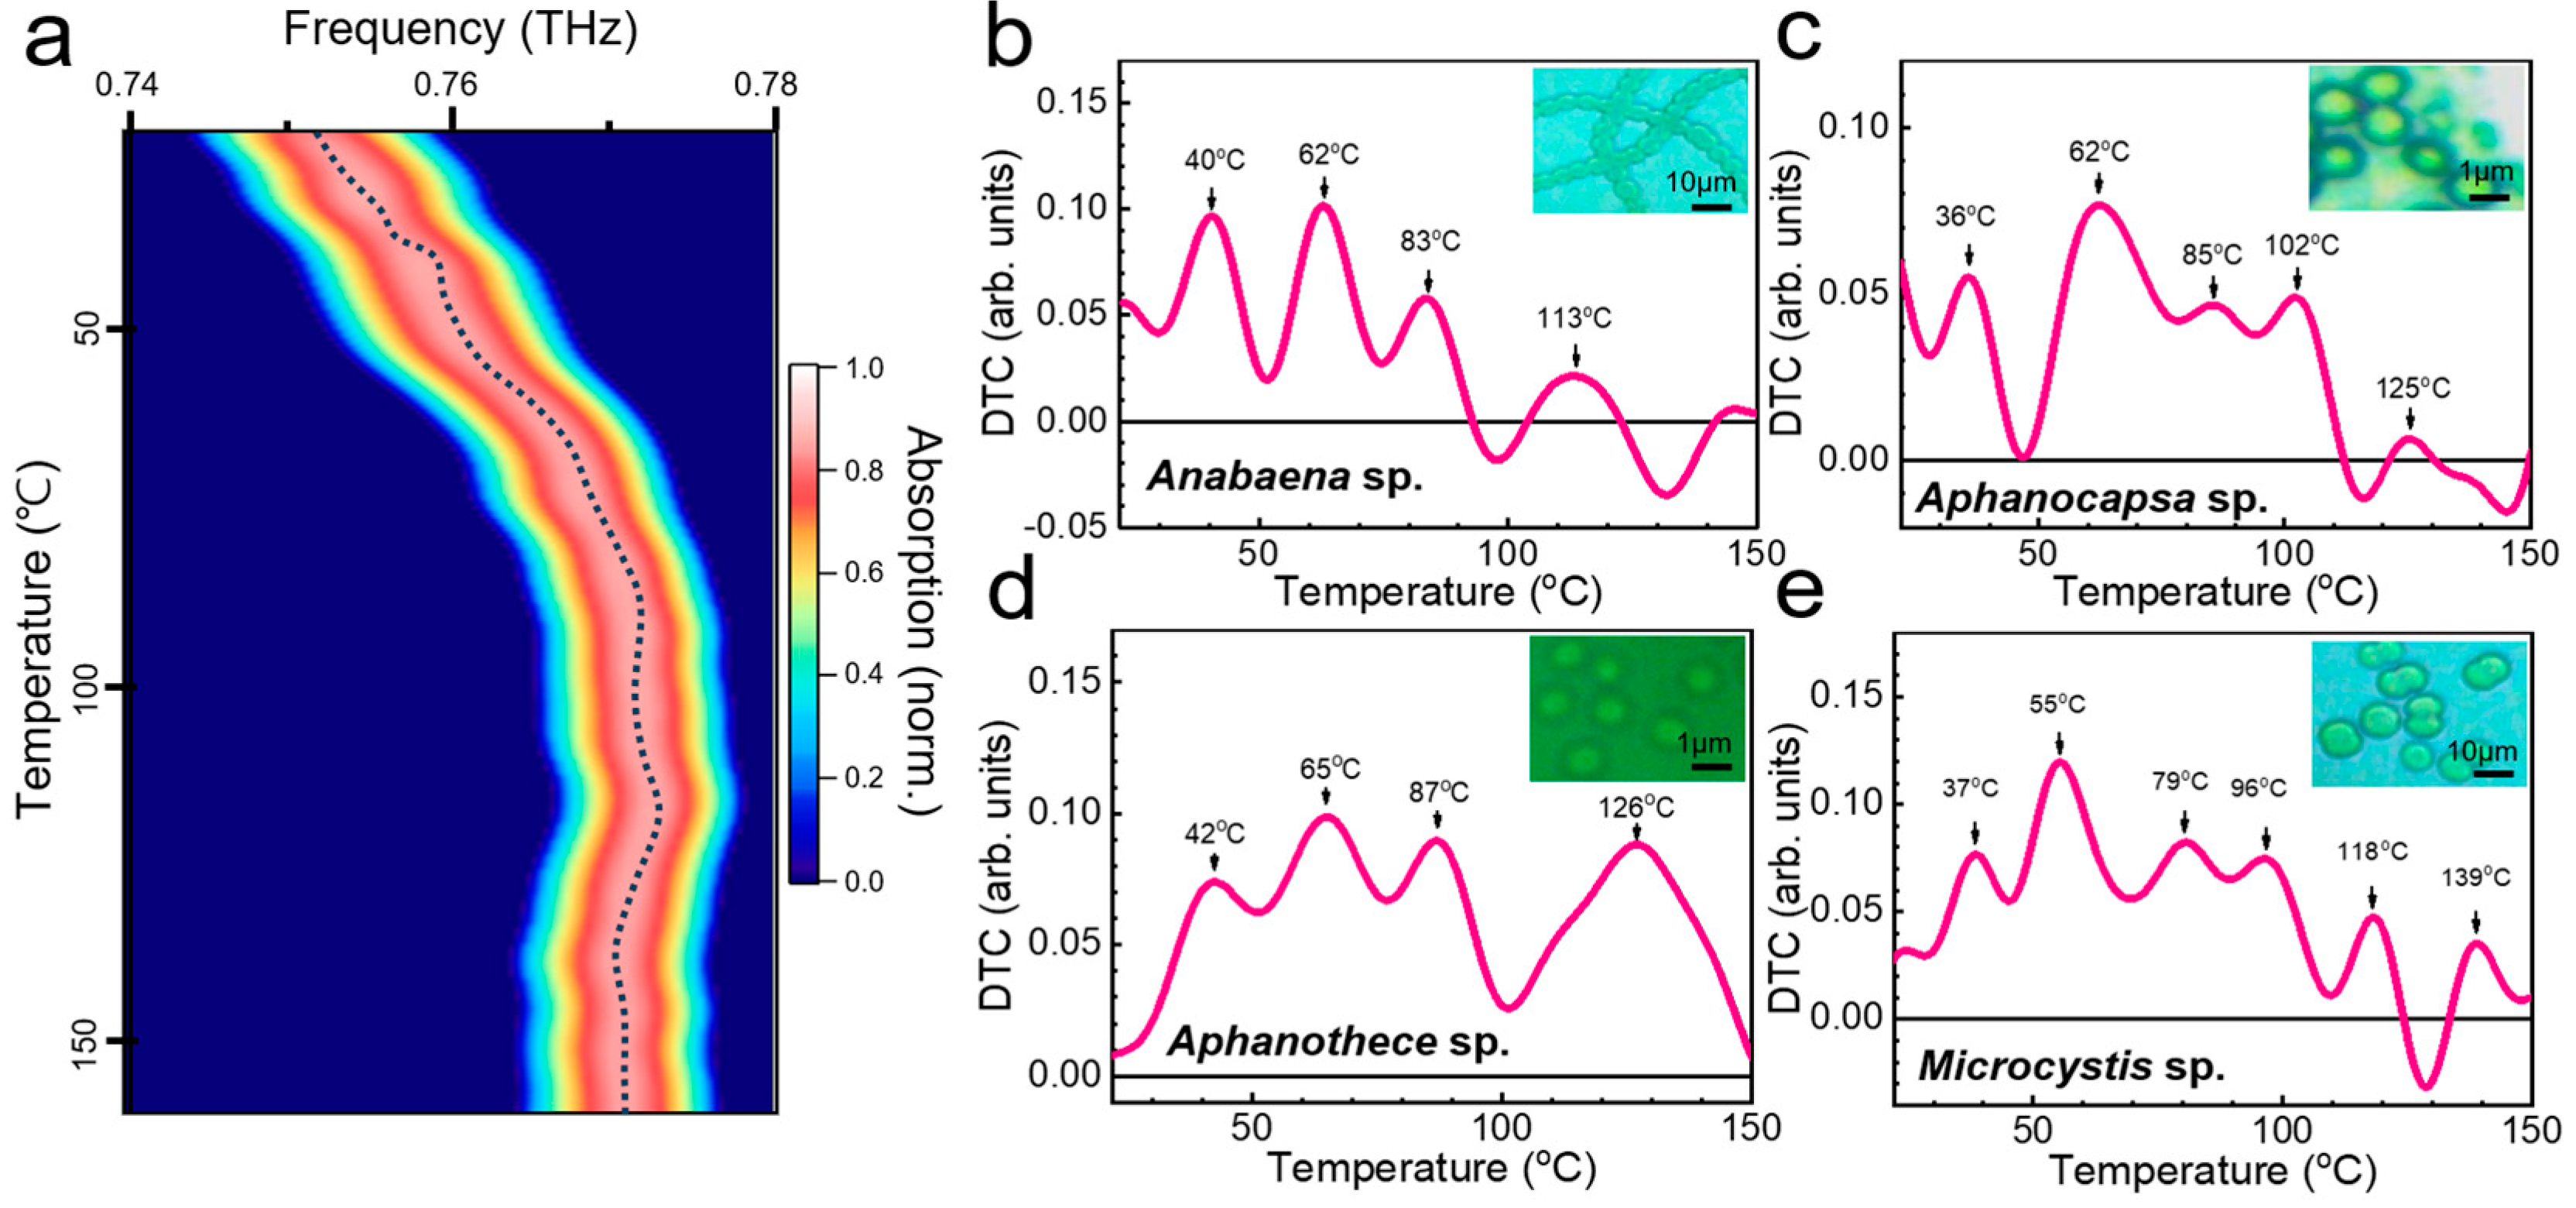
We obtained differential thermal curves, revealing multiple peaks at the transition temperature, which enabled us to identify cyanobacteria [34]. Figure 5 shows a representative result of DTC analysis based on in-situ THz spectroscopy, in which the temperature of the metasensors coated with cyanobacterial layers was increased. Figure 5a illustrates a two-dimensional (2D) plot of THz absorption versus temperature when the metasensor is covered with a 12 μm-thick Anabaena sp. layer. The sample temperature was gradually increased from 25 to 160 °C for 40 min. The initial peak frequency was 0.75 THz at room temperature, which corresponds to the resonant frequency of the metasensor when covered by Anabaena sp. layer. In contrast, fR increased as the dielectric constant of the coated film decreased with increasing temperature. We note that the film contained the culture media (BGII) used for growth. However, the presence of the culture medium did not significantly influence the DTC curves. When they are covered by culture media without cyanobacteria, the metamaterial resonance does not change with the temperature of our interest.
As the temperature increased, fR exhibited a blue shift until the temperature reached 100 °C, indicating that the dielectric constant of the cyanobacterial layer decreased as the temperature increased. In addition, the metamaterial resonance did not change significantly without microbial films beyond the temperature range of interest. By fitting the curve in Figure 5a, we plotted fR as a function of temperature T, as illustrated by a dotted line. Finally, the change in the resonant frequency at the transition stages was better illustrated using the differential thermal curve based on dfR/dT (Figure 5b). Peaks were observed at 40, 62, 83, and 113 °C. As the temperature increased, the dielectric constant decreased (which causes the metasensor resonance to shift blue). This can be attributed to cell expansion and molecular structural changes that occur during cell growth and death. For instance, it is well known that at growth temperatures, microbes undergo proteolysis, during which they break down proteins into their component amino acids [37,43,44,45,46]. In contrast, thermal inactivation occurs primarily because of protein denaturation, and a decrease in the DC dielectric constant has been previously reported at high temperatures [47]. The denaturation of DNA reduces its dielectric index [48]; however, the detailed characteristics of DNA in the THz range remain to be determined. DTC curves for other cyanobacteria are shown for Aphanocapsa sp. (Figure 5c), Aphanothece sp. (Figure 5d), and Microcystis sp. (Figure 5e) layers, which shows different characteristics relative to Anabaena sp. layer. The unique temperature-dependent changes in the dielectric indices of microorganisms allow THz thermal curves to provide unique fingerprints for the identification of cyanobacteria.
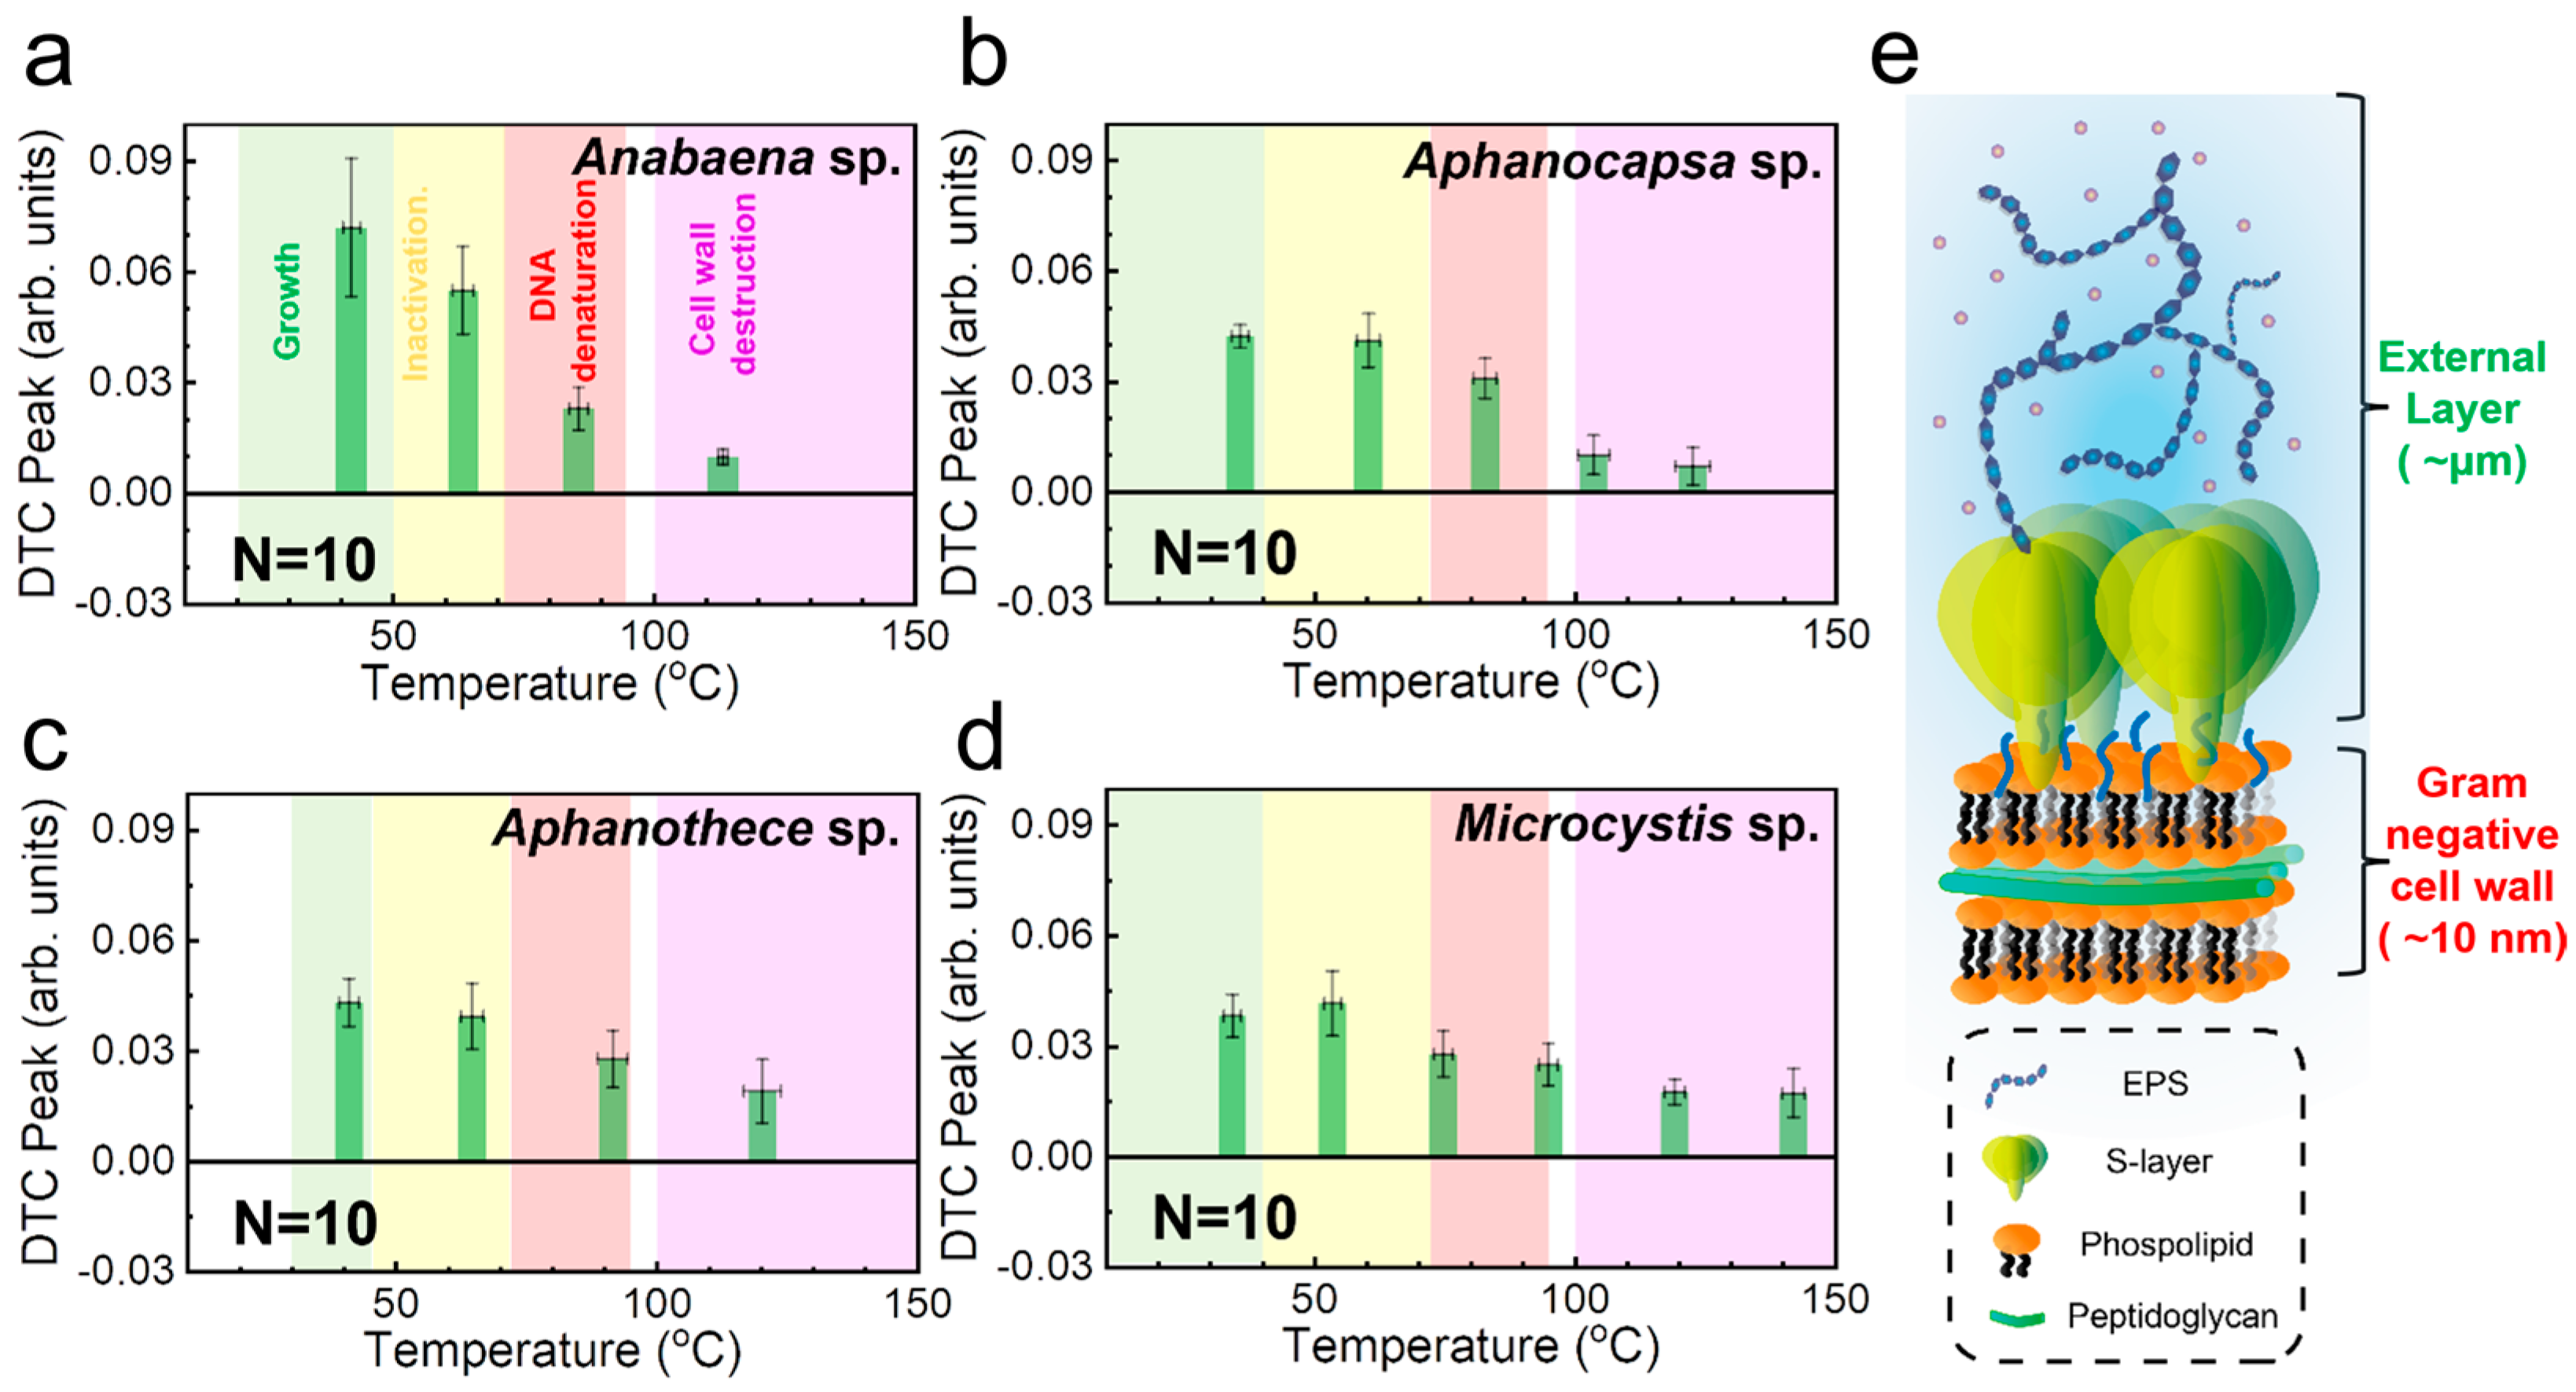
Figure 6 summarizes the DTC analysis results for the four cyanobacterial species in terms of peak amplitude vs. temperature. For each species, we averaged the results of ten separate DTC measurements. All the samples exhibited multiple peaks that could serve as potential fingerprints for identification. The error bars represent the standard deviation of 10 samples each. The DTC peak positions are consistent with those reported in the literature, as indicated by the numbers in parentheses in Table 1. Specifically, these peaks fall within the temperature ranges for growth (shaded green in Figure 6), thermal inactivation (yellow), DNA denaturation (red), and cell-wall destruction (purple), thus validating our model. These measurements were performed using various biological techniques including optical density measurements, flask methods, PCR, and differential scanning calorimetry. However, conventional methods usually require a substantial number of samples or are time-consuming. Furthermore, although the dielectric constants of the bacteria are similar, we could distinguish them according to their species using the melting curve analysis obtained from the temperature-dependent dielectric constants. Interestingly, multiple peaks are found within death phases for some cyanobacteria species. For instance, double peaks were observed for DNA denaturation peaks for Microcystis sp. in Figure 6d; this is consistent with previous literature reporting two types of genes with different melting points [49,50]. Furthermore, the multiple peaks found in the cell wall detection phases in Figure 6b,d are also consistent with multiple polysaccharide components present in Aphanocapsa sp. and Microcystis sp. [51,52,53]. It is noteworthy that the peak positions in the melting curves can differ from our data depending on the growth conditions in the culture medium. Future research is required to address DTC curves based on growth conditions and layer thicknesses [37].
Notably, the DTC peaks of cyanobacteria revealed cell wall destruction (shaded purple in Figure 6), although cyanobacteria are classified as Gram negative [54]. Previous research has demonstrated that DTC analysis can classify bacteria by Gram type based on these cell wall destruction peaks, which are generally missing in Gram-negative bacteria [34]. The presence of cell wall destruction peaks for cyanobacteria can be attributed to the presence of external layers on the outer surface of cyanobacteria (as illustrated in Figure 6e), which consist of extracellular polymeric substances (EPS) and mucilaginous sheaths [55]. In addition, some of cyanobacteria (for Aphanocapsa, Aphanothece, and Microcystis species) contain S-layers that are not found in other bacteria [56,57]. The thickness of these additional structures could reach a couple of micrometers [58], much thicker than the cyanobacterial cell wall itself. In particular, the EPS contains a substantial amount of peptidoglycan, which is the basic component of bacterial cell walls. This abundance of peptidoglycan within the EPS significantly affects the optical dielectric constant observed in the DTC profiles. Consequently, their dielectric properties resemble Gram-positive bacteria. It is also known that the EPS dissolve at temperatures greater than 100 °C [55,59], which is consistent with our DTC results. The unique features of cyanobacteria are challenging to examine using conventional imaging systems [60]. Conversely, they are effectively captured through DTC analysis despite their classification as Gram-negative bacteria; therefore, DTC analysis is very useful for revealing and highlighting the structural characteristics of various microbial systems.
Table 1. Phase transition temperatures from DTC results for different cyanobacterial species.
MicroorganismGrowthInactivationDNA
Denaturation
Cell Wall
Destruction
Refs.
Anabaena sp.42 °C (20–50 °C)64 °C
(>50 °C)
86 °C
(72–94 °C)
114 °C
(>100 °C)
[61,62,63,64,65,66,67]
Aphanocapsa sp.36 °C
(15–40 °C)
60 °C
(>40 °C)
83 °C
(72–94 °C)
104, 123 °C
(>100 °C)
[61,62,66,67,68,69]
Aphanothece sp.41 °C
(30–45 °C)
65 °C
(>45 °C)
92 °C
(72–94 °C)
121 °C
(>100 °C)
[61,62,66,67,70]
Microcystis sp.34 °C
(10–40 °C)
54 °C
(>40 °C)
75, 95 °C
(72–94 °C)
119, 142 °C
(>100 °C)
[61,62,66,67,71,72,73]

3. Conclusions

In this study, we demonstrated label-free cyanobacterial sensing using THz-metamaterials. Upon depositing cyanobacterial layers on a metamaterial, the resonant frequency shifts but then saturates at a certain thickness owing to the limited sensing volume of the metamaterial. Based on the saturation values, we determined the dielectric constants of the four cyanobacteria commonly found in rivers. The dielectric index of the film ranges from 2.3 to 3.2, which is consistent with the bacterial values. For potential label-free identification, we performed thermal curve analysis using THz metamaterials on cyanobacteria. The resonant frequency of the metasensor coated with the cyanobacterial layers changed with temperature in accordance with their respective transition temperatures for growth, thermal inactivation, DNA denaturation, and cell wall destruction. DTC derived from the temperature-dependent resonance showed peaks unique to different cyanobacterial species, thereby enabling species identification. Interestingly, despite being classified as Gram-negative bacteria, cyanobacteria exhibit DTC peaks for cell wall destruction; these peaks are similar to those of Gram-positive bacteria and result from extracellular structures. These characteristics, as revealed by DTC analysis, underscore the complex and robust nature of cyanobacterial cell walls. Our results can be further extended to the study of other cyanobacterial species, showing potential for the development of highly sensitive onsite identification methods for various hazardous substances in rivers.

Author Contributions

Conceptualization, Y.H.A.; Data curation, T.H.J.; Formal analysis, T.H.J., S.W.J. and Y.H.A.; Investigation, T.H.J., S.W.J. and Y.H.A.; Methodology, T.H.J., S.W.J. and Y.H.A.; Writing—original draft, T.H.J., S.W.J. and Y.H.A.; Writing—review and editing, T.H.J., S.W.J. and Y.H.A. All authors have read and agreed to the published version of the manuscript.

Funding

This work was supported by the Midcareer Researcher Program (RS-2024-00335942) and Basic Science Research Program (2021R1A6A1A10044950) through a National Research Foundation grant funded by the Korea Government.

Institutional Review Board Statement

Not applicable.

Informed Consent Statement

Not applicable.

Data Availability Statement

The original contributions presented in the study are included in the article, further inquiries can be directed to the corresponding author.

Conflicts of Interest

The authors declare no conflicts of interest.

References

  1. Qian, K.; Chen, Y.; Song, X. Long-term development of phytoplankton dominant species related to eutrophicarion in Lake Taihu. Ecol. Sci. 2008, 27, 65–70. [Google Scholar]
  2. Padisak, J. Cylindrospermopsis raciborskii (Woloszynska) Seenayya et Subba Raju, an expanding, highly adaptive cyanobacterium: Worldwide distribution and review of its ecology. Arch. Hydrobiol. Suppl. 1997, 107, 563–593. [Google Scholar]
  3. Paerl, H.W.; Huisman, J. Blooms like it hot. Science 2008, 320, 57–58. [Google Scholar] [CrossRef] [PubMed]
  4. O’Neil, J.M.; Davis, T.W.; Burford, M.A.; Gobler, C.J. The rise of harmful cyanobacteria blooms: The potential roles of eutrophication and climate change. Harmful Algae 2012, 14, 313–334. [Google Scholar] [CrossRef]
  5. Visser, P.M.; Verspagen, J.M.; Sandrini, G.; Stal, L.J.; Matthijs, H.C.; Davis, T.W.; Paerl, H.W.; Huisman, J. How rising CO2 and global warming may stimulate harmful cyanobacterial blooms. Harmful Algae 2016, 54, 145–159. [Google Scholar] [CrossRef]
  6. Mudaliar, A.; Pandya, U. Assessment of Cyanobacterial Chlorophyll A as an Indicator of Water Quality in Two Wetlands Using Multi-Temporal Sentinel-2 Images. Environ. Sci. Proc. 2023, 25, 68. [Google Scholar] [CrossRef]
  7. Tiwari, P.; Misra, A.; Venturino, E. The role of algae in agriculture: A mathematical study. J. Biol. Phys. 2017, 43, 297–314. [Google Scholar] [CrossRef]
  8. Zhang, W.; Liu, J.; Xiao, Y.; Zhang, Y.; Yu, Y.; Zheng, Z.; Liu, Y.; Li, Q. The impact of cyanobacteria blooms on the aquatic environment and human health. Toxins 2022, 14, 658. [Google Scholar] [CrossRef]
  9. Kunlasak, K.; Chitmanat, C.; Whangchai, N.; Promya, J.; Lebel, L. Relationships of dissolved oxygen with chlorophyll-a and phytoplankton composition in tilapia ponds. J. Geosci. 2013, 4, 46. [Google Scholar] [CrossRef]
  10. Lu, W.; Evans, E.H.; McColl, S.M.; Saunders, V.A. Identification of cyanobacteria by polymorphisms of PCR-amplified ribosomal DNA spacer region. FEMS Microbiol. Lett. 1997, 153, 141–149. [Google Scholar] [CrossRef]
  11. Rasmussen, U.; Svenning, M.M. Fingerprinting of cyanobacteria based on PCR with primers derived from short and long tandemly repeated repetitive sequences. Appl. Environ. Microbiol. 1998, 64, 265–272. [Google Scholar] [CrossRef] [PubMed]
  12. Nübel, U.; Garcia-Pichel, F.; Muyzer, G. PCR primers to amplify 16S rRNA genes from cyanobacteria. Appl. Environ. Microbiol. 1997, 63, 3327–3332. [Google Scholar] [CrossRef] [PubMed]
  13. Ouellette, A.J.; Handy, S.M.; Wilhelm, S.W. Toxic Microcystis is widespread in Lake Erie: PCR detection of toxin genes and molecular characterization of associated cyanobacterial communities. Microb. Ecol. 2006, 51, 154–165. [Google Scholar] [CrossRef]
  14. Mariné, M.H.; Clavero, E.; Roldán, M. Microscopy methods applied to research on cyanobacteria. Limnetica 2004, 23, 179–186. [Google Scholar] [CrossRef]
  15. MacKeigan, P.W.; Garner, R.E.; Monchamp, M.-E.; Walsh, D.A.; Onana, V.E.; Kraemer, S.A.; Pick, F.R.; Beisner, B.E.; Agbeti, M.D.; da Costa, N.B. Comparing microscopy and DNA metabarcoding techniques for identifying cyanobacteria assemblages across hundreds of lakes. Harmful Algae 2022, 113, 102187. [Google Scholar] [CrossRef]
  16. Vuorio, K.; Mäki, A.; Salmi, P.; Aalto, S.L.; Tiirola, M. Consistency of targeted metatranscriptomics and morphological characterization of phytoplankton communities. Front. Microbiol. 2020, 11, 96. [Google Scholar] [CrossRef]
  17. Bauer, D.; Muüller, H.; Reich, J.; Riedel, H.; Ahrenkiel, V.; Warthoe, P.; Strauss, M. Identification of differentially expressed mRNA species by an improved disply technique (DDRT-PCR). Nucleic Acids Res. 1993, 21, 4272–4280. [Google Scholar] [CrossRef]
  18. Arya, M.; Shergill, I.S.; Williamson, M.; Gommersall, L.; Arya, N.; Patel, H.R. Basic principles of real-time quantitative PCR. Expert Rev. Mol. Diagn. 2005, 5, 209–219. [Google Scholar] [CrossRef]
  19. Kuno, G. Universal diagnostic RT-PCR protocol for arboviruses. J. Virol. Methods 1998, 72, 27–41. [Google Scholar] [CrossRef]
  20. Cheng, W.-C.; Horn, T.; Zayats, M.; Rizk, G.; Major, S.; Zhu, H.; Russell, J.; Xu, Z.; Rothman, R.E.; Celedon, A. Ultra-sensitive and rapid detection of nucleic acids and microorganisms in body fluids using single-molecule tethering. Nat. Commun. 2020, 11, 4774. [Google Scholar] [CrossRef]
  21. Park, S.; Cha, S.; Shin, G.; Ahn, Y. Sensing viruses using terahertz nano-gap metamaterials. Biomed. Opt. Express 2017, 8, 3551–3558. [Google Scholar] [CrossRef] [PubMed]
  22. Park, S.; Hong, J.; Choi, S.; Kim, H.; Park, W.; Han, S.; Park, J.; Lee, S.; Kim, D.; Ahn, Y. Detection of microorganisms using terahertz metamaterials. Sci. Rep. 2014, 4, 4988. [Google Scholar] [CrossRef] [PubMed]
  23. Park, S.; Son, B.; Choi, S.; Kim, H.; Ahn, Y. Sensitive detection of yeast using terahertz slot antennas. Opt. Express 2014, 22, 30467–30472. [Google Scholar] [CrossRef]
  24. Kim, H.S.; Cha, S.H.; Roy, B.; Kim, S.; Ahn, Y. Humidity sensing using THz metamaterial with silk protein fibroin. Opt. Express 2018, 26, 33575–33581. [Google Scholar] [CrossRef]
  25. Hong, J.; Jun, S.; Cha, S.; Park, J.; Lee, S.; Shin, G.; Ahn, Y. Enhanced sensitivity in THz plasmonic sensors with silver nanowires. Sci. Rep. 2018, 8, 15536. [Google Scholar] [CrossRef]
  26. Beruete, M.; Jáuregui-López, I. Terahertz sensing based on metasurfaces. Adv. Opt. Mater. 2020, 8, 1900721. [Google Scholar] [CrossRef]
  27. Nagel, M.; Haring Bolivar, P.; Brucherseifer, M.; Kurz, H.; Bosserhoff, A.; Büttner, R. Integrated THz technology for label-free genetic diagnostics. Appl. Phys. Lett. 2002, 80, 154–156. [Google Scholar] [CrossRef]
  28. Al-Naib, I.A.I.; Jansen, C.; Koch, M. Thin-film sensing with planar asymmetric metamaterial resonators. Appl. Phys. Lett. 2008, 93, 083507. [Google Scholar] [CrossRef]
  29. Chen, H.-T.; Padilla, W.J.; Zide, J.M.; Gossard, A.C.; Taylor, A.J.; Averitt, R.D. Active terahertz metamaterial devices. Nature 2006, 444, 597–600. [Google Scholar] [CrossRef]
  30. Tao, H.; Chieffo, L.R.; Brenckle, M.A.; Siebert, S.M.; Liu, M.; Strikwerda, A.C.; Fan, K.; Kaplan, D.L.; Zhang, X.; Averitt, R.D. Metamaterials on paper as a sensing platform. Adv. Mater. 2011, 23, 3197–3201. [Google Scholar] [CrossRef]
  31. O’Hara, J.F.; Withayachumnankul, W.; Al-Naib, I. A review on thin-film sensing with terahertz waves. J. Infrared Millim. Terahertz Waves 2012, 33, 245–291. [Google Scholar] [CrossRef]
  32. O’Hara, J.F.; Singh, R.; Brener, I.; Smirnova, E.; Han, J.; Taylor, A.J.; Zhang, W. Thin-film sensing with planar terahertz metamaterials: Sensitivity and limitations. Opt. Express 2008, 16, 1786–1795. [Google Scholar] [CrossRef] [PubMed]
  33. Yoon, S.; Cha, S.; Jun, S.; Park, S.; Park, J.-Y.; Lee, S.; Kim, H.; Ahn, Y. Identifying different types of microorganisms with terahertz spectroscopy. Biomed. Opt. Express 2020, 11, 406–416. [Google Scholar] [CrossRef] [PubMed]
  34. Jun, S.; Ahn, Y. Terahertz thermal curve analysis for label-free identification of pathogens. Nat. Commun. 2022, 13, 3470. [Google Scholar] [CrossRef]
  35. Novick, A. Growth of bacteria. Annu. Rev. Microbiol. 1955, 9, 97–110. [Google Scholar] [CrossRef]
  36. Smelt, J.; Brul, S. Thermal inactivation of microorganisms. Crit. Rev. Food Sci. Nutr. 2014, 54, 1371–1385. [Google Scholar] [CrossRef]
  37. Khandelwal, G.; Bhyravabhotla, J. A phenomenological model for predicting melting temperatures of DNA sequences. PLoS ONE 2010, 5, e12433. [Google Scholar] [CrossRef]
  38. Park, S.; Yoon, S.; Ahn, Y. Dielectric constant measurements of thin films and liquids using terahertz metamaterials. RSC Adv. 2016, 6, 69381–69386. [Google Scholar] [CrossRef]
  39. Park, S.; Jun, S.; Kim, A.; Ahn, Y. Terahertz metamaterial sensing on polystyrene microbeads: Shape dependence. Opt. Mater. Express 2015, 5, 2150–2155. [Google Scholar] [CrossRef]
  40. Hong, J.; Park, D.; Yim, J.; Park, J.; Park, J.-Y.; Lee, S.; Ahn, Y. Dielectric constant engineering of single-walled carbon nanotube films for metamaterials and plasmonic devices. J. Phys. Chem. Lett. 2013, 4, 3950–3957. [Google Scholar] [CrossRef]
  41. Park, D.; Hong, J.; Park, J.; Choi, S.; Son, B.; Rotermund, F.; Lee, S.; Ahn, K.; Kim, D.; Ahn, Y. Resonant transmission of terahertz waves through metallic slot antennas on various dielectric substrates. Curr. Appl. Phys. 2013, 13, 753–757. [Google Scholar] [CrossRef]
  42. Park, S.J.; Ahn, Y.H. Accurate measurement of THz dielectric constant using metamaterials on a quartz substrate. Curr. Opt. Photon. 2017, 1, 637–641. [Google Scholar]
  43. Siegel, J.A.; Saukko, P.J. Encyclopedia of Forensic Sciences; Academic Press: Cambridge, MA, USA, 2012. [Google Scholar]
  44. Engqvist, M.K. Correlating enzyme annotations with a large set of microbial growth temperatures reveals metabolic adaptations to growth at diverse temperatures. BMC Microbiol. 2018, 18, 177. [Google Scholar] [CrossRef] [PubMed]
  45. Dewachter, L.; Verstraeten, N.; Fauvart, M.; Michiels, J. An integrative view of cell cycle control in Escherichia coli. FEMS Microbiol. Rev. 2018, 42, 116–136. [Google Scholar] [CrossRef] [PubMed]
  46. Jun, S. Polymer physics for understanding bacterial chromosomes. In Bacterial Chromatin; Springer: Dordrecht, The Netherlands, 2010; pp. 97–116. [Google Scholar]
  47. Russell, A. Lethal effects of heat on bacterial physiology and structure. Sci. Prog. 2003, 86, 115–137. [Google Scholar] [CrossRef]
  48. Jeong, H.; Bjorn, P.; Hong, S.; Cheon, S.; Oh, K. Irreversible denaturation of DNA: A method to precisely control the optical and thermo-optic properties of DNA thin solid films. Photonics Res. 2018, 6, 918–924. [Google Scholar] [CrossRef]
  49. Martínez de la Escalera, G.; Segura, A.M.; Kruk, C.; Ghattas, B.; Piccini, C. Genotyping and functional regression trees reveals environmental preferences of toxic cyanobacteria (Microcystis aeruginosa complex) along a wide spatial gradient. bioRxiv 2019. [Google Scholar] [CrossRef]
  50. Yu, L.; Wu, X.; Yu, Y.; Shi, L.; Zhang, M. Recruitment of cyanobacteria by reverse transcription quantitative real-time PCR based on expression of Microcystis gene. PeerJ 2019, 7, e7188. [Google Scholar] [CrossRef]
  51. Slade, L.; Levine, H. Non-equilibrium behavior of small carbohydrate-water systems. Pure Appl. Chem. 1988, 60, 1841–1864. [Google Scholar] [CrossRef]
  52. Thalla, M.; Gangasani, J.; Saha, P.; Ponneganti, S.; Borkar, R.M.; Naidu, V.; Murty, U.; Banerjee, S. Synthesis, characterizations, and use of o-stearoyl mannose ligand-engineered lipid nanoarchitectonics for alveolar macrophage targeting. Assay Drug Dev. Technol. 2020, 18, 249–260. [Google Scholar] [CrossRef]
  53. Mikami, K.; Lonnecker, A.T.; Gustafson, T.P.; Zinnel, N.F.; Pai, P.-J.; Russell, D.H.; Wooley, K.L. Polycarbonates derived from glucose via an organocatalytic approach. J. Am. Chem. Soc. 2013, 135, 6826–6829. [Google Scholar] [CrossRef] [PubMed]
  54. Mehta, K.K.; Evitt, N.H.; Swartz, J.R. Chemical lysis of cyanobacteria. J. Biol. Eng. 2015, 9, 10. [Google Scholar] [CrossRef] [PubMed]
  55. Laroche, C. Exopolysaccharides from microalgae and cyanobacteria: Diversity of strains, production strategies, and applications. Mar. Drugs 2022, 20, 336. [Google Scholar] [CrossRef]
  56. Rachel, R.; Pum, D.; Šmarda, J.; Šmajs, D.; Komrska, J.; Krzyzánek, V.; Rieger, G.; Stetter, K.O., II. Fine structure of S-layers. FEMS Microbiol. Rev. 1997, 20, 13–23. [Google Scholar] [CrossRef]
  57. Leak, L.V. Fine structure of the mucilaginous sheath of Anabaena sp. J. Ultrastruct. Res. 1967, 21, 61–74. [Google Scholar] [CrossRef]
  58. Kumar, D.; Kaštánek, P.; Adhikary, S.P. Exopolysaccharides from cyanobacteria and microalgae and their commercial application. Curr. Sci. 2018, 115, 234–241. [Google Scholar] [CrossRef]
  59. Ginzberg, A.; Korin, E.; Arad, S. Effect of drying on the biological activities of a red microalgal polysaccharide. Biotechnol. Bioeng. 2008, 99, 411–420. [Google Scholar] [CrossRef]
  60. Hoiczyk, E.; Hansel, A. Cyanobacterial cell walls: News from an unusual prokaryotic envelope. J. Bacteriol. 2000, 182, 1191–1199. [Google Scholar] [CrossRef]
  61. Zhang, D.; Dechatiwongse, P.; del Rio-Chanona, E.; Maitland, G.; Hellgardt, K.; Vassiliadis, V. Modelling of light and temperature influences on cyanobacterial growth and biohydrogen production. Algal Res. 2015, 9, 263–274. [Google Scholar] [CrossRef]
  62. Winder, L.; Phillips, C.; Richards, N.; Ochoa-Corona, F.; Hardwick, S.; Vink, C.J.; Goldson, S. Evaluation of DNA melting analysis as a tool for species identification. Methods Ecol. Evol. 2011, 2, 312–320. [Google Scholar] [CrossRef]
  63. Gallon, J.R.; Pederson, D.M.; Smith, G.D. The effect of temperature on the sensitivity of nitrogenase to oxygen in the cyanobacteria Anabaena cylindrica (Lemmermann) and Gloeothece (Nägeli). New Phytol. 1993, 124, 251–257. [Google Scholar] [CrossRef] [PubMed]
  64. Sánchez-Riego, A.M.; Mata-Cabana, A.; Galmozzi, C.V.; Florencio, F.J. NADPH-thioredoxin reductase C mediates the response to oxidative stress and thermotolerance in the cyanobacterium Anabaena sp. PCC7120. Front. Microbiol. 2016, 7, 1283. [Google Scholar] [CrossRef] [PubMed]
  65. Wang, H.; Sivonen, K.; Rouhiainen, L.; Fewer, D.P.; Lyra, C.; Rantala-Ylinen, A.; Vestola, J.; Jokela, J.; Rantasärkkä, K.; Li, Z. Genome-derived insights into the biology of the hepatotoxic bloom-forming cyanobacterium Anabaena sp. strain 90. BMC Genom. 2012, 13, 613. [Google Scholar] [CrossRef] [PubMed]
  66. Kaplan Can, H.; Gurbuz, F.; Odabaşı, M. Partial characterization of cyanobacterial extracellular polymeric substances for aquatic ecosystems. Aquat. Ecol. 2019, 53, 431–440. [Google Scholar] [CrossRef]
  67. Supeng, L.; Guirong, B.; Hua, W.; Fashe, L.; Yizhe, L. TG-DSC-FTIR analysis of cyanobacteria pyrolysis. Phys. Procedia 2012, 33, 657–662. [Google Scholar] [CrossRef]
  68. Loza, V.; Perona, E.; Mateo, P. Molecular fingerprinting of cyanobacteria from river biofilms as a water quality monitoring tool. Appl. Environ. Microbiol. 2013, 79, 1459–1472. [Google Scholar] [CrossRef]
  69. Shyam Kumar, R.; Thajuddin, N. Influence of temperature and light intensity on growth of symbiotic cyanobacteria isolated from cyanolichens. Res. Rev. Biosci. 2009, 3, 179–182. [Google Scholar]
  70. Arif, I. ALGAL DISTRIBUTIONS IN A HOT-SPRING OF SAUDI-ARABIA. Arab Gulf J. Sci. Res. B 1989, 7, 145–154. [Google Scholar]
  71. Guo, Y.; Meng, H.; Zhao, S.; Wang, Z.; Zhu, L.; Deng, D.; Liu, J.; He, H.; Xie, W.; Wang, G. How does Microcystis aeruginosa respond to elevated temperature? Sci. Total Environ. 2023, 889, 164277. [Google Scholar] [CrossRef]
  72. Celeste, C.M.M.; Lorena, R.; Oswaldo, A.J.; Sandro, G.; Daniela, S.; Dario, A.; Leda, G. Mathematical modeling of Microcystis aeruginosa growth and [D-Leu1] microcystin-LR production in culture media at different temperatures. Harmful Algae 2017, 67, 13–25. [Google Scholar] [CrossRef]
  73. Bittencourt-Oliveira, M.d.C.; Piccin-Santos, V.; Gouvêa-Barros, S. Microcystin-producing genotypes from cyanobacteria in Brazilian reservoirs. Environ. Toxicol. 2012, 27, 461–471. [Google Scholar] [CrossRef]
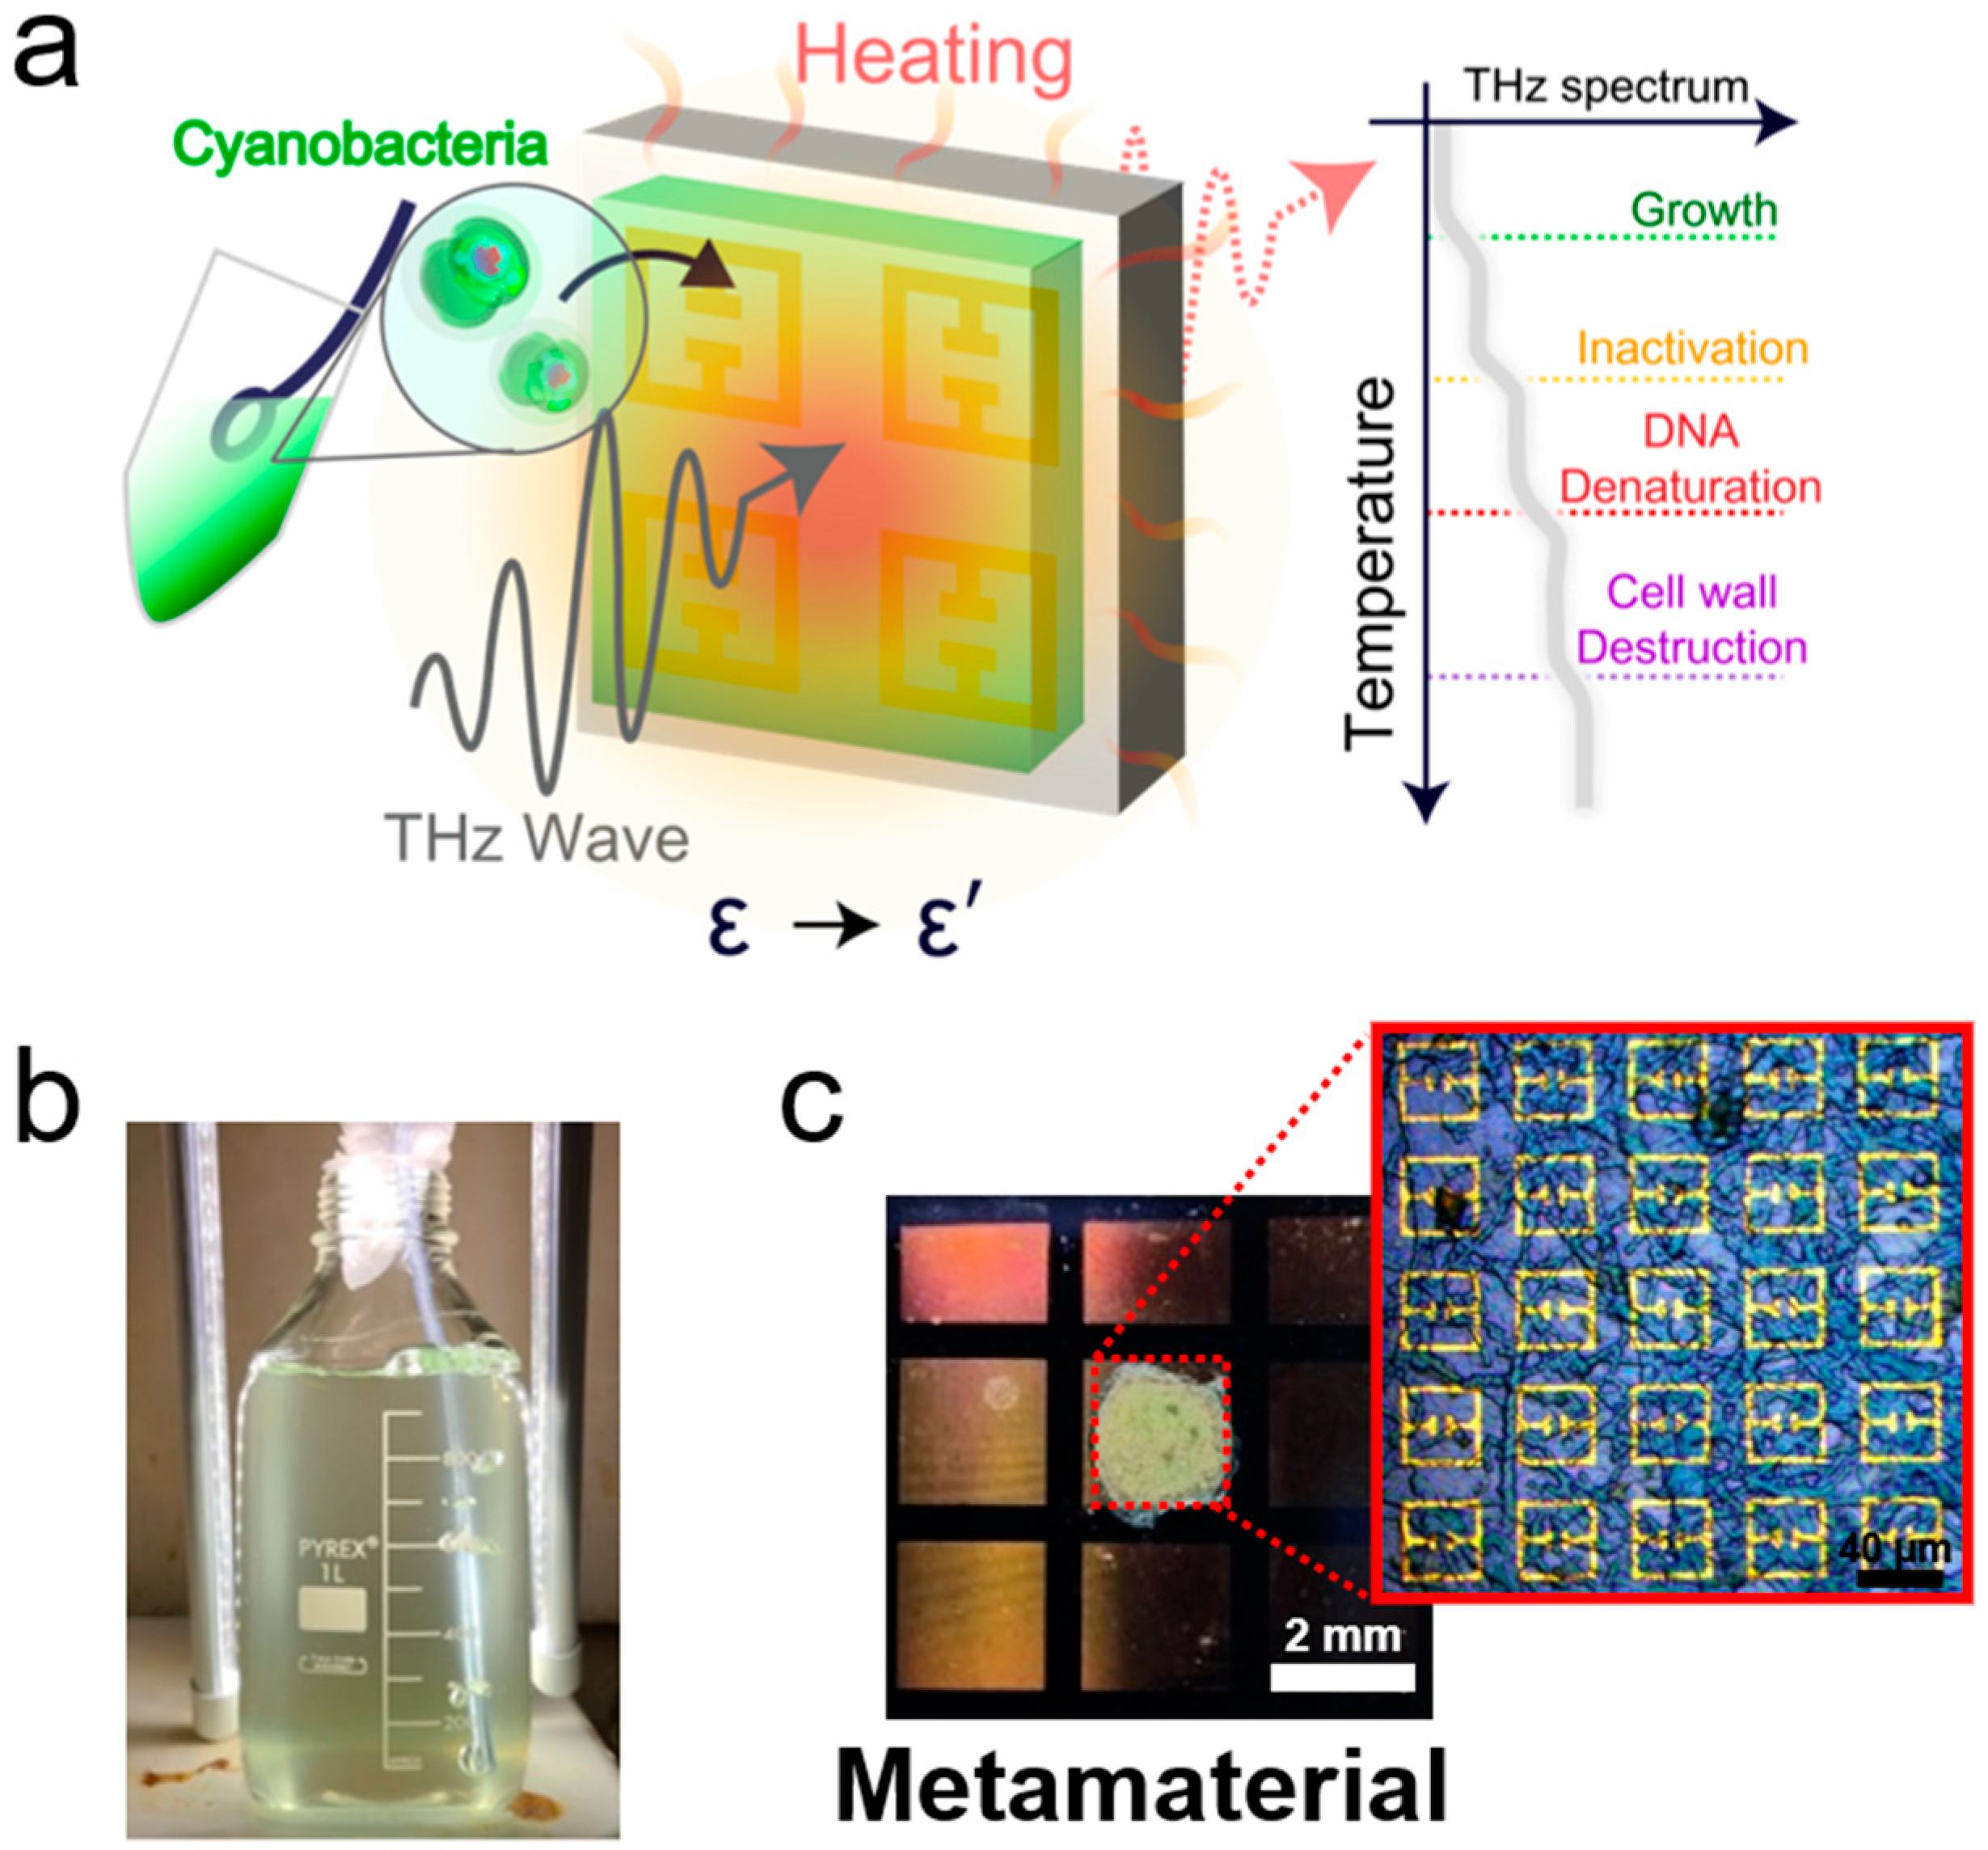
Figure 1. (a) Schematic illustration of the dielectric constant measurement with THz metamaterials and thermal curve analysis for label-free identification. (b) Picture of bottled water containing cyanobacteria (Anabaena sp.) grown by blue-green medium (BGII). (c) Photograph of metasensor coated with Anabaena sp.
Biosensors 14 00519 g001
Figure 2. THz transmission amplitudes through the metamaterial with (red) and without (black) coating of the cyanobacteria (Anabaena sp.) The thickness of the films was about 4 μm.
Biosensors 14 00519 g002
Figure 3. Resonant frequency shift (Δf) as a function of coating time (Ncy) for four different cyanobacterial species: Anabaena sp. (a), Aphanocapsa sp. (b), Aphanothece sp. (c), and Microcystis sp. (d). Red solid lines indicate fits to the data.
Biosensors 14 00519 g003
Figure 4. Dielectric constant measurement results for different cyanobacterial layers. The error bars indicate the standard deviation from the fitting.
Biosensors 14 00519 g004
Figure 5. (a) 2D plot of THz absorption through metamaterials coated with cyanobacteria (Anabaena sp.) as functions of spectrum (x-axis) and substrate temperature (y-axis). (dotted line) Metamaterial resonance (fR) as a function of temperature. (b) Differential thermal curves (dfR/dT) for Anabaena sp. layer obtained by differentiating the curve in (a). (ce) Differential thermal curves Aphanocapsa sp., Aphanothece sp., and Microcystis sp. layers.
Biosensors 14 00519 g005
Figure 6. Bar graphs of amplitude as a function of temperature according to the peaks observed in DTCs for Anabaena sp. (a), Aphanocapsa sp. (b), Aphanothece sp. (c), and Microcystis sp. (d). The error bars indicate the standard deviation obtained from statistics for DTC curves from 10 samples of each species. Background colors indicate temperature ranges for their growth (green), thermal inactivation (yellow), DNA denaturation (red), and cell wall destruction (purple) reported in the literature. (e) Schematic illustration of extracellular structures in cyanobacteria.
Biosensors 14 00519 g006
Disclaimer/Publisher’s Note: The statements, opinions and data contained in all publications are solely those of the individual author(s) and contributor(s) and not of MDPI and/or the editor(s). MDPI and/or the editor(s) disclaim responsibility for any injury to people or property resulting from any ideas, methods, instructions or products referred to in the content.