Article

O&M Models for Ocean Energy Converters: Calibrating through Real Sea Data

by
Tianna Bloise Thomaz
1,*,
David Crooks
1,
Encarni Medina-Lopez
2,
Leonore van Velzen
1,
Henry Jeffrey
1,
Joseba Lopez Mendia
3,
Raul Rodriguez Arias
3 and
Pablo Ruiz Minguela
3
1
School of Engineering, Institute for Energy Systems, The University of Edinburgh, Edinburgh EH9 3JG, UK
2
School of Engineering, Institute for Infrastructure and Environment, The University of Edinburgh, Edinburgh EH9 3JG, UK
3
Tecnalia, Energy and Environment Division, Parque Tecnológico de Bizkaia, E48160 Derio, Bizkaia, Spain
*
Author to whom correspondence should be addressed.
Energies 2019, 12(13), 2475; https://doi.org/10.3390/en12132475
Submission received: 15 May 2019 / Revised: 17 June 2019 / Accepted: 25 June 2019 / Published: 27 June 2019
(This article belongs to the Section A3: Wind, Wave and Tidal Energy)

Abstract

:
Of the cost centres that combine to result in Levelised Cost of Energy (LCOE), O&M costs play a significant part. Several developers have calculated component costs, demonstrating how they can become commercially competitive with other forms of renewable energy. However, there are uncertainties relating to the O&M figures that can only be reduced through lessons learned at sea. This work presents an O&M model calibrated with data from real sea experience of a wave energy device deployed at the Biscay Marine energy Platform (BiMEP): the OPERA O&M Model. Two additional case studies, utilising two other O&M calculation methodologies, are presented for comparison with the OPERA O&M Model. The second case study assumes the inexistence of an O&M model, utilising a Simplified Approach. The third case study applies DTOcean’s (a design tool for ocean energy arrays) O&M module. The results illustrate the potential advantages of utilising real sea data for the calibration and development of an O&M model. The Simplified Approach was observed to overestimate LCOE when compared to the OPERA O&M Model. This work also shows that O&M models can be used for the definition of optimal maintenance plans to assist with OPEX reduction.

1. Introduction

The development of the ocean renewable energy sector will be related to the associated economic, social and environmental benefits it will bring. Ocean energy has a large potential global resource with the International Energy Agency’s Ocean Energy Systems group forecasting a global potential of up to 337GW [1]. Further to this, a commercial ocean energy sector would assist in reaching renewable energy targets, facilitate a balanced renewable energy system, create jobs and generate activity in economies [2]. Many European countries have supporting policies as well as targets to assist in the development of the ocean energy sector. This is with good reason as the Ocean Energy Forum estimates that it has the potential to meet 10% of European power demand by 2050 using ocean energy [3]. As an example of national developments, the University of Edinburgh summarized the main developments and achievements of the industry in the UK by 2017 [4]. Apart from the supporting policies established by many countries, the European Commission is a key institution assisting the progress of the sector with research and development funding programs. EnFAIT (Enabling Future Arrays in Tidal) [4] is an example of a tidal energy R&D project funded by the European Commission. The OPERA (Open Sea Operating Experience to Reduce Wave Energy Cost) project [5] is another example of a European-funded project, under H2020, [6] which aims to improve the Technology Readiness Level (TRL) of wave energy technologies, from a laboratory to a marine environment, allowing the collection and analyses of real sea data.
Although there are mechanisms of support for the ocean energy sector, there are still large uncertainties associated with estimating economic parameters for ocean energy, such as the cost of energy. Economic indicators, such as Levelised Cost of Energy (LCOE), are indispensable for comparing energy technologies and making investment decisions to continue the support mechanisms for the ocean energy sector. The lack of demonstration technologies proving that these devices are viable forms of energy generation and economically competitive with other renewable energy generation is a key challenge facing the ocean energy sector. In order to become commercial, the cost of energy will have to reduce. Of the different cost centres, which combine to result in a cost of energy, the Operational Expenditure (OPEX) represents a large proportion of the overall costs [7,8]. Installation and decommissioning costs also contribute significantly to LCOE and are surrounded by uncertainties due to the relatively few deployed projects. In the literature, OPEX and installation costs of ocean energy developments have been found to represent around 1/3 of the total project costs [7,8] Variations in costs are attributed to different devices and sites. For some devices, operational costs are lower, as they can be assisted by smaller boats, or their sites allow wider operational weather windows.
Often the ocean energy sector is compared with offshore wind, due to the many similarities in the operating conditions leading to elevated costs and engineering challenges [7]. The offshore wind sector is the major competitor of the ocean energy sector and is consequently used as a point of reference for comparison. Several offshore wind studies concentrate on investigating the effects of the Operation and Maintenance (O&M) costs on the LCOE. A number of modelling approaches have been investigated within the area of O&M of wind energy technologies, including mathematical modelling to identify suitable weather windows, to represent failure behaviour of components and to support operational-strategic decisions [9]. Further to this, artificial intelligence and machine learning approaches have also been used to make strategic decisions so as to minimise maintenance costs and therefore the cost of energy [10]. Figure 1 shows that there is an optimal Maintenance Effort when the total costs are minimum. The aim of an O&M model is to identify and capture this point.
The O&M strategies used in the offshore wind sector are often based on O&M methods developed for the oil and gas industry. However, the conditions are different for the wind industry and as a result these methods must be adjusted accordingly [11]. Similarly, O&M models developed for the ocean energy industry must adapt to fit the sector needs. A review of the literature has shown that several O&M models have been developed for the offshore wind industry; however, the same is not true for the ocean energy sector, bar a few exceptions [12], due to a lack of real operational experience. Lessons learned in the offshore wind industry can be applied to the ocean energy sector; however, without real sea experience, uncertainties will remain in O&M predictions for single devices and further to that, greater uncertainty will exist for arrays of devices. Developers have calculated component costs, demonstrating how they can become commercially competitive with other forms of renewable energy. However, there is an uncertainty in the figures that can only be reduced through lessons learned at sea. Further to this, the accuracy of data will improve when progressing through the higher TRL stages associated with demonstrating scaled devices, full scale devices and array deployments.
The methodology presented in this paper has been created for the OPERA project, a European collaborative project funded by the European Commission under the H2020 LCE-02-2015 call. The OPERA project aims to reduce the cost of wave energy by gathering real sea operation experience and developing an O&M model calibrated with real sea data. This work also makes use of a DTOcean scenario which has been created for the EnFAIT project, a European collaborative project funded by the European Commission under the H2020 LCE-15-2016 call. The aim of the EnFAIT project is to provide a step change in the lifetime cost of energy for tidal power by means of a grid-connected tidal energy array.
This paper presents a case study with an ocean energy device from Oceantec Energias Marinas-Idom (Oceantec-Idom) [13,14] and identifies the differences in economic indicators caused by the use of real sea data obtained throughout OPERA project to calibrate and develop the OPERA O&M Model. The results from the O&M model are compared against a Simplified Approach often used to estimate OPEX, installation and decommissioning costs. The rest of this paper is structured as follows. Section 2 describes the methodology developed in the OPERA project with the gain of the real sea experience. Section 3 presents three case studies: the OPERA O&M Model developed for the application of a single device; the Simplified Approach that calculates OPEX, installation and decommissioning costs as a percentage of CAPEX; and a DTOcean O&M Module case study, applied for an array of devices. The results and discussions are presented in Section 4 and finally the conclusions in Section 5.

2. Methodology

2.1. Global Economic Model

This section introduces the structure of the Global Economic Model, which calculates LCOE, performs a Life-Cycle Assessment (LCA) and calculates the Socio-economic Cost of Energy (SCOE) [15]. LCOE is the most commonly used metric in defining and comparing the commercial ability of a project to different technology costs. The LCA assesses the potential environmental impacts of project activities in terms of Global Warming Potential (GWP), Energy Pay Back in Time (EPBT), and Energy Return of Investment (EROI). The SCOE is an assessment to support decision-making at policy level factoring in job creation and other socio-economic impacts of the energy sector. The Global Economic Model has been developed to build on the strengths of the pre-existing models. Therefore, for the LCOE calculation, a few tools were reviewed, such as Clean Energy Management Software [16], Navitas [17], Wave Venture TE [18], WaveFarmer, COE (Cost of Energy) Calculation Tool [19] and the UHINDAR Project [20]. During the LCA model’s development, the OpenLCA tool [21] was reviewed. For the development of the SCOE calculations, the Siemens SCOE model [22] and The JEDI (Jobs and Economic Development Impacts) tool [23] were reviewed. The following sections describe the calculations undertaken within the Global Economic Model that are relevant to this study (excluding SCOE) in more detail.

2.1.1. Economic Modelling

The outputs of the techno-economic analyses are economic indicators used to determine the profitability of the project such as the LCOE, Net Present Value (NPV), Internal Rate of Return (IRR), and CAPEX per MW. This work focuses on LCOE. LCOE is calculated as the total CAPEX and OPEX costs (including installation and decommissioning), discounted to present day value, with a discount rate of k, divided by the discounted energy produced throughout the technology’s operational life, and n being the number of years of the project. LCOE is obtained using (1):
L C O E = C A P E X + t = 1 n O P E X ( 1 + k ) t t = 1 n A E P ( 1 + k ) t
The AEP term, Annual Energy Production, can be obtained with a real sea experience or calculated using (2):
A E P = P η Y A i
where P is the power rating, η is the Capture Width Ratio (CWR), Y is the number of hours in a year and Ai is availability.

2.1.2. Environmental Impacts

Environmental Impact Assessments (EIAs) can take a number of forms, such as Strategic Environmental Assessments (SEAs) [24], Environmental Risk Assessments (ERAs) [25] and the previously mentioned LCAs [26]. EIAs are used to evaluate the potential environmental impacts of project activities [27]. In the present work, the LCA methodology is employed to quantify the environmental impacts associated with manufacturing, installation, O&M and decommissioning stages.
To evaluate the potential environmental impacts, the equivalent embodied carbon and the equivalent embodied energy are calculated first. Values from the Ecoinvent database [28] are used to assist with these embodied calculations. These coefficients relate to the technology’s manufacture processes and activities undertaken. To calculate the embodied carbon and energy values, the coefficients are multiplied by lengths, masses or volumes depending on the component or activity. With the calculation of embodied carbon and embodied energy, the GWP, EPBT and EROI metrics are calculated.

2.2. Model Integration

The Global Economic Model integrates the two modules described in the previous sections: economic modelling and environmental impact, and the SCOE module. The OPERA O&M Model provides internal inputs to each of the Global Economic Model’s three modules.
Within the OPERA project, operational data has been recorded for a period of 2 years, which enabled the development of an O&M model calibrated with real sea data, referred to as the OPERA O&M Model. This led to the integration of real sea operating data within the Global Economic Model. In general, it is believed that this integration will improve the accuracy of the estimates made by the Global Economic Model.

2.3. Development of the OPERA O&M Model

This study has considered a medium complexity modelling approach to account for the maturity of wave energy technologies, providing some useful design guidance and recommendations to developers in the prototype stage, TRL3–6 [3]. This approach is not as complex in terms of resource optimization as some models (such as Refs. [29,30,31,32,33,34,35]), but is detailed enough to identify different cost centres. The objective is not logistic optimization over the project deployment lifetime, but the identification of cost reduction pathways for operations during the technology design phase. However, the complex optimization models provide useful knowledge and data that can be integrated in a more versatile tool customized for the OPERA project.
The OPERA O&M Model outputs OPEX, installation and decommissioning costs. Most of the models referenced above cannot be modified or adapted for the OPERA project. Open source models such as DTOcean [34] require detailed inputs, some of which are difficult to estimate at this stage of the ocean energy industry’s development.
The objective of the OPERA O&M Model is to quantify the effects of each operation carried out during the project in terms of cost and carbon emissions and how the operations impact device availability. The architecture of the OPERA O&M Model is presented in Figure 2.
The first step of the model is to define different systems where the operations will be divided (e.g., mooring, structure, PTO). Once general characteristics and operations are identified, specific resources for each operation must be defined such as vessels, equipment, labour and spares, duration of the operation, uncertainty level, and mean time between failures, which are taken from the DTOcean library, local suppliers and the literature [34,35,36]. The real sea experience gives inputs into the model, such as failure rates and operations design; operation time; environmental conditions; equipment; and ships.
The operations are either assigned as preventive or corrective actions (see Figure 3) depending on the uncertainty level of the element that is considered as an input. High uncertainty operations will have a greater probability of requiring corrective maintenance, whereas well-known operations are able to utilise preventive maintenance. Examples of preventive maintenance are inspections, calendar-based replacements and condition monitoring operations. All operations are considered independent of one another. However, the tool has the ability to define a corrective operation as plannable in order to reflect the impact of monitoring in identifying potential maintenance needs.
Two seasons have been considered to characterise farm accessibility, namely the summer season (March–August) and the winter season (September–February). Preventive operations will be scheduled in the summer months leading to shorter waiting times. As a conservative measure, all corrective operations will be penalised in terms of waiting time and system availability. Considering the failure rates of the different components and the maintenance plan, the full calendar of operations is generated along the farm project life. Once the operation time is estimated taking into account the different steps to complete each task, the total cost of each operation can be obtained.
The OPERA O&M Model is detailed further in Section 3.1.

3. Case Studies

This work focusses on the OPERA O&M Model, and in order to evaluate this model, two other case studies are investigated: the OPERA Simplified Approach and the DTOcean O&M Module. The OPERA O&M Model and the OPERA Simplified Approach are developed based on the Global Economic Model. The OPERA O&M Model considers real sea data and the Simplified Approach considers a simplified representation of O&M costs. The third case study is developed using the O&M Module of DTOcean, which is an open-source tool for the design of ocean energy arrays. Table 1 shows the considerations of the three case studies.
The first comparison between the OPERA O&M Model and the OPERA Simplified Approach aims to show the differences that can result from calibrating using real sea data. The second comparison between the OPERA O&M Model and the DTOcean O&M Module aims to provide an understanding between O&M costs and the Maintenance Effort. The latter comparison considers different devices; therefore, the results are normalised in order to make the comparison feasible.
Note, it is not the objective of this study to identify which model is the best. Each have their merits and drawbacks. The validity of their application will depend on the type and development stage of the technology and the purpose of the study. For example, it is expected that the OPERA O&M Model should be most accurate for predicting the costs and impacts of O&M activities on the Oceantec-Idom device. However, it must be stressed that its accuracy can only be truly validated by an independent dataset obtained from an array of similar devices operating over a full lifetime. For different devices, or those for which little is known, the OPERA O&M Model’s results might be misleading. In this case, the Simplified Approach, based on a broad literature review of research of similar devices, might be the best and most efficient approach. Alternatively, for commercial devices of which a high level of detail is known, the DTOcean O&M Module approach might be most appropriate.

3.1. OPERA O&M Model

Developed by the Spanish company Oceantec-Idom [13], the MARMOK-A-5 device (Figure 4) has been delivering electrical energy to the grid since December 2016 to June 2019 with a re-fitting in 2018 during the OPERA project. MARMOK-A-5 is an offshore electrical power generator that uses wave energy to create electricity. The device is a spar buoy point absorber with oscillating water column Power Take-Off (PTO) installed in the maritime testing site BiMEP, in the Bay of Biscay [38]. It is deployed 4 km from the coastline and is connected to the grid via a submarine electrical cable. It is the first grid-connected offshore wave energy converter in Spain, and one of the first in the world. The principal aim of the MARMOK-A-5 device is to obtain results to aid in the design of a new generation of cost-effective high-power marine energy generators.
  • Scenario (Inputs)
This study considers a device of 250 kW, deployed in two locations: BiMEP and EMEC [39]; with different array sizes: 250 kW (single device), 10 MW (40 devices) and 18 MW (72 devices). The first array is considered to be deployed by 2024 and the second array is considered to be deployed by 2050. Learning rates to account for economies of volume and ‘learning by doing’ are applied.
The project considers a discount rate of 8% and an operational lifetime of 20 years. The model considers that all manufacturing occurs on year 0 and 1, installation on year 1 and 2, operation during years 1–21, and decommissioning on year 21 and 22. The present work assumes an insurance cost during the O&M stage of 2.5% of the CAPEX. The present work also disregards electrical costs for the single device; it is assumed the single device will be deployed at a test bed with existing electrical infrastructure.
The model requires some general input data for the cost estimation of the O&M plan developed for the MARMOK-A-5 device. The real sea experience gained during the testing phase of the prototype will help improve the estimation of some of the inputs (e.g., operation time, maximum wave conditions for accessibility) and help optimize the design of the operations. Altogether, this is expected to result in a more accurate estimation of OPEX costs. Regarding vessel data inputs, different references have been considered, starting from private quotations from suppliers, the DTOcean project, [34], and other literature sources. Table 2 includes some of the parameters recorded for each vessel type. Some parameters are needed for the OPEX model, and others are used as decision-making information in order to select vessels for a particular operation.
Since the prototype installation in October 2016, several operations have been carried out related to the commissioning of the different systems of the PTO (e.g., turbine, generator, power electronics or control systems). After the analysis of these operations and with a better knowledge of the behaviour of different components, the inputs of the OPEX model have been improved. The OPERA O&M Model has been defined with 16 main operations classified into five groups: structure, mooring, PTO, electric and control. In each group, there are at least three operations: preventive maintenance; corrective maintenance with minor repair and corrective maintenance with major repair. There are also some repairs that can be planned for as a result of the effective preventive monitoring. Table 2 presents parameters that were recorded on the O&M activities that were carried out during the OPERA project’s deployment phase. This information was input into the OPERA O&M Model.

3.2. OPERA Simplified Approach

A Simplified Approach has been represented here for comparison with the OPERA O&M Model developed with real sea data. This approach is often taken in techno-economic analyses due to lack of data derived from real sea experience. This case was built based on the OPERA O&M Model scenario for a 10MW farm deployed in BiMEP. However, instead of using the O&M values coming from the real sea experience, the O&M values are taken from the literature. The OPEX and decommissioning costs have been estimated as percentages of the CAPEX and installation costs respectively. As proposed by Reference [40], the sum of the structure, moorings and PTO cost centres is considered the Initial Cost (IC) and the installation costs are set to 33% of IC. The uncertainty range is set to ± 20%. For this Simplified Approach case study, OPEX costs will be obtained as a fixed yearly percentage of CAPEX; in the present study, a value of 5% will be used, as suggested in References [41,42]. CAPEX considers the IC plus fees and installation costs. The uncertainty range is set to ± 40%. The decommissioning cost is taken as 80% of the installation cost, [43]. Since it is determined as a percentage of installation, which is a function of IC, the uncertainty range is set to ±20%, the same value as for the installation.

3.3. DTOcean O&M Module

DTOcean O&M Module is added here for comparison with the OPERA O&M Model. This scenario is added to compare with the results of the OPERA O&M Model, which was developed for a single device application, with an O&M model developed for an array application. DTOcean is modularised into five stages: hydrodynamics; electrical; moorings and foundations; installations; and operations and maintenance. The five stages can be analysed with three thematic assessments: economics, reliability and environmental [44]. This case study focusses on the O&M module of DTOcean, which calculates the required maintenance actions and energy losses resulting from the operation of the converters over the lifetime of the array. The DTOcean O&M module aims to minimise the impact of O&M on LCOE. The DTOcean O&M Module calculates the OPEX for the complete lifetime of the array. Maintenance is considered as either corrective or preventive. As discussed, the former is a reaction to unexpected failures, whereas the latter can again be subdivided into either Condition-based or Calendar-based preventive maintenance. Condition-based maintenance is activated based on monitoring processes. Calendar-based maintenance is performed on a regular basis. These strategies can be activated or deactivated to form different combinations [45]. To simulate real-world maintenance, in this study all of the above-mentioned procedures are activated, leading to a combination of replacement, inspection and on-site maintenance activities. Figure 5 shows the maintenance strategy of DTOcean, and Figure 6 shows the handling of automated inspection in case of condition-based maintenance.
The maintenance activities are determined based on the reliability of the sub-systems. The Reliability Assessment Module (RAM) defines the reliability of the sub-systems, which are given as user outputs, as well as feedback into the O&M Module to be able to determine the required activities. The RAM was not a focus point in this study. Further information of all modules and assessments of DTOcean can be found in Ref. [46]. The DTOcean case study is built upon an array of three Nova Innovation M100 100kW devices located in the Bluemull Sound, Shetland, in the north of Scotland. I is developed by Nova Innovation [47] through the European project EnFAIT [48]. Figure 7 shows the array layout considered for this case study as well as the bathymetry of the lease area. This array layout is suggested by DTOcean Hydrodynamic module as an optimal layout for the maximization of the energy production.
The environmental data at Bluemull Sound was collected with three Acoustic Doppler Current Profilers (ADCPs), followed by an extrapolation of these points to arrive to an hourly average velocity. Other assumptions of the case study are a discount rate of 10%, a project lifetime of 20 years and a project start date on the 1st of June 2020. The start date has an impact on the weather windows and therefore on the offshore activities.
DTOcean contains an internal database with reference data for vessels, equipment, ports and failure rates. The database can be altered, adjusting values and adding new items to it. DTOcean contains a list of 50 vessels, which are divided in different classes, such as heavy lift, installation and offshore support & maintenance. For this scenario, the vessel used by Nova Innovation for the offshore activities (Multicat MV C-Odyssey) was added. The library covers failure rates for subcomponents of the ocean energy system. The failure rates of the device, however, need to be specified as additional input data. The list of ports was also altered for this case study, and closer ports to the deployment site (ports of Cullivoe and Belmont) were added. The case study with the DTOcean O&M Module is added to define other economic benefits of having O&M models. When comparing the OPERA O&M Model and the DTOcean O&M Module, different devices, sites and installed capacity are compared, and therefore results are normalised in order to make it a feasible comparison.

4. Results and Discussion

In this section, the economic results are explored for the two case studies (OPERA and EnFAIT) in order to investigate and compare the results of the OPERA O&M Model with the other approaches for O&M modelling. Initially a comparison between the OPERA O&M Model and the Simplified Approach is performed to assess the economic results. Secondly, a comparison between the OPERA O&M Model and the DTOcean O&M Module is performed to understand the relationship between OPEX, preventive and corrective activities.

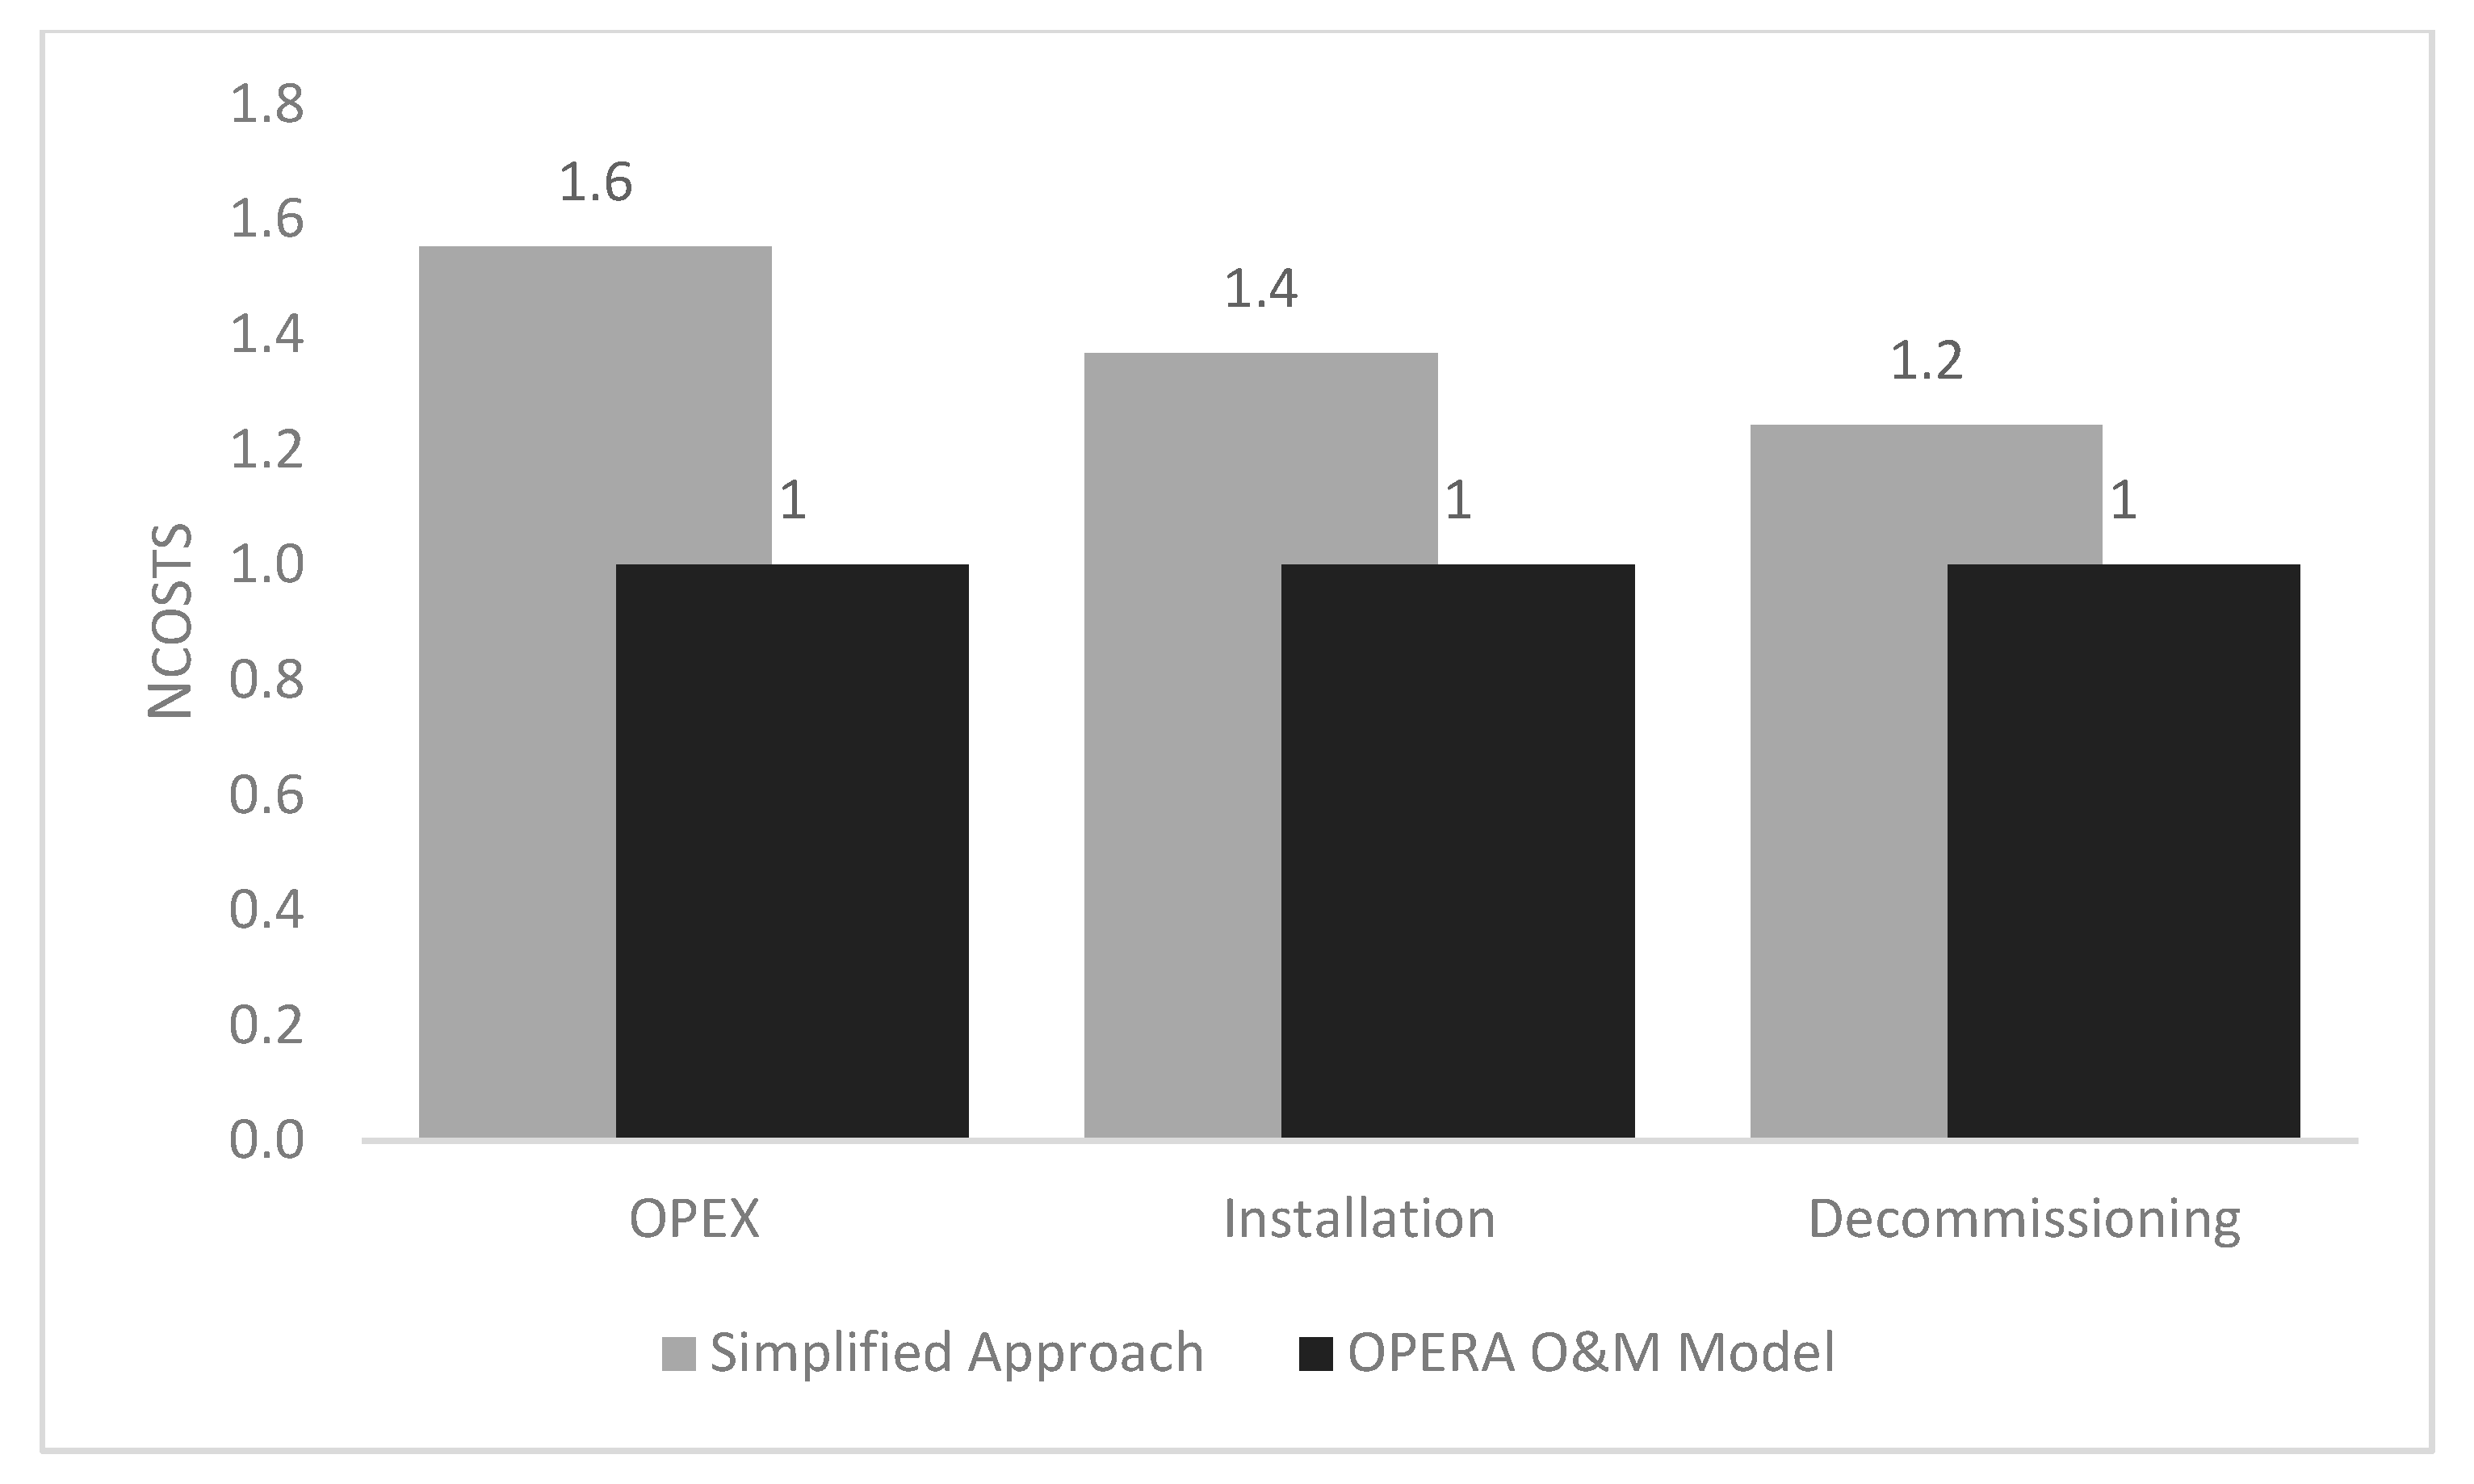
4.1. OPERA O&M Model vs Simplified Approach

The comparison between the OPERA O&M Model and the Simplified Approach is relative, and results are normalised using OPERA O&M Model values, see Equations (3) and (4).
N L C O E = L C O E i L C O E O P E R A
NLCOE is the normalised LCOE, which is the LCOE of the case study i, divided by the LCOE of the OPERA O&M Model.
N C o s t = C o s t i C o s t O P E R A
NCost is the normalised costs, which is the cost (e.g., OPEX, installation, decommissioning) of the case study i, divided by the cost of the OPERA O&M Model.
Table 3 compares the installation, OPEX, and decommissioning values output by the two methods. This table demonstrates that the calculated values differ depending on the site as well as on the array size.
The results of the OPERA O&M Model show similarities with the assumptions often made in the Simplified Approach. The Simplified Approach taken in this study assumes that the installation costs should be 33% of IC, whereas the OPERA O&M Model calculates a smaller value: installation costs represent between 21–30% of the initial costs. The Simplified Approach followed in this study also assumes decommissioning costs to be 80% of installation costs, whereas the OPERA O&M Model results suggest that for this case study, this value should increase to 88–89%. Finally, the Simplified Approach taken here assumes that OPEX should be 5% of the CAPEX yearly, and the OPERA O&M Model shows that O&M was calculated to vary between 3.1–3.7% of CAPEX per year, depending on the deployment location and size of the array.
Figure 8 compares mean LCOE calculated when using the OPEX, installation, decommissioning costs and availability values output by the OPERA O&M Model and the Simplified Approach methods, as well as the uncertainty ranges. For this case, the array of 10MW deployed in BiMEP was chosen. LCOE is normalised based on the mean value of the LCOE of the OPERA O&M Model.
There is a reduction in the uncertainty range for the case in which real sea data is used, due to the operational experience. The use of real sea data also results in a reduction in LCOE. The Simplified Approach overestimates the mean value of LCOE by 18%. Therefore, in the absence of a more sophisticated model or real sea data, the simplifications produce conservative results. Figure 9 compares normalised OPEX, installation and decommissioning costs obtained through both the Simplified Approach and the OPERA O&M Model.
When using real sea data, there is a reduction in OPEX, installation and decommissioning costs of about of 60%, 40% and 20%, respectively. Therefore, the LCOE obtained with the Simplified Approach is 18% bigger when compared to the case where the O&M model is calibrated with real sea data, as is shown in Figure 8. Furthermore, the Simplified Approach considers a constant value for OPEX every year. The OPERA O&M Model captures the yearly variation of OPEX costs along the timeframe of the project. Figure 10 shows how OPEX is calculated to vary by the OPERA O&M Model over the duration of the project due to the different O&M activities that occur in different years.
The OPERA O&M Model calculates the total OPEX based on the costs of preventive and corrective activities. This model also allows for a calculation of the downtime of the device, and therefore a calculation of the availability, which is often a simplification of the economic assessment in simplified approaches.
The results presented in this section are representative of the scenarios outlined and the O&M modelling approaches tested and demonstrate the differences that can result when using a real sea data-calibrated model or a Simplified Approach. As discussed, it is expected that the real sea data-calibrated OPERA O&M Model will yield more accurate results for an array of Oceantec-Idom MARMOK-A-5 devices; however, this is yet to be validated. As also discussed, the two approaches tested both have benefits and drawbacks and are useful for different technology stages. The Simplified Approach is useful for early stage devices when limited data is available. It is helpful to note that the Simplified Approach overestimates OPEX, installation and decommissioning costs and, therefore, LCOE. Although perhaps not helpful for a developer trying to demonstrate the promise of his/her technology, consider the detrimental scenario in which OPEX, installation, decommissioning and therefore LCOE, increased from an initial estimate after greater expenditure. The benefits of using a real sea data-calibrated model arise from its theoretically more accurate estimates: better predictions of cost and availability and improved strategies for O&M activities.
As outlined in Section 2.2, the OPERA O&M Model also provides an input to the Global Economic Model’s environmental impact module, namely litres of fuel consumed per year. Within the environmental impact module, fuel consumption is used to calculate the embodied carbon and embodied energy due to O&M activities. Fuel consumption during O&M activities is often missed in LCA studies of ocean energy converters or assumed to be low [49,50,51], as the simplified models used do not account for specific O&M activities in detail. Use of the OPERA O&M Model has shown the potentially significant impact that the fuel consumed during O&M activities can have on the environmental impact of ocean energy converters.

4.2. OPERA O&M Model vs DTOcean O&M Module

This section compares the results of the OPERA O&M Model with those of the O&M module of DTOcean. The OPEX costs are defined as the expenditures associated with the corrective and preventive maintenance activities. The more preventive activities take place, the lower the probability of unexpected failures occurring and consequently the need for corrective activities. Taken to the extreme, preventative maintenance activities could potentially be undertaken so as to prevent unexpected failures from occurring, essentially eradicating the need for corrective maintenance activities. However, a balance must be found as such a condition would most likely incur a prohibitively high level of OPEX for failures that might not occur. The interval for maintenance activities is often driven by the Mean Time to Failures (MTTF) of components. For the OPERA O&M Model, the planned operations consider a Maintenance Effort (Me) of 1, which means that the operation interval is equal to the MTTF of each component.
M e = M T T F O p e r a t i o n   I n t e r v a l
The larger the Maintenance Effort, the more frequent the preventive activities, and, therefore, smaller intervals occur between preventive interventions. The comparison between OPERA O&M Model and DTOcean O&M Module is only possible in a relative way, due to the different characteristics of the inputs. Therefore, results are normalised using the preventive cost when the Maintenance Effort is equal to 1, see Equations (6)–(8).
N p r e v e n t i v e = p r e v e n t i v e   c o s t s   M e = i p r e v e n t i v e   c o s t s M e = 1
Npreventive is the normalised preventive cost, which is the cost spent on preventive activities for any Maintenance Effort i divided by the preventive cost when the Maintenance Effort is 1.
N c o r r e c t i v e = c o r r e c t i v e   c o s t s M e = i p r e v e n t i v e   c o s t s M e = 1
Ncorrective is the normalised corrective cost, which is the cost spent on corrective activities for any Maintenance Effort i divided by the preventive cost when the Maintenance Effort is 1.
N O P E X = N p r e v e n t i v e + N c o r r e c t i v e
NOPEX is the normalised OPEX, which is the sum of normalised preventive costs and normalised corrective costs.
Both models present a level of uncertainty within the results. The uncertainty can be represented by the standard deviation (STDV). The larger the uncertainty is, the higher the STDV. The results of both models are presented as a mean value and an uncertainty range equivalent to approximately one STDV, which means that the uncertainty range is covering 68% of the results, assuming normal distribution. The OPERA O&M Model includes uncertainty within the O&M results for both corrective and preventive activities. The DTOcean O&M Module does not calculate the uncertainties associated with preventive activities.
Figure 11 presents the OPERA O&M Model relationship between different Maintenance Efforts and the expenditure of preventive and corrective activities. The OPERA O&M Model shows that after a certain point where there is a low contribution to cost from unexpected activities, the increase in the number of preventive activities will only lead to an increase in the overall OPEX, which is not desirable in terms of potential economic savings. This scenario suggests that a Maintenance Effort of 1 is a good maintenance approach from an economic point of view, producing low OPEX.
Figure 12, which presents normalised costs as calculated by the DTOcean O&M Module for different Maintenance Efforts, shows that uncertainty reduces to zero as preventative Maintenance Efforts are increased. This relates to the uncertainties only being estimated for corrective activities. However, increasing the number of preventive activities also leads to an increase in the overall OPEX, which is again not desirable in terms of potential economic savings.
This scenario also suggests that the optimal Maintenance Effort, from an economic point of view, is smaller than 1 (around 0.7). For this Maintenance Effort, mean OPEX is reduced by around 30% relative to the OPEX associated with a Maintenance Effort of 1. Even with the uncertainty range increasing for lower Maintenance Effort values, the maximum uncertainty range for a Maintenance Effort of 0.7 has a lower NOPEX than the mean values for Maintenance Efforts of 0.4 and 1.
Two of the main differences between the two models are the environmental considerations and the way in which uncertainties are considered. The DTOcean O&M Module requires a time series dataset for at least 1 year to define the waiting time and availability of each operation. The OPERA O&M Model assumes two seasons to characterise farm accessibility: summer and winter. Preventive operations are assigned for the summer months, while corrective operations are assigned for the winter months. These considerations result in shorter waiting times for preventive operations and are larger for corrective ones as they will occur during limited weather windows, which means that unexpected activities will always be the main driver of OPEX costs. The DTOcean O&M Module does not make this distinction; therefore, the corrective activities can occur anytime of the year.
Regarding the uncertainties, DTOcean has a realistic approach in determining the level of uncertainty within the results. For example, the STDV of OPEX is significant when corrective activities are taking place. This is not seen within the results from the OPERA O&M Model. On the other hand, the OPERA O&M Model is realistic when showing that higher Maintenance Efforts still have an amount of corrective activities, which is not shown within the results of the DTOcean O&M Module.

5. Conclusions and Recommendations

The impacts of O&M activities on ocean energy converter economics and their environmental and social impacts needs to be carefully considered and accounted for. This paper has presented and compared three approaches to estimating the influence of O&M activities on ocean energy converters. These approaches include: a Simplified Approach in which OPEX, installation and decommissioning costs are calculated as a percentage of IC figures; the OPERA O&M Model which models the influence of O&M activities and is calibrated with real sea data recorded through the OPERA project; and the DTOcean O&M Module which bases its calculations on detailed operator inputs and a vast database of information. Each of the approaches have their merits and drawbacks, depending on the stage of device development or the purpose of the calculation.
Gaining operational experience allows for more detailed calculation of metrics, which are important to calibrate LCOE and LCA models. This study shows that the Simplified Approach can lead to an overestimation of LCOE, due to an overestimation of the offshore costs. The Simplified Approach can lead to an under-estimation of the Carbon footprint due to an under-estimation of the fuel consumption during marine operations. The case study in this paper shows an overestimation of LCOE of 18% and an overestimation of OPEX of 60% when using a Simplified Approach. The use of a more sophisticated O&M model has allowed for an investigation of the optimum maintenance interval, whereas, on the Simplified Approach, this investigation is not possible. The Simplified Approach, for example, does not differentiate the OPEX costs that come from different types of activities (corrective and preventive) and therefore cannot assist in the development of the maintenance plan. The OPERA O&M Model and DTOcean O&M Module show that from an economic point of view, it is not desirable to have preventive interventions with intervals smaller than the MTTF of the components (Maintenance Efforts of 1.1). In addition to this, the DTOcean O&M Module shows that it is interesting to investigate a range of Maintenance Efforts slightly smaller than 1 to reduce OPEX and that increasing the maintenance interval could lead to a reduction of around 30% of the OPEX in this particular case study. The results of this work also suggest the importance in correctly assigning the MTTF of each component as this parameter has a direct impact on the maintenance plan in reducing the OPEX costs.
Although sophisticated O&M models, such as the OPERA O&M Model and the DTOcean O&M Module, are theoretically more accurate for determining values such as cost, downtime and fuel consumption, it should again be highlighted that their operation is only appropriate in certain scenarios. As previously discussed, a Simplified Approach is more appropriate for an early stage device for which little is known and no operational data is available. Further to this, the Simplified Approach is suitable for comparing different devices unless their operating principles are such that they seek to have a significantly optimised approach to O&M. The OPERA O&M Model approach is more appropriate for intermediate-stage devices for which operational data is available; however, and as discussed, the reliability and accuracy of such a modelling approach can only be validated with independent data sets. Further to this, O&M models calibrated with real sea data will be most suited to the devices for which they were calibrated, though some observations will be transferrable to other devices. The DTOcean O&M Module, or similar, is envisaged to be most appropriate for commercial technologies for which a high level of detail is known and which will be deployed in arrays. The DTOcean O&M Module designs O&M approaches to yield the most economic arrays which is necessary for a commercial industry to be successful.
The use of real sea data to calibrate an O&M model shows that there has been progress in the industry with the development of TRLs. However, there are still improvements that can be made within these models, as well as a great deal more learning to come from real sea operations.

Author Contributions

Conceptualization, T.B.T., D.C., E.M.L., L.v.V., J.L.M. and R.R.A.; methodology, T.B.T., D.C., E.M.L., H.J., J.L.M., R.R.A. and P.R.M.; software, T.B.T., D.C., E.M.L., and J.L.M.; validation, H.J., J.L.M., R.R.A. and P.R.M.; formal analysis, T.B.T., E.M.L., L.v.V. and J.L; investigation, T.B.T., L.v.V. and J.L.M.; data curation, T.B.T., D.C., E.M.L. and J.L.M.; writing—original draft preparation, T.B.T. and J.L.M.; writing—review and editing, E.M.L., J.L.M., R.R.A. and P.R.M.; visualization, R.R.A.; supervision, D.C., E.M.L., H.J., R.R.A. and P.R.M.; project administration, H.J. and P.R.M.; funding acquisition, H.J. and P.R.M. T.B.T. contributed to the creation of the OPERA global economic model and its integration with the OPEX model and led the development of the DTOcean O&M module, on the EnFAIT project. T.B.T. also developed the sensitivity assessment of both models: OPERA and DTOcean/EnFAIT and provided a detailed assessment of the O&M results. She compiled the results and wrote the paper. D.C. contributed to the creation of the OPERA global economic model, its integration with the OPEX model and assisted on the paper revision. E.M.L. contributed to the creation of the OPERA model, led the development of the DTOcean model, and developed a detailed revision and edition of the paper. L.v.V. provided a detailed assessment of the O&M results and assisted on the paper revision. H.J. contributed with the guidance and assessment of OPERA and EnFAIT projects. P.R.M., R.R.A. and J.L.M. developed the OPERA OPEX model and performed a general review of the results from models comparison.

Funding

The work presented in this paper was undertaken as part of two projects that have received funding from the European Union’s Horizon 2020 research and innovation program under grant agreement No. 654444 (OPERA project) and No. 745862 (EnFAIT project).

Acknowledgments

The authors are grateful to the European commission for funding the OPERA and EnFAIT projects as part of the Horizon 2020 framework. The authors also thankful to Oceantec-Idom for providing feedback to OPERA model’s inputs. A special thanks to Shona Pennock and Donald Noble for their diligent proofreading of this paper.

Conflicts of Interest

The authors declare no conflict of interest.

Abbreviations

ADCPAcoustic Doppler Current Profiler
AEPAnnual Energy Production
BiMEPBiscay Marine energy Platform
CAPEXCapital Expenditure
COECost of Energy
CWRCapture Width Ratio
DTOceanDesign Tool for Ocean Energy Arrays
EIAEnvironmental Impact Assessment
EMECEuropean Marine Energy Centre
EnFAITEnabling Future Arrays in Tidal
EPBTEnergy Pay Back in Time
ERAEnvironmental Risk Assessment
EROIEnergy Return of Investment
GWPGlobal Warming Potential
ICInitial Costs
IRRInternal Rate of Return
JEDIJobs and Economic Development Impacts
LCALife-Cycle Assessment
LCOELevelised Cost of Energy
Me Maintenance Effort
MTTFMean Time To Failure
NPVNet Present Value
OPERAOpen Sea Operating Experience to Reduce Wave Energy Cost
OPEXOperational Expenditure
O&MOperational and Maintenance
PTOPower Take-Off
RAMReliability Assessment Module
R&DResearch and Development
SCOESocial Cost of Energy
SEAStrategic Impact Assessment
STDVStandard Deviation
TICTotal Initial Costs
TRLTechnology Readiness Level

References

  1. Huckerby, J.; Jeffrey, H.; Sedgwick, J.; Jay, B.; Finlay, L. An International Vision for Ocean Energy, Version II; Ocean Energy Systems Implementing Agreement: France, Paris, 2012. [Google Scholar]
  2. Crooks, D.; de Andres, A.; Medina-Lopez, E.; Jeffrey, H. Demonstration of a Socio-economic Cost of Energy Analysis of a Wave Energy Converter Array; EWTEC: Cork, Ireland, 2017. [Google Scholar]
  3. Ocean Energy Forum. Ocean Energy Strategic Roadmap 2016, Building Ocean Energy for Europe. Available online: https://webgate.ec.europa.eu/maritimeforum/sites/maritimeforum/files/OceanEnergyForum_Roadmap_Online_Version_08Nov2016.pdf (accessed on 1 November 2016).
  4. Policy and Innovation Group. UK Ocean Energy Review; ETIPOCEAN: Edinburgh, UK, 2017. [Google Scholar]
  5. OPERA. Open Sea Operating Experience to Reduce Wave Energy Costs, European Commission Funded Project, Grant Agreement No 654444. 2016. Available online: www.opera-h2020.eu/ (accessed on 22 January 2019).
  6. European Commission. Available online: https://ec.europa.eu/programmes/horizon2020/en (accessed on 8 February 2019).
  7. de Andres, A.; Medina-Lopez, E.; Crooks, D.; Roberts, O.; Jeffrey, H. On the reversed LCOE calculation: Design constraints for wave energy commercialization. Int. J. Mar. Energy 2017, 18, 88–108. [Google Scholar] [CrossRef]
  8. Wave Energy Scotland. Structural Materials and Manufacturing Processes; Scotland government: Edinburgh, UK, 2016.
  9. Michael-Welte, T.; Bakken-Sperstad, I.; Høegh-Sørum, E.; Lorentzen-Kolstad, M. Integration of Degradation Processes in a Strategic Offshore Wind Farm O&M Simulation Model. Energies 2017, 10, 925. [Google Scholar] [Green Version]
  10. Merizalde, Y.; Hernández-Callejo, L.; Duque-Perez, O.; Alonso-Gómez, V. Maintenance Models Applied to Wind Turbines. Energies 2019, 12, 225. [Google Scholar] [CrossRef]
  11. Sønderkær-Nielsen, J.; Dalsgaard-Sør, J. Methods for Risk-Based Planning of O&M of Wind Turbines. Energies 2014, 7, 6645–6664. [Google Scholar] [Green Version]
  12. Gray, A. O&M Simulation Tool—USER Guide; Wave Energy Scotland: Scotland, UK, 2017.
  13. Oceantec. 2017. Available online: http://www.oceantecenergy.com/ (accessed on 7 November 2018).
  14. Idom. 2019. Available online: https://www.idom.com/ (accessed on 8 February 2019).
  15. OPERA. Deliverable D7.2, Operating Data Input for Models of Levelised And Society Cost and Life Cycle Assessment for Wave Energy; University of Edinburgh: Edinburgh, UK, 2017. [Google Scholar]
  16. Natural Resources Canada. RETScreen 4.0. 2019. Available online: http://retscreen.software.informer.com/4.0/ (accessed on 7 July 2017).
  17. Dalton, G. Navitas Techno-economic software for ocean renewable energy. Available online: https://slideplayer.com/slide/6632399/ (accessed on 8 July 2017).
  18. Wave Venture TE. Available online: http://www.wave-venture.com/software/ (accessed on 7 July 2017).
  19. Chozas, J.F.; Kofoed, J.P.; Jensen, N.E.H. User Guide—COE Calculation Tool for Wave Energy Converters; Ver. 1.6.; Aalborg University: Aalborg, Denmark, 2014. [Google Scholar]
  20. Iberdrola Engineering & Construction. Iberdrola Engineering Heads Up The Uhindar Project, Which Aims to Develop a New System for the Generation of Wave Energy. 2012. Available online: http://www.iberdrolaingenieria.com/ibding/noticias.do?op=det&id=147 (accessed on 8 July 2017).
  21. Greendelta. OpenLCA. 2018. Available online: http://www.openlca.org/ (accessed on 8 July 2017).
  22. Siemens. Scoe—Society’s Costs Of Electricity: How Society Should Find Its Optimal Energy Mix; Siemens: Munich, Germany, 2014. [Google Scholar]
  23. NREL. JEDI Marine and Hydrokinetic Model: User Reference Guide; National Renewable Energy Laboratory: Gordon, CO, USA, 2011.
  24. Department of Energy and Climate Change (DECC). Future Leasing for Offshore Wind Farms and Licensing for Offshore Oil & Gas and Gas Storage; UK Offshore Energy Strategic Environmental Assessment. DECC: London, UK, 2009.
  25. New Brunswick Department of Energy. Bay of Fundy Ecosystem Partnership’s Strategic Environmental Assessment; New Brunswick Joint Response: Fredericton, NB, Canada, 2009.
  26. U. S. Department of Energy (DOE). Report to Congress on the Potential Environmental Effects of Marine and Hydrokinetic Energy Technologies; Wind and Hydropower Technologies Program; Energy Efficiency and Renewable Work; U.S. Department of Energy: Washington, DC, USA, 2009.
  27. EquiMar. Equitable Testing and Evaluation of Marine Energy Extraction Devices in Terms of Performance, Cost and Environmental Impacts; D6.2.2—Scientific Guidelines on Environmental Assessment; European Union’s FP7/2007–2013 under Grant Agreement No. FP721338. Available online: https://tethys.pnnl.gov/sites/default/files/publications/EquiMar_D6.2.2.pdf (accessed on 1 December 2010).
  28. The Life Cycle Inventory Data Version V2.1; Ecoinvent: Zurich, Switzerland, 2009.
  29. James Fisher Marine Services. Mojo Mermaid. 2015. Available online: http://mojomermaid.com/ (accessed on 7 July 2017).
  30. Asgarpour, M.; van de Pieterman, R. O&M Cost Reduction of Offshore Wind Farms—A Novel Case Study; ECN: The Hague, The Netherlands, 2014. [Google Scholar]
  31. Maples, B.; Saur, G.; Hand, M.; van de Pietermen, R. Installation, Operation, and Maintenance Strategies to Reduce the Cost of Offshore Wind Energy; National Renewable Energy Laboratory 2 Energy Research Centre of the Netherlands: Petten, The Netherlands, 2013. [Google Scholar]
  32. Douard, F. A probabilistic approach to introduce risk measurement indicators to an offshore wind project evaluation—Improvement to an existing tool ecume. Energy Procedia 2012, 24, 255–262. [Google Scholar] [CrossRef]
  33. OutSmart. 2019. Available online: http://out-smart.eu/ (accessed on 26 April 2017).
  34. DTOcean Project, Optimal Design Tools for Ocean Energy Arrays, European Commission Funded Project, Grant Agreement No 60859. 2015. Available online: http://www.dtocean.eu/ (accessed on 11 February 2019).
  35. Endrerud, E.O.; Liyanage, J.P.; Keseric, N. Marine Logstics Decision Support for Operation and Maintenance of Offshore Wind Parks with A Multi Method Simulation Model; IEEE: Georgia, GA, USA, 2014. [Google Scholar]
  36. Drori, G. Underlying Causes of Mooring Lines Failures Across the Industry; BP: London, UK, 2015. [Google Scholar]
  37. ISO. ISO 14224: Petroleum, Petrochemical and Natural Gas Industries—Collection and Exchange of Reliability and Maintenance Data for Equipment; BSI Standards Limited: London, UK, 2006. [Google Scholar]
  38. BiMEP. Available online: https://bimep.com/pages/bimep (accessed on 1 November 2018).
  39. EMEC. Available online: https://emec.org.uk/ (accessed on 1 November 2018).
  40. O’Connor, M.; Lewis, T.; Dalton, G. Techno-Economic performance of the Pelamis P1 and Wavestar at different ratings and various locations in Europe. Renew. Energy 2012, 50, 889–900. [Google Scholar] [CrossRef]
  41. Guanche, R.; de Andrés, A.D.; Simal, P.D.; Vidal, C. Uncertainty analysis of wave energy farms financial indicators. Renew. Energy 2014, 68, 570–580. [Google Scholar] [CrossRef]
  42. O’Connor, M.; Lewis, T.; Dalton, G. Operational expenditure costs for wave energy projects and impacts on financial returns. Renew. Energy 2013, 50, 1119–1131. [Google Scholar] [CrossRef] [Green Version]
  43. Myhr, A.; Bjerkseter, C.; Ågotnes, A. Levelised cost of energy for offshore floating wind turbines in a life cycle perspective. Renew. Energy 2013, 66, 714–728. [Google Scholar] [CrossRef]
  44. DTOcean. DTOcean User Manual. 2016. Available online: https://setis.ec.europa.eu/dt-ocean/ (accessed on 12 March 2019).
  45. DTOcean. DTOcean Technical Manual. 2016. Available online: https://setis.ec.europa.eu/dt-ocean/ (accessed on 12 March 2019).
  46. DTOceanPlus Project, DTOcean+, European Union’s Horizon 2020 Research and Innovation Programme under Grant Agreement n° 785921. 2018. Available online: https://www.dtoceanplus.eu (accessed on 8 February 2019).
  47. Nova Innovation. 2018. Available online: https://www.novainnovation.com/ (accessed on 13 February 2018).
  48. EnFAIT. Enabling Future Arrays in Tidal, European Commission Funded Project, Grant Agreement No 745862. 2017. Available online: www.enfait.eu/ (accessed on 6 February 2019).
  49. Thomson, R.; Harrison, G.; Chick, J. Full Life Cycle Assessment of a Wave Energy Converter. In Proceedings of the Renewable Power Generation 2011, Edinburgh, UK, 6–8 September 2011. [Google Scholar]
  50. Douglas, A.C.; Harrison, G.P.; Chick, J.P. Life cycle assessment of the Seagen marine current turbine. Proc. Inst. Mech. Eng. Part M J. Eng. Marit. Environ. 2008, 222, 1–12. [Google Scholar] [CrossRef] [Green Version]
  51. Dalton, G.; Madden, D.; Daly, M.C. Life Cycle Assessment of the Wavestar. In Proceedings of the 9th International Conference on Ecological Vehicles and Renewable Energies, EVER, Monte-Carlo, Monaco, 25–27 March 2014. [Google Scholar]
Figure 1. Relationship between expected O&M costs and Maintenance Effort. Green line show that expected failure costs reduce with the Maintenance Effort, whereas the blue line shows that the maintenance costs increase with the rise of Maintenance Effort. The sign (x) shows the optimal strategy point when the total costs are minimum [11].
Energies 12 02475 g001
Figure 2. OPEX model architecture.
Energies 12 02475 g002
Figure 3. Maintenance actions of OPERA O&M Model [37].
Energies 12 02475 g003
Figure 4. MARMOK-A-5 device. Device deployed at BiMEP (left-side) and device’s main components (right-side).
Energies 12 02475 g004
Figure 5. Maintenance strategy of DTOcean [45].
Energies 12 02475 g005
Figure 6. Handling of automated inspection in case of condition-based maintenance [44].
Energies 12 02475 g006
Figure 7. (a): Array of Three Turbines and bathymetry of the lease area; (b): Nova M100 tidal turbine.
Energies 12 02475 g007
Figure 8. Normalised LCOE for the OPERA O&M Model and Simplified Approach. Error bars show the uncertainty range between results.
Energies 12 02475 g008
Figure 9. Normalised OPEX, installation and decommissioning costs calculated using the OPERA O&M Model and the Simplified Approach.
Energies 12 02475 g009
Figure 10. Variation of the number of operations a year for the OPERA O&M Model. Graph shows the number of preventive and corrective activities, as well as the total number of operations for the Array of 18 MW (72 devices).
Energies 12 02475 g010
Figure 11. Normalised OPEX (NOPEX) for different Maintenance Efforts (Me) for the OPERA O&M Model, presented in (upper) line graph and (lower) bar graph. Error bar shows the uncertainty range between results with a probability of 68% of the results.
Energies 12 02475 g011
Figure 12. Normalised OPEX (NOPEX) for different Maintenance Efforts (Me) calculated by the DTOcean O&M Module case study. Error bars shows the uncertainty range between results with a probability of 68% of the results.
Energies 12 02475 g012
Table 1. The three case studies and the difference in their considerations.
Case StudyScenarioO&M ValuesArray SizeTechnology
OPERA Simplified ApproachOPERASimplified representationSingle DeviceWave
OPERA O&M ModelOPERAReal sea dataSingle DeviceWave
DTOcean O&M ModuleEnFAITReal sea dataArray of three devicesTidal
Table 2. Description of Input Parameters.
Name of VariableDescription
Item ref no.Item name
Item detailsDetail of the element, e.g., component or overall element (device; moorings and anchors; electrical equipment)
Planned operation (1/years)Value between 0–1. Periodicity of interventions in a year (1/year). There is no standardized way for defining a failure in the wind/wave energy industry. This analysis defines a failure as a visit to a turbine.
Uncertainty levelProbability of deviating from the average failure rate (1–4)
Mean time between failures (1/ years)Average time between failures (1/year)
CategoryThree categories are typical for failure rates definition: Incipient, Critical, Degradation.
Failure modeThe manner in which an equipment or machine failure can occur. An example of a failure mode is corrosion, which might cause metal degradation and failure
Failure effect on the power production (0%–100%)Impact of failure on energy production (0–1)
Action neededDescription of the intervention
Est. duration (hours)Required duration time for action, excluding travel time
LocationOnsite or port maintenance
VesselsName of Vessel 1 required
Vessel aux 1Name of Vessel 2 required
Vessel aux 2Name of Vessel 3 required
EquipmentNecessary additional equipment for the repair
Equipment cost (€/h)Equipment cost
PersonnelAdditional personnel description
Personnel cost (€/h)Hourly personnel cost
Parts/consumablesDescription of materials needed
Parts/consumables cost (€)Material cost
Hs(m)Maximum operational wave height
Towing required Yes vs NO
Mounting time (h)If one operation needs to be completed at port. Mounting and dis-mounting time of the element is considered
N operationsNumber of operations of this type in a farm
Preparation Time (h)Previous working time at port
Table 3. The table shows the cost relationship of the OPERA O&M Model. This table also plots the values often used in simplified approaches.
CaseSiteRated Power (MW)Installation Costs as % of TICEX as % of CAPEXDecommissioning Costs as % of Installation Costs
OPERA O&M ModelEMEC0.2530%3.7%89%
1027%3.3%89%
1826%3.1%89%
BiMEP0.2522%3.7%88%
1021%3.3%88%
1821%3.1%88%
Simplified Approach--33%5%80%

