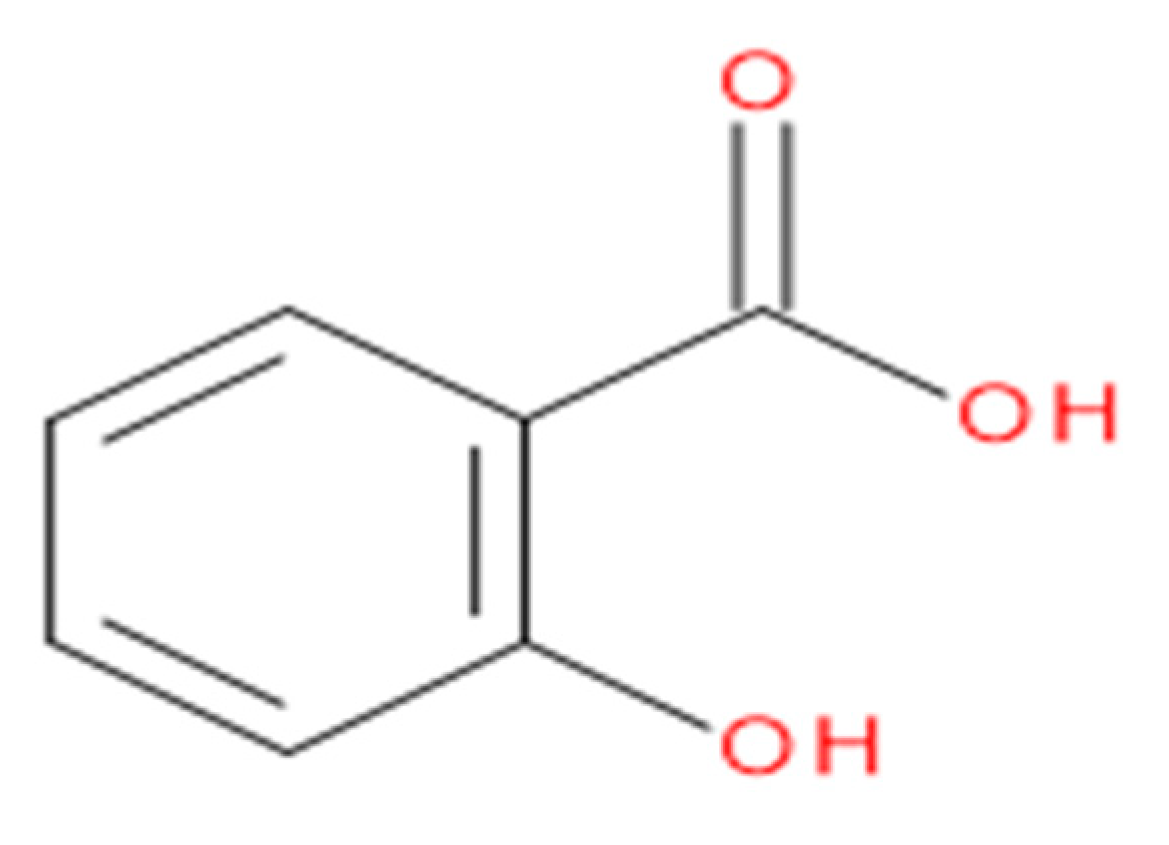
Validation of an HPLC Method for the Simultaneous Quantification of Metabolic Reaction Products Catalysed by CYP2E1 Enzyme Activity: Inhibitory Effect of Cytochrome P450 Enzyme CYP2E1 by Salicylic Acid in Rat Liver Microsomes
Abstract
:1. Introduction
2. Results and Discussion
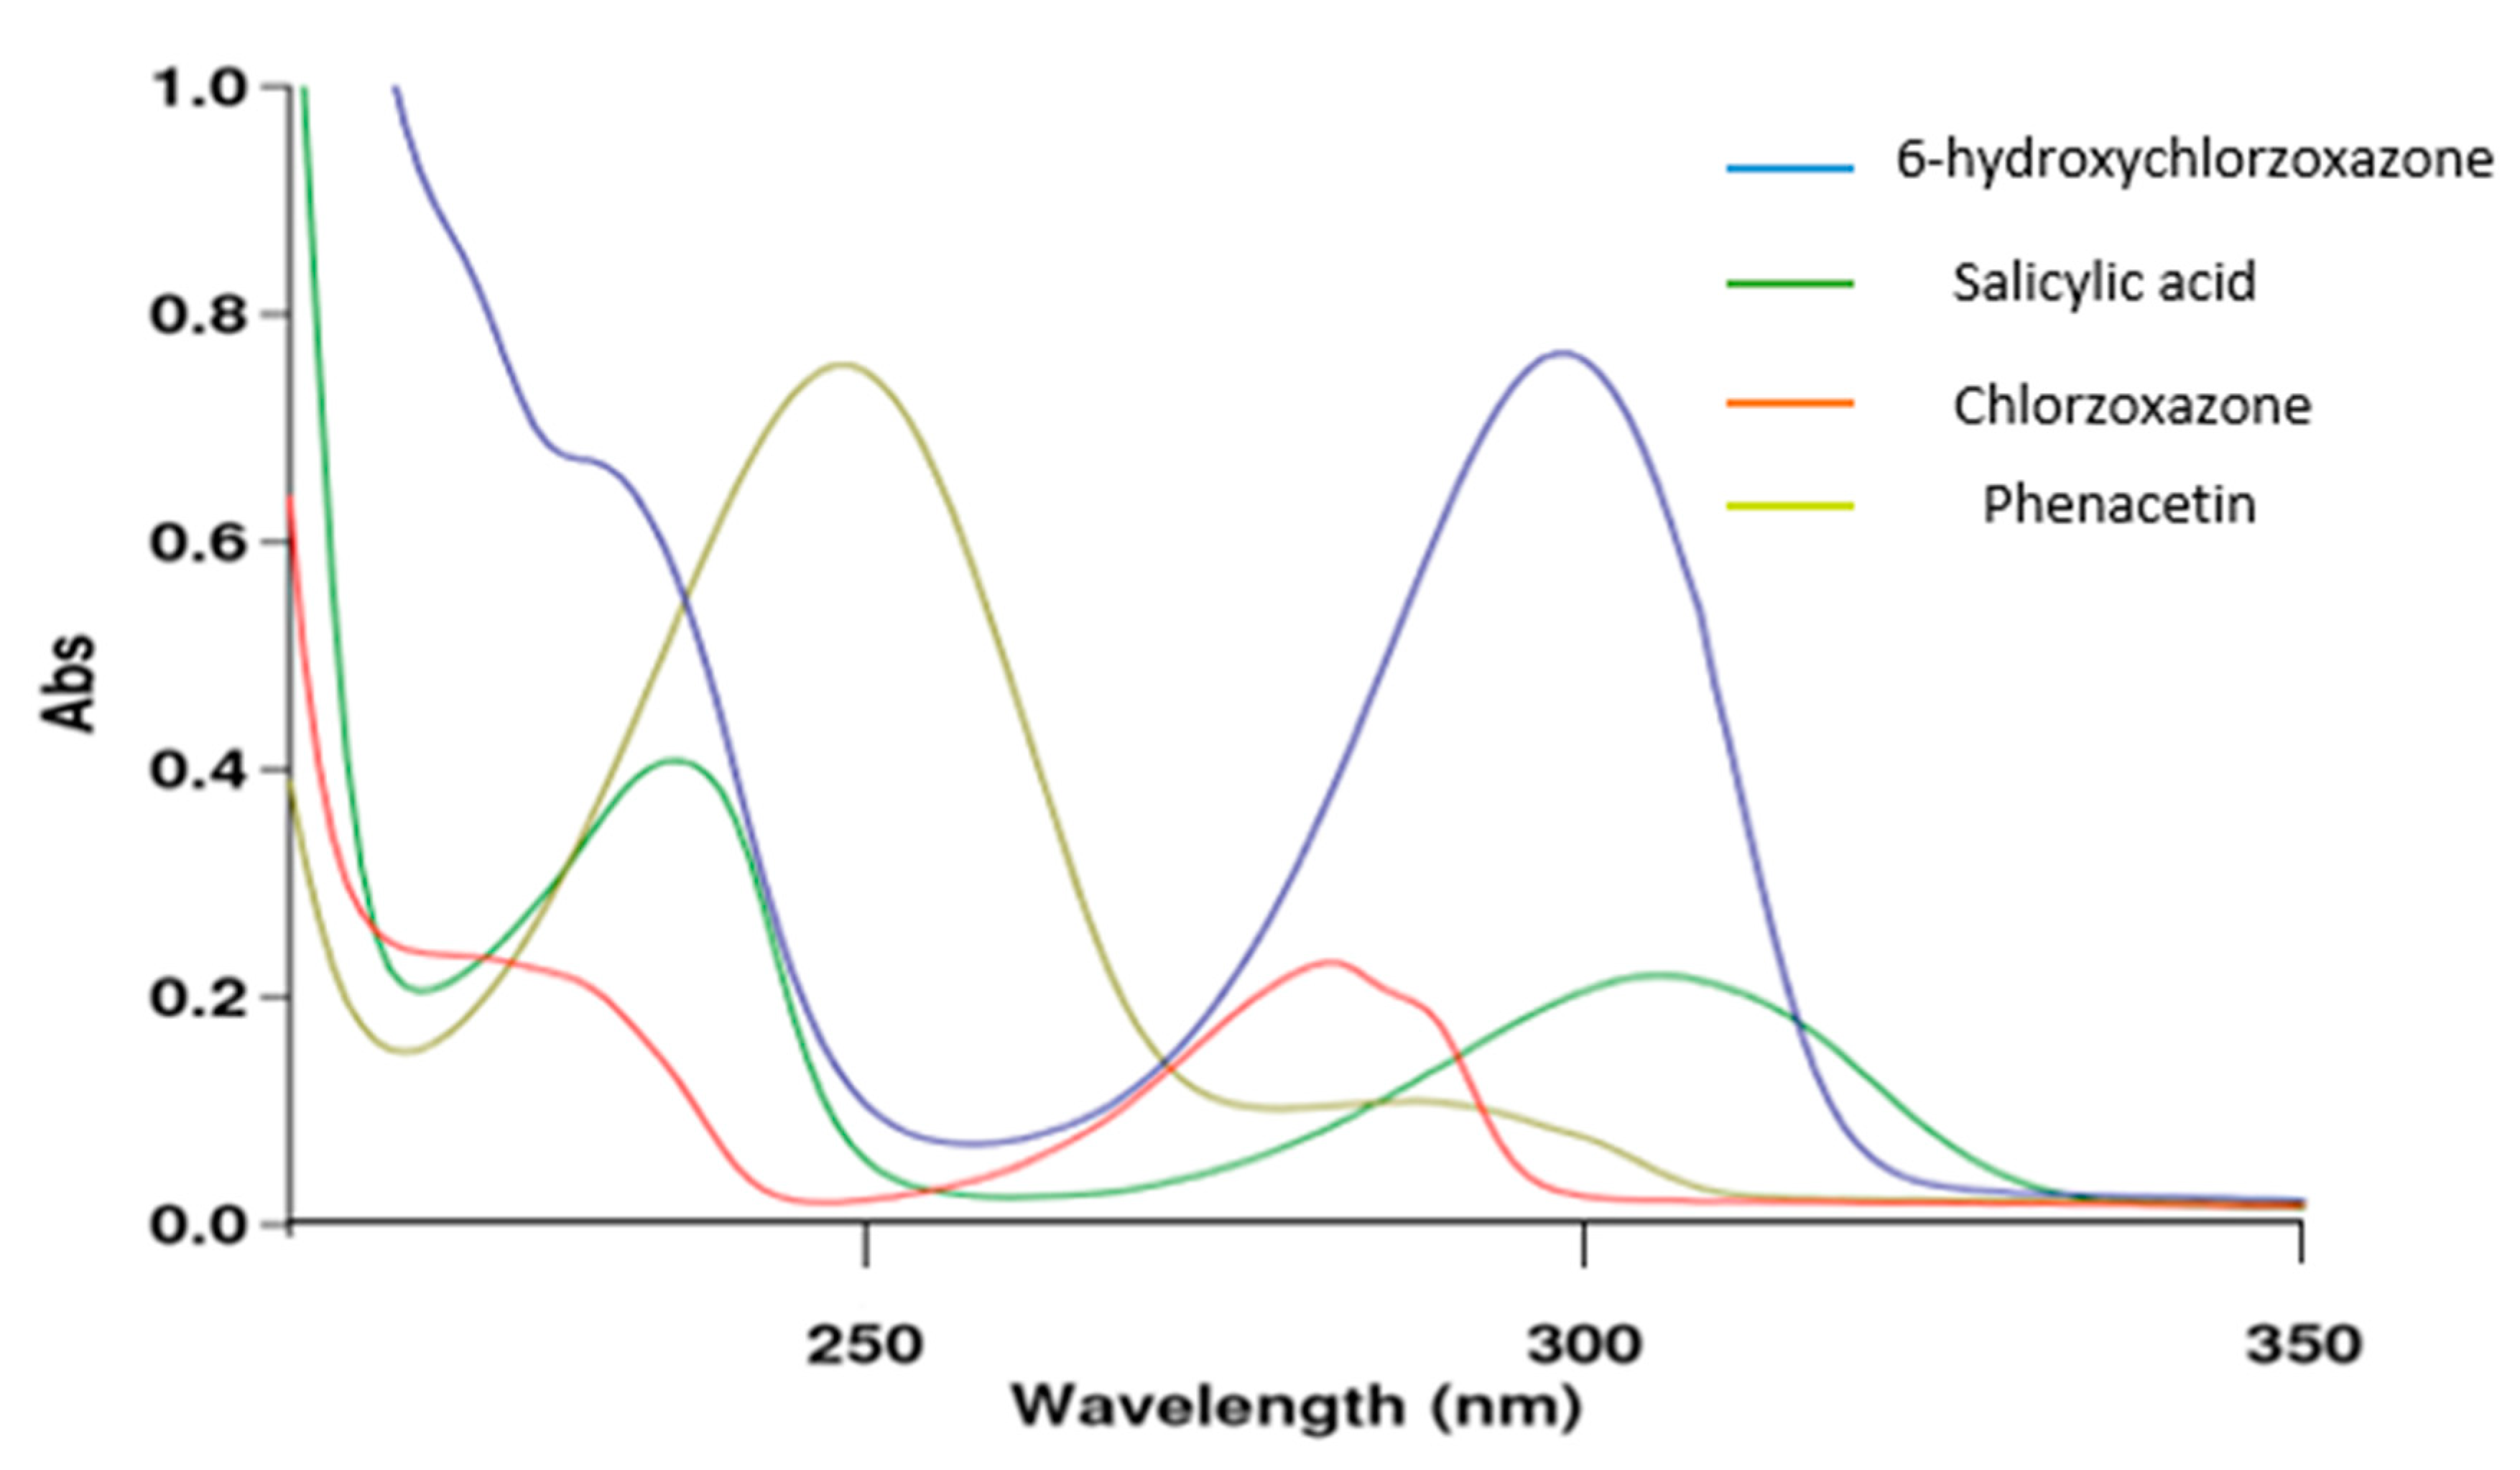
2.1. Selection of Analytical Wavelength: UV-VIS SPECTROSCOPY (CYP2E1 Assay)
2.2. Method Development (CYP2E1 Assay):
2.3. Validation of the Analytical Chromatographic Method (CYP2E1 Assay):
2.3.1. Specificity and Selectivity
2.3.2. Linearity and Range
2.3.3. Limit of Detection and Limit of Quantitation (LOD and LOQ)
2.3.4. Precision
Intra-assay Variation of Chlorzoxazone
Intra-Assay Variation of 6-hydroxychlorzoxazone Metabolite
Inter-Assay Variation of Chlorzoxazone
Inter-Assay Variation of 6-Hydroxychlorzoxazone
2.3.5. Stability Test
Stability Test for Chlorzoxazone
Stability Test for 6-hydroxychlorzoxazone
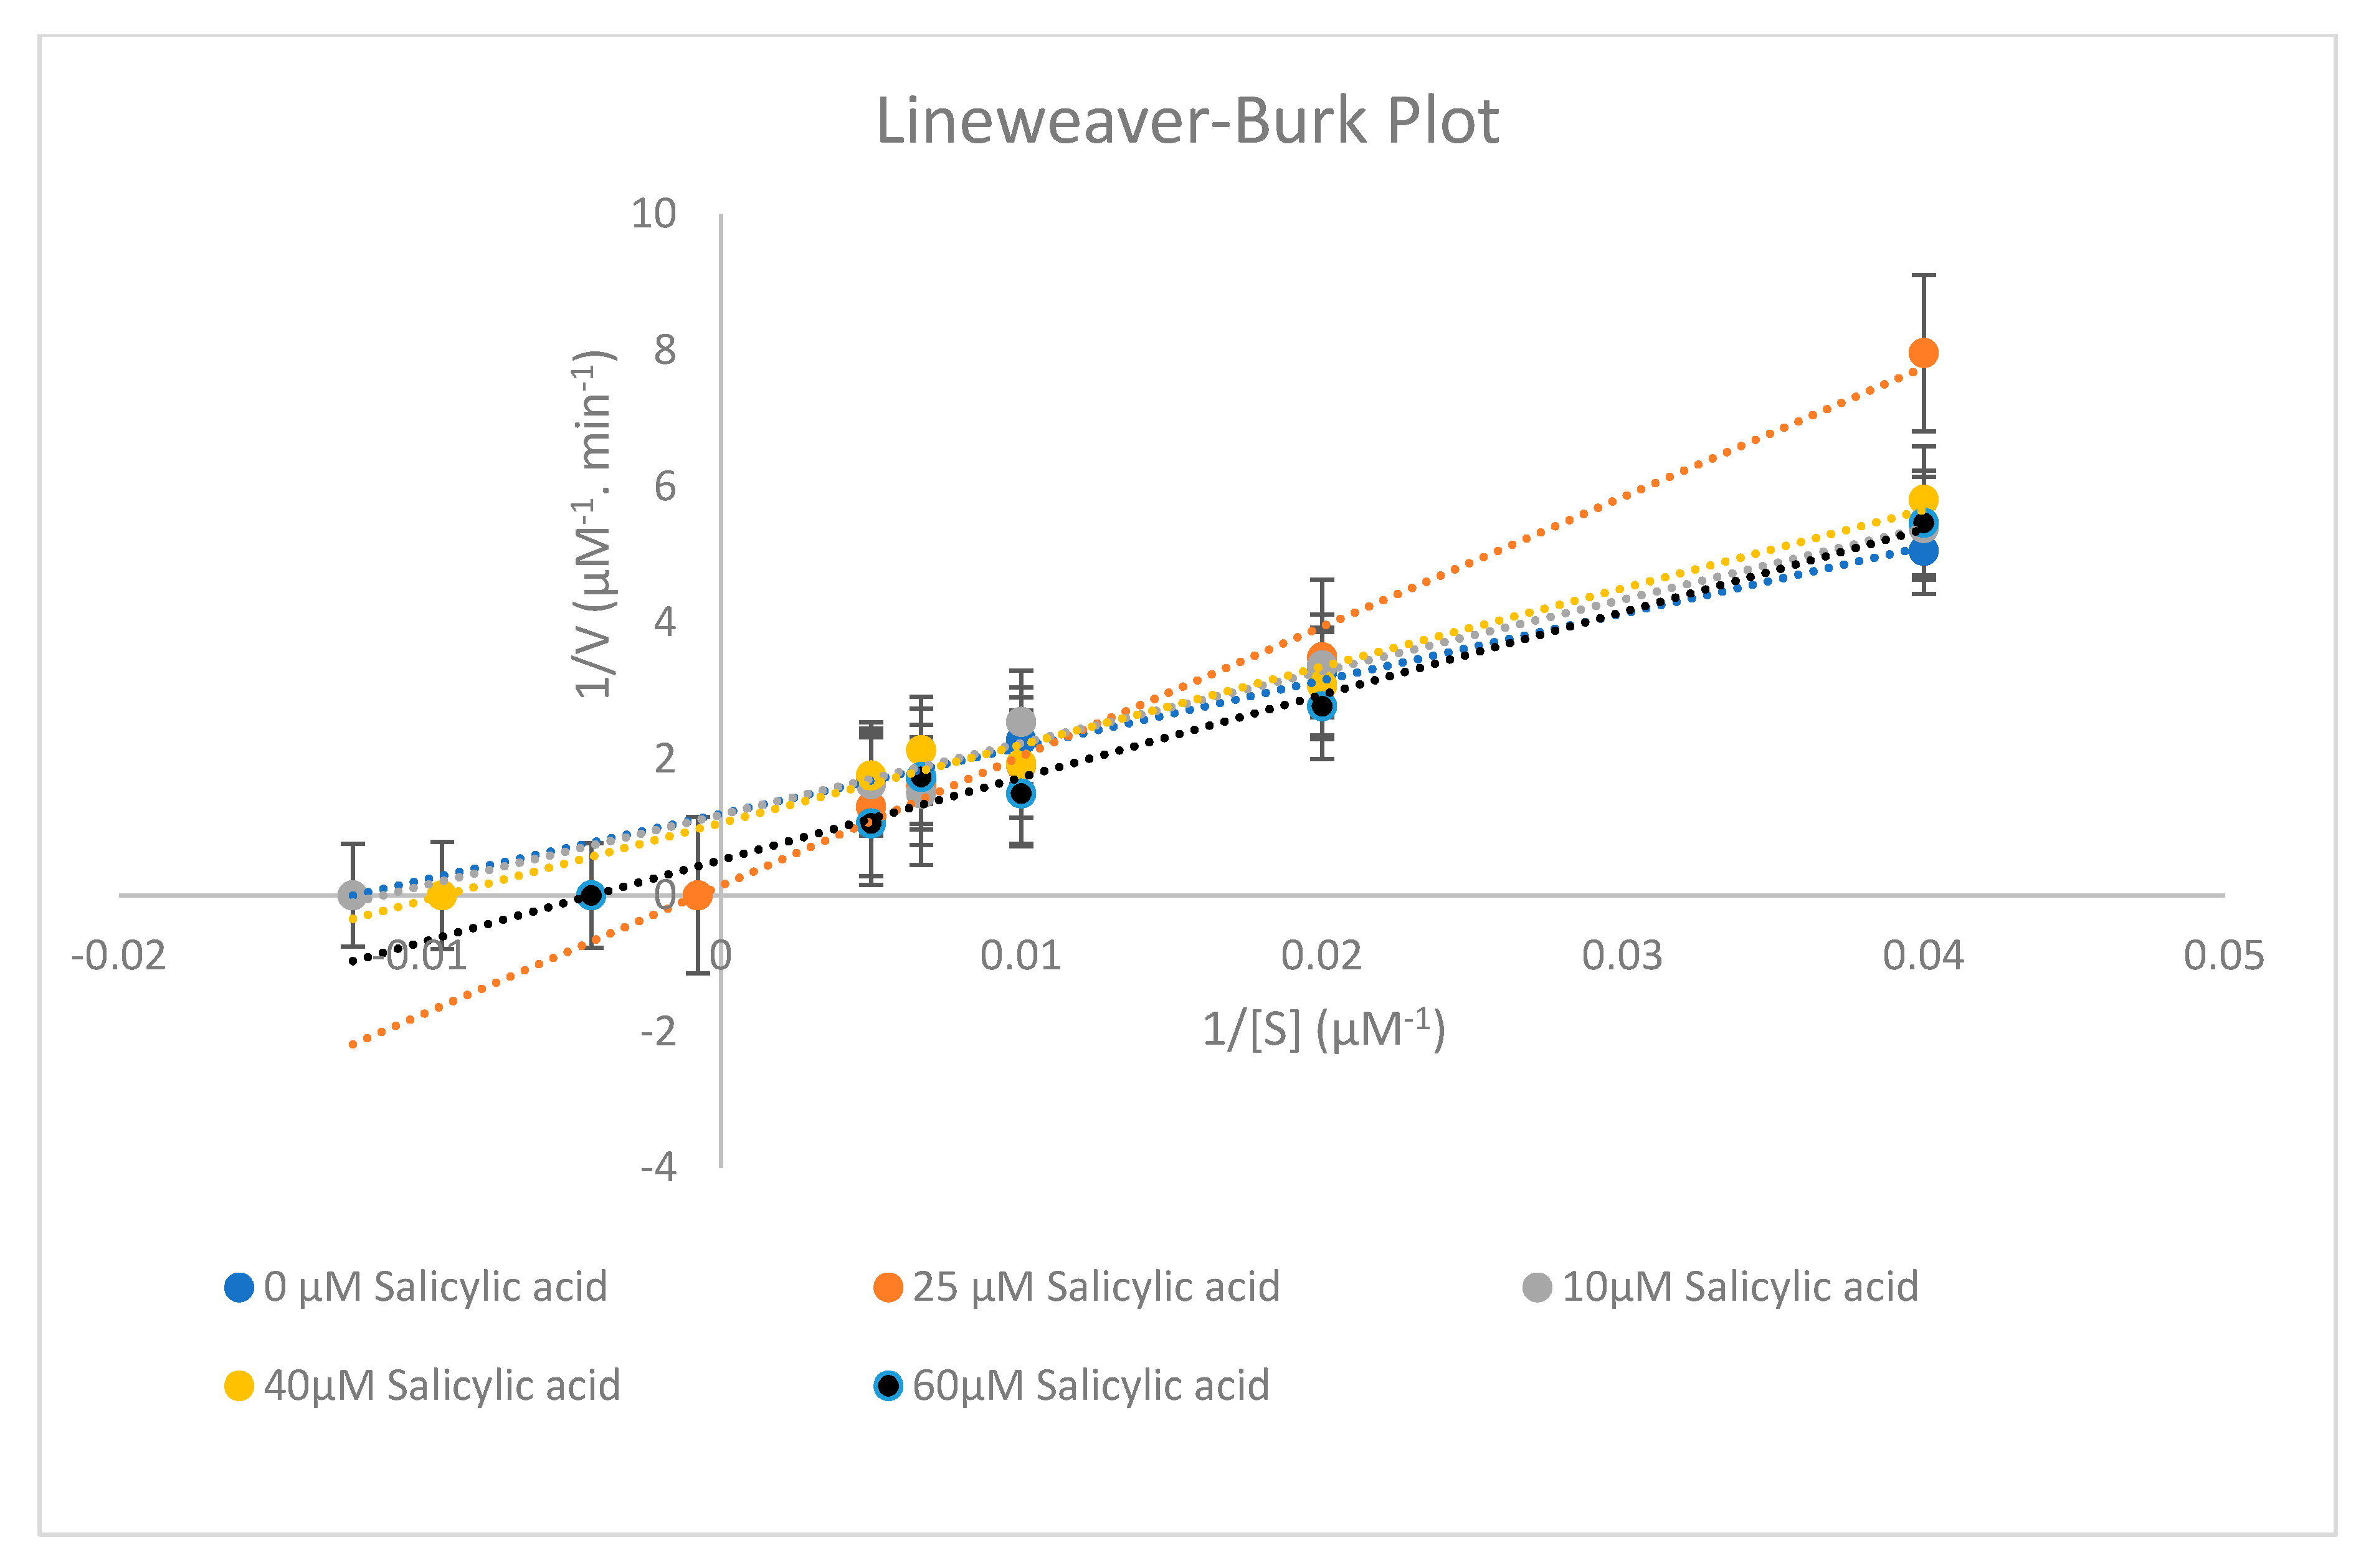
2.4. Effect of Salicylic acid on CYP2E1 Enzyme Activity
3. Materials and Methods
3.1. Chemicals and Reagents
3.2. Rat Liver Microsomes
3.3. Instruments
3.4. CYP450 Assay
3.4.1. CYP2E1 Substrate and its Metabolite
3.4.2. Inhibition of CYP2E1 Enzymatic Activity Assay
3.5. Selection of Analytical Wavelength:
CYP2E1 Assay
3.6. Preparation of Mobile Phase:
CYP2E1 Assay
3.7. Preparation of Standard and Sample Solutions
Analytes and Metabolite Standard Solution Preparation
3.8. Data Analysis:
4. Conclusions
Author Contributions
Funding
Acknowledgments
Conflicts of Interest
Appendix A. Robustness Testing:
A.1. Changing the Composition of Mobile Phase:
| Mobile Phase composition | Compounds present in the sample | Average Retention time (min) | Average Area peak (Mean ± Std) | Resolution |
|---|---|---|---|---|
| Isocratic elution mode (60% H2O + 25% Acetonitrile + 15% Methanol) | Salicylic acid (100 µM) | 3.425 | 153201.667 ± 0.1842 | Better resolution obtained between four components. |
| Phenacetin (50 µM) | 7.7476 | 12049.667 ± 1.1991 | ||
| Chlorzoxazone (200 µM) | 10.802 | 252134 ± 0.0332 | ||
| 6-hydroxy chlorzoxazone (50 µM) | 5.2433 | 32907.333 ± 0.5274 | ||
| Isocratic elution mode (50% H2O + 25% Acetonitrile + 25% Methanol) | Salicylic acid (100 µM) | 2.8243 | 153450.667 ± 0.4506 | Good resolution obtained between four components. |
| Phenacetin (50 µM) | 6.06866 | 12689 ± 0.558 | ||
| Chlorzoxazone (200 µM) | 7.57233 | 255454.667 ± 0.071 | ||
| 6-hydroxy chlorzoxazone (50 µM) | 4.57033 | 31590.3333 ± 1.837 |
| Mobile Phase composition | Compounds present in the sample | Average Retention time (min) | Average Area peak (Mean ± Std) | Resolution |
|---|---|---|---|---|
| Isocratic elution mode (60% H2O + 25% Acetonitrile + 15% Methanol) | Salicylic acid (100 µM) | 3.425 | 153201.667 ± 0.1842 | Good resolution obtained between four components. |
| Phenacetin (50 µM) | 7.7476 | 12049.667 ± 1.1991 | ||
| Chlorzoxazone (200 µM) | 10.802 | 252134 ± 0.0332 | ||
| 6-hydroxy chlorzoxazone (50 µM) | 5.2433 | 32907.333 ± 0.5274 | ||
| Isocratic elution mode (50% H2O + 35% Acetonitrile + 15% Methanol) | Salicylic acid (100 µM) | 2.763 | 151841 ± 0.0609 | Bad resolution obtained between Chlorzoxazone and Phenacetin peaks. |
| Phenacetin (50 µM) | 5.54 | 12819.667 ± 1.3304 | ||
| Chlorzoxazone (200 µM) | 6.3603 | 2553360 ± 0.1121 | ||
| 6-hydroxy chlorzoxazone (50 µM) | 4.282 | 28947.3333 ± 0.6372 |
A.2. Changing the Flow Rate:
| Mobile Phase composition | Compounds present in the sample | Average Retention time (min) | Average Area peak (Mean ± Std) | Resolution |
|---|---|---|---|---|
| Isocratic elution mode (60% H2O + 25% Acetonitrile + 15% Methanol) Flow rate = 0.7 mL/min | Salicylic acid (100 µM) | 3.425 | 153201.667 ± 0.1842 | Better resolution obtained between four components. (Difference between Phenacetin and Chlorzoxazone peaks = 3.0544 min) |
| Phenacetin (50 µM) | 7.7476 | 12049.667 ± 1.1991 | ||
| Chlorzoxazone (200 µM) | 10.802 | 252134 ± 0.0332 | ||
| 6-hydroxy chlorzoxazone (50 µM) | 5.2433 | 32907.333 ± 0.5274 | ||
| Isocratic elution mode (60% H2O+ 25% Acetonitrile + 15% Methanol) Flow rate= 0.9 mL/min | Salicylic acid (100 µM) | 2.67966 | 118659.667 ± 0.1625 | Good resolution obtained between four components. (Difference between Phenacetin and Chlorzoxazone peaks = 2.2923 min) |
| Phenacetin (50 µM) | 5.9703 | 9467.333 ± 0.7220 | ||
| Chlorzoxazone (200 µM) | 8.2626 | 196024.667 ± 0.1079 | ||
| 6-hydroxy chlorzoxazone (50 µM) | 4.0373 | 25901.333 ± 0.1912 |
| Mobile Phase composition | Compounds present in the sample | Average Retention time (min) | Average Area peak (Mean ± Std) | Resolution |
|---|---|---|---|---|
| Isocratic elution mode (60% H2O + 25% Acetonitrile + 15% Methanol) Flow rate = 0.7 mL/min | Salicylic acid (100 µM) | 3.425 | 153201.667 ± 0.1842 | Better resolution obtained between four components. (Difference between Salicylic acid and 6-hydroxychlorzoxazone peaks = 1.8183 min) |
| Phenacetin (50 µM) | 7.7476 | 12049.667 ± 1.1991 | ||
| Chlorzoxazone (200 µM) | 10.802 | 252134 ± 0.0332 | ||
| 6-hydroxy chlorzoxazone(50 µM) | 5.2433 | 32907.333 ± 0.5274 | ||
| Isocratic elution mode (60% H2O + 25% Acetonitrile + 15% Methanol) Flow rate = 0.5 mL/min | Salicylic acid (100 µM) | 3.581333 | 213906.667 ± 0.1896 | Good resolution obtained between four components. (Difference between Salicylic acid and 6-hydroxychlorzoxazone peaks = 1.2323 min) |
| Phenacetin (50 µM) | 10.6126 | 17133.333 ± 1.500 | ||
| Chlorzoxazone (200 µM) | 7.6806 | 354948.33 ± 0.358 | ||
| 6-hydroxy chlorzoxazone (50 µM) | 4.81366 | 25470.333 ± 2.229 |
A.3. Changing the Column Temperature:
| Mobile Phase composition | Compounds present in the sample | Average Retention time (min) | Average Area peak (Mean ± Std) | Resolution |
|---|---|---|---|---|
| Isocratic elution mode (60% H2O + 25% Acetonitrile + 15% Methanol) T = 25 °C | Salicylic acid (100 µM) | 3.425 | 153201.667 ± 0.1842 | Better resolution obtained between four components. (Difference between Phenacetin and chlorzoxazone peaks = 3.0544 min) |
| Phenacetin (50 µM) | 7.7476 | 12049.667 ± 1.1991 | ||
| Chlorzoxazone (200 µM) | 10.802 | 252134 ± 0.0332 | ||
| 6-hydroxy chlorzoxazone(50 µM) | 5.2433 | 32907.333 ± 0.5274 | ||
| Isocratic elution mode (60% H2O + 25% Acetonitrile + 15% Methanol) T = 30 °C | Salicylic acid (100 µM) | 3.463 | 153602 ± 0.2202 | Good resolution obtained between four components. (Difference between Phenacetin and chlorzoxazone peaks = 2.18 min) |
| Phenacetin (50 µM) | 7.442 | 12399 ± 0.7587 | ||
| Chlorzoxazone (200 µM) | 10.06 | 253038 ± 0.0452 | ||
| 6-hydroxy chlorzoxazone (50 µM) | 5.008 | 33648 ± 0.6316 |
| Mobile Phase composition | Compounds present in the sample | Average Retention time (min) | Average Area peak (Mean ± Std) | Resolution |
|---|---|---|---|---|
| Isocratic elution mode (60% H2O + 25% Acetonitrile + 15% Methanol) T = 25 °C | Salicylic acid (100 µM) | 3.425 | 153201.667 ± 0.1842 | Better resolution obtained between four components. (Difference between Phenacetin and chlorzoxazone peaks = 3.0544 min) |
| Phenacetin (50 µM) | 7.7476 | 12049.667 ± 1.1991 | ||
| Chlorzoxazone (200 µM) | 10.802 | 252134 ± 0.0332 | ||
| 6-hydroxy chlorzoxazone (50 µM) | 5.2433 | 32907.333 ± 0.5274 | ||
| Isocratic elution mode (60% H2O + 25% Acetonitrile + 15% Methanol) T = 35 °C | Salicylic acid (100 µM) | 3.44933 | 154084.333 ± 0.1215 | Good resolution obtained between four components. (Difference between Phenacetin and chlorzoxazone peaks = 2.309 min) |
| Phenacetin (50 µM) | 7.199 | 12341.6667 ± 0.5906 | ||
| Chlorzoxazone (200 µM) | 9.508 | 253184 ± 0.0691 | ||
| 6-hydroxy chlorzoxazone (50 µM) | 4.9353 | 34170 ± 0.8637 |
References
- Sun, M.; Tang, Y.; Ding, T.; Liu, M.; Wang, X. Inhibitory effects of celastrol on rat liver cytochrome P450 1A2, 2C11, 2D6, 2E1 and 3A2 activity. Fitoterapia 2014, 92, 1–8. [Google Scholar] [CrossRef]
- Wang, Y.; Wu, S.; Chen, Z.; Zhang, H.; Zhao, W. Inhibitory effects of cytochrome P450 enzymes CYP1A2, CYP2A6, CYP2E1 and CYP3A4 by extracts and alkaloids of Gelsemium elegans roots. J. Ethnopharmacol. 2015, 166, 66–73. [Google Scholar] [CrossRef]
- Badyal, D.K.; Dadhich, A.P. Cytochrome P450 and drug interactions. Indian J. Pharmacol. 2001, 33, 248–259. [Google Scholar]
- Dumbreck, S.; Flynn, A.; Nairn, M.; Wilson, M.; Treweek, S.; Mercer, S.W.; Alderson, P.; Thompson, A.; Payne, K.; Guthrie, B. Drug-disease and drug-drug interactions: Systematic examination of recommendations in 12 UK national clinical guidelines. BMJ 2015, 350, 1–8. [Google Scholar] [CrossRef] [PubMed] [Green Version]
- Takeda, T.; Hao, M.; Cheng, T.; Bryant, S.H.; Wang, Y. Predicting drug-drug interactions through drug structural similarities and interaction networks incorporating pharmacokinetics and pharmacodynamics knowledge. J. Cheminform. 2017, 9, 1–9. [Google Scholar] [CrossRef] [PubMed] [Green Version]
- Murtaza, G.; Khan, M.Y.G.; Azhar, S.; Khan, S.A.; Khan, T.M. Assessment of potential drug-drug interactions and its associated factors in the hospitalized cardiac patients. Saudi Pharm. J. 2016, 24, 220–225. [Google Scholar] [CrossRef] [PubMed] [Green Version]
- Sweeney, B.P.; Bromilow, J. Liver enzyme induction and inhibition: Implications for anaesthesia. Anaesthesia 2006, 61, 159–177. [Google Scholar] [CrossRef] [PubMed]
- Lynch, T.; Price, A. The effect of cytochrome P450 metabolism on drug response, interactions, and adverse effects. Am. Fam. Physician 2007, 76, 391–396. [Google Scholar]
- Dachineni, R.; Kumar, D.R.; Callegari, E.; Kesharwani, S.S.; Sankaranarayanan, R.; Seefeldt, T.; Tummala, H.; Bhat, G.J. Salicylic acid metabolites and derivatives inhibit CDK activity: Novel insights into aspirin’s chemopreventive effects against colorectal cancer. Int. J. Oncol. 2017, 51, 1661–1671. [Google Scholar] [CrossRef] [PubMed] [Green Version]
- Salhab, H.; Naughton, D.P.; Barker, J. Validation of an HPLC Method for the Simultaneous Quantification of Metabolic Reaction Products Catalysed by CYP2C11 Enzymes in Rat Liver Microsomes: In Vitro Inhibitory Effect of Salicylic Acid on CYP2C11 Enzyme. Molecule 2019, 24, 4294. [Google Scholar] [CrossRef] [PubMed] [Green Version]
- Mafiadoc.com. Solvent Cut-off wavelengths-MAFIADOC.COM. 2011. Available online: https://mafiadoc.com/solvent-cut-off-wavelengths_597739701723dde28b57cfaf.html (accessed on 19 February 2020).
- Shaikh, K.; Devkhile, A. Simultaneous Determination of Aceclofenac, Paracetamol, and Chlorzoxazone by RP-HPLC in Pharmaceutical Dosage Form. J. Chromatogr. Sci. 2008, 46, 649–652. [Google Scholar] [CrossRef] [PubMed] [Green Version]
- Schelstraete, W.; Devreese, M.; Croubels, S. Storage stability study of porcine hepatic and intestinal cytochrome P450 isoenzymes by use of a newly developed and fully validated highly sensitive HPLC-MS/MS method. Anal. Bioanal. Chem. 2018, 410, 1833–1843. [Google Scholar] [CrossRef] [PubMed]
- Bibi, Z. Retraction: Role of cytochrome P450 in drug interactions. Nutr. Metab. 2014. [Google Scholar] [CrossRef] [PubMed] [Green Version]
- Hines, R.N.; McCarver, D.G. The ontogeny of human drug-metabolizing enzymes: Phase I oxidative enzymes. J. Pharmacol. Exp. Ther. 2002, 300, 355–360. [Google Scholar] [CrossRef] [PubMed]
- Furge, L.L.; Guengerich, F.P. Cytochrome P450 enzymes in drug metabolism and chemical toxicology: An introduction. Biochem. Mol. Biol. Educ. 2006, 34, 66–74. [Google Scholar] [CrossRef] [PubMed]
- Collom, S.; Laddusaw, R.; Burch, A.; Kuzmic, P.; Perry, M.; Miller, G. CYP2E1 Substrate Inhibition. J. Biol. Chem. 2007, 283, 3487–3496. [Google Scholar] [CrossRef] [PubMed] [Green Version]
- Hodges, R.E.; Minich, D.M. Modulation of Metabolic Detoxification Pathways Using Foods and Food-Derived Components: A Scientific Review with Clinical Application. J. Nutr. Metab. 2015. [Google Scholar] [CrossRef] [PubMed]
- Li, H.; Letcher, R.J. A high-performance-liquid-chromatography-based method for the determination of hydroxylated testosterone metabolites formed in vitro in liver microsomes from gray seal (Halichoerus grypus). J. Chromatogr. Sci. 2002, 40, 397–402. [Google Scholar] [CrossRef] [PubMed] [Green Version]
Sample Availability: Samples of the compounds are available from the authors. |


| Standards | Chlorzoxazone | 6-Hydroxychlorzoxazone |
|---|---|---|
| Regression equation | y = 0.0544 x + 0.0626 | y = 0.0164 x – 0.0021 |
| r2 | 0.9997 | 0.9994 |
| Linear range | 25–400 µM | 10–100 µM |
| Standards | Chlorzoxazone | 6-Hydroxychlorzoxazone |
|---|---|---|
| Limit of Detection (LOD) | 4.972 µM | 1.997 µM |
| Limit of Quantitation (LOQ) | 15.068 µM | 6.052 µM |
| Chlorzoxazone Standard | Mean Activity (µM) | Standard Deviation | Relative Standard Deviation (%) |
|---|---|---|---|
| Low activity standard (C = 25 µM) | 36.424 | 1.014 | 2.785 |
| Medium activity standard (C = 100 µM) | 106.421 | 0.727 | 0.684 |
| High activity standard (C = 200 µM) | 218.814 | 0.599 | 0.274 |
| 6-Hydroxy Chlorzoxazone Standard | Mean Activity (µM) | Standard Deviation | Relative Standard Deviation (%) |
|---|---|---|---|
| Low activity standard (C = 10 µM) | 10.114 | 0.038 | 0.385 |
| Moderate activity standard (C = 40 µM) | 41.058 | 0.291 | 0.709 |
| High activity standard (C = 80 µM) | 81.299 | 0.101 | 0.125 |
| Chlorzoxazone Standard (µM) | Mean Area Peak (n = 3 each level) | Meana Activity (µM) | Standard Deviation (STD) | Relative Standard Deviation (RSD (%)) | |
|---|---|---|---|---|---|
| Low activity standard (C = 25 µM) | Day 1 | 1.489 | 25.245 | 0.696 | 2.756 |
| Day 2 | 1.373 | ||||
| Day 3 | 0.564 | ||||
| Medium activity standard (C = 100 µM) | Day 1 | 5.668 | 105.088 | 7.583 | 7.216 |
| Day 2 | 6.089 | ||||
| Day 3 | 2.297 | ||||
| High activity standard (C = 200 µM) | Day 1 | 11.719 | 202.275 | 8.525 | 4.214 |
| Day 2 | 10.378 | ||||
| Day 3 | 4.657 | ||||
| 6-Hydroxy Chlorzoxazone Standard (µM) | Mean Area Peak (n = 3 each level) | Mean Activity (µM) | Standard Deviation (STD) | Relative Standard Deviation (RSD(%)) | |
|---|---|---|---|---|---|
| Low activity standard (C = 10 µM) | Day 1 | 0.161 | 9.955 | 0.037 | 0.367 |
| Day 2 | 0.242 | ||||
| Day 3 | 0.263 | ||||
| Medium activity standard (C = 40 µM) | Day 1 | 0.661 | 41.335 | 2.219 | 5.370 |
| Day 2 | 1.096 | ||||
| Day 3 | 1.072 | ||||
| High activity standard (C = 80 µM) | Day 1 | 1.329 | 80.498 | 0.783 | 0.973 |
| Day 2 | 2.002 | ||||
| Day 3 | 2.185 | ||||
| Analytical Parameters | Nominal Level (Actual Concentration of Chlorzoxazone (µM)) | |||
|---|---|---|---|---|
| 25 | 100 | 200 | ||
| Calculated concentration (µM) | 0 h | 26.635 | 99.418 | 197.857 |
| 24 h | 24.359 | 96.815 | 195.943 | |
| 48 h | 26.942 | 96.025 | 190.029 | |
| 72 h | 23.433 | 97.834 | 195.523 | |
| % Recovery a | 24 h | 91.456 | 97.382 | 99.033 |
| 48 h | 101.151 | 96.586 | 96.044 | |
| 72 h | 88.246 | 98.407 | 98.821 | |
| Accuracy b (%) | 0 h | 93.459 | 100.582 | 101.072 |
| 24 h | 102.562 | 103.185 | 102.029 | |
| 48 h | 92.232 | 103.975 | 104.985 | |
| 72 h | 106.267 | 102.166 | 102.239 | |
| Analytical Parameters | Nominal Level (Actual Concentration of 6-Hydroxychlorzoxazone (µM)) | |||
|---|---|---|---|---|
| 10 | 40 | 80 | ||
| Calculated concentration (µM) | 0 h | 9.537 | 40.431 | 81.391 |
| 24 h | 8.848 | 38.719 | 77.154 | |
| 48 h | 9.039 | 41.731 | 80.298 | |
| 72 h | 10.580 | 42.359 | 83.591 | |
| % Recovery a | 24 h | 92.774 | 95.767 | 94.794 |
| 48 h | 94.782 | 103.217 | 98.657 | |
| 72 h | 110.099 | 104.772 | 102.702 | |
| Accuracy b (%) | 0 h | 104.631 | 98.923 | 98.261 |
| 24 h | 111.522 | 103.202 | 103.558 | |
| 48 h | 109.608 | 95.672 | 99.627 | |
| 72 h | 94.200 | 94.100 | 95.512 | |
| Parameters of Enzyme Metabolism | 0 µM Salicylic Acid | 10 µM Salicylic Acid | 25 µM Salicylic Acid | 40 µM Salicylic Acid | 60 µM Salicylic Acid |
|---|---|---|---|---|---|
| Km (µM) | 88.731 ± 6.003 | 81.732 ± 6.517 | 1322.751 ± 0.403 | 107.991 ± 4.932 | 232.306 ± 0.762 |
| Vmax (µM−1.min−1) | 0.842 ± 0.186 | 0.834 ± 0.220 | 6.954 ± 0.033 | 0.939 ± 0.154 | 1.915 ± 0.972 |
| Clint (µM−2.min−1) | 0.0094 ± 0.202 | 0.0102 ± 0.186 | 0.0053 ± 0.359 | 0.0087 ± 0.218 | 0.0082 ± 0.002 |
© 2020 by the authors. Licensee MDPI, Basel, Switzerland. This article is an open access article distributed under the terms and conditions of the Creative Commons Attribution (CC BY) license (http://creativecommons.org/licenses/by/4.0/).
Share and Cite
Salhab, H.; Naughton, D.P.; Barker, J. Validation of an HPLC Method for the Simultaneous Quantification of Metabolic Reaction Products Catalysed by CYP2E1 Enzyme Activity: Inhibitory Effect of Cytochrome P450 Enzyme CYP2E1 by Salicylic Acid in Rat Liver Microsomes. Molecules 2020, 25, 932. https://doi.org/10.3390/molecules25040932
Salhab H, Naughton DP, Barker J. Validation of an HPLC Method for the Simultaneous Quantification of Metabolic Reaction Products Catalysed by CYP2E1 Enzyme Activity: Inhibitory Effect of Cytochrome P450 Enzyme CYP2E1 by Salicylic Acid in Rat Liver Microsomes. Molecules. 2020; 25(4):932. https://doi.org/10.3390/molecules25040932
Chicago/Turabian StyleSalhab, Hassan, Declan P. Naughton, and James Barker. 2020. "Validation of an HPLC Method for the Simultaneous Quantification of Metabolic Reaction Products Catalysed by CYP2E1 Enzyme Activity: Inhibitory Effect of Cytochrome P450 Enzyme CYP2E1 by Salicylic Acid in Rat Liver Microsomes" Molecules 25, no. 4: 932. https://doi.org/10.3390/molecules25040932
APA StyleSalhab, H., Naughton, D. P., & Barker, J. (2020). Validation of an HPLC Method for the Simultaneous Quantification of Metabolic Reaction Products Catalysed by CYP2E1 Enzyme Activity: Inhibitory Effect of Cytochrome P450 Enzyme CYP2E1 by Salicylic Acid in Rat Liver Microsomes. Molecules, 25(4), 932. https://doi.org/10.3390/molecules25040932


