Article

A Comparative Simulation Study of the Thermal Performances of the Building Envelope Wall Materials in the Tropics

Department of Built Environment, Liverpool John Moores University, Liverpool L3 3AF, UK
*
Author to whom correspondence should be addressed.
Sustainability 2020, 12(12), 4892; https://doi.org/10.3390/su12124892
Submission received: 14 May 2020 / Revised: 10 June 2020 / Accepted: 12 June 2020 / Published: 15 June 2020

Abstract

:
The building walls which form the major part of the building envelope thermally interact with the changing surrounding environment throughout the day influencing the indoor thermal comfort of the space. This paper aims at assessing in detail the different aspects (thermophysical properties, thickness, exposure to solar heat gain, etc.) of opaque building wall materials affecting the indoor thermal environment and energy efficiency of the buildings in tropical climate (in the summer and winter days) by conducting simplified simulation analysis using the Integrated Environmental Solutions Virtual Environment (IES-VE) program. Besides, the thermal efficiency of a number of selected wall materials with different thermal properties and wall configurations was analysed to determine the most optimal option for the studied climate. This study first developed the conditions for parametric simulation analysis and then addressed selected findings by comparing the thermal responses of the materials to moderate outdoor temperature and energy-saving potential. While energy consumption estimation for a complete operational building is a complex method by which the performance of the wall materials cannot be properly defined, as a result, this simplistic simulation approach can guide the designers to preliminary analyse the different building wall materials in order to select the best thermal efficiency solution.

1. Introduction

Indoor environment quality is one of the major health concerns in the world as people spend about 80–90% of their time at home or other public indoor environments [1]. Thermal comfort is a key variable of indoor environment quality which is influenced by the design techniques and materials used in building [2,3]. According to how materials respond to the climate, the human settlement environment on earth can be categorised into the heat preservation priority and heat insulation priority climate zones. In the heat preservation priority climate, building materials are used to prevent the external heat gain (hot zone) or internal heat loss (cold zone) since there is a wide disparity between the indoor and outdoor temperatures. On the other hand, heat insulation priority climate zone consists of the tropical and subtropical regions where high humidity, temperatures, and solar radiation are the major stresses. Therefore, materials in this area are mainly used for solving the sun shading and heat insulation [4,5]. According to the State of the Tropics survey, about 50% of the world’s inhabitants would live in the tropical regions before 2050 and consequently the demand for indoor thermal comfort in this region is increasing dramatically [6]. Currently, most of the tropical developing countries are facing difficulties in achieving indoor thermal comfort in the absence of mechanical control because of inappropriate building design. Besides, limited access to energy resources (energy poverty) is another factor that significantly influences the building’s energy consumption in these countries [7,8]. It has been reported that indoor thermal comfort conditions can be controlled without a mechanical system if the indoor temperature remains within the range of adaptive comfort levels [9] and the building envelope can play a significate role in regulating indoor air temperature [10,11]. Hence, the application of appropriate materials for efficient building envelope design would be an effective alternative to attain the standard indoor thermal comfort condition due to the lack of energy supply in tropical developing countries.
Several variables such as climate condition, building envelope, occupant behaviour, etc. influence the energy usage of a building [12,13]. The energy required for a building to operate at its maximum efficiency can be estimated using statistic calculation models that cumulates energy losses across the building envelope [14]. While this approach has been recognised to function in the past, recent advancement in the building energy simulation tools enables efficient analysis of the building envelope thermal performances under dynamic weather conditions and allows to predict its effects on indoor thermal comfort and energy balance [15,16,17]. Building wall envelope consists of transparent and opaque materials and their energy-saving optimisation approaches are also distinct. This paper mainly focuses on the diverse features of building opaque wall materials which influence the indoor thermal comfort and energy efficiency of the buildings in the tropical climate. This study aims to present a simplified simulation analysis of a building modelled with different wall materials to assess their thermal performances as a prospect for energy efficiency enhancements. Besides, the thermal performances of a variety of wall configurations with different selected material compositions were evaluated. For the simulation analysis, spaces with similar characteristics were modelled where only building forms and wall materials were altered to determine the differences they generate in indoor thermal comfort. This paper first explains the basic conditions for the parametric simulation analysis. Accordingly, the selected results from the analysis are presented and discussed. Finally, the best and worst types for materials and wall constructions are defined by a comparative analysis of their capabilities to moderate outdoor temperatures as well as reduce energy consumption. Therefore, the main purpose of this study is to guide the designers to preliminary analyse the building shapes and wall materials in order to select the best thermal efficiency solution.

2. Previous Investigations

Several simulation studies have been conducted on the thermal efficiency of the building envelope in different climatic conditions. Chowdhury et al. [18] experimentally and numerically investigated the indoor thermal condition of the production spaces of the ready-made garment factory building in Dhaka, Bangladesh. The study considered two types of variables (material categories and exterior wall thickness) for the simulation studies where nineteen different exterior wall constructions were examined. The authors developed a correlation matrix between the air temperature, operative temperature, and mean radiant temperature of different zones of the production spaces concerning different building material construction types. Udawattha and Halwatura [19] analysed the field measurements and computer-based simulation studies to understand the thermal efficiency and structural cooling of three common wall materials (brick, cement block, and concrete mud block) in Sri Lanka. The field study was carried out on three selected buildings constructed with three different wall materials of dissimilar thickness. To create a comparable situation, the study then simulated one building keeping wall thickness similar for three materials. The research further assessed the various thickness of wall materials to determine the most appropriate one for the Sri Lankan climatic condition. Mohammad and Shea [11] investigated the steady-state and dynamic thermal properties of five modern wall constructions with different materials in Tehran. The study stated that steady-state analysis overlooks the dynamic behaviour of the building under realistic conditions. Hence, the thermal transmittance calculated from the steady-state study is not a reliable measure for the building materials’ thermal performances since materials with an equal thermal transmittance value can absorb and emit heat at the different rates under dynamic weather conditions. The study highlighted the evaluation of the dynamic behaviour of the entire building to optimise the choice of envelope materials for the maximum thermal comfort and energy efficiency. Kalua [20] studied the optimisation of envelope thermal design for residential buildings in Malawi through computer simulations in EnergyPlus and then experimentally validated the simulation results. The study particularly emphasised on the analysis of mean monthly temperatures and total annual discomfort hours of the zones. The results revealed that from all the envelope features examined (wall transparency ratio, wall and roof R-value, glazing insulation, ventilation infiltration, floor thickness, and window overhang), air infiltration had the most significant influence on thermal efficiency. Moreover, excessive insulation of the building envelope generated a negative effect on indoor thermal comfort levels. Lotfabadi and Hançer [16] compared the energy efficiency of the conventional and modern building construction techniques in Famagusta, Northern Cyprus by modelling a building with different ceiling heights, insulation locations, and indoor conditions. Findings showed that with the increase of ceiling heights in the modern building, the overall energy consumption increased which was later optimised by considering the location of the insulation layer. The study presented that in the summer weather exterior wall insulation works better while the best insulation location for the winter is in the centre of the walls. Besides, the inner insulation layer provides the highest efficiency for the daytime ventilated buildings (office, educational buildings), and for the whole day ventilated buildings (residential buildings) the middle insulation layer is recommended. Ascione et al. [21] proposed the residential building envelope optimisation for the Mediterranean climates by performing simulation analysis in EnergyPlus and MATLAB. The study included different variables such as the density and thickness of the masonry layers, insulation layer thickness, and window quality. Pathirana et al. [9] examined the different shapes of two-story naturally ventilated houses using DesignBuilder simulation software to investigate the effects of building shape, orientation, zone, and window to wall ratio on thermal comfort and lighting energy requirements in the tropics. The simulation results showed that, except for special cases, building shape had no major impact. However, it did have an impact when zone locations and sizes were altered. Zhu et al. [22] compared the energy impact of mass walls and traditional wood-framed walls in Las Vegas, Nevada using the Energy10 simulation tool. The research considered two equal-sized houses where only the external walls were contrasted with the mass walls and traditional walls. Rattanongphisat and Rordprapat [23] assessed the impact of the air conditioning unit on a traditional building’s cooling energy demand using energy simulation. The research revealed that building energy demand can be reduced up to 28% by only using low thermal conductivity building wall materials. Sadeghifam et al. [24] aimed at evaluating the energy efficiency of public buildings by examining the University Technology Malaysia library building as a case study in Ecotect program with 8 different wall construction styles where the simulation input information included temperature, operation type, user number, working period, cooling system, and running time. The authors also compared the simulation results with the field measurements to determine the most appropriate construction for the Malaysian climate. Kisilewicz [25] simulated a small office space (4 m × 5 m) including a south facing glazing and a high thermal load from the equipment to investigate the role of external walls on indoor thermal comfort in Poland. The simulation was performed in EnergyPlus by only modifying the two-layer wall structure consisting of ceramic blocks and an insulation layer. In the same climate, Strzałkowski and Garbalińska [26] investigated the thermal performances of a typical flat (50 m2) constructed of different loadbearing wall materials using WUFI Plus software. In order to accurately evaluate the parameters associated with the thermal accumulation, the transmittance value of the walls was kept equal by making the insulation width variable.
The simulation studies in the literature aimed at minimising building energy consumption taking into account a range of parameters and underlined that these parameters should be carefully considered when assessing the actual performances of the wall materials. Therefore, the selection of suitable simulation methods and parameters for the building wall materials’ thermal performances are primary tasks in this study.

3. Building Envelope

The building envelope consisting of various components such as foundation, wall, fenestration, roof, shading device, etc. serves as a key interface between the indoor and outdoor environments [27]. Building walls form the bulk of the envelope which provide thermal comfort inside the building by regulating variations in outdoor weather conditions and thereby, deciding the heating and cooling loads [28]. Udawattha and Halwatura [19] described building envelope wall as the third skin for the human body that supports to keep the body temperature steady even though the outside temperature fluctuates. Watson [29] stated that building envelope is a system that controls heat exchange between the indoor and outdoor environments. The basic control mechanism is the acceptance or rejection of heat gain from the external and internal heat sources, establishing a new microclimate for the interior. According to Givoni [30], the thermal behaviour of the materials has a very strong impact on occupants’ comfort conditions both in the presence and absence of the mechanical control system since thermophysical properties of the materials determine the indoor air temperature and heating or cooling demand.

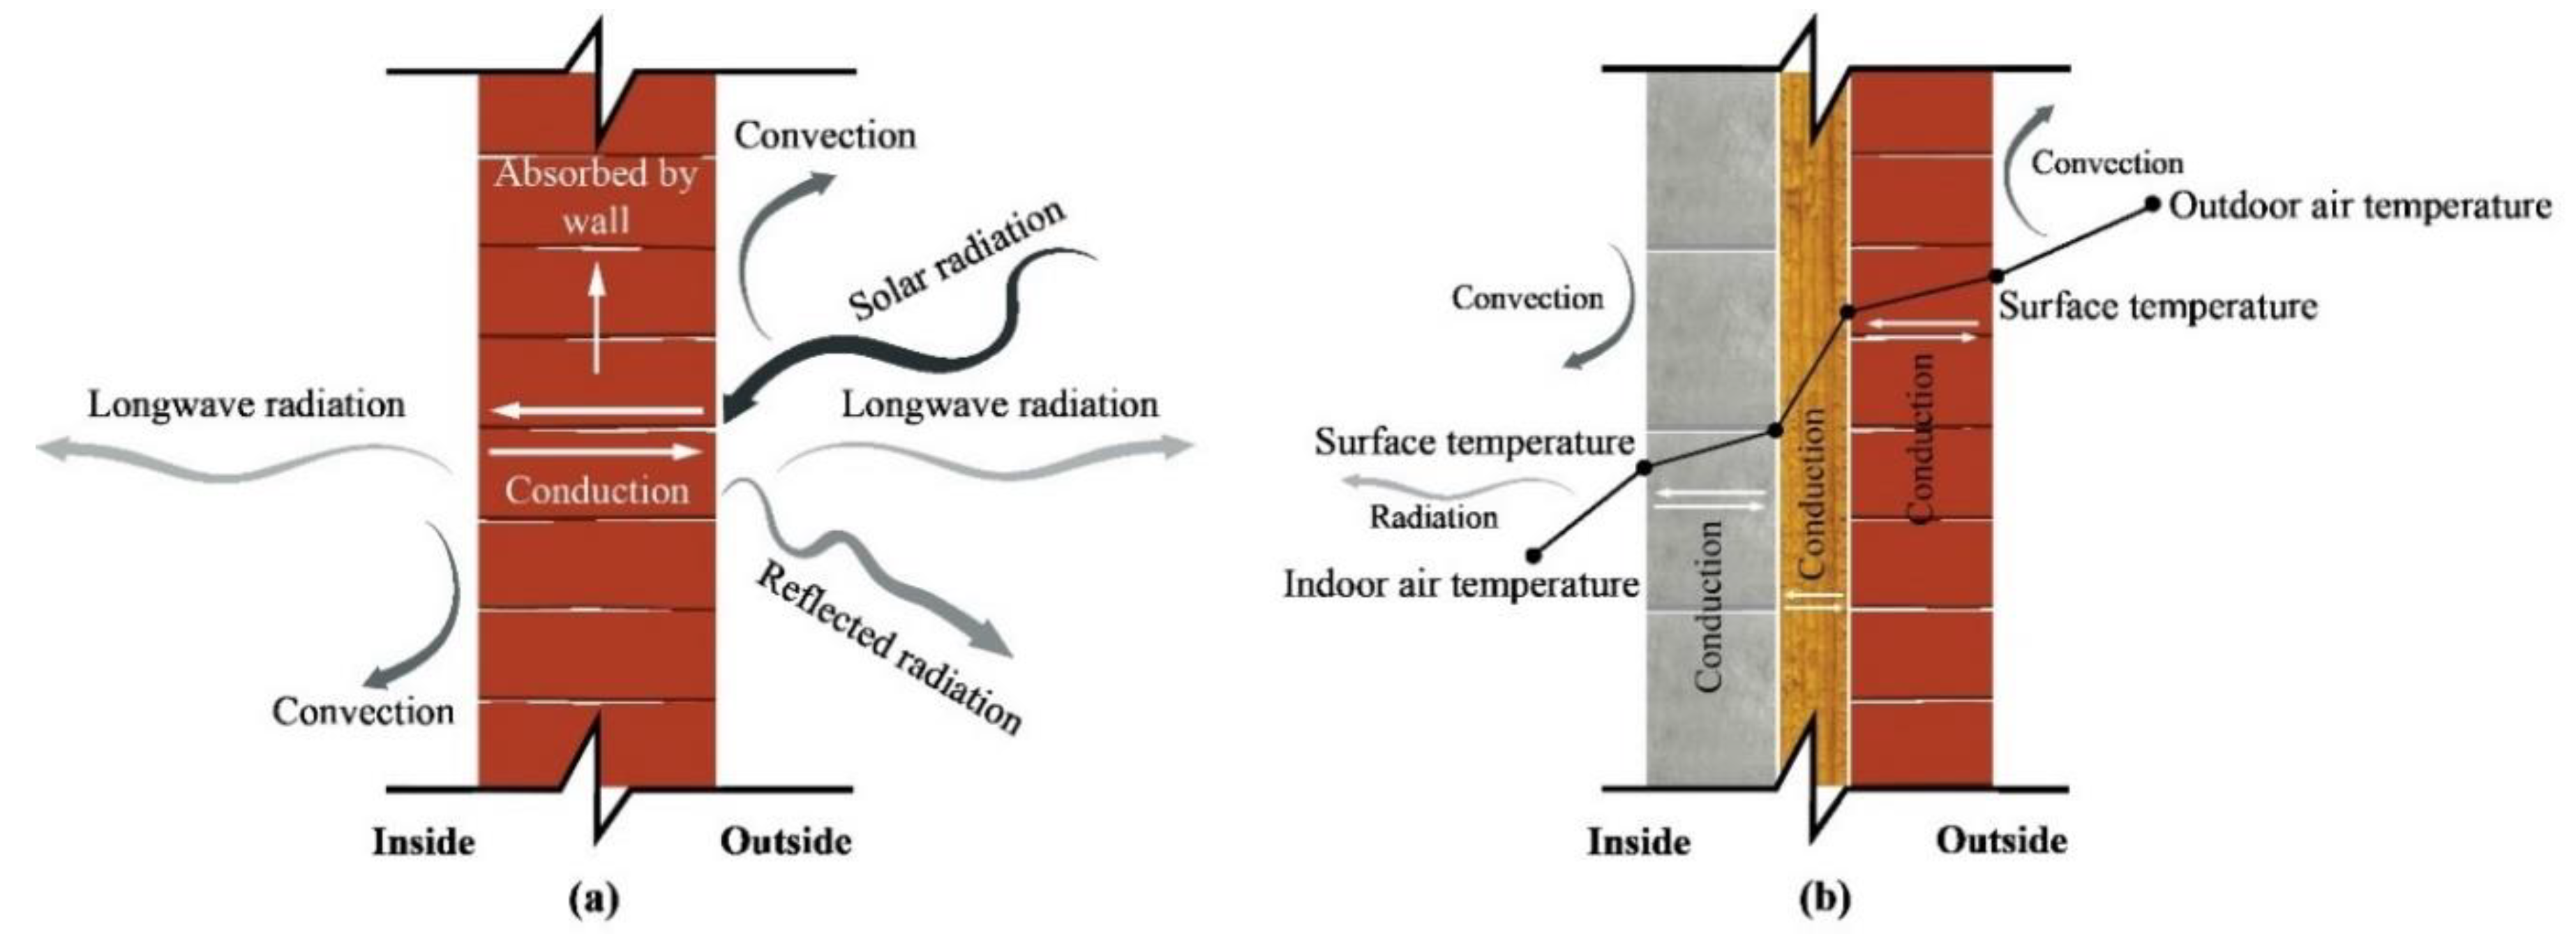
3.1. Heat Transfer Through the Envelope Walls

The heat transfer process through the building wall is complex as well as dynamic (Figure 1) which occurs by the conduction, convection, and radiation [30]. For example, in the daytime, the solar radiation hits the external wall surface, a part of which is released to the outdoor environment, and the other part is absorbed and conducted across the material. The interior surface of the wall then exchanges heat with the room air and other surfaces through the convection and radiation. These heat transfer methods regulate the indoor air temperature and consequently influences the state of thermal comfort. The heat exchange rate and direction through the building envelope depend on several parameters including the solar gain, indoor temperature, outdoor temperature, material thermophysical properties, and exposed surface area. The material thermophysical properties which affect the heat transfer rate are the density, thermal conductivity, heat capacity, thermal resistance, thermal transmittance, and surface characteristics [30,31]. Besides the thermophysical properties, material thickness affects the heat storage capacity of the wall as well [32,33]. Also, the heat gain and loss through the wall can be influenced by the wall orientation and should be considered for energy-efficient building envelope design [34,35].

3.2. Thermophysical Properties of the Building Envelope Wall Materials

The responses of different building wall materials to the environment vary depending on their inherent characteristics and the most significant energy-saving aspects of building materials are heat absorption and transmission capability. Figure 2 shows the surface temperatures of three different houses constructed of mud, fired brick, and corrugated iron (CI) sheet in Chittagong, Bangladesh. These three houses are adjacent and images are taken at midday. It can be seen that C.I sheet house had the highest surface temperature (Sp4: 53.72 °C) followed by the fired brick house (Sp3: 44.94 °C) and mud house (Sp1: 41.44 °C, Sp2: 40.44 °C).
The density, thermal conductivity, and specific heat capacity are the three basic thermophysical properties required for the thermal behaviour analysis of the building materials [37,38]. Other properties such as thermal transmittance, thermal resistance, thermal diffusivity, thermal effusivity, and thermal mass can be determined from the basic properties.
Thermal transmittance or U-value is the heat transfer rate through a structure (single or composite), divided by the temperature differences across the structure. The U-value of a structure depends on the thermal resistance or R-value of each layer in the construction. The U-value is inversely proportional to the R-value and can be calculated by the summation of thermal resistances of the layers that make up the structure plus its internal and external surface resistances. The R-value depends on the thermal conductivity and thickness of the material. The higher the resistance of a material, the lower the heat it loses [39,40].
Thermal diffusivity corresponds to the unsteady state of heat transfer. It shows how quickly the material temperature reaches thermal equilibrium with the surrounding temperature. A higher value of thermal diffusivity indicates faster heat propagation through the material [41]. On the other hand, thermal effusivity is the speed at which the material surface gets warm. In other terms, it is defined as the material’s ability to exchange thermal energy with its surroundings [42,43]. The formulas are:
α = λ / ρ C p
τ = λ ρ C p
where α is the thermal diffusivity (m2/s), τ is the thermal effusivity (Ws1/2/m2K), λ is the thermal conductivity (W/mK), ρ is the density (kg/m³) and C p is the specific heat capacity (J/kgK).
Thermal mass is the amount of heat energy that the object can absorb and store. In the building, thermal mass can significantly minimise indoor temperature fluctuation thereby reducing the heating and cooling demand [44,45]. Ideal materials for thermal mass require a combination of properties such as a high specific heat capacity (optimising the heat stored), a high density (heavier material can store more heat), and moderate thermal conductivity (sustaining heat flow rates with the variation of heating and cooling cycle) [46].

4. Thermal Performance Assessment of the Building

Thermal performance assessment of the building is the method of modelling the energy transfer between the building and its surrounding environments [36]. This method not only depends on the weather conditions but also whether it is a conditioned or a non-conditioned building. In the conditioned building, the heating and cooling loads are estimated to select or design the proper HVAC system whereas for the non-conditioned building indoor temperature variations are analysed to estimate the comfortable periods by the thermal performance assessment [47]. Therefore, it is essential to know how to measure the thermal efficiency of the building to achieve energy efficiency under comfortable indoor conditions. A range of factors determines the thermal performance of the building including design variables (orientation, wall, roof, window types, shape, etc.), material properties (thermal conductivity, density, specific heat capacity, etc.), weather data (temperature, humidity, radiation, wind speed, etc.), and building operation data (internal gain, air exchange, etc.) [9]. Hsieh and Wu [48] stated that the building envelope is the most important element to evaluate the energy efficiency of the building and improving the properties of the envelope can lead to a successful energy-saving design that can reduce energy loss during the operation.
The envelope material properties govern the time lag or thermal lag (TL) and decrement factor (DF) which are used to determine the heat transfer rate across a wall. The time taken by the maximum outside surface temperature waves for the propagation into the internal surface is termed as TL. On the other hand, DF indicates the decrease in the rate of indoor temperature variations (Figure 3) and calculated by the following equation [32,49]:
f = T i , max T i , min T e , max T e , min
where f is the decrement factor, T i , max , T i , min denote the maximum and minimum inside surface temperatures and T e , max , T e , min represent the maximum and minimum outside surface temperatures of the wall respectively. TL and DF mainly depend on the thermophysical properties, wall configuration, and thickness of the materials since the heat waves need a longer time to pass through the materials with increased thickness, density, and resistivity [19,50]. Besides, TL and DF vary when the outside temperature rises or declines steadily from one day to the next [51,52]. When TL is longer, the internal temperature variations relative to the outside temperature will be delayed and low DF is advantageous to keep the indoor temperature stable regardless of unstable outdoor temperature.
The shape coefficient or shape factor ( C f ) is often used to determine the effect of space volume in energy efficiency. It is most frequently measured as the ratio between the building wall exterior surface area ( S e ) and the heated volume ( V ) (Equation (4)) [53,54]:
C f = S e / V
A high shape coefficient indicates (more external building surface area for the same volume) the increase in the winter heat loss and summer heat gain [55,56].
Lylykangas [57] described another similar relation between the building shape and heat transfer through its envelope by calculating the shape factor as a ratio between the inside surface area of the building walls ( A o m ) and the heated floor area ( A t e m p ). The author defined shape factor as:
C f = A o m / A t e m p
Though these approaches are unable to describe the energy demand of a building in detail without taking into account certain variables such as the window and building orientation, however, the shape factor can be a criterion for assessing the thermal performance of any space without windows [58]. Therefore, in the early design phase of the building, shape factors can be used as a predictor for the energy demand of the building when evaluating design solutions [59,60].
Building orientation can also influence the thermal efficiency of a building by mitigating direct solar radiation into the building envelope [61,62]. Building orientation indicates the layout of the building on the direction of the sun path pointing at azimuth angles between 0° and 360°. Generally north, east, south and west correspond to 0°, 90°,180°, and 270° respectively. It is preferable to orient elongated surfaces towards the underheated period for increasing daylighting during the winter and shorter surfaces towards the overheated period for controlling intense insolation during the summer [17,63]. Wang [64] reported that the optimum configuration of the building shape, orientation, and envelope can significantly minimise energy consumption.

5. Tropical Climate Context

The tropics refer the regions around the equator of the earth between the Tropic of Cancer in the Northern Hemisphere (23°26′12.6″ N) and the Tropic of Capricorn in the Southern Hemisphere (23°26′12.6″ S) [65]. High temperatures, high humidity, and intense solar insolation are the typical features of the tropical weather. The Köppen climate classification system describes the tropical climate as a non-arid one, in which the mean annual temperature is approximately 18 °C [66,67]. As variations for different seasons are dominated by the rainfall in tropical areas, temperatures in this zone are fairly stable throughout the year in contrast with the subtropical areas which are characterised by temperature fluctuations of varying degrees and lengths of the day. In the tropical zone, sun rays hit nearly overhead at midday and the cool day quickly gets warm until the early afternoon when temperatures reach the warmest. Afterward, space starts to cool off somewhat by the late afternoon when less heat energy hits the surface of the earth. Nevertheless, it remains warm until the early evening after the sunset but begins to cool quickly before the sunrise of the next morning.

6. Simulation Methods

Building simulation software tools are mostly used by the building designers and engineers to explore various design alternatives under varying climatic conditions, internal gains, building envelope characteristics, building geometry, heating, ventilation and cooling (HVAC) system specifications, operation schedules, and control strategies, etc. This present work used the IES-VE (Integrated Environmental Solutions Virtual Environment) software which complies with several national and international standards [68]. Many researchers have proven the efficiency of this software by validating the numerical results against experimental data [69,70,71,72,73].

6.1. Governing Equations

IES-VE’s ApacheSim Thermal Application is a dynamic thermal simulation program that is based on first-principles mathematical modelling of the heat transfer processes occurring inside and around a space. ApacheSim assumes that the conduction of each building element is unidirectional and thermophysical properties ( λ , ρ , C p ) of each layer of the element are uniform within the layer. Under these assumptions following equation can be formulated:
2 T / x 2 = ρ C p λ T / t
A finite-difference approach is considered in ApacheSim to solve the heat differentiation equation. In this approach, the element is replaced with a finite number of discrete nodes at which the temperature is calculated. By considering this spatial discretisation the Equation (5) can be written as follows:
T n 1 2 T n + T n + 1 δ n 2 = ( ρ C p / λ ) T / t
where T n is the temperature (°C) at a node n and δ n is the local node spacing (m).
In the layers, the nodes are distributed properly to ensure accurate modelling of the heat transfer and storage characteristics for a selected time-step. This process is based on constraint imposed on the Fourier number:
F = ( λ / ρ C p ) Δ / δ n 2
where Δ is the simulation time-step (s).
The temperature-time derivative ( T / t ) at the present time is expressed by Equation (9):
T ˙ n j = ( T n j + 1 T n j ) / Δ
where T n j is the temperature (°C) and T ˙ n j is the time derivative of temperature (K/s) at node n and time-step j .
The energy demand for heating and cooling for a space or zone is calculated according to the Equations (10) and (11) respectively:
Q N H = Q L , H ( η G , H × Q G , H )
subject   to ,   Q N H 0 ,   γ H 2.5   and   θ i > θ e   ( otherwise ,   Q N H = 0.0 )
Q N C = Q G , C ( η L , C × Q L , C )
subject   to   Q N C 0 ,   λ C 2.5   and   ( otherwise ,   Q N C = 0.0 )
where, Q N H and Q N C are the building zone energy demand for heating and cooling (MJ), Q L , H and Q L , C are the total heat transfer (losses) for the heating and cooling mode (MJ), Q G , H and Q G , C are the total heat sources (gains) for the heating and cooling mode (MJ), η G , H and η L , C are the dimensionless gain utilisation factor (a function of mainly the gain-loss ratio and the thermal inertia of the building zone), γ H and λ C are the dimensionless gain/loss ratio for the heating and cooling mode respectively. θ i is the indoor temperature (°C) which is the heating and cooling set-points, θ e is the outdoor temperature (°C) which is obtained from hourly weather data for the location.
Total heat transfer is determined by the Equation (12) and Equation (13):
Q L = Q T + Q V
where Q L is the total heat transfer (MJ), Q T is the total heat transfer by transmission (MJ) and Q V is the total heat transfer by ventilation (MJ).
Q G = Q I + Q S
where Q G is the total heat sources (MJ), Q I is the sum of internal heat sources over the given period (MJ) and Q S is the sum of solar heat sources over the given period (MJ) [74,75].

6.2. Physical Model and Simulation Conditions

In IES-VE a space of 12 m × 6 m × 6 m (length × width × height) (Figure 4) was modelled (elongated axis aligned east-west) to evaluate the indoor air temperature and annual energy consumption for different wall materials. The space was modelled without windows and when running the simulation all sources of internal heat gain, heating/cooling systems were excluded. However, 0.25 Air Changes per Hour of infiltration rate was included to indicate natural air leakage through the envelope of the space. On the other hand, in the case of the energy calculation, for the cooling and heating period, the maximum temperature was set to 23 °C and 19 °C respectively following the thermal comfort criteria. The study considered the weather data of capital city Dhaka, Bangladesh (23.8103° N, 90.4125° E) which features a sub-tropical monsoon climate [76]. Figure 5 presents the 10-year average maximum, mean, and minimum monthly air temperatures and Figure 6 shows the relative humidity and precipitation data of Dhaka from the Bangladesh Meteorological Department [77]. The hourly weather data of Dhaka, SunCast solar radiation, and MacroFlo for the natural infiltration were linked to the ApacheSim and the simulation period was set for the entire year. Though this type of building does not exist in reality, however, this approach was considered to provide a clear assessment of the envelope materials’ thermal performances under dynamic weather conditions. The most widely used building materials (fired bricks, unfired bricks, and cement blocks) in Bangladesh were considered for analysis. The study used the thermophysical properties of Common Fired Brick (CFB), Aerated Concrete Block (ACB), and Heavyweight Concrete Block (HCB) from the IES material library while thermophysical properties of Unfired Brick (UFB) were adopted from the literature [50]. The basic (thermal conductivity, density, and specific heat capacity) and derived (thermal transmittance, thermal resistance, diffusivity, thermal effusivity, and thermal mass) thermal properties for each type of material are presented in Table 1. Typical hottest (21 May) and coldest days (04 January) from the weather data record of the preceding year were considered for the analysis.

6.3. Simulation Phases

The parametric simulation analysis was performed under the following five phases.

6.3.1. Phase 01: Different Wall Materials

In this phase, the space was modelled with materials CFB, ACB, HCB, and UFB. The thickness of the wall materials was considered equal (222 mm) and for analysis, only the materials were altered keeping all other elements unchanged. Among three unfired brick types (A, B, C) [50], brick C was selected for the simulation since brick A and B had similar thickness (219 mm) where C had a different thickness of 222 mm.

6.3.2. Phase 02: Different Thicknesses of the Wall

This simulation phase was designed to determine the effect of TL and DF with the change of material thickness. Hence, in this phase, the space was modelled with varying thicknesses (150 mm to 400 mm) of UFB to verify the simulation results against the test results of El Fgaier et al. [50].

6.3.3. Phase 03: Different Orientation of the Space

The modelled space was simulated by changing the orientation at 0°, 45°, 90°, and 135° to examine the effect of building orientation on the energy demand (Figure 7). Building orientation at 0° indicates that elongated sides face the north and south directions. All other orientations were generated by rotating the building plan clockwise with respect to the north. The most commonly used wall material CFB was adopted for the model and other parameters remained similar to the previous simulations.

6.3.4. Phase 04: Different Wall Construction Types

This phase includes simulation analysis of the space with different types of wall constructions to understand the thermal efficiency of building materials as different wall configurations. The wall types are categorised under the solid, clear cavity, full cavity, and partial cavity wall. The purpose of the simulation is to find out the effects of layers or composite wall constructions on the thermal performances of the building. Different wall configurations investigated are shown in Figure 8.

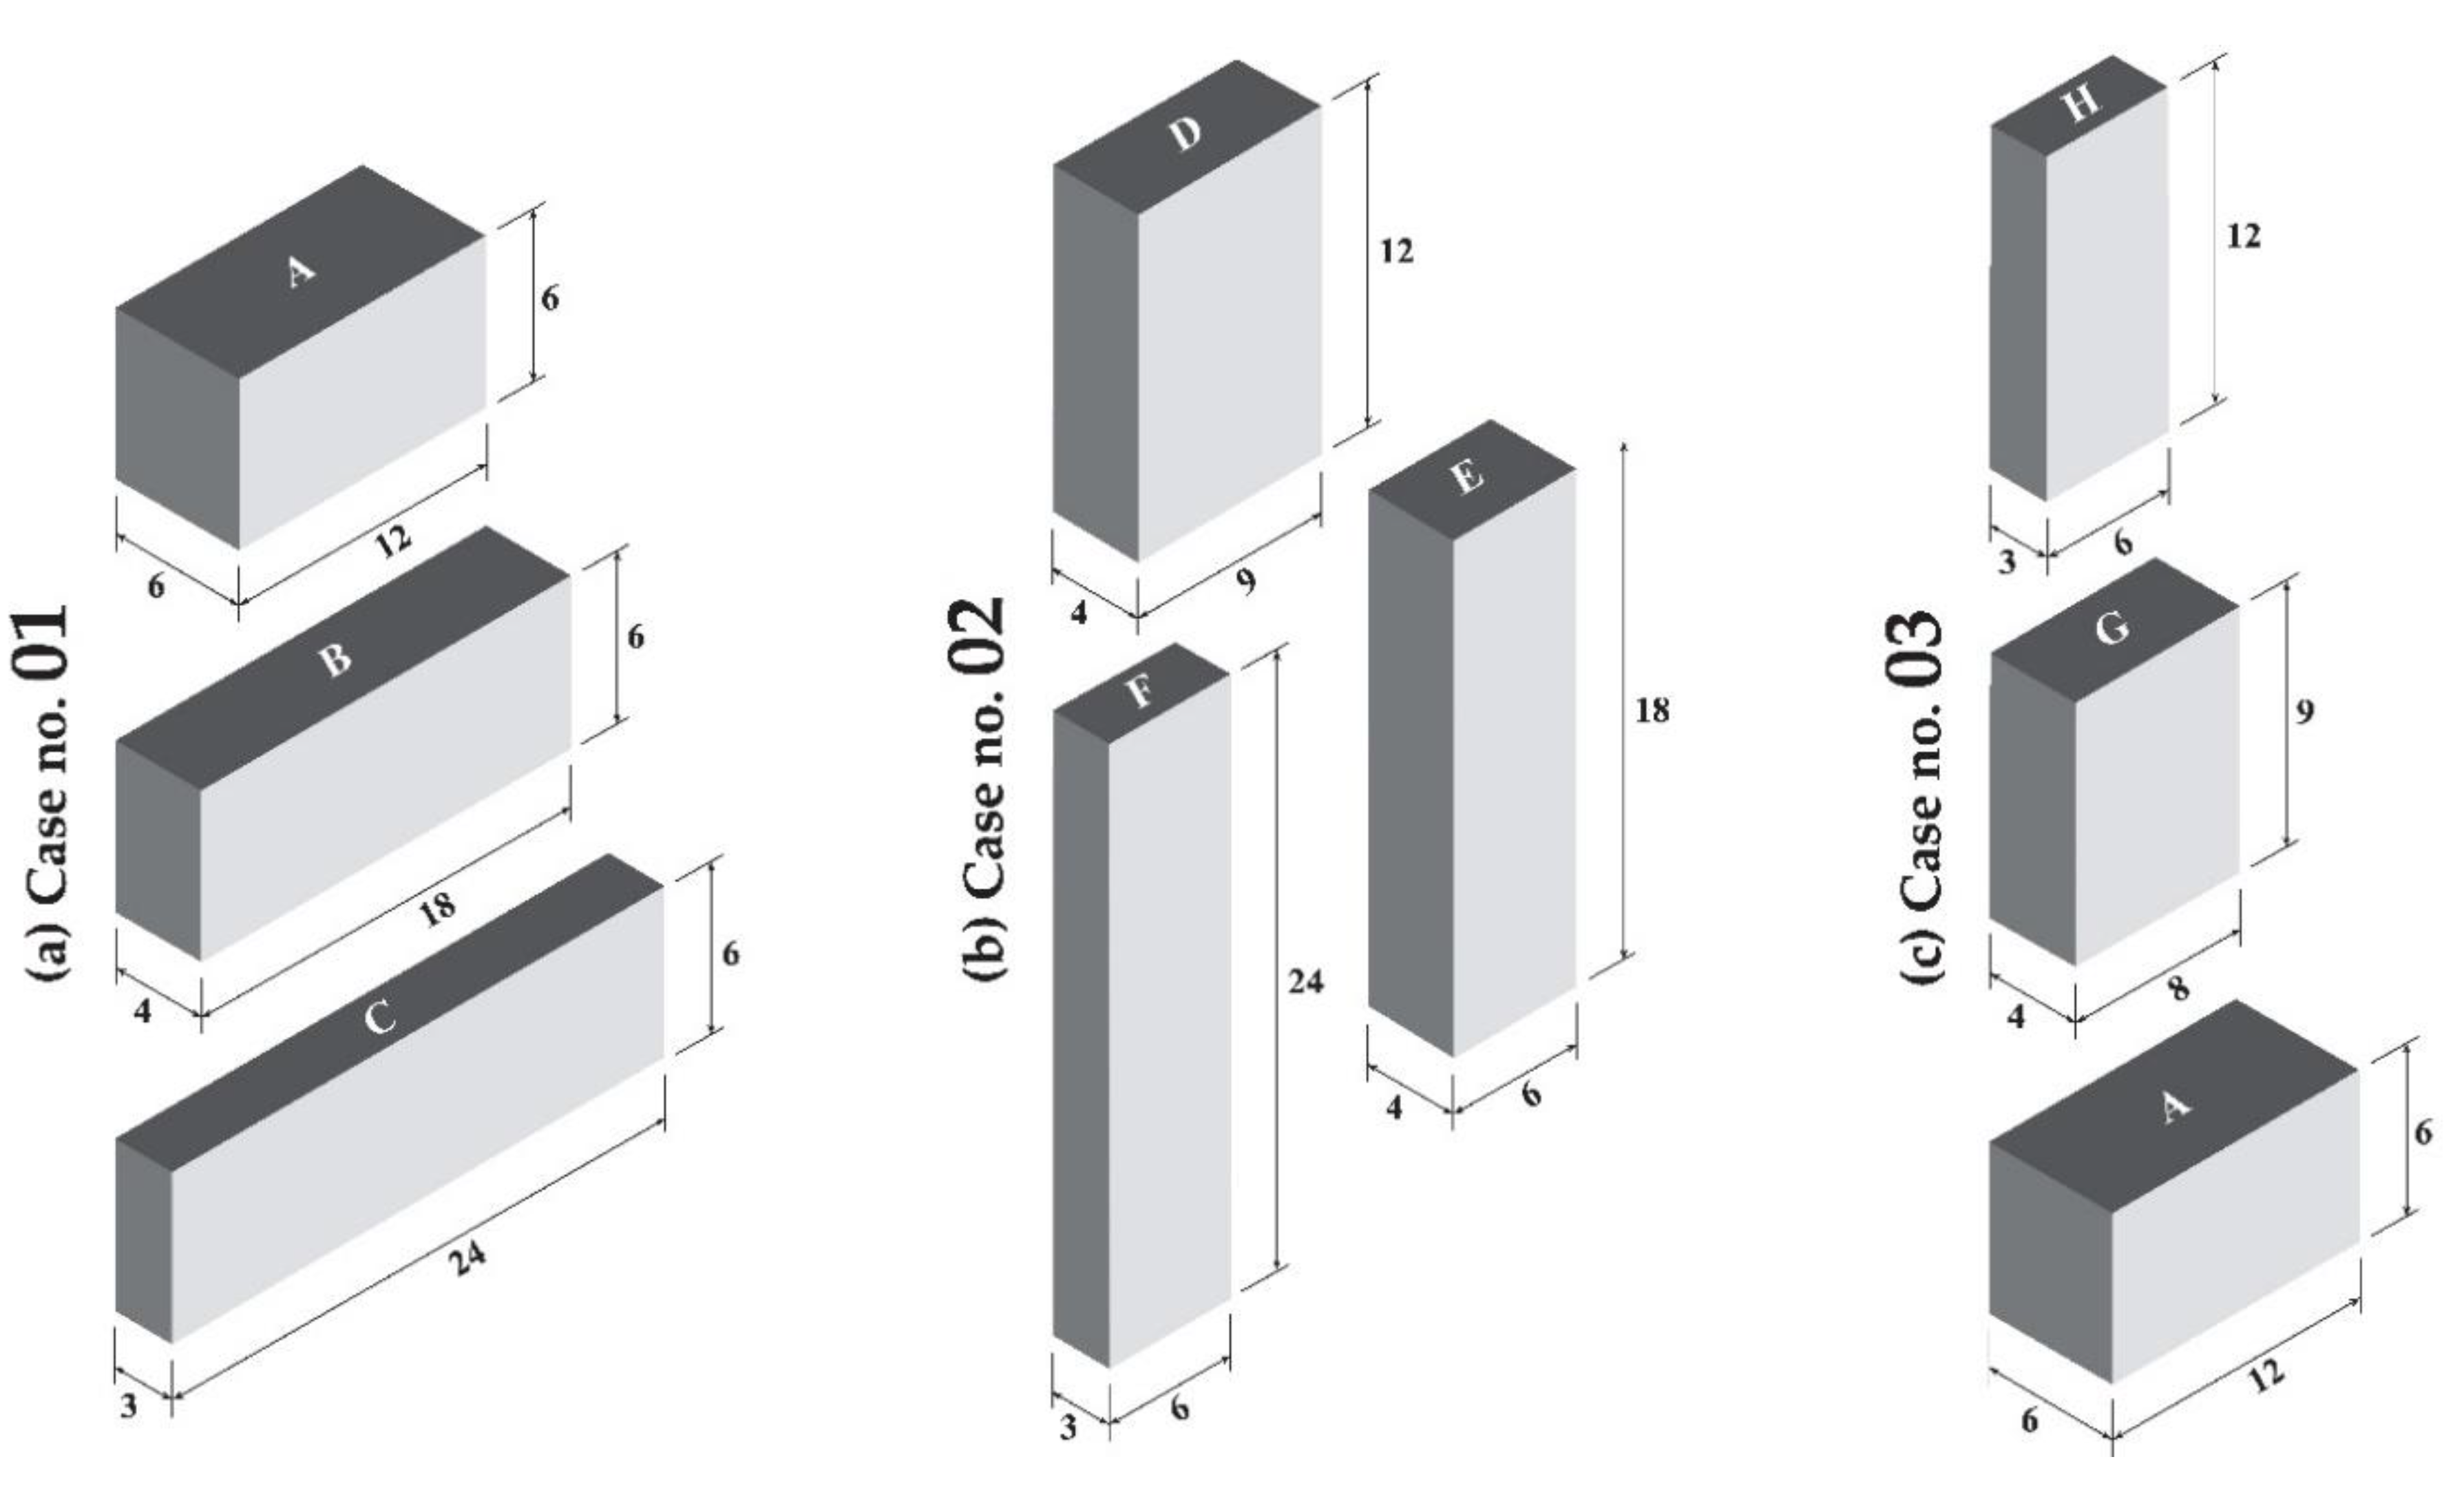
6.3.5. Phase 05: Different Shape Factors

This phase deals with the correlation between the shape factor and energy demand. All the models were constructed with CFB and simulation was carried out under the following three cases (Figure 9).
  • Case 1 (Group a): Buildings with similar volume, height, and floor area but different external surface areas.
  • Case 2 (Group b): Buildings with similar volume but different heights, floor areas, and external surface areas.
  • Case 3 (Group c): Buildings with different heights, volumes, and floor areas but a similar surface area.

7. Results and Discussions

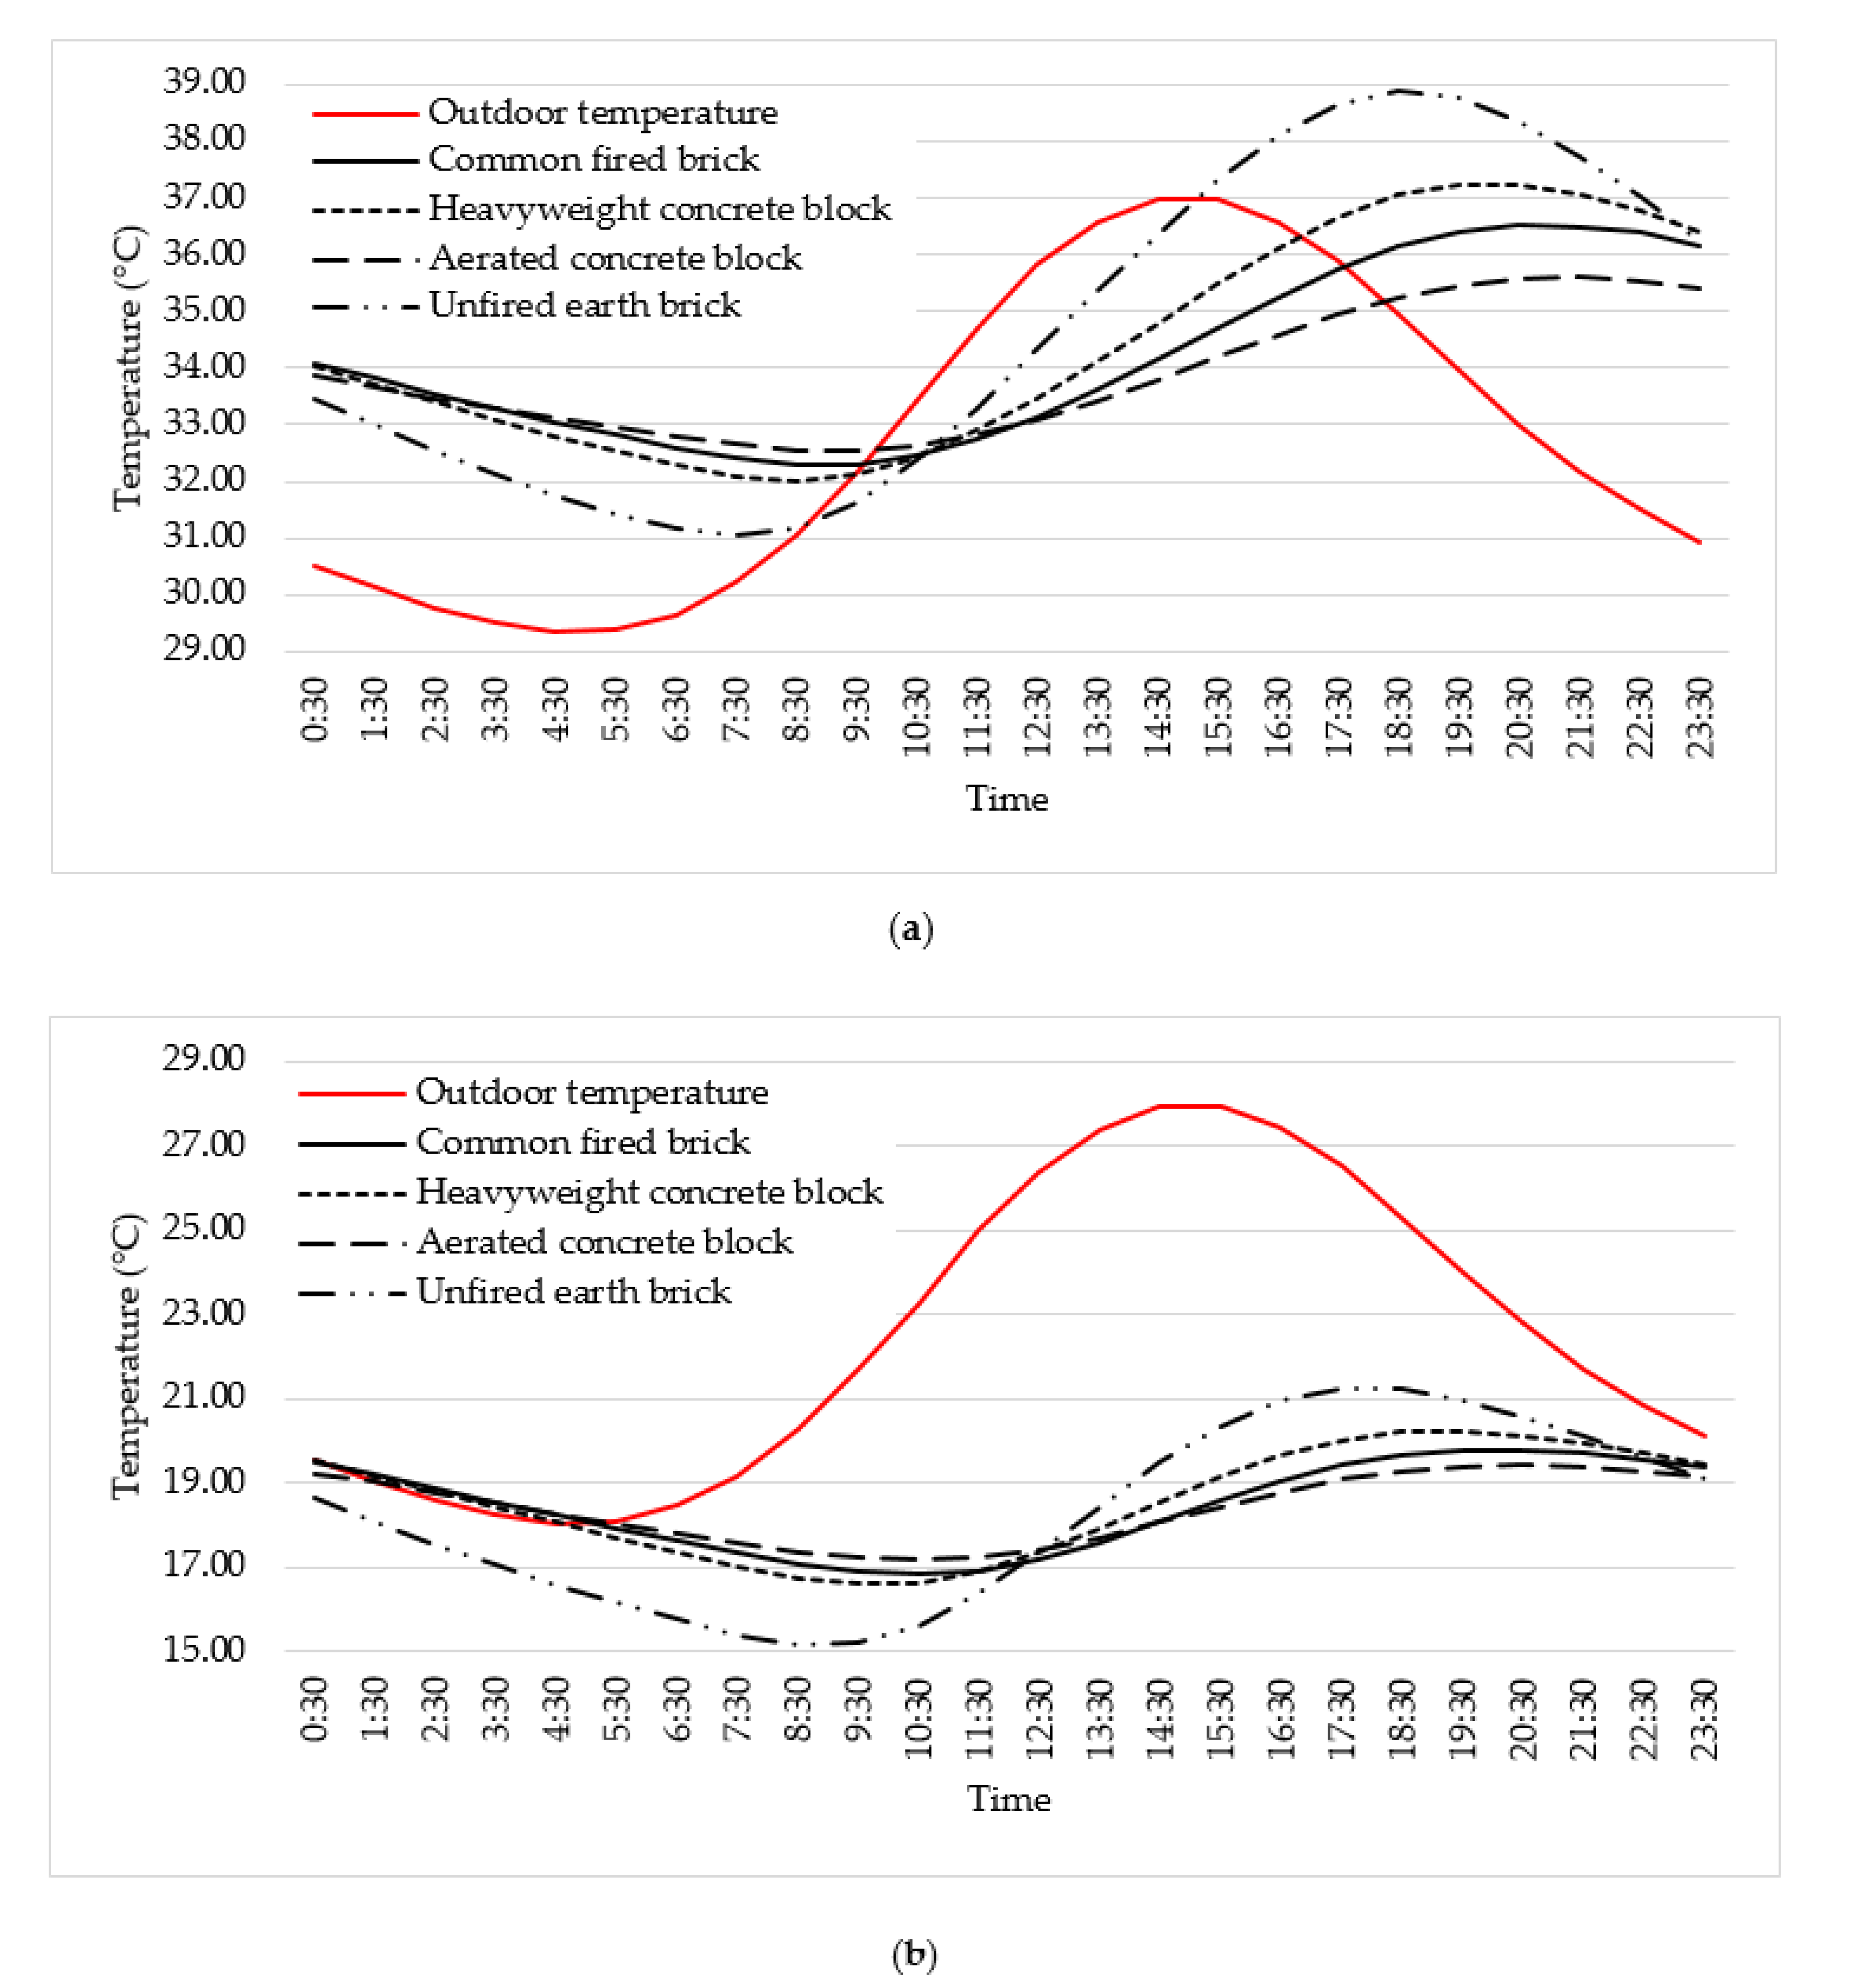
7.1. Effects of Materials’ Thermophysical Properties

Figure 10 illustrates the outdoor and indoor air temperatures of the space during the summer and winter days. It also demonstrates that the outdoor air temperature fluctuation is high with a maximum temperature of about 36.99 °C and a minimum of about 29.34 °C. Besides, the indoor air temperature of UFB construction responded rapidly to the outdoor temperature variations followed by HCB, CFB, and ACB constructions. The maximum indoor temperature for UFB was 38.90 °C and a minimum of 31.06 °C, therefore having a temperature swing of 7.8 °C. However, temperature swing was found comparatively less for CFB (4.23 °C) and HCB (5.22 °C) constructions whereas for ACB it was fairly stable (3.06 °C). As the wall thickness remained equal for all the materials, this variation in temperature swing occurred due to a higher thermal conductivity value of UFB (0.9 W/mK) than CFB (0.73 W/mK) and ACB (0.24 W/mK). Though HCB had a high conductivity value (1.63 W/mK), it had about twice specific heat capacity (1000 J/kgK) compared to UFB (545 J/kgK) which made the space respond slowly to the outdoor air temperature variations. The insignificant indoor temperature swing of ACB space was due to its low thermal conductivity and high specific heat capacity (1000 J/kgK). The thermal diffusivity for ACB, CFB, HCB, and UCB were measured as 3.2 × 10⁻⁷ m2/s, 4.52 × 10⁻⁷ m2/s, 7.09 × 10⁻⁷ m2/s, and 9.23 × 10⁻⁷ m2/s and DF were calculated (for the summer day) as 0.40, 0.55, 0.68, and 1.02 respectively. This explains that materials with high thermal diffusivity and DF take less time to reach the thermal equilibrium with the outdoor temperature. Besides, because of the lowest U-value, ACB (0.91 W/m2K) had the best energy performance (11.70 MWh) followed by CFB (17.60 MWh) and UFB (19.40 MWh) (See Table 1). While HCB having the highest U-value (3.09 W/m2K) displayed the worst performance (22.60 MWh). Moreover, it can be observed that after mid-summer day the indoor air temperature of the UFB and HCB constructions became higher than the outdoor temperature. This may occur since the space was modelled without window and no natural ventilation and air conditioning systems were considered for the analysis [78].

7.2. Effects of Wall Thickness Variations

From Table 1, it can be observed that the thermal mass for the thickness of 125 mm wall was 60.90 kJ/m2K whereas the thermal mass of 222 mm, 300 mm, and 400 mm walls was similar to 97.45 kJ/m2K. It has been presented that temperature variations penetrate up to around 100 mm into the wall material within 24 h depending on the material type and the heat transfer rate [79,80]. In Apachesim the boundary of the building is calculated as the internal horizontal dimensions between the half-way through the thickness of the zone walls. As a result, after increasing the thickness of the wall above 200 mm the thermal mass value remains constant [75,81]. However, the simulation results of the space with different thicknesses of UCB wall revealed that with the increase of thickness the U-values of the walls decreased and there was an inverse relationship between the DF and wall thickness. This indicates that walls with a lower DF have a higher potential to dampen the heat flow from one surface to the other (Figure 11) which complies with the experimental results of El Fgaier et al. [50].

7.3. Effects of Different Orientations

Figure 12a,b illustrate that the indoor temperature fluctuation curve is similar for all the building orientations, while 0° orientation (when the elongated sides face the north and south directions) (Figure 7) resulted in comparatively lower temperature during the summertime and higher in the winter. However, 90° orientation (when the elongated sides face the east and west directions) showed the opposite results. Besides, the energy consumption results (Figure 12c) revealed that the best building orientation for the tropics was 0°, followed by 135° and 45°. The worst orientation was 90° as it caused heat gain through the large exposed surface area in the summer. Hence, in the tropical climate regarding building orientation, it is recommended to design the elongated axis of the building along 90° to minimise the direct solar heat penetration into the building [82].

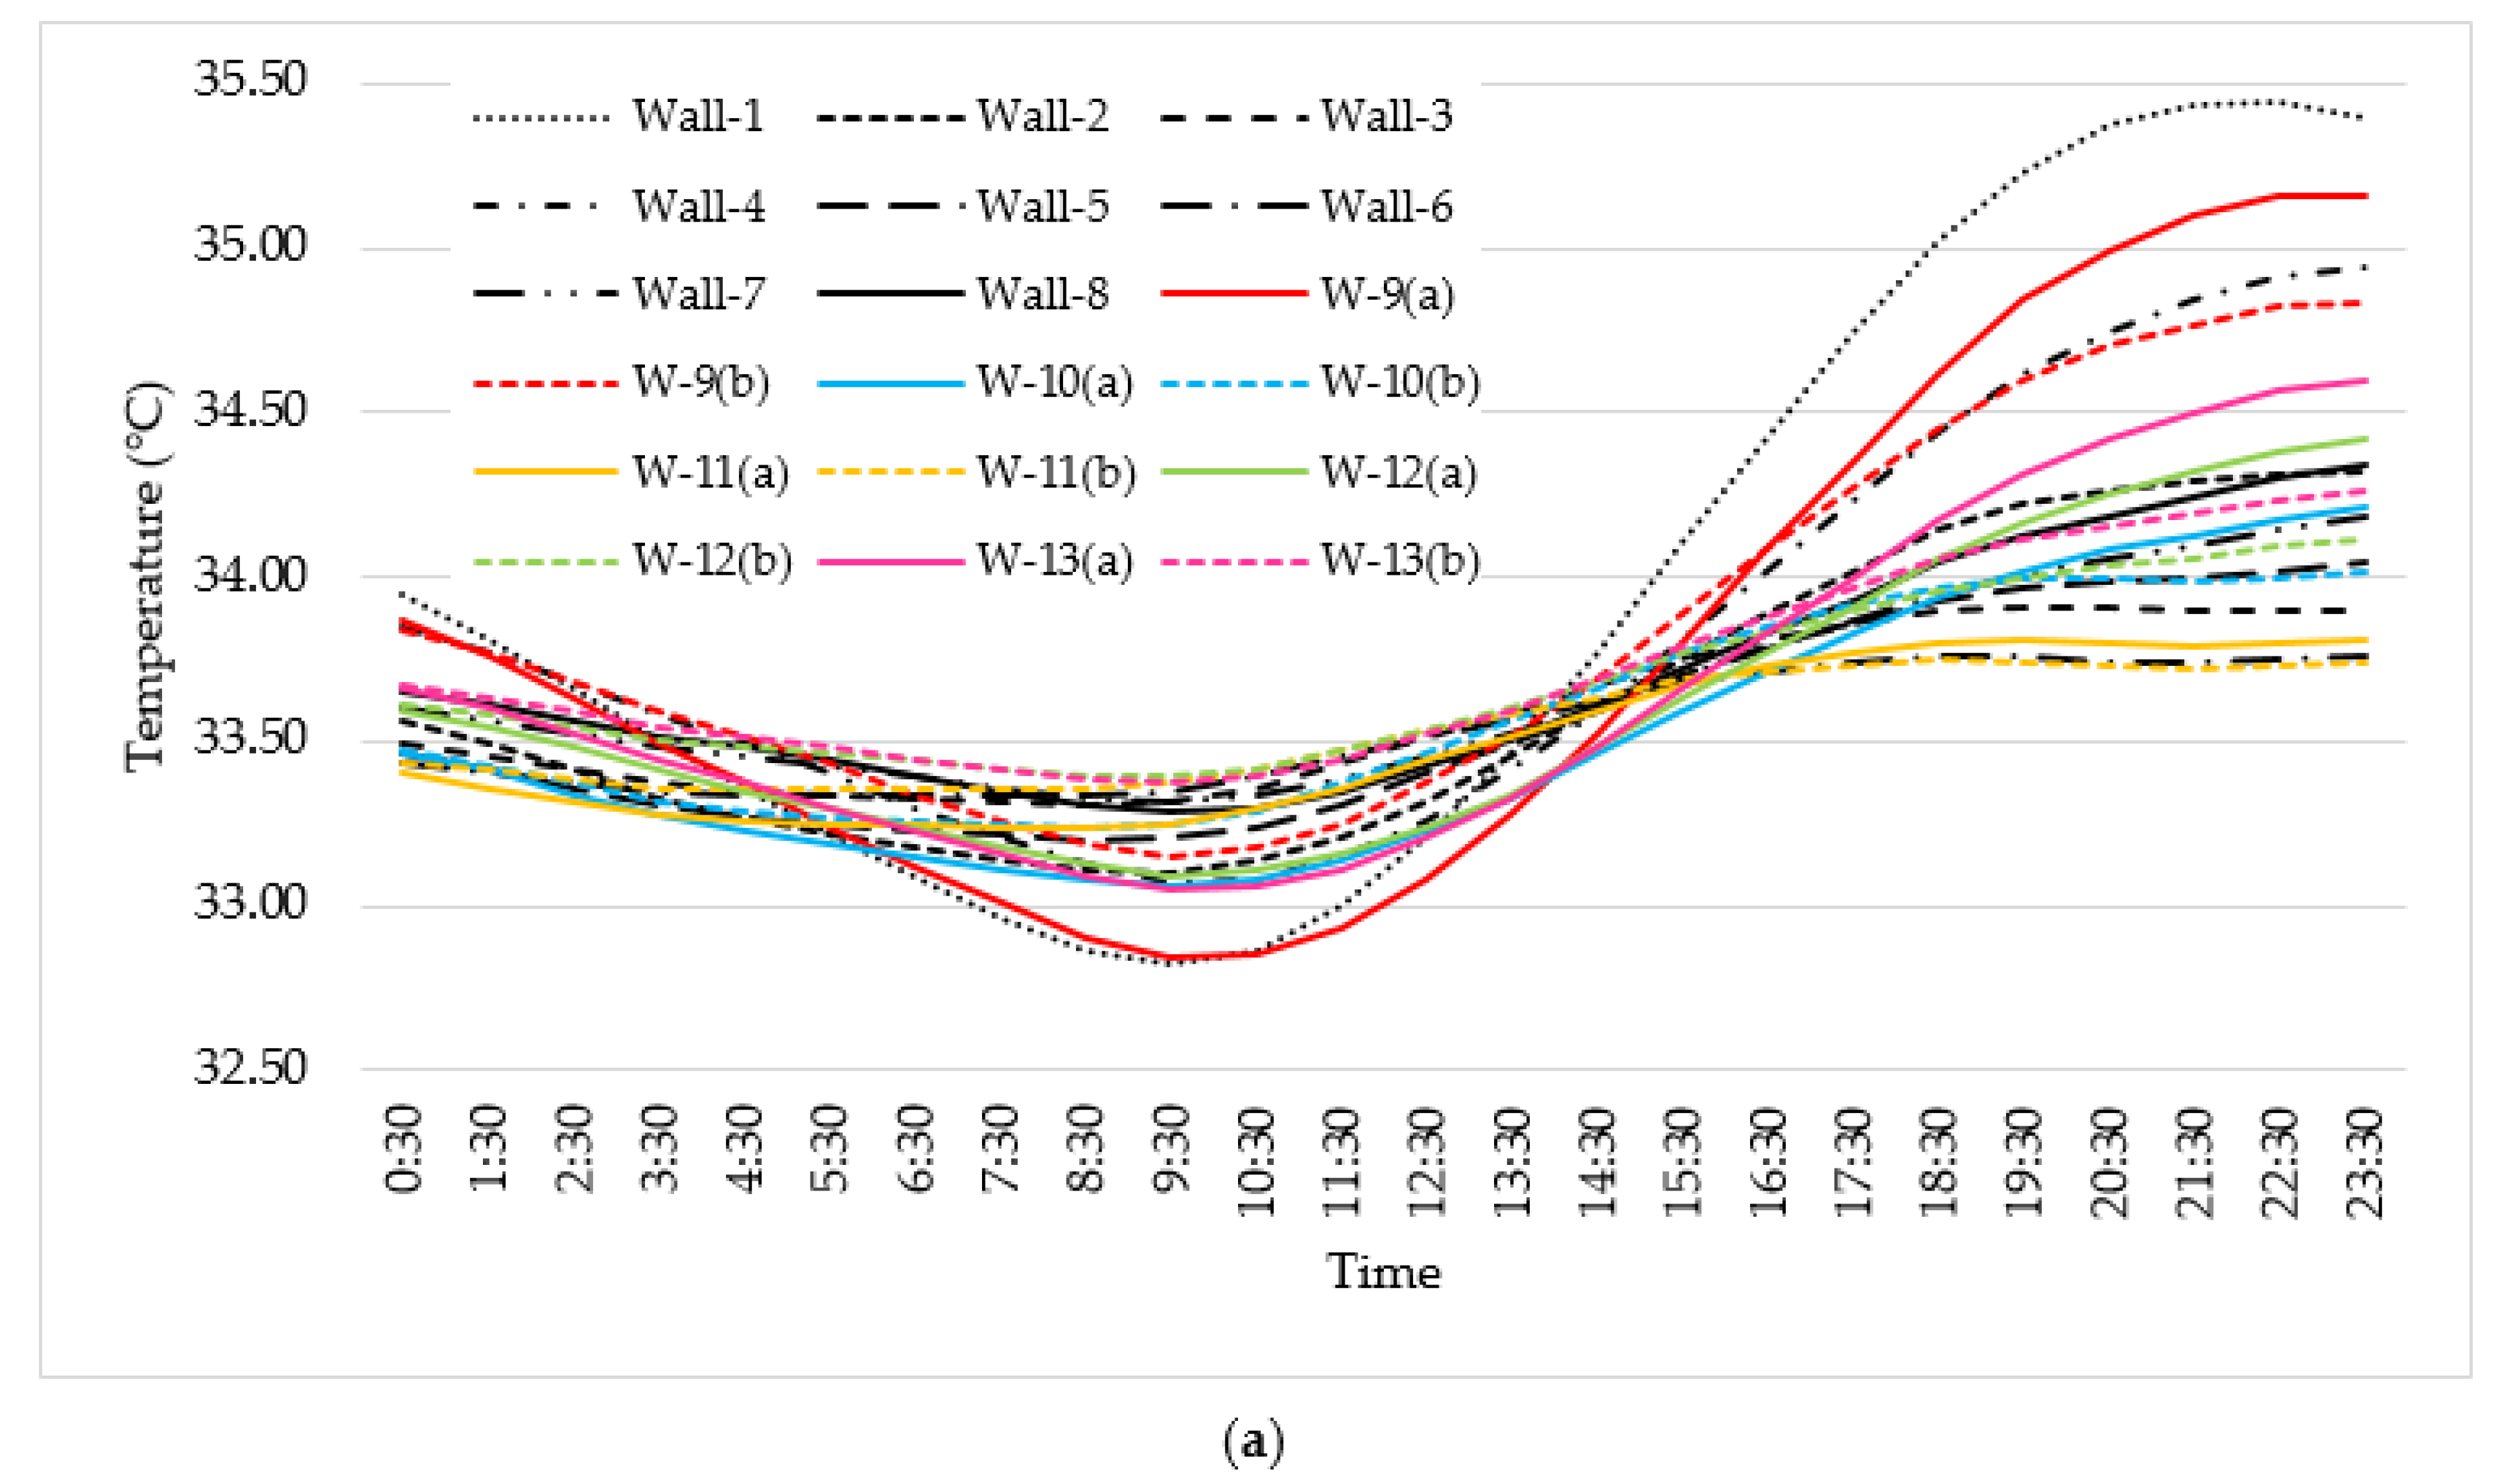
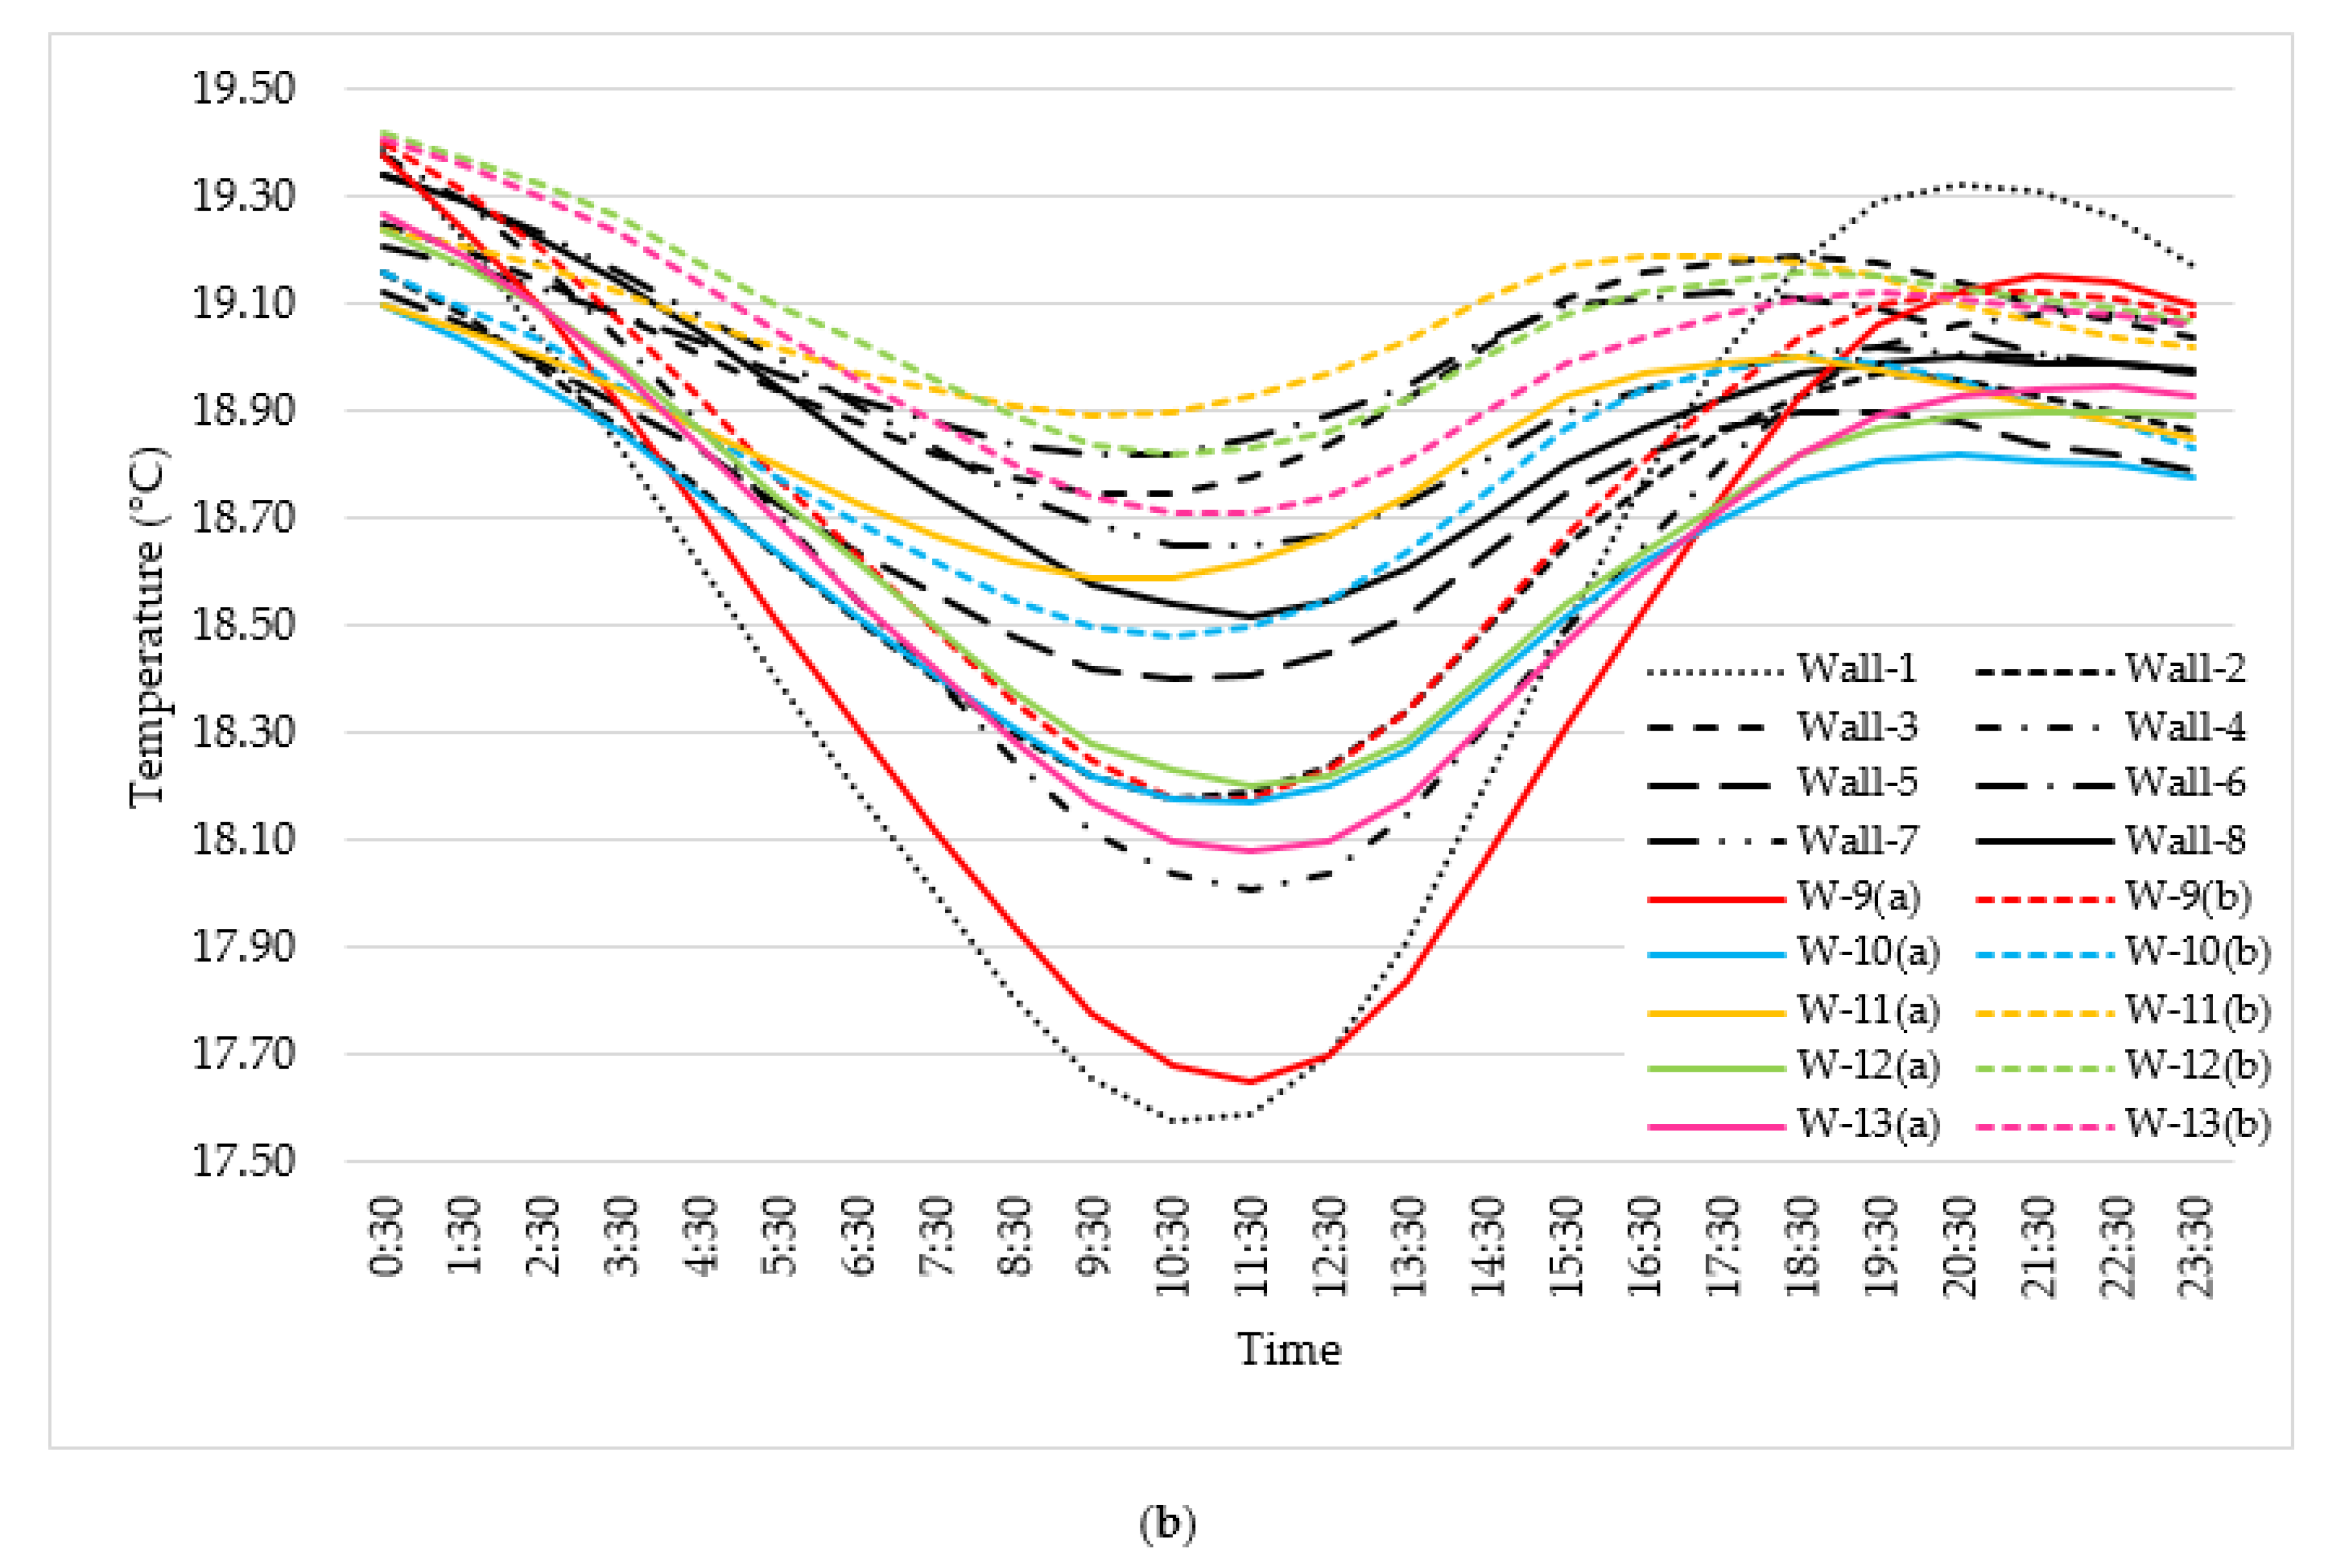
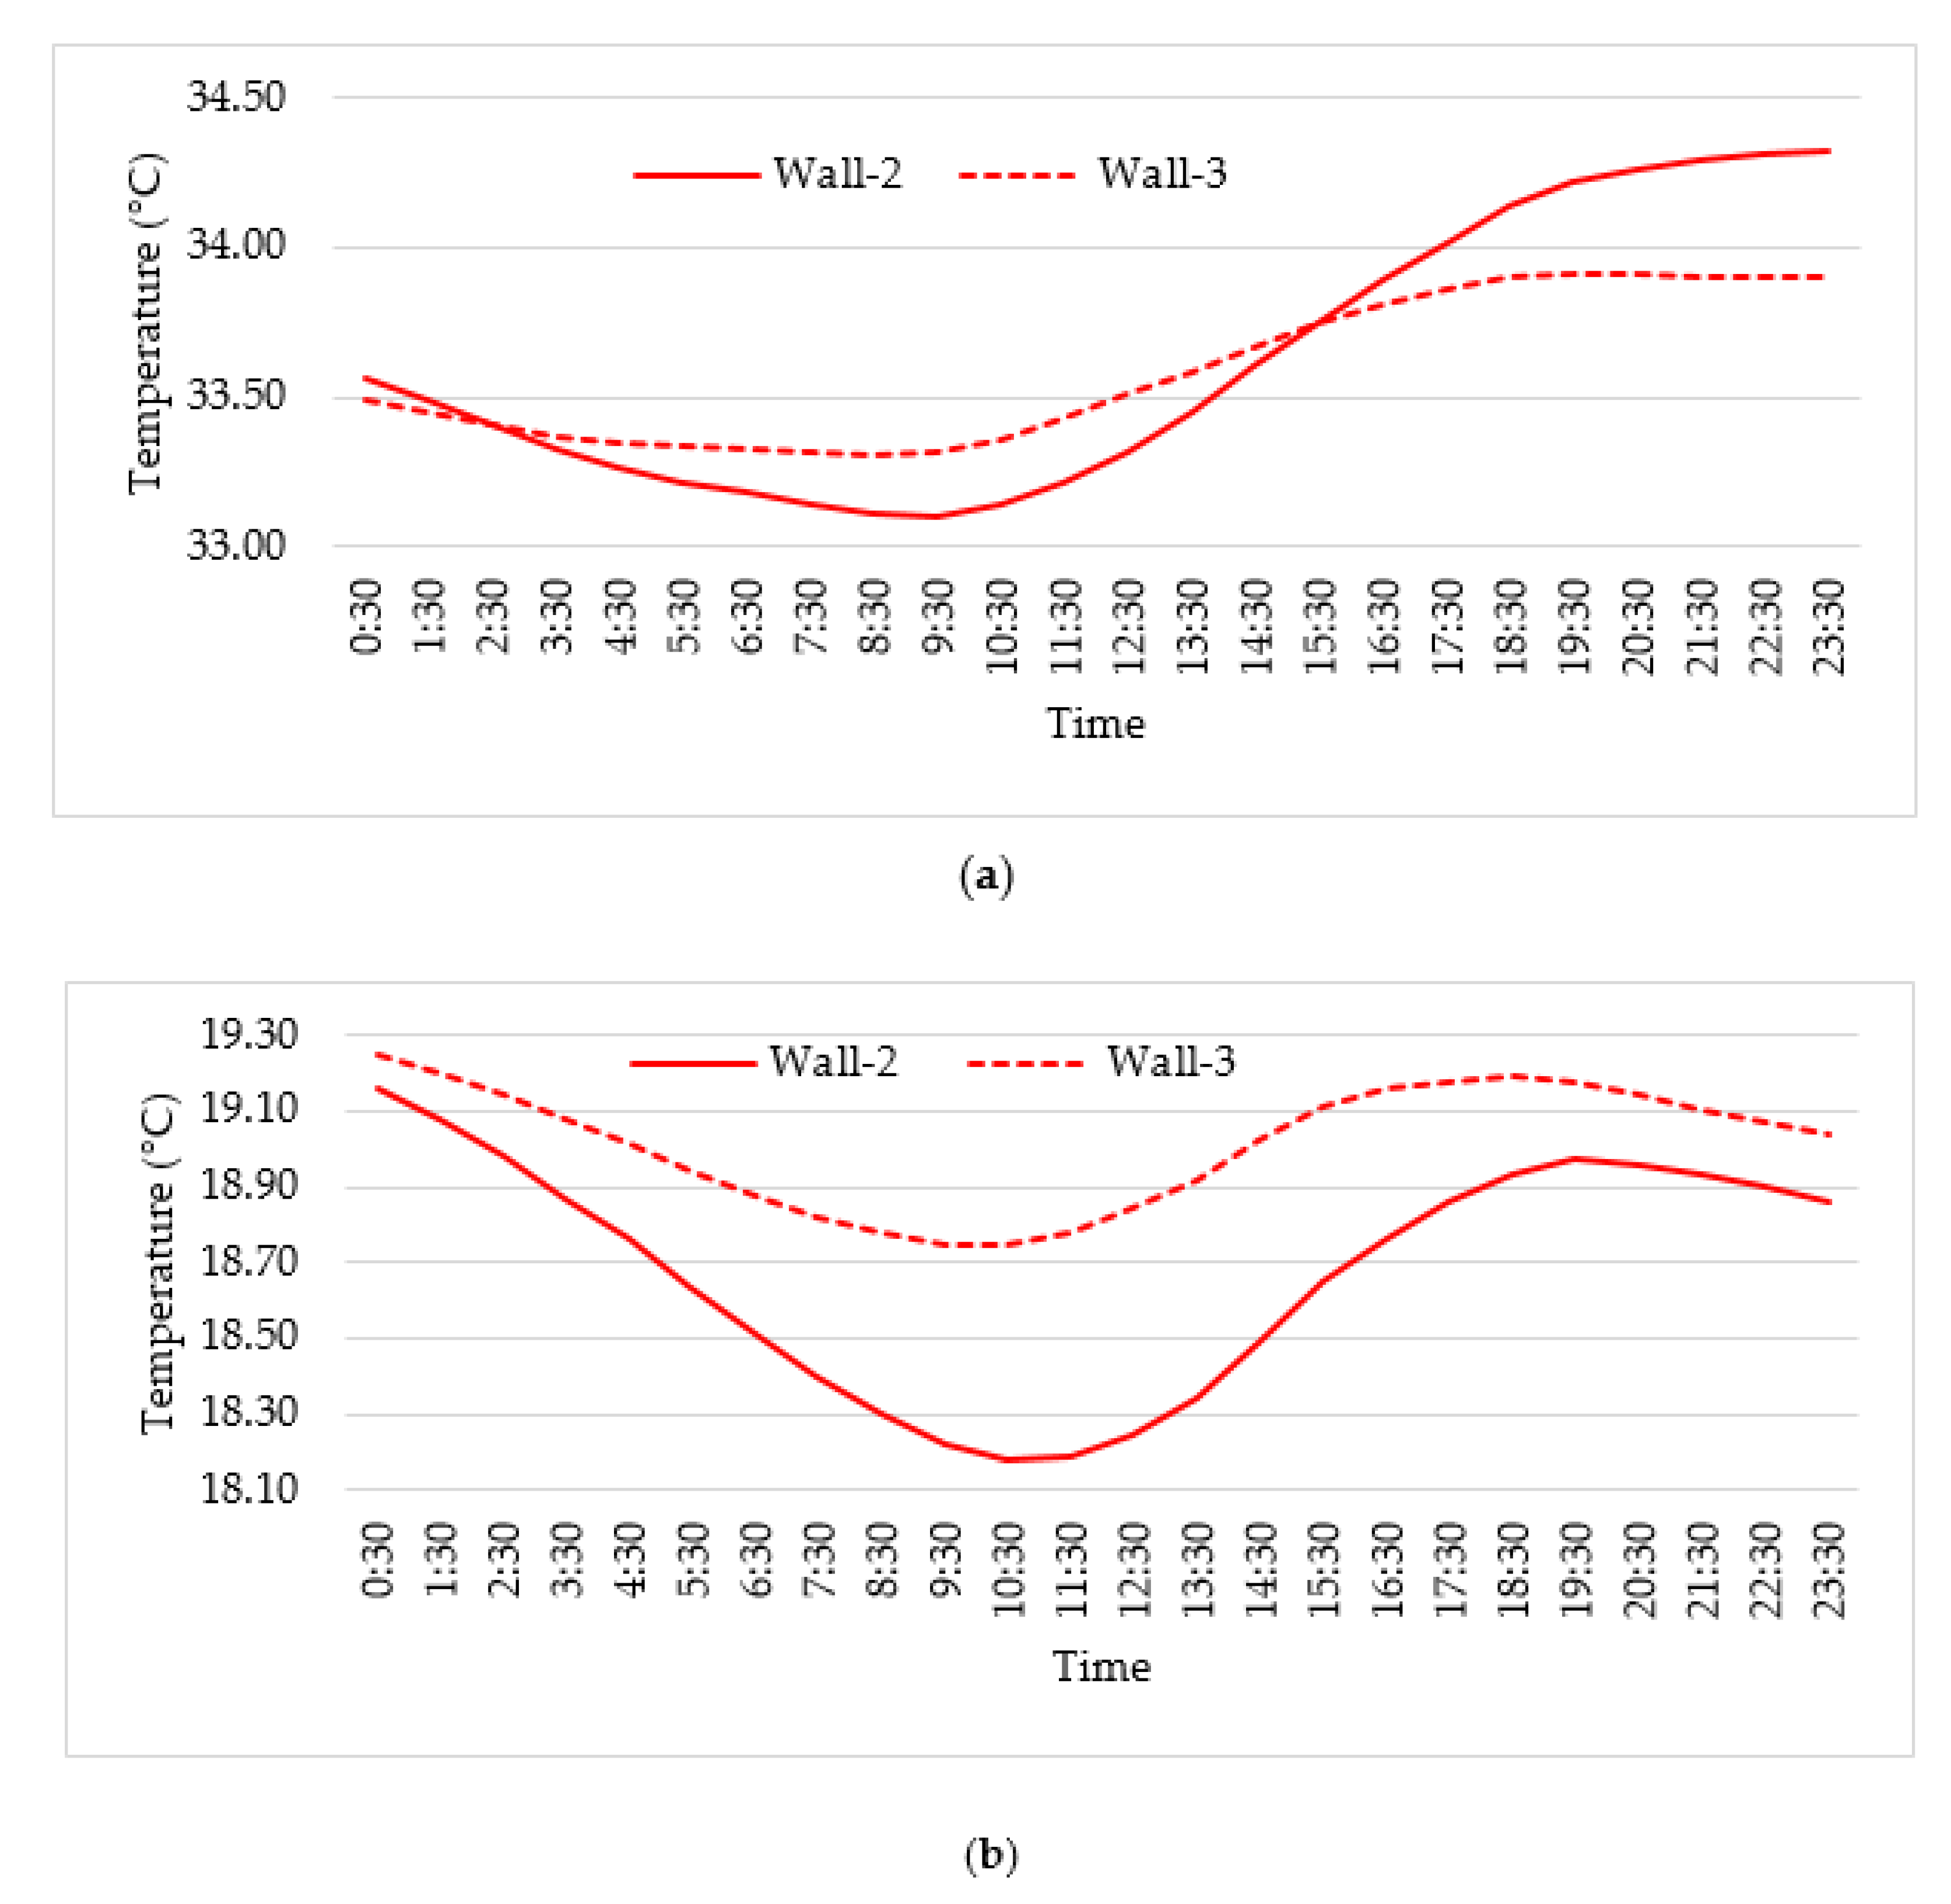
7.4. Effects of Different Wall Constructions

Figure 8 illustrates the different wall construction types used for the simulation and Table 2 summarises the overall U-value and DF for all the wall configurations. Figure 13 presents the variation of the indoor air temperature with time for different wall types. The results demonstrate that increasing the layers to the wall caused a decrease in U-value and a lower U-value helped to maintain a stable indoor temperature. From the simulation results in Section 7.1, it was found that 222 mm brick wall had U-value of 2.1 W/m2K (See Table 1) which reduced to 1.57 W/m2K when the plaster was added on both sides of the wall (W-1) and the inclusion of 40 mm insulation board on either exterior or interior of the wall (W-2, W-3) significantly decreased the U-value (0.64 W/m2K). The U-values of W-2 and W-3 indicated that the position of the insulation layer did not affect the U-values of the walls. The clear cavity wall (W-4) (1.25 W/m2K) had a considerably lower U-value than the solid wall (W-1) as it contained trapped air in its cavity which served as a strong heat insulator. Addition of the insulation layer on the inner (W-5) or outer side (W-6) of the cavity wall was more effective compared to the filled-up cavity wall (W-7). The U-value decreased to 0.88 W/m2K and 0.78 W/m2K when the cavity was partially (W-8) and entirely filled (W-7) with cavity insulation respectively.
The DF of the solid brick wall was measured as 0.55 which decreased to 0.34 when the plaster was added on both sides. But when a 40 mm thermal insulation board was placed on the outside wall DF significantly decreased to 0.08. But the DF was found to be higher (0.16) when a similar insulation board was placed on the inside surface of the wall. Moreover, the clear cavity wall had a higher DF (0.24) compared to the filled (0.11) or partially filled (0.14) cavity wall. However, with the lowest DF (0.05) cavity wall with outside insulation (W-6) had the greatest thermal performance. Similar conclusions were observed by the experimental results of Vijayalakshmi et al. [83] and theoretical models of Ozel [84]. The results can be demonstrated from the heat storage method of the building material. The heat flow rate from the outside to the inside of the building is reduced when the insulation layer is placed on the external surface of the wall. As a result, it takes a longer duration to reach the full thermal storage capacity of the material which ultimately decreases the TL. However, inside insulation placement has less effect on this heat storage process, thus material can reach its full thermal capacity within a short period of time. Hence, it is suggested that the best placement of the insulation layer should be near the heat entrance point. Consequently, in the hot climate exterior insulation performs the best whereas in the cold climate middle insulation layer can be more efficient [16,83].
The performances of different wall types varied according to the hot and cold weather. This variation can be described through comparison of W-2, W-3, or W-5, W-6. From Figure 14, it can be seen that W-2 and W-3 with an equal U-value (0.64 W/m2K) but different thermal mass of 7.80 kJ/m2K (W-4) and 147.76 kJ/m2K (W-5) exhibited similar response in the winter days. While in the summer the two walls showed very different characteristics. The indoor temperature in the winter is often higher than the outside temperature resulting in a one-way heat transfer that is from the inside to the outside. But during the summer heat flow occurs in both directions. As a result, during the summer days, indoor temperatures of the spaces began to overlap one another. Though several authors explained it as the effectiveness of the thermal mass of these materials with the environment [11,85].
This study further investigated the thermal performances of composite walls consisting of combinations of CFB and concrete block (ACB and HCB). The yearly energy consumption results showed that because of the good thermophysical properties of ACB described in section A, the combinations of CFB and ACB walls performed better (W-9(a), W-10(a), W-11(a), W-12(a), W-13(a)) than other combinations of the walls such as only CFB layers (W-4, W-5, W-6, W-7, W-8) or CFB and HCB layers (W-9(b), W-10(b), W-11(b), W-12(b), W-13(b)). However, walls constructed with CFB and HCB presented a better performance in dampening outdoor temperature fluctuations compared to the walls with CFB and ACB (Figure 13). It could be attributed to the significantly higher thermal mass of CFB and HCB combination walls compared to the CFB and ACB combination walls.

7.5. Effects of Different Shape Factors

Simulation results of the following three cases where the surface-to-volume ratio ( S e / V ), surface-to-heated floor area ratio ( S e / A t e m p ), and heated floor area to volume ratio ( A t e m p / V ) were calculated are presented in Table 3.
  • Case 1 (Group a): For the first case, buildings with an equal volume (432 m3), heated floor area (72 m2), and height (6 m) but different surface areas were simulated. The simulation results presented that with the increase of S e / V and S e / A t e m p ratio the energy demand increased. It is due to the increased exposed surface areas which caused additional heat gain and heat loss during the summer and winter respectively.
  • Case 2 (Group b): In the second case, the volumes (432 m3) of the three modelled buildings were considered the same, however, heights, external surface areas, and net floor areas were different. It was found that, with the increase of height, the external surface area increased and the net floor area decreased. This indicates that S e / V and S e / A t e m p ratios are higher in the tall buildings. Besides, in the case of low height buildings, the ratios gradually reduced and lower ratios showed lesser energy consumption and heat gain [58].
  • Case 3 (Group c): For this group of buildings, the surface areas of the buildings were equal (216 m2) but building heights were increased gradually. The results showed that with the increase of height, the volume and net floor area decreased. Also, both the S e / V and S e / A t e m p ratios increased and it caused the energy demand to decrease. In this case, another factor which is A t e m p / V can be considered. It can be seen that for the equal surface area of the spaces with the decrease of heated floor area the A t e m p / V ratio also decreased which caused a reduction in the energy demand. But the result was converse for group b, however, in that group increased surface area explains the heat gain and loss.

8. Conclusions

This paper presents the fundamental computer-based simulation experiments of different opaque wall materials and wall configurations in the tropical climate conditions to understand in detail the dynamic thermal and energy performances of the wall materials. Although the models represented situations that were not under the real building operation conditions, however, this approach was considered to accurately assess the thermal responses of the envelope wall materials. Although certain improvements in the parametric analysis are required to evaluate the understanding of the living comfort condition.
The main conclusions can be drawn from the simulation studies as follows:
  • The heat transfer rate into the building highly depends on the thermophysical properties of the wall materials. It can be seen that the material’s capability to dampen the indoor temperature fluctuation is inversely proportional to the U-value and thermal diffusivity. Besides, materials having high heat storage capacity decreased the DF, while high thermal diffusivity contributed to the reverse effects. The ACB performed the best of the four types of materials analysed because of its lowest U-value and thermal diffusivity while UFB with the highest U-value and thermal diffusivity performed the worst.
  • The analysis was extended by altering the thickness of the material and the results showed that the thermal mass improved with an increased thickness which also resulted in better thermal efficiency as it induced a decrease in DF.
  • The exterior walls of a building can be built as a single layer or multilayers to provide sufficient thermal storage capacity to achieve proper DF and TL. The simulation results revealed that the inclusion of layers and insulation to the wall contributed to decreasing the DF. Besides, the location of the insulation layers had no impact on the overall U-value of the walls but significantly affected the DF. When different walls were constructed only with common fired brick, the best performance was achieved by the cavity wall W-6. However, among all other configurations examined with the combination of fired brick and concrete blocks, the cavity wall W-11(a) performed the best. In both cases, insulation was located outside the wall (near the heat entrance point).
  • Moreover, the energy consumption of the spaces significantly varied depending on the shape factor of the spaces. The results indicated that the energy consumption increased with the increase of surface area and volume of the building. However, it decreased as the heated floor area decreased.
  • Also, the spatial orientations influenced the thermal performances of the external walls as the maximum surface area exposed to the solar radiation caused high heat gain. The best performance for the tropical climate conditions was obtained for the building having the elongated surfaces oriented to the north-south.
Therefore, during the preliminary design process, this simplified simulation approach may guide the designers to assess the effects of various building shapes, wall materials, thicknesses, and wall compositions on indoor thermal comfort and energy efficiency of the tropical buildings. It may also help to select the best solution for a building to match its functional requirements. For example, a wall having high heat storage capacity but low thermal diffusivity would be ideal for the spaces that are used for a long period whereas a wall with low heat storage capacity would be preferred for the spaces that are used for a limited time in a day [16].

Author Contributions

Methodology, A.H.; Software, N.J. and B.A.; Writing—original draft, N.J.; Writing—review & editing, A.H., B.A., and A.C. All authors have read and agreed to the published version of the manuscript.

Funding

This research received no external funding.

Conflicts of Interest

The authors declare no conflict of interest.

References

  1. Šujanová, P.; Rychtáriková, M.; Mayor, T.S.; Hyder, A. A Healthy, Energy-Efficient and Comfortable Indoor Environment, a Review. Energies 2019, 12, 1414. [Google Scholar] [CrossRef] [Green Version]
  2. Gou, S.; Nik, V.M.; Scartezzini, J.L.; Zhao, Q.; Li, Z. Passive design optimization of newly-built residential buildings in Shanghai for improving indoor thermal comfort while reducing building energy demand. Energy Build. 2018, 169, 484–506. [Google Scholar] [CrossRef]
  3. Radivojević, A.; Đukanović, L. Energy Resources and Building Performance; Konstantinou, T., Ignjatović, N.C., Zbašnik-Senegačnik, M., Eds.; TU Delft Open: Rotterdam, The Netherlands, 2018; pp. 61–86. ISBN 978-94-6366-034-1. [Google Scholar]
  4. Zhang, Y.; Li, N.; Dong, L.; Lang, M. Study on modern application of traditional building materials based on geographical background. In Proceedings of the UIA 2017 Seoul World Architects Congress, Seoul, Korea, 3−10 September 2017. [Google Scholar]
  5. Nguyen, A.T.; Truong, N.S.H.; Rockwood, D.; Le, A.D.T. Studies on sustainable features of vernacular architecture in different regions across the world: A comprehensive synthesis and evaluation. Front. Arch. Res. 2019, 8, 535–548. [Google Scholar] [CrossRef]
  6. Rodriguez, C.M.; D’Alessandro, M. Indoor thermal comfort review: The tropics as the next frontier. Urban Clim. 2019, 29, 100488. [Google Scholar] [CrossRef]
  7. Kuik, O.J.; Lima, M.B.; Gupta, J. Energy security in a developing world. Wiley Interdiscip. Rev. Clim. Chang. 2011, 2, 627–634. [Google Scholar] [CrossRef] [Green Version]
  8. Njiru, C.W.; Letema, S.C. Energy Poverty and Its Implication on Standard of Living in Kirinyaga, Kenya. J. Energy 2018. [Google Scholar] [CrossRef] [Green Version]
  9. Pathirana, S.; Rodrigo, A.; Halwatura, R. Effect of building shape, orientation, window to wall ratios and zones on energy efficiency and thermal comfort of naturally ventilated houses in tropical climate. Int. J. Energy Environ. Eng. 2019, 10, 107–120. [Google Scholar] [CrossRef]
  10. Makaka, G.; Meyer, E. Temperature stability of traditional and low-cost modern housing in the Eastern Cape, South Africa. J. Build. Phys. 2006, 30, 71–86. [Google Scholar] [CrossRef]
  11. Mohammad, S.; Shea, A. Performance evaluation of modern building thermal envelope designs in the semi-arid continental climate of Tehran. Buildings 2013, 3, 674–688. [Google Scholar] [CrossRef] [Green Version]
  12. Besagni, G.; Borgarello, M. The determinants of residential energy expenditure in Italy. Energy 2018, 165, 369–386. [Google Scholar] [CrossRef]
  13. Jazaeri, J.; Gordon, R.L.; Alpcan, T. Influence of building envelopes, climates, and occupancy patterns on residential HVAC demand. J. Build. Eng. 2019, 22, 33–47. [Google Scholar] [CrossRef]
  14. Schlueter, A.; Thesseling, F. Building information model-based energy/exergy performance assessment in early design stages. Autom. Constr. 2009, 18, 153–163. [Google Scholar] [CrossRef]
  15. Karlsson, F.; Rohdin, P.; Persson, M.L. Measured and predicted energy demand of a low energy building: Important aspects when using building energy simulation. Build. Serv. Eng. Res. Technol. 2007, 28, 223–235. [Google Scholar] [CrossRef]
  16. Lotfabadi, P.; Hançer, P. A comparative study of traditional and contemporary building envelope construction techniques in terms of thermal comfort and energy efficiency in hot and humid climates. Sustainability 2019, 11, 3582. [Google Scholar] [CrossRef] [Green Version]
  17. Zune, M.; Rodrigues, L.; Gillott, M. Vernacular passive design in Myanmar housing for thermal comfort. Sustain. Cities Soc. 2020, 54, 101992. [Google Scholar] [CrossRef]
  18. Chowdhury, S.; Ahmed, K.S.; Hamada, Y. Thermal performance of building envelope of ready-made garments (RMG) factories in Dhaka, Bangladesh. Energy Build. 2015, 107, 144–154. [Google Scholar] [CrossRef]
  19. Udawattha, C.; Halwatura, R. Thermal performance and structural cooling analysis of brick, cement block, and mud concrete block. Adv. Build. Energy Res. 2018, 12, 150–163. [Google Scholar] [CrossRef]
  20. Kalua, A. Envelope thermal design optimization for urban residential buildings in Malawi. Buildings 2016, 6, 13. [Google Scholar] [CrossRef] [Green Version]
  21. Ascione, F.; Bianco, N.; De Masi, R.F.; Mauro, G.M.; Vanoli, G.P. Design of the building envelope: A novel multi-objective approach for the optimization of energy performance and thermal comfort. Sustainability 2015, 7, 10809–10836. [Google Scholar] [CrossRef] [Green Version]
  22. Zhu, L.; Hurt, R.; Correia, D.; Boehm, R. Detailed energy saving performance analyses on thermal mass walls demonstrated in a zero energy house. Energy Build. 2009, 41, 303–310. [Google Scholar] [CrossRef]
  23. Rattanongphisat, W.; Rordprapat, W. Strategy for energy efficient buildings in tropical climate. In Energy Procedia, Proceedings of the 2013 International Conference on Alternative Energy in Developing Countries and Emerging Economies Strategy, Bangkok, Thailand, 30–31 May 2013; Elsevier Procedia: Amsterdam, The Netherlands, 2014; Volume 52, pp. 10–17. [Google Scholar]
  24. Sadeghifam, A.N.; Marsono, A.K.; Kiani, I.; Isikdag, U.; Bavafa, A.A.; Tabatabaee, S. Energy analysis of wall materials using building information modeling (BIM) of public buildings in the tropical climate countries. J. Teknol. 2016, 78, 35–41. [Google Scholar] [CrossRef] [Green Version]
  25. Kisilewicz, T. On the role of external walls in the reduction of energy demand and the mitigation of human thermal discomfort. Sustainability 2019, 11. [Google Scholar] [CrossRef] [Green Version]
  26. Strzałkowski, J.; Garbalińska, H. Thermal simulation of building performance with different loadbearing materials. Iop Conf. Ser. Mater. Sci. Eng. 2018, 415, 012014. [Google Scholar]
  27. Sadineni, S.B.; Madala, S.; Boehm, R.F. Passive building energy savings: A review of building envelope components. Renew. Sustain. Energy Rev. 2011, 15, 3617–3631. [Google Scholar] [CrossRef]
  28. Gorantla, K.K.; Shaik, S.; Settee, A.B.T.P. Simulation of various wall and window glass material for energy efficient building design. Key Eng. Mater. 2016, 692, 9–16. [Google Scholar] [CrossRef]
  29. Watson, D. Climatic Design: Energy-Efficient Building Principles and Practices; McGraw Hill Higher Education: New York, NY, USA, 1983; ISBN 978-0070684782. [Google Scholar]
  30. Givoni, B. Man, Climate and Architecture, 2nd ed.; Applied Science Publishers: London, UK, 1976; pp. 1–144. ISBN 978-0853346784. [Google Scholar]
  31. Schiavoni, S.; D’Alessandro, F.; Bianchi, F.; Asdrubali, F. Insulation materials for the building sector: A review and comparative analysis. Renew. Sustain. Energy Rev. 2016, 62, 988–1011. [Google Scholar] [CrossRef]
  32. Asan, H. Numerical computation of time lags and decrement factors for different building materials. Build. Environ. 2006, 41, 615–620. [Google Scholar] [CrossRef]
  33. Toure, P.M.; Dieye, Y.; Gueye, P.M.; Faye, M.; Sambou, V. Influence of envelope thickness and solar absorptivity of a test cell on time lag and decrement factor. J. Build. Phys. 2020, 43, 338–350. [Google Scholar] [CrossRef]
  34. Chi, F.; Wang, Y.; Wang, R.; Li, G.; Peng, C. An investigation of optimal window-to-wall ratio based on changes in building orientations for traditional dwellings. Sol. Energy 2020, 195, 64–81. [Google Scholar] [CrossRef]
  35. Yarramsetty, S.; Rohullah, M.S.; Sivakumar, M.V.N.; Raj, P.A. An investigation on energy consumption in residential building with different orientation: A BIM approach. Asian J. Civ. Eng. 2020, 21, 253–266. [Google Scholar] [CrossRef]
  36. Nayak, J.K.; Prajapati, J.A. Handbook on Energy Conscious. Buildings; Indian institute of technology, Bombay and Solar energy Center and Ministry of Non-Conventional Energy Sources: Bombay, India, 2006. [Google Scholar]
  37. Vincelas, F.F.C.; Ghislain, T.; Robert, T. Effects of the type of building materials on the thermal behavior of building in the hot dry climates: A case study of Maroua city, Cameroon. Int. J. Innov. Sci. Eng. Technol. 2017, 4, 1–13. [Google Scholar]
  38. Wonorahardjo, S.; Sutjahja, I.M.; Mardiyati, Y.; Andoni, H.; Thomas, D.; Achsani, R.A.; Steven, S. Characterising thermal behaviour of buildings and its effect on urban heat island in tropical areas. Int. J. Energy Env. Eng. 2020, 11, 129–142. [Google Scholar] [CrossRef] [Green Version]
  39. Evangelisti, L.; Guattari, C.; Gori, P.; Vollaro, R.D.L. In situ thermal transmittance measurements for investigating differences between wall models and actual building performance. Sustainability 2015, 7, 10388–10398. [Google Scholar] [CrossRef] [Green Version]
  40. Zheng, K.; Cho, Y.K.; Wang, C.; Li, H. Noninvasive Residential Building Envelope R -Value Measurement Method Based on Interfacial Thermal Resistance. J. Archi.T. Eng. 2016, 22, A4015002. [Google Scholar] [CrossRef]
  41. Corasaniti, S.; Potenza, M.; Coppa, P.; Bovesecchi, G. Comparison of different approaches to evaluate the equivalent thermal diffusivity of building walls under dynamic conditions. Int. J. Therm. Sci. 2020, 150, 106232. [Google Scholar] [CrossRef]
  42. Demezhko, D.Y. Measurements of the thermal effusivity of solid materials by the contact method. Instruments Exp. Technol. 2011, 54, 867–871. [Google Scholar] [CrossRef]
  43. Verbeke, S.; Audenaert, A. Thermal inertia in buildings: A review of impacts across climate and building use. Renew. Sustain. Energy Rev. 2018, 82, 2300–2318. [Google Scholar] [CrossRef]
  44. Reilly, A.; Kinnane, O. The impact of thermal mass on building energy consumption. Appl. Energy 2017, 198, 108–121. [Google Scholar] [CrossRef] [Green Version]
  45. Kuczyński, T.; Staszczuk, A. Experimental study of the influence of thermal mass on thermal comfort and cooling energy demand in residential buildings. Energy 2020, 195, 116984. [Google Scholar]
  46. Gregory, K.; Moghtaderi, B.; Sugo, H.; Page, A. Effect of thermal mass on the thermal performance of various Australian residential constructions systems. Energy Build. 2008, 40, 459–465. [Google Scholar] [CrossRef]
  47. Badea, N. Design for Micro-Combined Cooling, Heating and Power Systems: Stirling Engines and Renewable Power Systems; Springer: Berlin/Heidelberg, Germany, 2014; ISBN 978-1-4471-6254-4. [Google Scholar]
  48. Hsieh, C.; Wu, I. Applying building information modelling in evaluating building energy performance. Gerontechnology 2012, 11, 170. [Google Scholar] [CrossRef]
  49. Kontoleon, K.J.; Bikas, D.K. The effect of south wall’s outdoor absorption coefficient on time lag, decrement factor and temperature variations. Energy Build. 2007, 39, 1011–1018. [Google Scholar] [CrossRef]
  50. El Fgaier, F.; Lafhaj, Z.; Antczak, E.; Chapiseau, C. Dynamic thermal performance of three types of unfired earth bricks. Appl. Therm. Eng. 2016, 93, 377–383. [Google Scholar] [CrossRef]
  51. Sun, C.; Shu, S.; Ding, G.; Zhang, X.; Hu, X. Investigation of time lags and decrement factors for different building outside temperatures. Energy Build. 2013, 61, 1–7. [Google Scholar] [CrossRef]
  52. Soudani, L.; Woloszyn, M.; Fabbri, A.; Morel, J.C.; Grillet, A.C. Energy evaluation of rammed earth walls using long term in-situ measurements. Sol. Energy 2017, 141, 70–80. [Google Scholar] [CrossRef]
  53. Feng, G.; Sha, S.; Xu, X. Analysis of the Building Envelope Influence to Building Energy Consumption in the Cold Regions. In Procedia Engineering, Proceeding of the 8th International Cold Climate HVAC 2015 Conference, Dalian, China, 20–23 October 2015; Elsevier Procedia: Amsterdam, The Netherlands, 2016; Volume 146, pp. 244–250. [Google Scholar]
  54. Peng, H.; Li, M.; Lou, S.; He, M.; Huang, Y.; Wen, L. Investigation on spatial distribution and thermal properties of typical residential buildings in South China’s Pearl River Delta. Energy Build. 2020, 206, 109555. [Google Scholar] [CrossRef]
  55. Depecker, P.; Menezo, C.; Virgone, J.; Lepers, S. Design of buildings shape and energetic consumption. Build. Environ. 2001, 36, 627–635. [Google Scholar] [CrossRef]
  56. Ratti, C.; Raydan, D.; Steemers, K. Building form and environmental performance: Archetypes, analysis and an arid climate. Energy Build. 2003, 35, 49–59. [Google Scholar] [CrossRef]
  57. Lylykangas, K. Shape Factor as an Indicator of Heating Energy Demand. In Proceedings of the 15 Internationales Holzbau-Forum 09, Garmisch, Germany, 2 December 2009. [Google Scholar]
  58. Lim, H.S.; Kim, G. Analysis of Energy Performance on Envelope Ratio Exposed to the Outdoor. Adv. Civ. Eng. 2018. [Google Scholar] [CrossRef] [Green Version]
  59. Liu, L.; Wu, D.; Li, X.; Hou, S.; Liu, C.; Jones, P. Effect of geometric factors on the energy performance of high-rise office towers in Tianjin, China. Build. Simul. 2017, 10, 625–641. [Google Scholar] [CrossRef] [Green Version]
  60. Premrov, M.; Leskovar, V.Ž.; Mihalič, K. Influence of the building shape on the energy performance of timber-glass buildings in different climatic conditions. Energy 2016, 108, 201–211. [Google Scholar] [CrossRef]
  61. Dutta, A.; Samanta, A.; Neogi, S. Influence of orientation and the impact of external window shading on building thermal performance in tropical climate. Energy Build. 2017, 139, 680–689. [Google Scholar] [CrossRef]
  62. Raji, B.; Tenpierik, M.J.; Van den Dobbelsteen, A. Early-stage design considerations for the energy-efficiency of high-rise office buildings. Sustainability 2017, 9, 623. [Google Scholar] [CrossRef] [Green Version]
  63. Valladares-Rendón, L.G.; Schmid, G.; Lo, S.L. Review on energy savings by solar control techniques and optimal building orientation for the strategic placement of façade shading systems. Energy Build. 2017, 140, 458–479. [Google Scholar] [CrossRef]
  64. Wang, W.; Rivard, H.; Zmeureanu, R. Floor shape optimization for green building design. Adv. Eng. Informatics. 2006, 20, 363–378. [Google Scholar] [CrossRef]
  65. Kiprop, J. WorldAtlas. Available online: https://www.worldatlas.com/articles/what-is-a-tropical-climate.html (accessed on 15 April 2020).
  66. Balasubramanian, A. World Climate Zones; Centre for Advanced Studies in Earth Science, University of Mysore: Mysore, India, 2013. [Google Scholar]
  67. Kottek, M.; Grieser, J.; Beck, C.; Rudolf, B.; Rubel, F. World map of the Köppen-Geiger climate classification updated. Meteorol Zeitschrift. 2006, 15, 259–263. [Google Scholar] [CrossRef]
  68. Integrated Environmental Solutions Virtual Environment (IES-VE). Available online: https://iesve.com/ (accessed on 24 April 2020).
  69. Ji, Y.; Fitton, R.; Swan, W.; Webster, P. Assessing overheating of the UK existing dwellings—A case study of replica Victorian end terrace house. Build. Environ. 2014, 77, 1–11. [Google Scholar] [CrossRef]
  70. Ji, Y.; Lee, A.; Swan, W. Building dynamic thermal model calibration using the Energy House facility at Salford. Energy Build. 2019, 191, 224–234. [Google Scholar] [CrossRef] [Green Version]
  71. Ben, H.; Steemers, K. Energy retrofit and occupant behaviour in protected housing: A case study of the Brunswick Centre in London. Energy Build. 2014, 80, 120–130. [Google Scholar] [CrossRef]
  72. Tong, J.C.K.; Tse, J.M.Y.; Jones, P.J. Development of thermal evaluation tool for detached houses in Mongolia. Energy Build. 2018, 173, 81–90. [Google Scholar] [CrossRef]
  73. Moran, F.; Blight, T.; Natarajan, S.; Shea, A. The use of Passive House Planning Package to reduce energy use and CO2 emissions in historic dwellings. Energy Build. 2014, 75, 216–227. [Google Scholar] [CrossRef]
  74. IES-VE. IES-VE User Guide, ApacheSim Calculation Methods. 2011. Available online: http://www.iesve.com/downloads/help/Thermal/Reference/ApacheSimCalculationMethods.pdf (accessed on 24 April 2020).
  75. A Technical Manual for SBEM, UK Volume. 2018. Available online: https://www.uk-ncm.org.uk/filelibrary/SBEM-Technical-Manual_v5.2.g_20Nov15.pdf (accessed on 8 April 2020).
  76. Khatun, M.A.; Rashid, M.B.; Hygen, H.O. Climate of Bangladesh, MET Report; Bangladesh Meteorological Department and Norwegian Meteorological Institute: Decca, Bangladesh, 2016; ISSN 2387-4201. [Google Scholar]
  77. Bangladesh Meteorological Department. Available online: www.bmd.gov.bd (accessed on 4 March 2020).
  78. Zhu, Z.; Jin, X.; Li, Q.; Meng, Q. Experimental Study on the Thermal Performance of Ventilation Wall with Cladding Panels in Hot and Humid Area. Procedia Eng. 2015, 121, 410–414. [Google Scholar] [CrossRef] [Green Version]
  79. Braham, D.; Barnard, N.; Jaunzens, D. BRE Digest 454 Part. 1: Thermal Mass in Office Buildings: An Introduction; Building Research Establishment: Watford, UK, 2001; ISBN 1-86081-466-472. [Google Scholar]
  80. Fernandez, N.P. Thermal Performance of Buildings with Post-Tensioned Timber Structure Compared with Concrete and Steel Alternatives; University of Canterbury, 2012; Available online: https://core.ac.uk/download/pdf/35467597.pdf (accessed on 6 May 2020).
  81. Andelkovic, B.V.; Stojanvic, B.V.; Stojiljkovic, M.M.; Janevski, J.N.; Stojanovic, M.B. Thermal mass impact on energy performance of a low, medium and heavy mass building in Belgrade. Therm. Sci. 2012, 16, S507–S520. [Google Scholar]
  82. Aste, N.; Torre, S.D.; Talamo, C.; Adhikari, R.S.; Rossi, C. Innovative Models for Sustainable Development in Emerging African Countries; Springer Nature: Basel, Switzerland, 2015; ISBN 978-3-030-33322-5. [Google Scholar]
  83. Vijayalakshmi, M.M.; Natarajan, E.; Shanmugasundaram, V. Thermal behaviour of building wall elements. J. Appl Sci. 2006, 6, 3128–3133. [Google Scholar]
  84. Ozel, M. Thermal performance and optimum insulation thickness of building walls with different structure materials. Appl. Eng. 2011, 31, 3854–3863. [Google Scholar] [CrossRef]
  85. De Saulles, T. Thermal Mass Explained; CentER (The Concrete Centre): Camberley, UK, 2011; ISBN 978-1-904818-71. [Google Scholar]
Figure 1. Heat transfer process across the (a) solid wall [36]; (b) composite wall.
Sustainability 12 04892 g001
Figure 2. Thermal image of (a) mud house; (b) fired brick house; (c) C.I sheet house.
Sustainability 12 04892 g002
Figure 3. Heatwave propagation through an opaque wall and representation of TL and DF.
Sustainability 12 04892 g003
Figure 4. Building geometry.
Sustainability 12 04892 g004
Figure 5. 10-year (2005–2015) average of maximum, mean, and minimum monthly air temperatures of the capital city Dhaka, Bangladesh [77].
Sustainability 12 04892 g005
Figure 6. 10-year (2005–2015) average relative humidity and rainfall of the capital city Dhaka, Bangladesh [77].
Sustainability 12 04892 g006
Figure 7. Building plan orientations for the simulation study.
Sustainability 12 04892 g007
Figure 8. Different wall construction types.
Sustainability 12 04892 g008
Figure 9. The three possible situations for the study of building shape factor.
Sustainability 12 04892 g009
Figure 10. Outdoor and indoor temperatures for four different wall material constructions (a) summer day; (b) winter day.
Sustainability 12 04892 g010
Figure 11. Outdoor and indoor temperatures for wall construction of different thicknesses of UFB (a) summer day; (b) winter day.
Sustainability 12 04892 g011
Figure 12. Simulation results for different orientations of modelled space (a) indoor room temperatures for summer day; (b) indoor room temperatures for winter day, (c) total yearly energy consumptions.
Sustainability 12 04892 g012
Figure 13. Indoor room temperatures for different wall constructions (a) summer day; (b) winter day.
Sustainability 12 04892 g013aSustainability 12 04892 g013b
Figure 14. Indoor room temperatures of Wall-2 and Wall-3 (a) summer day; (b) winter day.
Sustainability 12 04892 g014
Table 1. Basic and derived thermal properties for different materials and yearly energy consumptions of the buildings.
MaterialsCFBACBHCBUFBCavity InsulationInsulation Board
Thickness (mm)2222222221252223004005040
Density (kg/m3)1922750230017881788178817883232
Thermal conductivity (W/mK)0.730.241.630.900.900.900.900.080.04
Specific heat capacity (J/kgK)83710001000545545545545837837
Thermal diffusivity
(10−7 m2/s)
4.523.207.099.239.239.239.23
Thermal effusivity
(Ws1/2/m2K)
1081.45424.261936.23936.49936.49936.49936.49
U-value (W/m2K)2.100.913.093.242.401.991.63
R-value (m2K/W)0.300.930.150.140.250.330.44
DF (Summer day)0.550.400.681.781.020.630.35
Thermal mass (kJ/m2K)160.877523060.9097.4597.4597.45
Yearly energy consumption (MWh)17.6011.7022.6024.8019.4017.1015.30
Table 2. Thermal performance parameter of different wall configurations and energy consumption for each wall type.
Wall IDDescription of Walls (From Outer to Inner Side)U-Value (W/m2K)R-Value (m2K/W)DF
(Summer Day)
Thermal Mass (kJ/m2k)Yearly Energy Consumption (MWh)
W-113 mm plaster, 222 mm common fired brick, 13 mm plaster1.570.470.34147.7615
W-213 mm plaster, 222 mm common fired brick, 40 mm insulation board, 13 mm plaster 0.641.400.167.8010.20
W-313 mm plaster, 40 mm insulation board, 222 mm common fired brick, 13 mm plaster0.641.400.08147.7610.20
W-413 mm plaster, 105 mm common fired brick, 50 mm clear cavity, 105 mm common fired brick, 13 mm plaster1.250.630.24147.7613.40
W-513 mm plaster, 105 mm common fired brick, 50 mm clear cavity, 105 mm common fired brick, 40 mm insulation board, 13 mm plaster0.581.560.117.809.90
W-613 mm plaster, 40 mm insulation board, 105 mm common fired brick, 50 mm clear cavity, 105 mm common fired brick, 13 mm plaster0.581.560.05147.769.80
W-713 mm plaster, 105 mm common fired brick, 50 mm cavity insulation, 105 mm common fired brick, 13 mm plaster0.781.110.11147.7611
W-813 mm plaster, 105 mm common fired brick, 25 mm clear cavity, 25 mm cavity insulation, 105 mm common fired brick, 13 mm plaster0.880.960.14147.7611.50
W-9 (a)13 mm plaster, 105 mm common fired brick, 50 mm clear cavity, 100 mm aerated concrete block, 13 mm plaster0.930.900.3073.0511.80
W-9 (b)13 mm plaster, 105 mm common fired brick, 50 mm clear cavity, 100 mm heavyweight concrete block, 13 mm plaster1.390.550.22207.9014.10
W-10 (a)13 mm plaster, 105 mm common fired brick, 50 mm clear cavity, 100 mm aerated concrete block, 40 mm insulation board, 13 mm plaster0.501.830.157.809.50
W-10 (b)13 mm plaster, 105 mm common fired brick, 50 mm clear cavity, 100 mm heavyweight concrete block, 40 mm insulation board, 13 mm plaster0.611.480.107.8010
W-11 (a)13 mm plaster, 40 mm insulation board, 105 mm common fired brick, 50 mm clear cavity, 100 mm aerated concrete block, 13 mm plaster0.501.830.0773.059.40
W-11 (b)13 mm plaster, 40 mm insulation board, 105 mm common fired brick, 50 mm clear cavity, 100 mm heavyweight concrete block, 13 mm plaster0.611.480.05207.9010
W-12 (a)13 mm plaster, 105 mm common fired brick, 50 mm cavity insulation, 100 mm aerated concrete block, 13 mm plaster0.641.380.1773.0510.30
W-12 (b)13 mm plaster, 105 mm common fired brick, 50 mm cavity insulation, 100 mm heavyweight concrete block, 13 mm plaster0.841.030.09207.9011.30
W-13 (a)13 mm plaster, 105 mm common fired brick, 25 mm clear cavity, 25 mm cavity insulation, 100 mm aerated concrete block, 13 mm plaster0.711.230.2073.0510.60
W-13(b)13 mm plaster, 105 mm common fired brick, 25 mm clear cavity, 25 mm cavity insulation, 100 mm heavyweight concrete block, 13 mm plaster0.950.880.12207.9011.90
Table 3. Yearly energy consumptions for the different shapes of the studied buildings.
Building Form.Height
(m)
  V   ( m 3 )   S e   ( m 2 )   A t e m p   ( m 2 )   S e V     S e A t e m p     A t e m p V   Yearly Energy Consumption (MWh)
Case no. 01
A6432216720.503.000.1717.60
B6432264720.613.700.1719.80
C6432324720.754.500.1722.50
Case no. 02
D12432312360.729.000.0819.00
E18432360240.8315.000.0620.20
F24432432181.0024.000.0422.90
Case no. 03
A6432216720.503.000.1717.60
G9288216320.756.800.1113.70
H12216216181.0012.000.0812.30

