Article

Design of Kinetic-Energy Harvesting Floors †

by
Thitima Jintanawan
1,
Gridsada Phanomchoeng
1,2,*,
Surapong Suwankawin
3,
Phatsakorn Kreepoke
1,
Pimsalisa Chetchatree
1 and
Chanut U-viengchai
3
1
Department of Mechanical Engineering, Chulalongkorn University, Bangkok 10330, Thailand
2
Smart Mobility Research Unit, Chulalongkorn University, Bangkok 10300, Thailand
3
Department of Electrical Engineering, Chulalongkorn University, Bangkok 10330, Thailand
*
Author to whom correspondence should be addressed.
This paper is an extended and revised article presented at the International Conference on Sustainable Energy and Green Technology 2019 (SEGT 2019) on 11–14 December 2019 in Bangkok, Thailand.
Energies 2020, 13(20), 5419; https://doi.org/10.3390/en13205419
Submission received: 18 September 2020 / Revised: 9 October 2020 / Accepted: 12 October 2020 / Published: 16 October 2020
(This article belongs to the Special Issue Green Energy Technology)

Abstract

:
Alternative energy generated from people’s footsteps in a crowded area is sufficient to power smart electronic devices with low consumption. This paper aims to present the development of an energy harvesting floor—called Genpath—using a rotational electromagnetic (EM) technique to generate electricity from human footsteps. The dynamic models of the electro-mechanical systems were developed using MATLAB®/Simulink to predict the energy performances of Genpath and help fine-tune the design parameters. The system in Genpath comprises two main parts: the EM generator and the Power Management and Storage (PMS) circuit. For the EM generator, the conversion mechanism for linear translation to rotation was designed by using the rack-pinion and lead-screw mechanism. Based on the simulation analysis, the averaged energy of the lead-screw model is greater than that of the rack-pinion model. Thus, prototype-II of Genpath with 12-V-DC generator, lead-screw mechanism was recently built. It shows better performance when compared to the previous prototype-I of Genpath with 24-V-DC-generator, rack-pinion mechanism. Both prototypes have an allowable displacement of 15 mm. The Genpath prototype-II produces an average energy of up to 702 mJ (or average power of 520 mW) per footstep. The energy provided by Genpath prototype-II is increased by approximately 184% when compared to that of the prototype-I. The efficiency of the EM-generator system is ~26% based on the 2-W power generation from the heel strike of a human’s walk in one step. Then, the PMS circuit was developed to harvest energy into the batteries and to supply the other part to specific loads. The experiment showed that the designed PMS circuit has the overall efficiency of 74.72%. The benefit of the design system is for a lot of applications, such as a wireless sensor and Internet of Thing applications.

1. Introduction

The smart internet of things (IoT) has been brought to the world’s attention lately. The smart IoT-devices, e.g., Radio-frequency identification (RFID) sensor, Global Positioning System (GPS) tracking, etc., are widely used in the crowded areas such as airports and public stations, commercial buildings, and department stores [1,2]. Seeking an alternative energy for such devices, it was noticeable that a large population can generate power from their footsteps, grabbing the authors’ attention. Therefore, the ultimate goal was to develop an affordable Vibration Energy Harvesting (VEH) system—called Genpath—the smart floor capable of conversing kinetic energy from thousands of footsteps into electrical energy. Genpath can be installed in places with a crowded population for harvesting energy.
Energy harvesting from human motions is an interesting and applicable issue, thanks to the ultra-low power consumption of electronic devices lately [3]. Focused on walking, the energy produced by the heel strike of a person’s walk is 1–5 J or 2–20 W per step [4]. There are various commercial products which harvest energy from people’s walks, such as energy storage shoes [5] and the energy floor [6,7,8,9,10,11]. Pavegen and Energy Floors have produced a commercial system that generates power from footsteps [6,7]. The Pavegen system, using electromagnetic generators, can produce 2 to 4 joules, or around 5 watts of power of off-grid electrical energy per step. The Energy Floors focuses on harvesting energy from humans dancing and playing games. Dutch Railways built a novel phone charger for Utrecht Central Station using a swing set called Play for Power [8]. The system turns kinetic energy from the swings into power dispensed through charging cables. However, few technical details of those products are published thus far.
Kinetic energy, among practical energy-harvesting sources, comes in various forms, e.g., seismic noise, vibration of rotating machinery, motions of vehicles and humans, etc. Vibrational energy harvesting (VEH) is the concept of converting kinetic energies present in the environment into electrical energy. There are two main techniques of kinetic-to-electrical energy conversion applicable to the design of the VEH floor: i.e., piezoelectric generators and electromagnetic generators [12]. The piezoelectric generator produces an electrical charge and energy when deformed under mechanical stress. Piezoelectric generators can provide high voltage levels up to several volts. With its compact size, the piezoelectric generator gives high-power density per unit of volume [13]. The electromagnetic (EM) generator generates an electromotive force (EMF) and thus energy when the permanent magnet relatively moves through the coil. Both techniques of VEH discussed are suitable for generating energy for low-power electronic instruments. However, the piezoelectric generator effectively gives out maximum energy at around its natural frequencies, i.e., higher than 200 Hz, whereas the bandwidth of human motion is between 1–10 Hz. In contrast, the electromagnetic generator is effective in the frequency range of 2–20 Hz. Hence, it is more suitable for harvesting energy from human movements. In addition, the electromagnetic generators also yield higher power density and their costs are much lower than the piezoelectric generators [14]. For the piezoelectric generator, it needs a structural design not only to optimize the power density but also to protect the piezo element itself due to its fragility, while the structural design of the EM generator is much simpler for the application of a VEH floor.
There are also two types of the EM generator in terms of energy-conversion mechanisms: linear oscillation to electrical energy and rotation to electrical energy [15]. The mechanism of linear oscillation conversion is simpler, but it requires the larger amplitude of excitation to produce electricity, whereas human pedals are random in vibration with low amplitude. Consequently, the rotational EM generator was chosen for the VEH floor to convert kinetic energy from people’s footsteps into electrical energy.
The objective of the paper is to design a simple but efficient VEH floor embedded with the rotational electromagnetic (EM) generator. To achieve this purpose, the dynamic models of the electro-mechanical systems were developed using MATLAB®/Simulink for predicting the energy performances of the VEH floors and fine-tuning the design parameters. The entire system consists of two main parts of (1) the EM generator, including the translation-to-rotation conversion mechanism, and (2) the Power Management and Storage (PMS) circuit. For simplicity, a direct-current (DC) generator was used in the design to produce electricity. The rack-pinion and lead-screw mechanisms were adopted to converse a linear motion from a human’s pedal to a rotation of the generator’s rotor. The PMS circuit with extra low energy consumption was designed to simultaneously convert and store electrical energy. The paper is organized into the following sections. In Section 2, the design of each sub-system is described in detail. Then, the installation and demonstration of application are presented in Section 3. Finally, the conclusion is stated in Section 4.

2. Design of Subsystems

The development of the VEH floor—called Genpath—capable of harvesting kinetic energy from people’s footsteps and converting it to electrical energy is presented. In the process of energy generation, the rotational EM generator is deployed as it is independent from the resonant frequency and achieves higher energy density when compared to the linear EM generators [15]. Figure 1 shows the diagram of the complete system in Genpath. In Figure 1, when the force from a footstep is applied on the floor-tile, the mechanism for a movement-converter changes the translation of the floor-tile to the rotation of the EM generator to induce voltage. With the connected PMS circuit, the electrical voltage and power generated by the EM generator is processed. The harvested power is then stored in the rechargeable batteries so it can be supplied to the smart IoT-devices with low energy consumption. Two main parts, i.e., (1) the system of EM generator, including the movement-converter and (2) the system of PMS circuit, are presented in detail in the following subsections.

2.1. The System of EM Generator

2.1.1. Conceptual Design

Figure 2 shows the two proposed designs of the generator system in Genpath, with the only difference in the mechanisms for the movement converter. A set of Genpath comprises a floor-tile block embedded with the translation-to-rotation conversion mechanism which is connected to the DC generator and the PMS circuit board. The entire dimension is 40 × 40 × 10 cm3 with the maximum allowable displacement of 15–20 mm. Two types of mechanisms, rack pinion and lead screw, are used to convert the translation from a footstep to the rotation of the generator. For the rack-pinion mechanism in Figure 2a, the pinion connected to the floor-tile drives the DC-generator shaft through the additional pinion gears which help transform low-speed power to high-speed power. For the lead-screw mechanism in Figure 2b, the nut fixed to the floor-tile’s center moves up and down and drives the lead screw to rotate about its axis. The set of bevel gears transmits the rotation from the lead screw to the DC generator and changes the direction of rotation by 90°. The rotation of the DC generator in both designs then induces the voltage. The springs with the maximum displacement of 15–20 mm connected to the four corners of the block help restore the top floor-tile back to the equilibrium position. Considering the limits of the dimension and the displacement, thus, the small size of 12/24-V-DC motor was decided for the DC generator.

2.1.2. Analysis

To predict the energy performances of the EM-generator designs, the dynamic models of the two electro-mechanical systems, shown in Figure 2, were developed using MATLAB®/Simulink. Figure 3a,b show the physical models corresponding to the two systems in Figure 2a,b, respectively. In Figure 3a, the system consists of the elements of rack, pinion and gear on the mechanical side, and the DC generator (with its own resistance, R G , and inductance, L ) connected to the load R L on the electrical side. Contrastively, the elements of rack, pinion and gear are replaced by the nut, lead screw, and bevel gears for the system in Figure 3b. The footstep force F ( t ) is modeled as the arbitrary function reported in [9] and presented in Figure 4. The spring with a maximum compression of 15–20 mm provides the restoring force F s to restore the floor-tile back to the equilibrium position. The dynamic equations governing the electro-mechanical models of both designs are formulated as follows.
For the electrical side in Figure 3, Kirchhoff’s voltage law yields
V L + V R G + V R L V G = 0 ,
where V G is the back emf of the generator; i.e., V G = K t ω G where K t is the back emf (torque) constant. In addition, V L , V R G and V R L are the voltages across the generator’s inductor, generator’s resistor and load’s resistor, respectively. With the voltage-current relations, (1) becomes
i ˙ + ( R G + R L L ) i ( K t L ) ω G = 0 ,
where i is the current, K t is the back emf (torque) constant, ω G is the generator rotational speed, L is the inductance of the generator, R G is the resistance of the generator and R L is the resistance of the load. Equation (2) is the differential equation governing the armature winding of the generator.
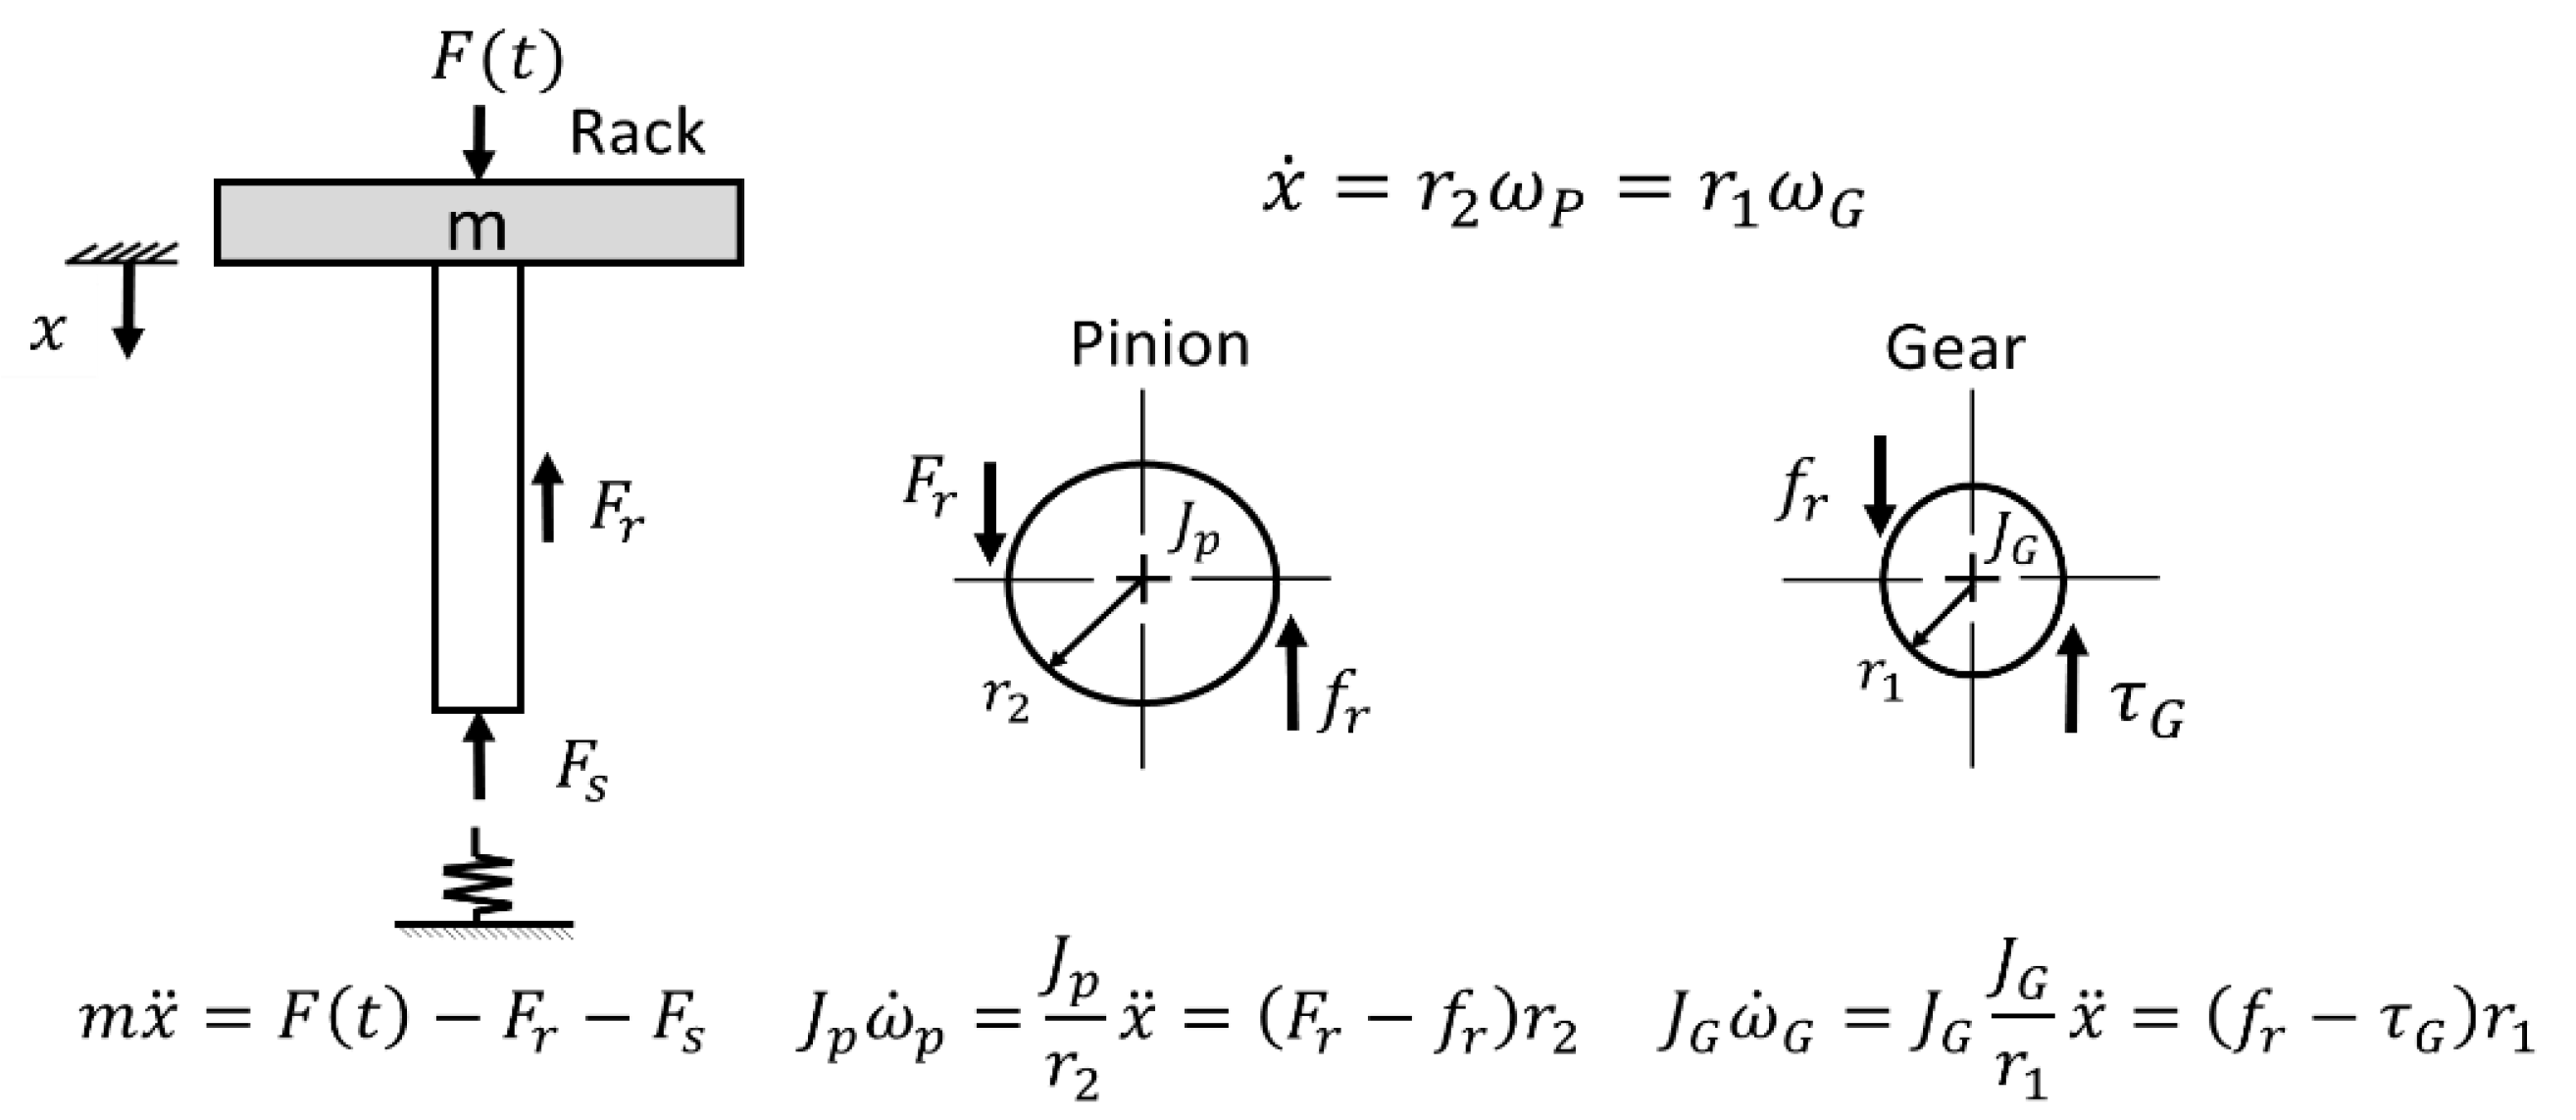
From the free body diagram (FBD) of the mechanical system with the rack and pinion in Figure 5, Newton’s second law and the law of angular momentum describe the translation of the rack, and the rotations of the pinion and the generator rotor, respectively, as
m x ¨ = F ( t ) F r F s ,
J p ω ˙ p = J p x ¨ r 2 = ( F r f r ) r 2 ,
J G ω ˙ G = J G x ¨ r 1 = ( f r τ G ) r 1 ,
where m is the mass of the plate and rack, and J p and J G are the moments of inertia of the pinion and the gear. x is the displacement of the rack, ω p is the angular velocity of the pinion, ω G is the angular velocity of the gear. In (3)–(5), F ( t ) is the input force, F s is the restoring spring and damper force, F r is the friction force between the rack and pinion, f r is the friction force between the pinion and gear. In addition, τ G is the electromagnetic torque of the DC generator, where τ G = K t i , and r 1 and r 2 are the radius of the gear and pinion, respectively.
Eliminating F r and f r from (3)–(5), the differential equation governing dynamics of the mechanical system with the rack and pinion is obtained as
M x ¨ + K t r 1 i + F s = F ( t ) ,
where M = ( m + J p r 2 2 + J G r 1 2 ) . Then the governing equations of the electro-mechanical system from combining (2) and (6) are
[ i ˙ x ˙ x ¨ ] = [ ( R G + R L L ) 0 K t L r 1 0 0 1 K t M r 1 0 0 ] [ i x x ˙ ] + [ 0 0 F ( t ) F s M ] ,
Similarly, from the FBD of the mechanical system with lead and screw as shown in Figure 6, the equations govern the translation of the nut and the rotations of the lead screw and the generator rotor, respectively, are
m x ¨ = F ( t ) F a F s ,
J 1 θ ¨ 1 = 2 π J 1 l x ¨ = Γ T B ,
J G θ ¨ 2 = 2 π J G l x ¨ = T B τ G ,
where m is the mass of the floor-tile and the nut, J 1 is the moment of inertia of the lead screw and J G is the moment of inertia of the bevel gear. l is the pitch of the lead screw, x is the displacement of the plate and nut, θ 1   is the angular position of the lead screw and θ 2 is the angular position of the bevel gear. In addition, F ( t ) is the applied force from the footstep, F s is the restoring spring and damper forces, F a is the friction force between nut and lead screw, T B is the friction torque of the bevel gear, τ G is the electromagnetic torque of the DC generator; where τ G = K t i . Note that Γ in (9) is the transmitted torque from the nut to the lead screw which is proportional to F a as
Γ = Δ F a ,
where Δ = l 2 π η t h r e a d η t h r u s t , with η t h r e a d and η t h r u s t are the efficiencies of the thread and the thrust bearing, respectively.
By rearranging (8)–(10), the equations become
J e q θ ¨ 1 + K t Δ i + F s = F ( t ) ,
2 π J e q l x ¨ + K t Δ i + F s = F ( t ) ,
where J e q = m l 2 π + ( J 1 + J G ) Δ is the equivalent moment of inertia corresponding to the mass of the plate and nut m, and the mass moments of inertia of the lead screw and bevel gear J1 and JG, respectively. By combining (2) and (11)–(12), the equations governing the electro-mechanical system with the lead and screw design are obtained as
[ i ˙ θ 1 ˙ θ 1 ¨ ] = [ ( R G + R L L ) 0 K t L 0 0 1 K t J e q Δ 0 0 ] [ i θ 1 θ 1 ˙ ] + [ 0 0 F ( t ) F s J e g ] ,
or
[ i ˙ x ˙ x ¨ ] = [ ( R G + R L L ) 0 K t L 0 0 1 l K t 2 π J e q Δ 0 0 ] [ i x x ˙ ] + [ 0 0 l ( F ( t ) F s ) 2 π J e g ] ,
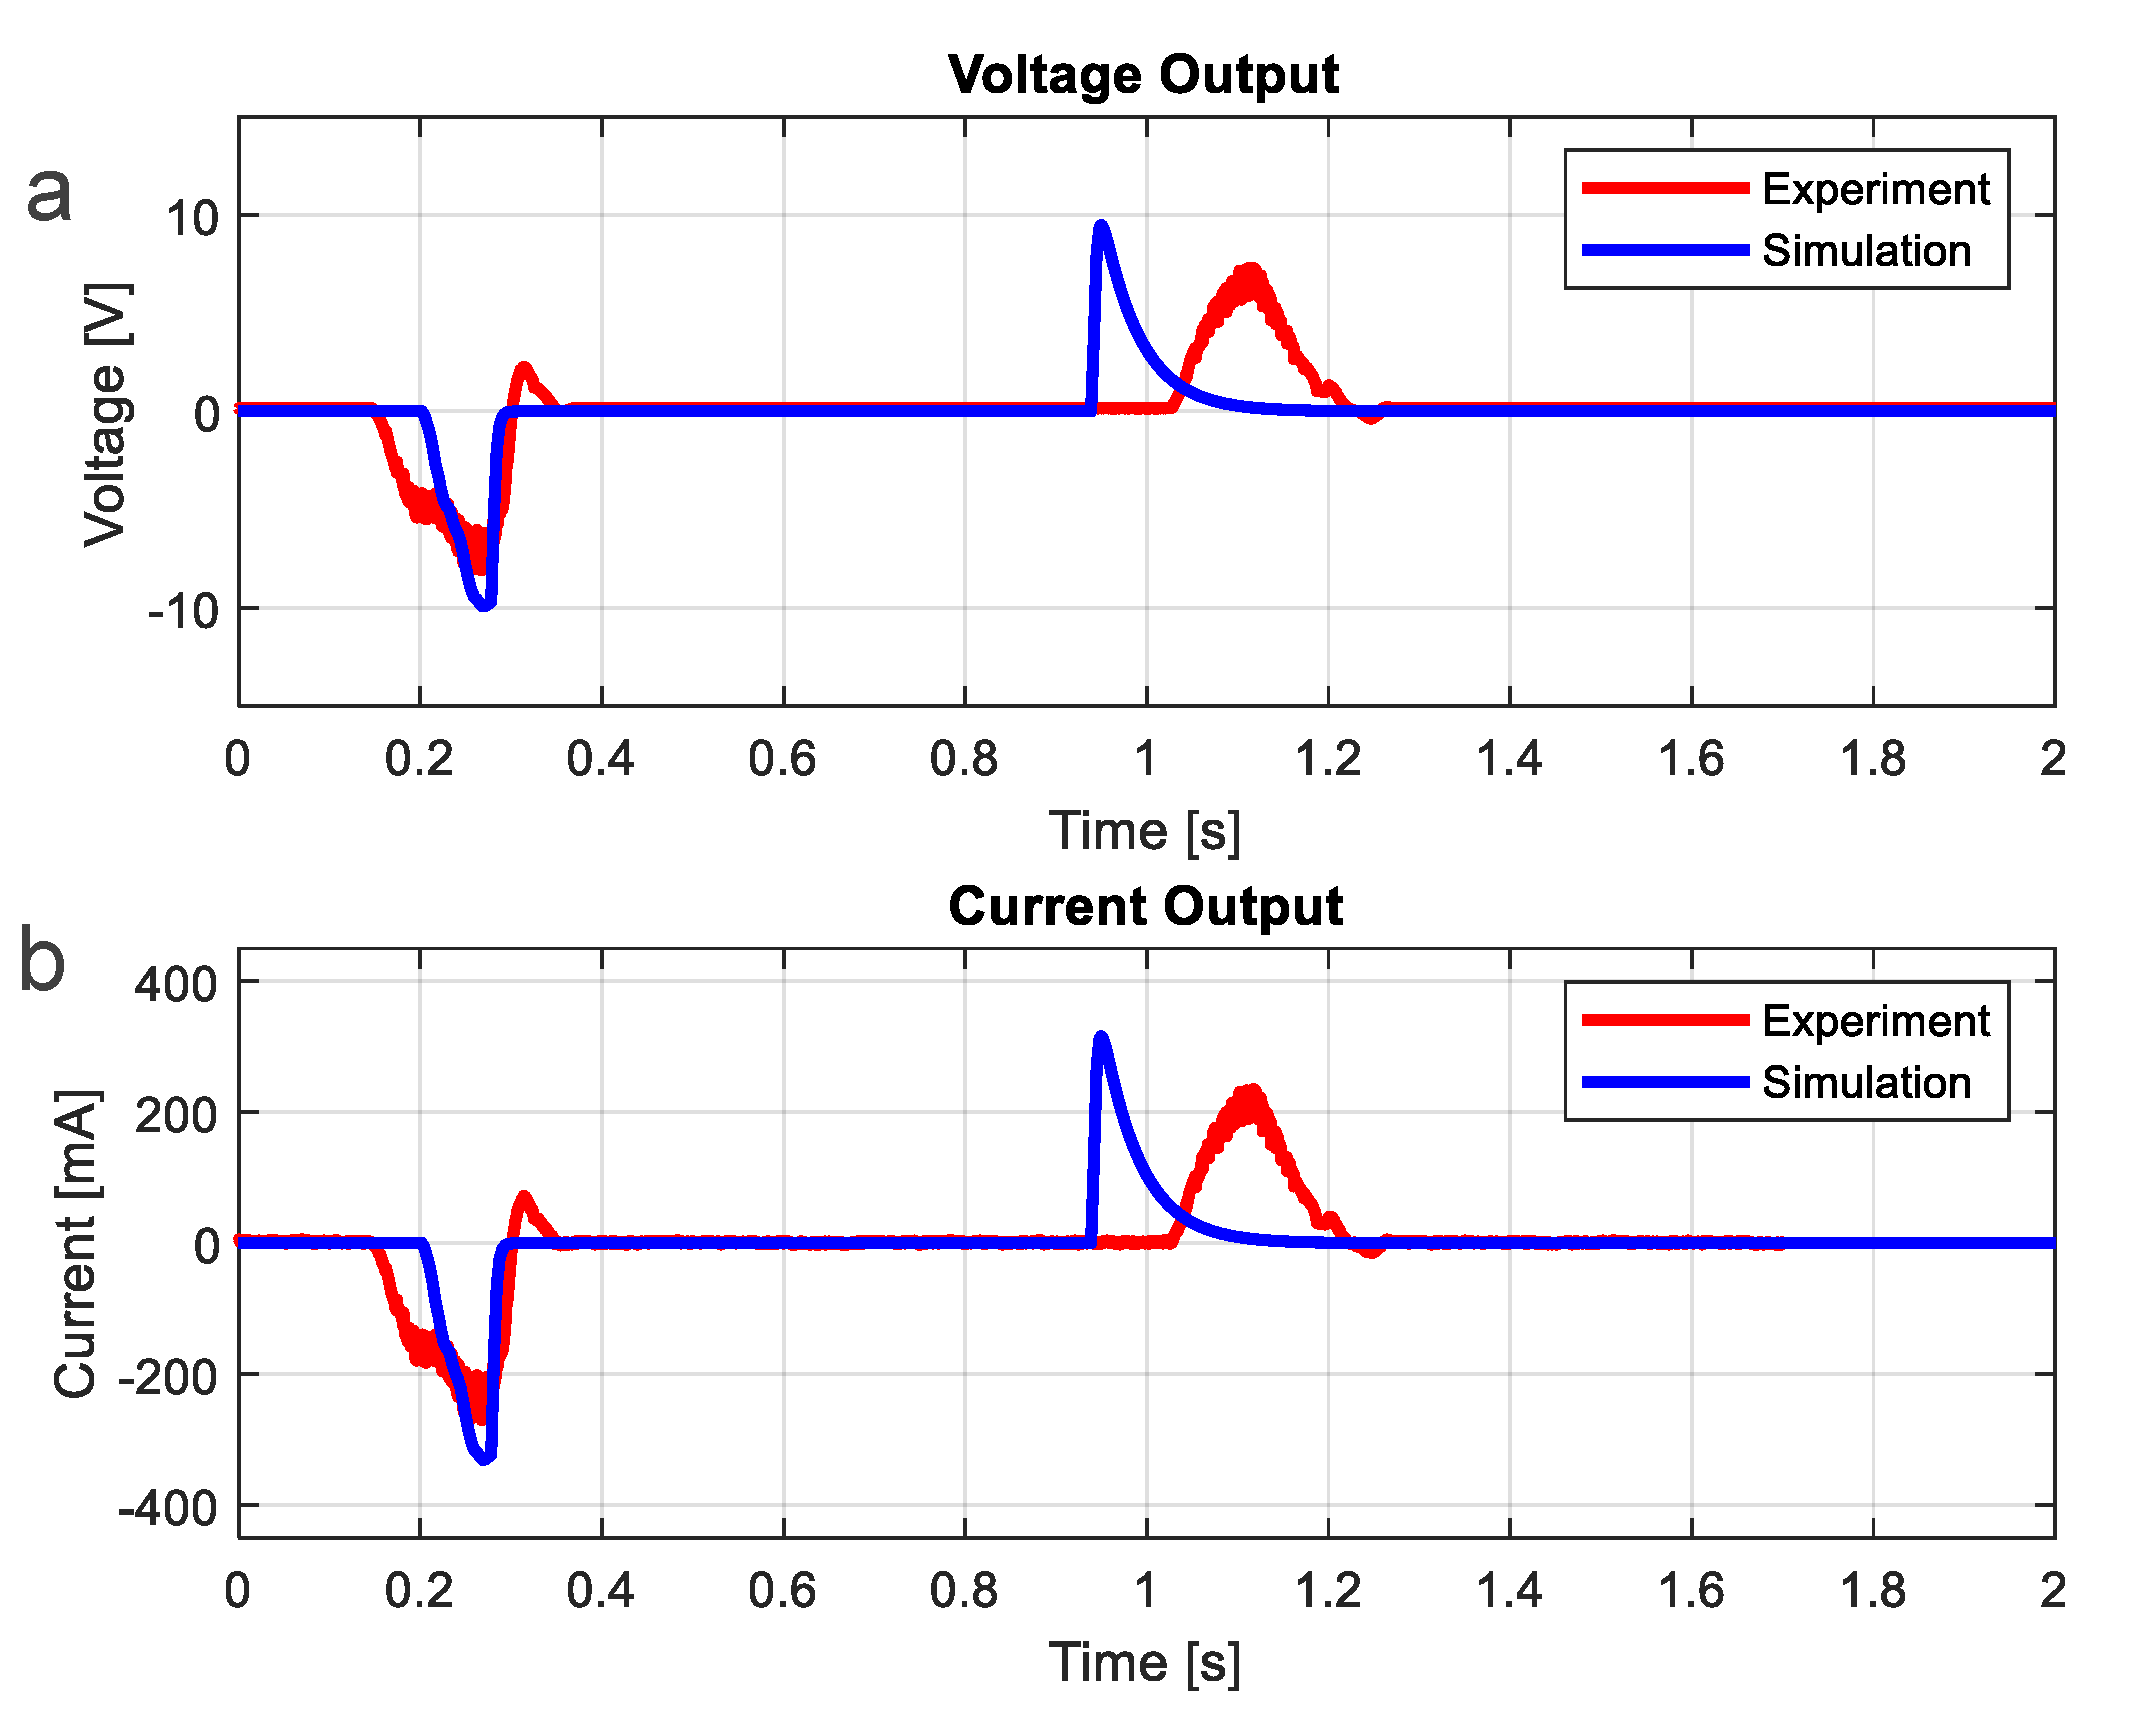
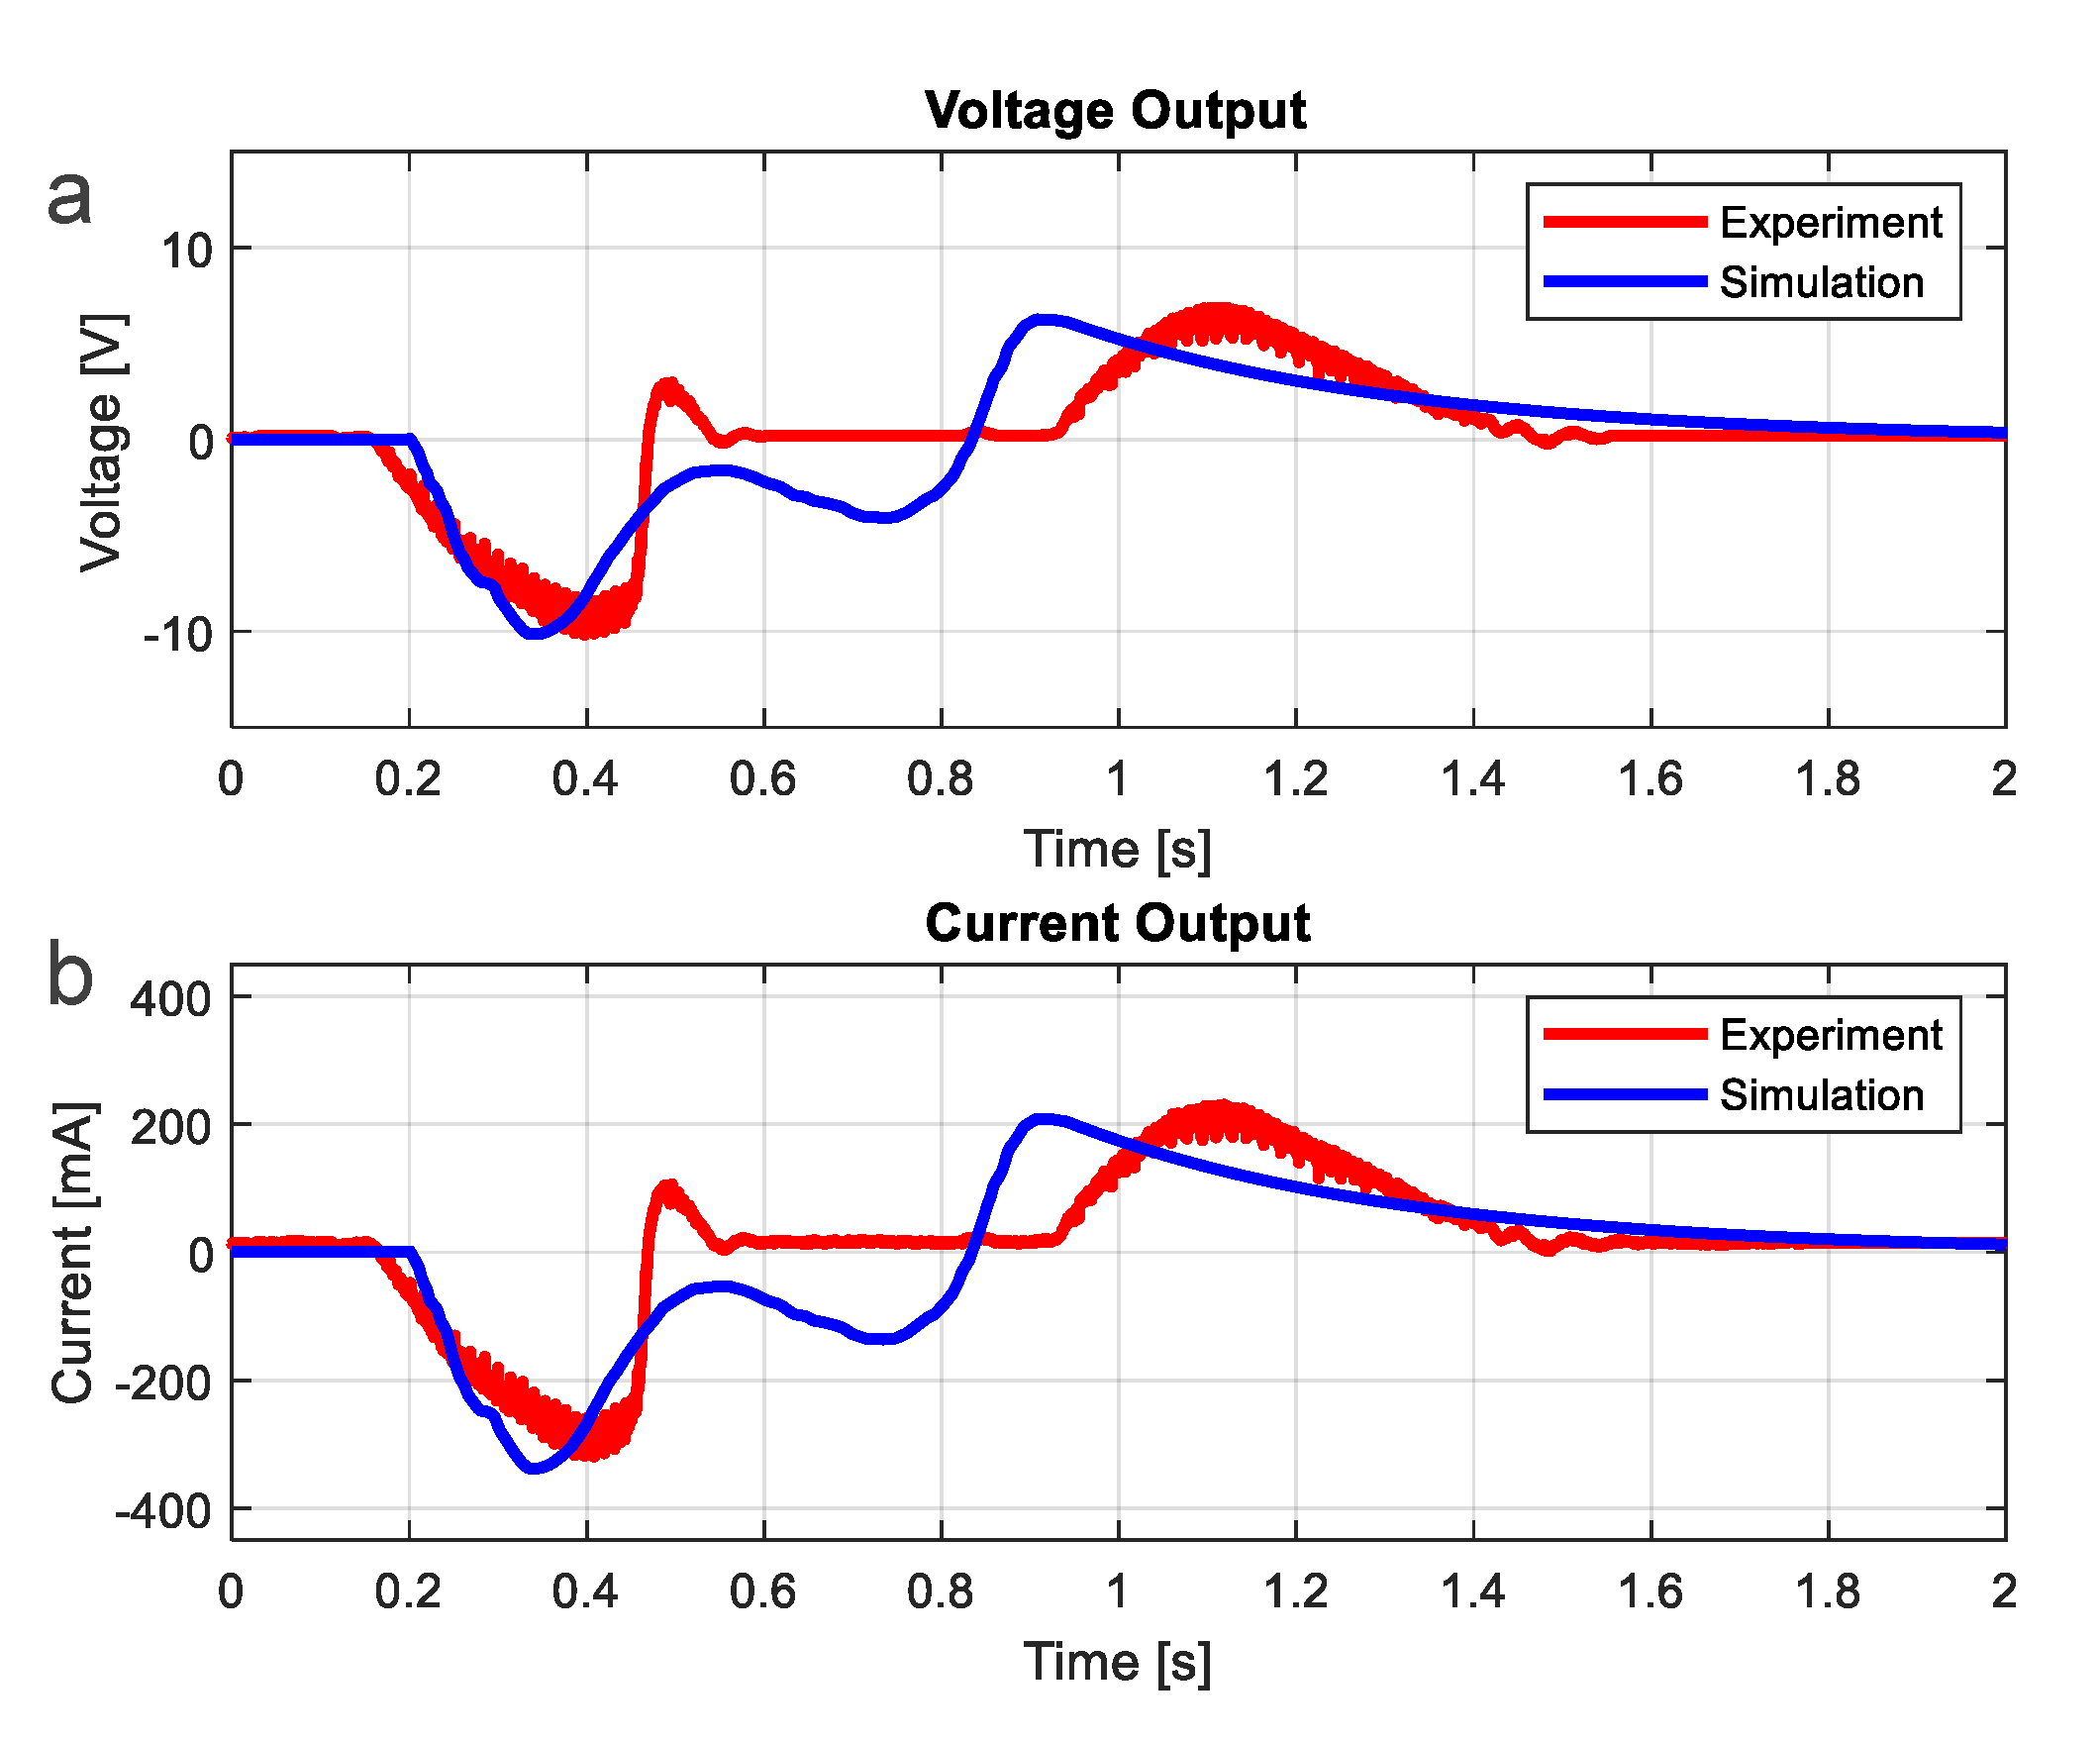
The MATLAB®/Simulink models corresponding to (7) and (14) were developed to predict the voltages and currents for various load resistance R L that both the EM generator systems with rack pinion and lead screw could generate. The Simulink model of the system with lead screw is presented in Figure 7. With the selected parameters shown in Table 1 and Table 2, the simulation results were compared to the corresponding test results as illustrated in Figure 8 and Figure 9 (The test procedure will be described in Section 2.1.4.). Figure 8 and Figure 9 show that the analytical models accurately predict the magnitudes of the voltages and currents generated by the EM generator. The voltage and current signals in Figure 8 and Figure 9 can be divided into two stages according to the movement, i.e., forward and return stages. In the forward stage, ~0.2–0.8 s, the floor-tile moves downwards when the footstep-force applied, causing the generator to rotate in one direction and hence induce negative voltage and current as shown in Figure 8 and Figure 9. During 0.2–0.8 s, the floor-tile might reach the lowest position, causing the generator to stop the rotation and induce no voltage and current before the return stage begins. In the return stage, ~0.8–1.4 s, the floor-tile moves upwards to the equilibrium position according to the restoring spring forces and drives the generator to rotate backward and induce positive voltage and current as seen in Figure 8 and Figure 9. Note that in Figure 9, there exists the small humps of the predicted voltage and current during 0.6–0.8 s. These signals correspond to the applied force at the same interval when the floor-tile is moving downwards. The discrepancy of this analytical prediction and the test result might be because of the difference between the actual force and the force function in Figure 4.
In summary, the induced voltages and currents for both EM-generator designs predicted by the analytical models were compared in Figure 10. Then the performances of the two EM-generators were predicted and summarized in Table 3. The results mainly show that the designed systems generate an averaged 216–886 mJ of electrical energy per footstep, or the averaged power of 216–590 mW. It is sufficient to power electronic devices with low power consumption in the vicinity, such as sensors and communication instruments. This finding assures the possibility of building both of Genpath’s prototypes. Moreover, the verified analytical models were used in the parametric design as presented in Section 2.1.3.

2.1.3. Design of Elements

The critical elements of the EM generator systems in Figure 2 and Figure 3 were decided with the use of the analytical models to tune for the optimized parameters. Design of the elements such as the rack pinion and lead screw, the springs, the transmitted gears and the DC generator is summarized as follows.
The rack pinion and lead screw shown in Figure 2 and Figure 3 are used to change the translation to rotation. A mechanism of the rack-pinion was first adopted in the first prototype [16] because of its availability and economy cost. The drawback of the rack-pinion mechanism arises from its coarse tolerance, resulting in large friction loss. In addition, only the rough-pitch models were found. Thus, for the rack’s allowable displacement of 15 mm, the angular displacement of the pinion is very limited. Therefore, the EM generator system using the rack and pinion is inefficient for harvesting energy from the footstep with limited displacement. To improve the design of the movement converter, the rack-pinion mechanism is replaced by the lead screw in the second prototype. The lead screw has more variety in dimensions for the selection. With finer pitch or smaller lead angles, the angular displacement of the lead can be extended with the limited stroke of the nut. Two sets of the lead angles, i.e., 45° and 60°, were selected and installed to the 24-V-DC-generator system for the comparison. Table 4 presents the energy produced by the generator, when connected to 49-Ω resistance load, for three different designs of the movement converters: the rack pinion, the lead screw with 60° lead angles and the lead screw with 45° lead angles. It was found that the EM generator system with the 45° lead screw produces the highest level of energy among the three designs. With the smaller value of the lead angles, the lead proceeds to larger angular displacement within the same limited stroke of 15 mm, resulting in the greater period for the generator to spin. Therefore, the accumulative energy the generator provides is higher.
The spring and transmitted gears are also the parts critical to harvest the energy. The softer spring is preferable in the design. For the explanation, Figure 11 shows the predicted voltages and currents for the two EM-generator systems varying in the stiffness coefficients. The softer spring, with less value of stiffness coefficient, results in the higher levels of the voltage and current in the forward stage, and hence yields the greater power in harvesting. The softer spring inserts less restoring forces and causes the floor-tile to move down with higher speed that is converted to a higher rotational speed of the generator. With more speed, the generator can produce more power. Although the softer springs are theoretically desirable, they should be sufficiently hard enough to restore the system back to equilibrium due to the friction of the system. To satisfy such conditions, the optimized springs with the wire diameter of 2.2 mm or the stiffness of 40 kN/m were selected.
Moreover, the sets of gear train and bevel gears in Figure 2 and Figure 3, respectively, are used to transmit the rotation from the movement converters to the generator’s rotor. The gear ratio larger than 1:1 can help increase the speed of the generator. However, the increase of the gear ratio is limited by the amount of the resistance force in the system. The increase of the gear ratio leads to the greater frictions and the greater resistance torque provided by the generator. If the resistance force exceeds the applied force from the footstep, the floor-tile will not move. Consequently, the maximum gear ratio of 4:1 is designed for the rack-pinion system and originated from a pinion’s 6 cm diameter and transmitted to a gear’s 1.5 cm diameter as shown in Figure 2. In addition, the maximum gear ratio of the bevel gears in Figure 3 for the lead-screw system is set to 1:1.
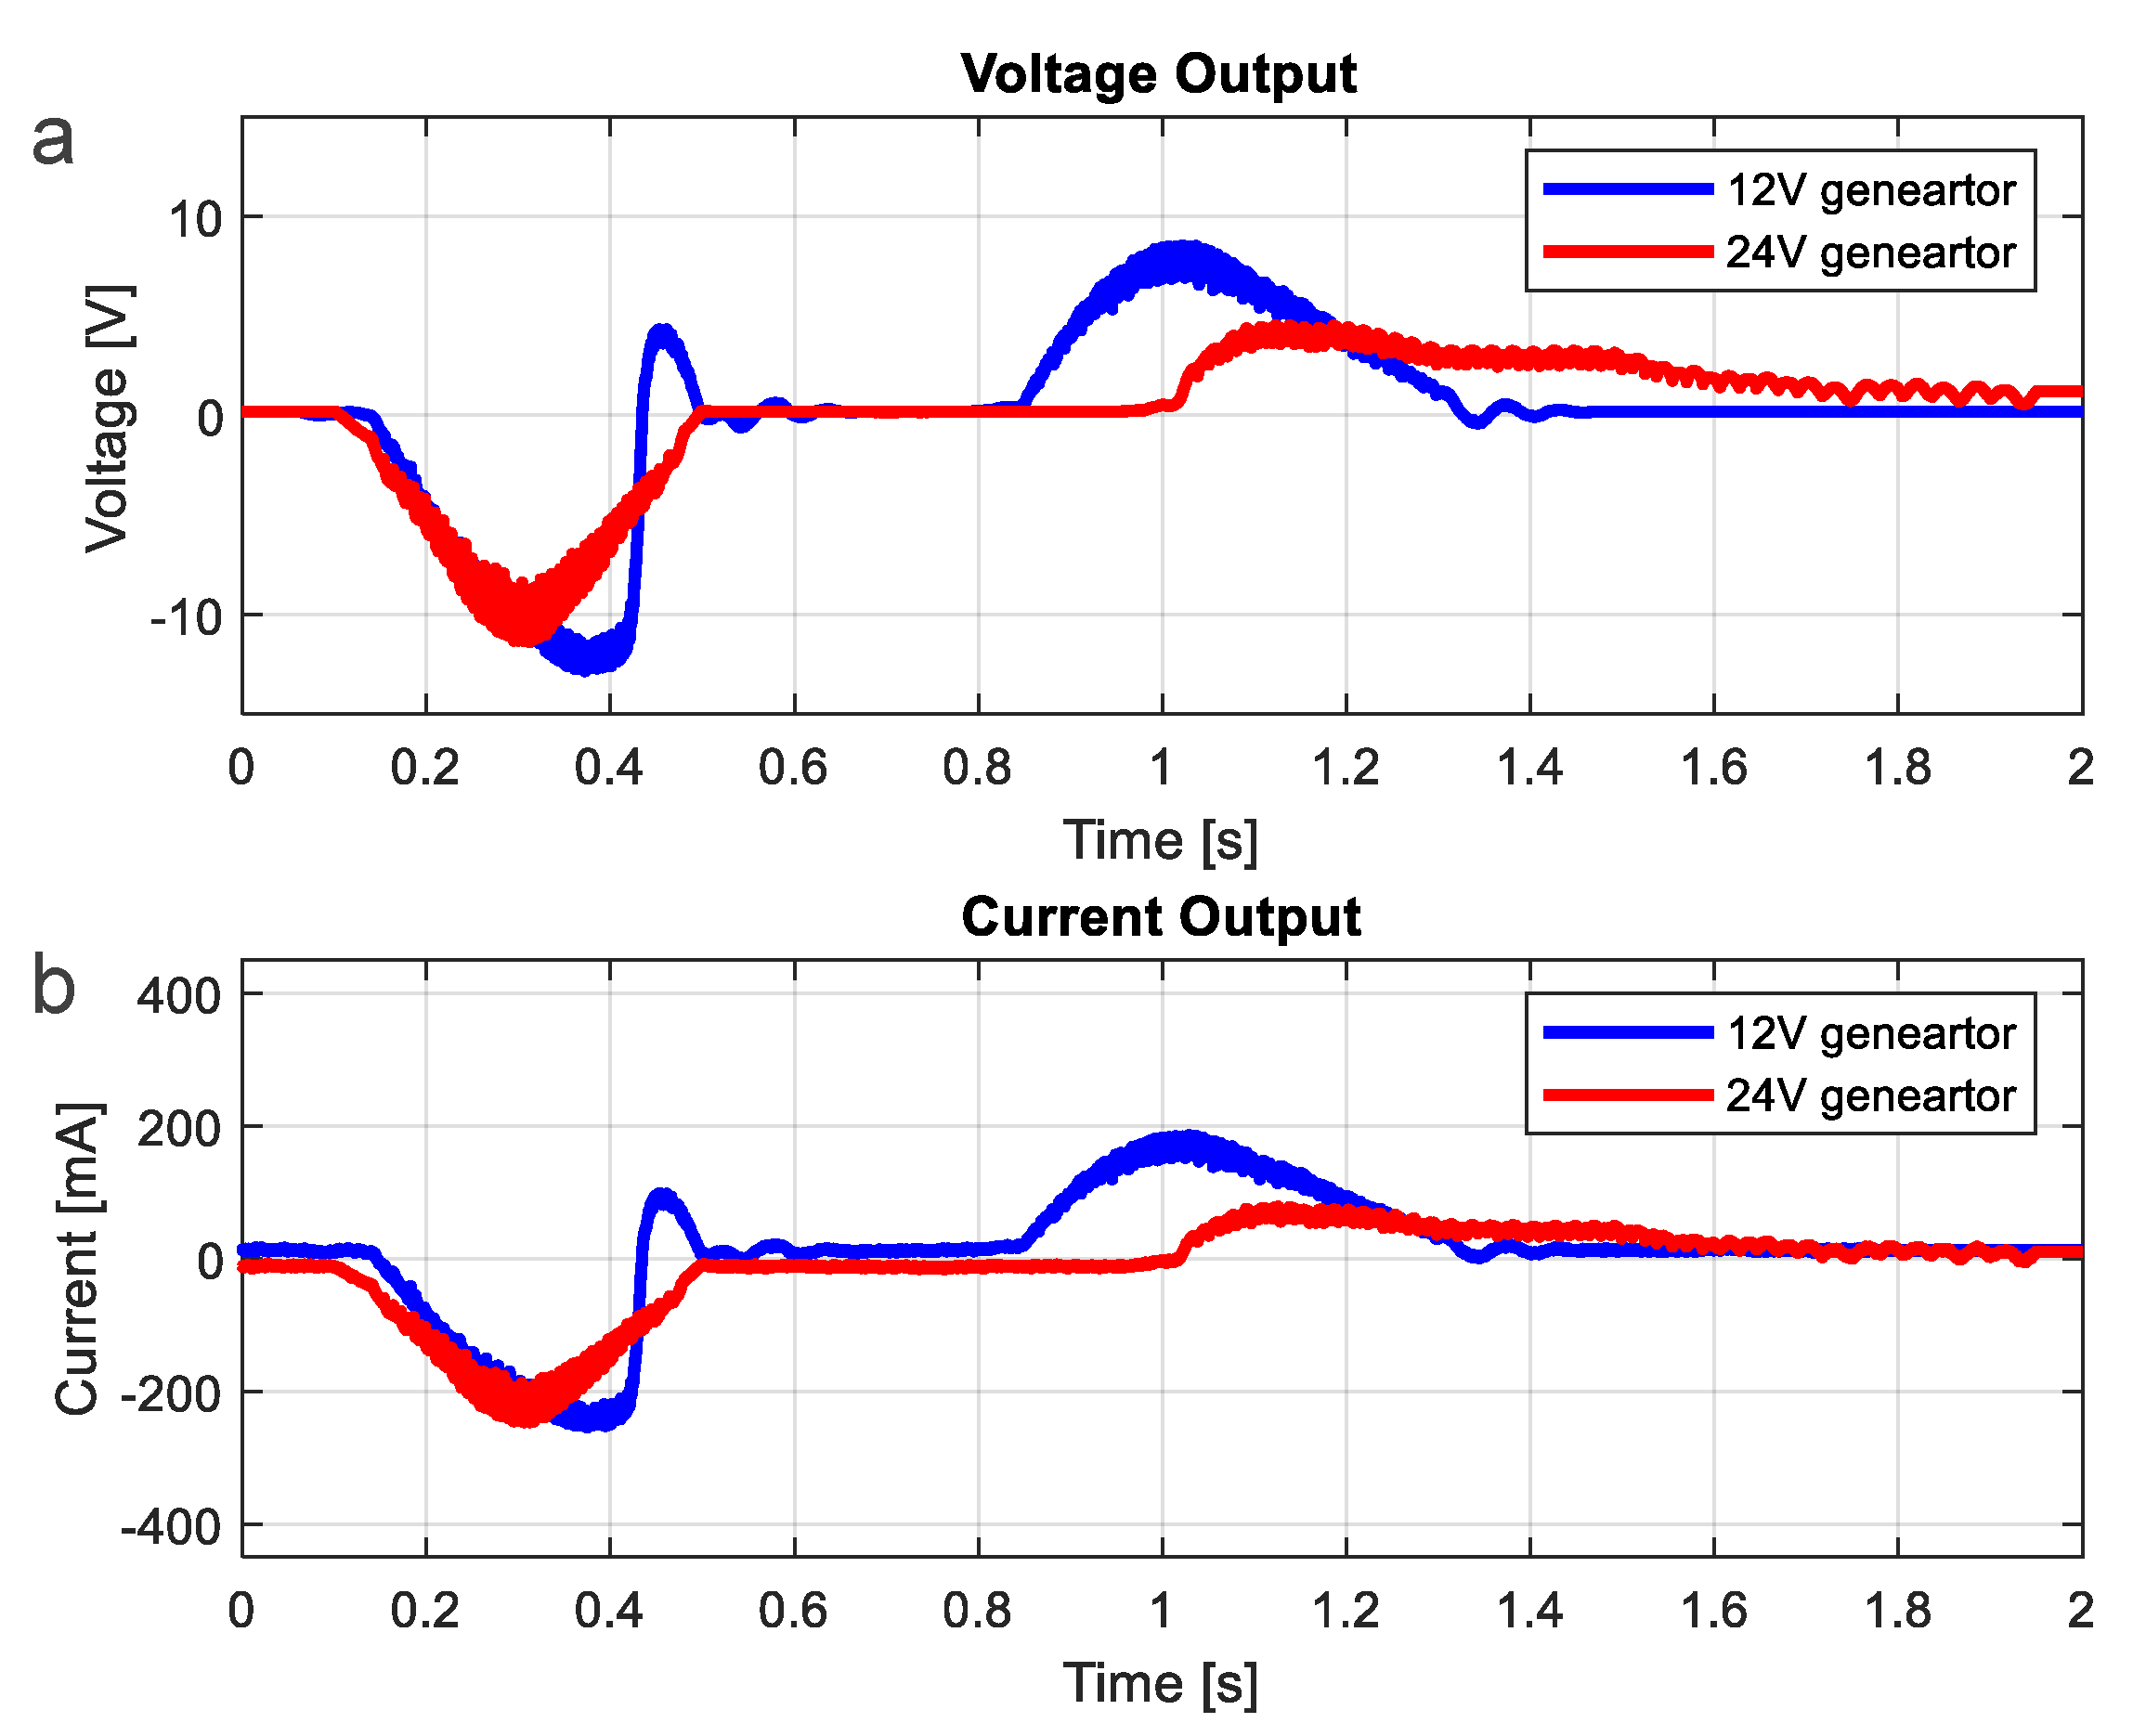
The DC generator was used in the design for simplicity. In order to generate at least 3.3 V for operating the micro-controller, the typical 12-V or 24-V-DC-motor generator was selected to ensure such criteria. To choose a proper DC generator’s speed, the kinematic relation of the transmission system was analyzed. With the maximum value of 20 mm displacement for safely walking, the maximum value of the angular velocity is obtained at 210 rpm. Hence, the model of a motor generator with a 300 rpm rated speed was selected. Two types of the DC generators, 12 V and 24 V with the properties shown in Table 5, were installed in the second prototype of Genpath for comparison of their performance. The induced voltage and current for both types of the DC generators are compared in Figure 12. The energy per footstep produced by the DC generators for various rated load resistances are shown in Table 6. The 12-V motor provides the energy as much as 2.5 times that of the 24-V motor because of the resistance during the transience.
In conclusion, the analytical models developed in the previous section were utilized to obtain the best-fit design. First, the simulation results show that both the rack-pinion and lead-screw models yield about the same maximum power, according to the same levels of both voltage and current magnitudes as seen in Figure 10. However, the simulation results in Figure 10 also indicate that the lead screw provides the longer time in movement and yields the larger angular displacement of the rotor within the limited stroke. This results in more time for the generator in the lead-screw design to generate power. It was also found that the lead-screw design with the finer pitch or, i.e., 45° lead angles, provides the highest energy per step. Second, although the simulation results show that the softer spring could provide higher power in the forward stage, the harder spring with the optimum stiffness value of 40 kN/m was selected to enable to restore the system back to equilibrium. Finally, the 12-V-DC generator, compared to the 24-V-DC generator, gives a better performance probably because of the lower resistance during the transient, as the properties show in Table 5.

2.1.4. Development of the Prototypes

Figure 13 and Figure 14 show the two prototypes of Genpath built with the key components as listed in Table 7. Prototype-I [16] was installed with the 24-V-DC generator and uses the rack pinion for the movement converter. Prototype II is the improved prototype built with the lead screw for the movement converter and the 12-V-DC generator. The experiment was then performed to test the prototypes’ performances as shown in Figure 15. First, each prototype was connected to the rated resistor RL to provide the maximum power output. Then the voltage across RL, the current i and the corresponding electrical power when a normal footstep is applied were measured using an oscilloscope and a current probe. The test results are shown in Figure 16 and summarized in Table 8. Genpath prototype-II with 12-V-DC generator and lead-screw mechanism was significantly improved when compared to the prototype-I [16]. It stated in Table 8 that the latest Genpath prototype produces an average energy of 702 mJ (or average power of 520 mW), the maximum voltage of 9.5 V and the maximum current of 285 mA per footstep in the duration of 1.35 s. The energy provided by the EM-generator in Genpath’s prototype-II was increased by approximately 184% when compared to that of the prototype-I [16]. The efficiency of the EM-generator system is 26% based on the power generation from the heel strike of a human’s walk of 2 W per step. This amount of energy could sufficiently power typical low-power electrical devices, as previously described.

2.2. The system of Power Management and Storage Circuit

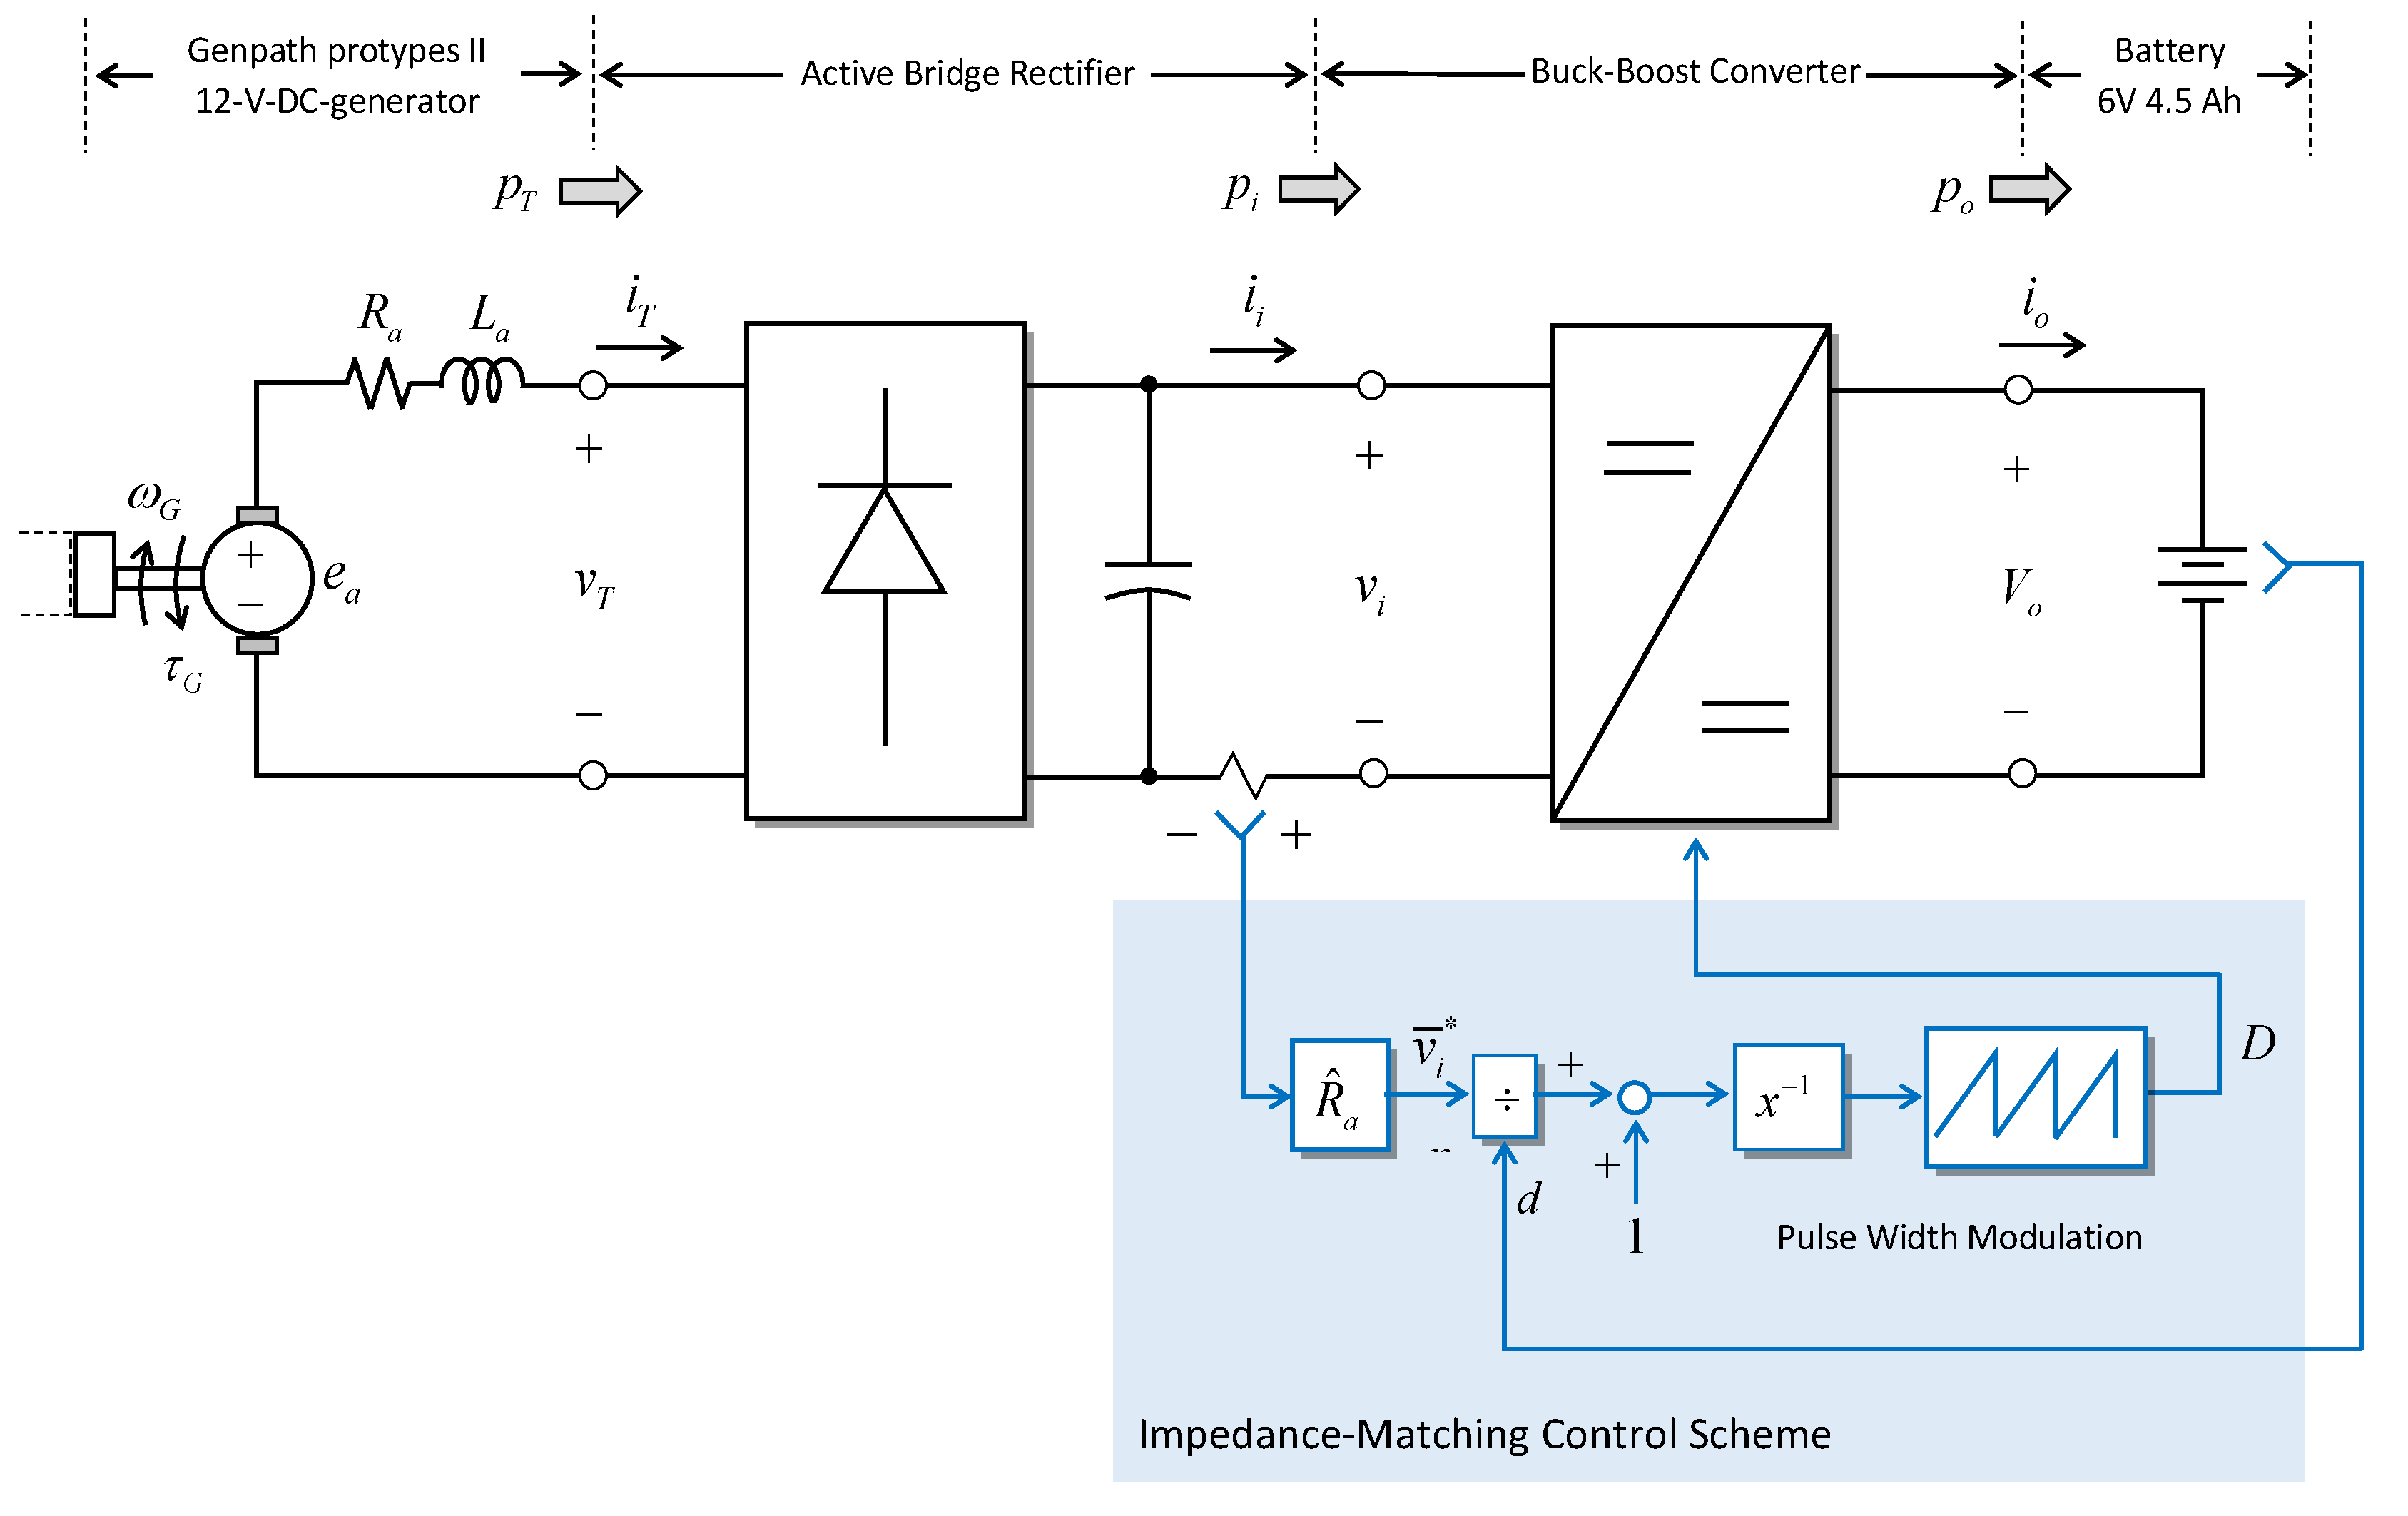
The power management and storage (PMS) circuit was designed to convert and store electrical energy at the same time. Figure 17 shows the circuit diagram and the real-world circuit is depicted in Figure 18. From the performance test of Genpath as shown in Figure 16, it is clearly seen that the generated voltage and current waveform are AC signals. Negative portions occur when a footstep is applied, causing the generator to rotate in one direction. Positive portions occur during the restoration period, resulting in the opposite direction of the generator’s rotation.
The energy from the generator is stored to a 6-V, 4.5-Ah battery through a two-stage power converter. First, the active bridge rectifier converts the AC voltage to the DC voltage. Since the metal–oxide–semiconductor field-effect transistors (MOSFETs) used in the rectifier have extremely low turn-on resistances and junction voltage drops, this kind of rectifier can perform with high efficiency. Second, the buck-boost converter helps convert the variable DC voltage from the rectifier to the battery. This buck-boost converter is operated in accordance with a matching-impedance control scheme which paves the way for the maximum power transfer. In this scheme, the reactance term by inductance is assumed to be small and is neglected from the calculated impedance. This assumption is valid by investigating the value of inductance in Table 5 and the low-frequency AC voltage exhibited in Figure 19b. (Figure 19a shows the output voltage and current without power management and a storage circuit.) The reactance is, therefore, insignificant in comparison with the resistance and it is neglected in the impedance-matching control scheme for the sake of simplicity. This control scheme is implemented with the microcontroller PIC16F1776 which includes the extreme low-power consumption feature. (Note: the input force to the prototype II in this section is different from the previous section due to the environment setup.)
The experiment is conducted to evaluate the performance of the two-stage converter. The AC voltage is efficiently rectified; the efficiency of active bridge rectifier is about 95.78%. Figure 19b and Figure 20b show the operation of the buck-boost converter along with the impedance matching control scheme. The converter helps charge the power into the battery and the control scheme can match the impedance to achieve the maximum power transfer. The power management system is capable of gaining the averaged power of 280 mW from each footstep and storing the accumulative energy of 302 mJ into the battery at the output stage. The efficiency of the buck-boost converter is about 78.00%, thus the overall efficiency of the power management system is 74.72%. Table 9 gives the detailed performances of power management and storage system for each footstep. If comparing the Genpath prototype II with the commercial product such as the Pavegen’s system, the Pavegen’s system which has three generators per tile can generate the energy approximately 2 J per step and the Genpath prototype II which has one generator per tile can generate the energy approximately 0.3 J per step. The Genpath prototype II generates the energy approximately 6 times less than that of the Pavegen’s system. Even though it cannot generate as much energy as the commercial one, the Genpath prototype II is developed based on open hardware which is easy to access and build. The mathematical model of the system exists. Thus, it is possible to develop Genpath’s system in any community to generate more energy in the future.

3. Installation and Demonstration

To demonstrate the application of the developed system, the system was assembled as a floor tile with the dimension of 40 × 40 × 15 cm and installed by three sets of the floor tiles side-by-side without wiring at an exhibition hall of a 100-year-old engineering building at Chulalongkorn University, on the mechanical engineering project exhibition day. Figure 21 shows the photo of the system. Then the exhibitors were invited to walk on the floor tiles. Once they stepped on the floor tiles, the system generated power to store in the battery and lit up the array of LEDs, as seen in Figure 21. This demonstration made exhibitors relive the importance of green energy and energy harvesting in their daily lives. The benefit of the designed system can apply for a lot of applications, such as a wireless sensor and Internet of Thing applications.

4. Conclusions

The paper presented a design of an energy harvesting floor capable of converting mechanical energy from people’s footsteps to electrical energy. The system, comprising the translation-to-rotation conversion mechanism, the EM generator, and the power management circuit system, generates electricity from people’s footsteps. For the EM generator, the conversion mechanism for linear translation to rotation was designed by using the rack-pinion and lead-screw mechanism. Based on simulation analysis, the averaged energy of the lead-screw model is more than that of the rack-pinion model. Moreover, the design of lead-screw model elements was studied. The results show that the lead-screw model with 45° lead angles can generate more averaged energy than others, and the 12-V-DC generator can provide more energy than the 24-generator due to the resistance during the transience, and the softer spring can convert translation motion to higher rotational speed of the generator which can produce more power. Although the softer springs are theoretically desirable, they should be sufficiently hard enough to restore the system back to equilibrium due to the friction of the system. Then, Genpath prototype-II with 12-V-DC generator, lead-screw mechanism, and allowable displacement of 15 mm was built. It was significantly improved when compared to the prototype-I [16]. This Genpath prototype produces an average energy of up to 702 mJ (or average power of 520 mW). The energy provided by Genpath prototype-II is increased by approximately 184% when compared to that of the prototype-I [16]. The efficiency of the EM-generator system is 26% based on the power generation from the heel strike of a human’s walk of 2 W per step. Next, the power management and storage circuit were developed to harvested energy into the batteries and to supply other parts to specific loads. The experiment showed that the circuit has the overall efficiency of 74.72%. The benefit of the designed system can apply for a lot of applications, such as a wireless sensor and Internet of Thing applications.

Author Contributions

Conceptualization, T.J., S.S., and G.P.; methodology, T.J., S.S., and G.P.; software, T.J., S.S., and G.P.; validation, P.K., P.C. and C.U.-v.); formal analysis, T.J.; investigation, P.K., P.C. and C.U.-v.; resources, T.J.; data curation, G.P.; writing—original draft preparation, T.J., S.S., and G.P.; writing—review and editing, T.J., S.S., and G.P.; visualization, T.J.; supervision, T.J.; project administration, G.P. All authors have read and agreed to the published version of the manuscript.

Funding

This research was funded by Ratchadaphiseksomphot Endowment Fund Chulalongkorn University, grant number CU_GI_63_07_21_01.

Acknowledgments

We would like to thank W. Lowattanamart, V. Suttisung, and S. Sintragoonchai who initiated and supported the idea on the project and built up Genpath prototype-I.

Conflicts of Interest

The authors declare no conflict of interest. Also, the funders had no role in the design of the study; in the collection, analyses, or interpretation of data; in the writing of the manuscript, or in the decision to publish the results.

References

  1. Lazaro, A.; Villarino, R.; Girbau, D. A Survey of NFC Sensors Based on Energy Harvesting for IoT Applications. Sensors 2018, 18, 3746. [Google Scholar] [CrossRef] [PubMed] [Green Version]
  2. Cottone, F. Energy Harvesting: Introduction. In Proceedings of the NiPS Summer School, Fiuggi, Italy, 7–12 July 2015; p. 50. [Google Scholar]
  3. Panwar, N.L.; Kaushik, S.C.; Kothari, S. Role of Renewable Energy Sources in Environmental Protection: A Review. Renew. Renew. Sustain. Energy Rev. 2011, 15, 1513–1524. [Google Scholar] [CrossRef]
  4. Beeby, S.P.; Torah, R.N.; Tudor, M.J.; Glynne-Jones, P.; O’Donnell, T.; Saha, C.R.; Roy, S. A Micro Electromagnetic Generator for Vibration Energy Harvesting. J. Micromech. Microeng. 2007, 17, 1257–1265. [Google Scholar] [CrossRef]
  5. Riemer, R.; Shapiro, A. Biomechanical Energy Harvesting from Human Motion: Theory, State of the Art, Design Guidelines, and Future Directions. J. Neuroeng. Rehab. 2011, 8, 22. [Google Scholar] [CrossRef] [PubMed] [Green Version]
  6. Energy Floors 2019. Available online: https://energy-floors.com (accessed on 1 March 2019).
  7. Pavegen 2020. Available online: https://pavegen.com/ (accessed on 7 October 2020).
  8. Rain-Noe. Swingset-Powered Phone Chargers. Ieyenews. 2020. Available online: https://www.ieyenews.com/swingset-powered-phone-chargers/ (accessed on 7 October 2020).
  9. Liu, M.; Lin, R.; Zhou, S.; Yu, Y.; Ishida, A.; McGrath, M.; Kennedy, B.; Hajj, M.; Zuo, L. Design, Simulation and Experiment of a Novel High Efficiency Energy Harvesting Paver. Appl. Energy 2018, 212, 966–975. [Google Scholar] [CrossRef]
  10. Hwang, S.J.; Jung, H.J.; Kim, J.H.; Ahn, J.H.; Song, D.; Song, Y.; Lee, H.L.; Moon, S.P.; Park, H.; Sung, T.H. Designing and Manufacturing a Piezoelectric Tile for Harvesting Energy from Footsteps. Curr. Appl. Phys. 2015, 15, 669–674. [Google Scholar] [CrossRef]
  11. Kim, K.B.; Cho, J.Y.; Jabbar, H.; Ahn, J.H.; Hong, S.D.; Woo, S.B.; Sung, T.H. Optimized Composite Piezoelectric Energy Harvesting Floor Tile for Smart Home Energy Management. Energy Convers. Manag. 2018, 171, 31–37. [Google Scholar] [CrossRef]
  12. Vocca, H.; Cottone, F. Kinetic Energy Harvesting. In ICT-Energy-Concepts Towards Zero–Power Information and Communication Technology; Intechopen: London, UK, 2014. [Google Scholar] [CrossRef] [Green Version]
  13. Yang, Z.; Zhou, S.; Zu, J.; Inman, D. High-Performance Piezoelectric Energy Harvesters and Their Applications. Joule 2018, 2, 642–697. [Google Scholar] [CrossRef] [Green Version]
  14. Larkin, M.; Tadesse, Y. HM-EH-RT: Hybrid Multimodal Energy Harvesting from Rotational and Translational Motions. Int. J. Smart Nano Mater. 2013, 4, 257–285. [Google Scholar] [CrossRef]
  15. Arnold, D.P. Review of Microscale Magnetic Power Generation. IEEE Trans. Magn. 2007, 43, 3940–3951. [Google Scholar] [CrossRef]
  16. Lowattanamart, W.; Suttisung, V.; Sintragoonchai, S.; Phanomchoeng, G.; Jintanawan, T. Feasibility on Development of Kinetic-Energy Harvesting Floors. IOP Conf. Ser. Earth Environ. Sci. 2020, 463, 12107. [Google Scholar] [CrossRef]
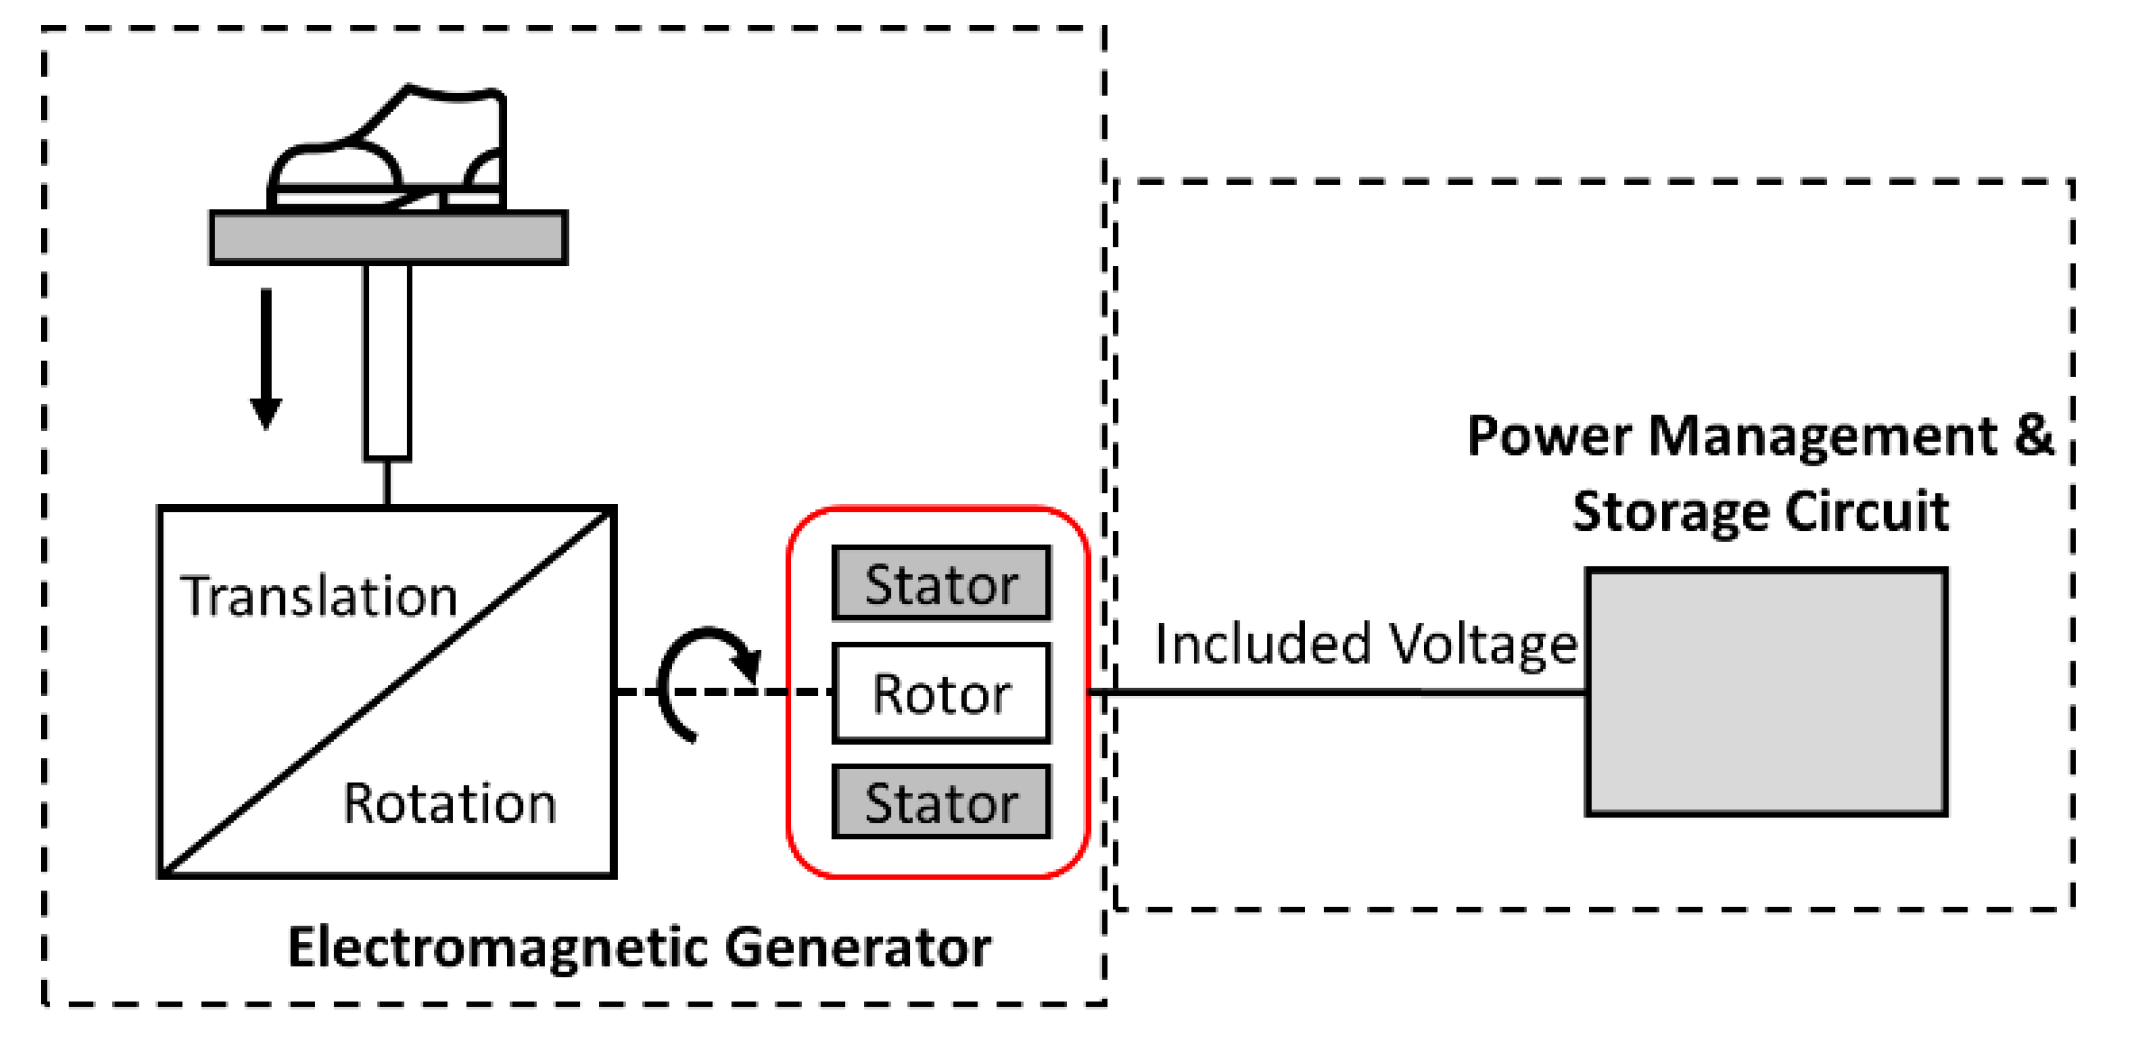
Figure 1. Genpath Concept Diagram.
Energies 13 05419 g001
Figure 2. (a) Rack-Pinion Design; (b) Lead-Screw Design.
Energies 13 05419 g002
Figure 3. Physical models: (a) Rack and Pinion Model; (b) Lead-Screw Model.
Energies 13 05419 g003
Figure 4. Input Footstep Force.
Energies 13 05419 g004
Figure 5. Rack and Pinion Free Body Diagram.
Energies 13 05419 g005
Figure 6. Lead-Screw Free Body Diagram.
Energies 13 05419 g006
Figure 7. Simulink model for the electromagnetic (EM) generator with lead-screw design.
Energies 13 05419 g007
Figure 8. Voltage and Current of Rack-Pinion Model from Experiment and Simulation. (a) Voltage of Rack-Pinion Model. (b) Current of Rack-Pinion Model.
Energies 13 05419 g008
Figure 9. Voltage and Current of Lead-Screw Model from Experiment and Simulation. (a) Voltage of Lead-Screw Model. (b) Current of Lead-Screw Model.
Energies 13 05419 g009
Figure 10. Simulation of Rack-Pinion and Lead-Screw Model. (a) Voltage of Rack-Pinion and Lead-Screw Model. (b) Current of Rack-Pinion and Lead-Screw Model.
Energies 13 05419 g010
Figure 11. Simulation of Lead-Screw Model with Soft and Hard Springs. (a) Voltage of Lead-Screw Model with Soft and Hard Springs. (b) Current of Lead-Screw Model with Soft and Hard Springs.
Energies 13 05419 g011
Figure 12. Comparison Voltage and Current of Lead-Screw Model with 12– and 24–V-DC Generator. (a) Voltage of Lead-Screw Model. (b) Current of Lead-Screw Model.
Energies 13 05419 g012
Figure 13. Photograph of Rack and Pinion Prototype.
Energies 13 05419 g013
Figure 14. Photograph of Lead-Screw Prototype.
Energies 13 05419 g014
Figure 15. Test Set up Diagram for the Prototypes.
Energies 13 05419 g015
Figure 16. Comparison Voltage and Current of Prototype I and Prototype II. (a) Voltage of Prototype I and Prototype II. (b) Current of Prototype I and Prototype II.
Energies 13 05419 g016
Figure 17. Circuit Diagram of Power Management and Storage System.
Energies 13 05419 g017
Figure 18. Real-World Circuit of Power Management and Storage System.
Energies 13 05419 g018
Figure 19. Experimental result showing the operation of power management and storage circuit; v t and i t are outputs of generator; v i and i i are outputs of the rectifier circuit; v o and i o are outputs of the buck-boost circuit.
Energies 13 05419 g019
Figure 20. Experimental result showing the operation of the power management system regarding the process of power conversion and energy storage; P t and E t are power and energy outputs of the generator; P i is power output of the rectifier circuit; P o and E o are power and energy outputs of the buck-boost circuit.
Energies 13 05419 g020
Figure 21. Installation and demonstration.
Energies 13 05419 g021
Table 1. Rack-Pinion Parameters.
ParametersValue
Mass of Rack and Plate ( m )3.016 kg
Radius of Pinion ( r 1 )0.72 × 10⁻² m
Radius of Gear ( r 2 )3 × 10⁻² m
Moment of inertia of bevel gear ( J G )8.6756 × 10⁻⁷
Moment of Inertia of Pinion ( J p )1 × 10⁻⁵ kg m
Spring Coefficient ( k )20,500 N/m
Damping Coefficient ( d )900 N·s/m
Resistance of Generator ( R G )42 Ohm
Inductance ( L )19.6 × 10⁻³ H
Generator constant ( K t )0.5854 Vs/rad
Resistance of Load ( R L )30 Ohm
Table 2. Lead-Screw Parameters.
ParametersValue
Pitch of Lead Screw ( l )8 mm
Mass of Nut and Plate ( m ) 2.16 kg
Moment of inertia of bevel gear ( J G )8.6756 × 10⁻⁷
Moment of Inertia of lead screw ( J l )2.5536 × 10⁻⁶ kg m2
Lead angle45 degree
Spring Coefficient ( k )40,000 N/m
Damping Coefficient ( d )13,600 N·s/m
Resistance of Generator ( R G )37 Ohm
Inductance ( L )19.6 × 10⁻³ H
Generator constant ( K t )0.392 Vs/rad
Resistance of Load ( R L )30 Ohm
Friction coefficient (µ)0.21
Efficient of thrust bearing η t h r u s t 0.6529
Efficient of thread η t h r e a d 0.8132
Table 3. Performances of the EM-generator designs.
VariablesRack-Pinion DesignLead-Screw Design
Values per FootstepValues per Footstep
Maximum voltage9.92 V10.13 V
Average voltage0.99 V4.16 V
Maximum current330.9 mA337.9 mA
Average current33.15 mA138.8 mA
Maximum power3.28 W3.42 W
Average power216.4 mW590.3 mW
Wave duration1.00 s1.50 s
Average energy216.4 mJ885.8 mJ
Table 4. Comparison of Rach-Pinion, Lead-Screw (60° lead angles) and Lead-Screw (45° lead angles) Average Energy.
DesignAveraged Energy (mJ)
Rack pinion319
60° lead angles Lead screw353
45° lead angles Lead screw488
Table 5. Comparison of 12- and 24-V-DC-Generator Parameters.
Voltage
(V)
Resistance RG
(Ω)
Inductance L
(mH)
Kt
(Vs/rad)
12373.60.2903
244219.60.5854
Table 6. Energy per footstep produced by the DC generators for various rated load resistances.
Load
(Ω)
Average Energy (mJ)
12 V24 V
30798.2321.5
39750.0313.2
49745.5488.2
Table 7. Components of rack and pinion and lead-screw prototypes.
Prototype I (Rack and Pinion) Prototype II (Lead Screw)
ItemDimensions#ItemDimensions#
Acrylic plate400 × 400 × 10 mm2Wood plate400 × 400 × 5 mm2
Linear guideDia 12
Length 90 mm
4Linear guideDia 12
Length 90 mm
4
Linear bearing Inner dia 12 mm4Linear bearingInner dia 12 mm4
Shaft couplingInner dia 12 mm4Shaft couplingInner dia 12 mm4
Coil springLength 60 mm
Dia 1.6 mm
4Coil springLength 60 mm
Dia 2.2 mm
4
Shaft to generatorDia 8 mm
Length 60 mm
1Shaft to generatorDia 8 mm
Length 60 mm
1
Rack and pinionPinion radius 3 cm 1Nut and lead screwDia 8 mm
Pitch 2 mm
1
Flexible coupling8 mm1Flexible coupling8 mm1
GearRadius 0.75 cm1Bevel gearInner dia 8 mm2
Ball bearingInner dia 8 mm3Ball bearingInner dia 8 mm3
GeneratorZGA37RG 24V 300 rpm1GeneratorZGA37RG 12V 300 rpm1
Table 8. Performances of Genpath prototypes I and II.
VariablesPrototype I (Rack-Pinion)Prototype II (Lead-Screw)
Values per FootstepValues per Footstep
Maximum voltage7.5 V9.5 V
Average voltage1.26 V2.88 V
Maximum current246 mA285 mA
Average current42.5 mA88 mA
Maximum power1.85 W2.71 W
Average power216 mW520 mW
Wave duration1.14 s1.35 s
Average energy247 mJ702 mJ
Table 9. Performances of power management and storage circuit with Genpath prototypes II and 12-V-DC generator.
VariablesValues per Footstep
Pure R
(8.7 Ω)
Power Management and Storage Circuit
Maximum voltage; max ( v t )4.22 V3.97 V
Maximum current; max ( i t )548 mA635 mA
Maximum power; max ( p t )2.29 W2.48 W
Average power; p ¯ t 351 mW374 mW
Average power; p ¯ i -359 mW
Average power; p ¯ o -280 mW
Wave duration1.18 s1.08 s
Stored energy at 1.4 s; E o (t = 1.4 s)415 mJ302 mJ
Efficiency of Active Rectifier-95.78%
Efficiency of Buck-Boost Converter-78.00%
Overall Efficiency -74.72%
Publisher’s Note: MDPI stays neutral with regard to jurisdictional claims in published maps and institutional affiliations.