Article

Effect of Trace Magnesium Additions on the Dynamic Recrystallization in Cast Alloy 825 after One-Hit Hot-Deformation

by
Munir Al-Saadi
1,2,*,
Wangzhong Mu
2,
Christopher N. Hulme-Smith
2,*,
Fredrik Sandberg
1 and
Pär G. Jönsson
2
1
R&D Metallurgy, AB Sandvik Materials Technology, SE-811 81 Sandviken, Sweden
2
Department of Materials Science and Engineering, KTH Royal Institute of Technology, Brinellvägen 23, SE-100 44 Stockholm, Sweden
*
Authors to whom correspondence should be addressed.
Metals 2021, 11(1), 36; https://doi.org/10.3390/met11010036
Submission received: 17 October 2020 / Revised: 15 December 2020 / Accepted: 22 December 2020 / Published: 26 December 2020
(This article belongs to the Section Metal Casting, Forming and Heat Treatment)

Abstract

:
Alloy 825 is widely used in several industries, but its useful service life is limited by both mechanical properties and corrosion resistance. The current work explores the effect of the addition of magnesium on the recrystallization and mechanical behavior of alloy 825 under hot compression. Compression tests were performed under conditions representative of typical forming processes: temperatures between 1100 and 1250 °C and at strain rates of 0.1–10 s−1 to a true strain of 0.7. Microstructural evolution was characterized by electron backscattered diffraction. Dynamic recrystallization was found to be more prevalent under all test conditions in samples containing magnesium, but not in all cases of conventional alloy 825. The texture direction 101 was the dominant orientation parallel to the longitudinal direction of casting (also the direction in which the samples were compressed) in samples that contained magnesium under all test conditions, but not in any sample that did not contain magnesium. For all deformation conditions, the peak stress was approximately 10% lower in material with the addition of magnesium. Furthermore, the differences in the peak strain between different temperatures are approximately 85% smaller if magnesium is present. The average activation energy for hot deformation was calculated to be 430   kJ   mol 1 with the addition of magnesium and 450   kJ   mol 1 without magnesium. The average size of dynamically recrystallized grains in both alloys showed a power law relation with the Zener–Hollomon parameter, D D ~ Z n , and the exponent of value, n , is found to be 0.12 . These results can be used to design optimized compositions and thermomechanical treatments of alloy 825 to maximize the useful service life under current service conditions. No experiments were conducted to investigate the effects of such changes on the service life and such experiments should now be performed.

1. Introduction

Alloy 825, with its excellent combination of mechanical properties and corrosion resistance, can be used at high temperatures and in acidic environments. It is used in the petrochemical sector, such as in oil and gas extraction and petroleum refining. It is also used in other applications to make tanks that are subject to corrosive environments. In these applications, it is subjected to both mechanical loading and prolonged contact with corrosive substances. Therefore, both the mechanical properties and corrosion resistance can be limiting. If both the mechanical properties and corrosion resistance can be improved, the service life of components made from the alloy can be increased. This will promote sustainable development by reducing resource consumption and increasing the economic benefits of the component.
It is well known that the addition of microalloying elements such as magnesium, calcium and boron has a strong influence on the mechanical properties of both wrought and cast nickel-base superalloys [1,2,3]. Moreover, the addition of 194 ppm by mass magnesium in nickel-base and iron–nickel-base superalloys has been shown to improve properties such as stress rupture life and creep life, a function currently fulfilled by cobalt, which is a critical element and is the subject of a drive to reduce its use [4,5].
It was found that the addition of magnesium leads to the refinement of grain boundary carbides and retards the formation of grain boundary δ-phase (Ni3Nb) [5]. A small magnesium addition of 16–110 ppm by mass increases the impact toughness and decreases niobium segregation in as-cast Inconel 718 [6]. This is because the minor magnesium addition makes MC-type precipitates finer and spheroidal. Magnesium has also been found to spheroidize grain boundary carbides [5] and decrease the grain boundary energy [7]. The latest effect increases the cohesion of adjacent grains and the rupture energy of the grain boundaries, which increases the time required to nucleate and grow a crack by creep. It also reduces the energy barrier to the nucleation of recrystallized grains. The fine particle density in the Fe-36Ni alloy increases with an increasing content of magnesium from 49 to 69 ppm by mass during hot tensile tests at 700 and 850 °C, which pins grain boundaries and leads to grain refinement [8]. Even a trace addition of magnesium of the order of 10 ppm by mass (0.001 wt%) can lead to very fine grain size of 20 to 30 µm [9]. It is also claimed that the addition of 50 to 100 ppm by the mass of magnesium can significantly improve hot workability and prolong the rupture life of nickel-base alloys [10]. Furthermore, it has been reported that nickel-base superalloys without the addition of magnesium can suffer grain boundary cracking as grains cannot slide relative to each other during deformation [1]. It has been suggested that a small addition of magnesium to some alloys can improve stress-rupture ductility, even if the alloy contains less than 0.003 wt% carbon [11]. However, the addition of more than 400 ppm magnesium can lead to the formation of Ni2Mg, a brittle phase, which deteriorates hot workability but may benefit forgeability [12]. Previous investigations consistently state that a small amount addition of magnesium in nickel-base and iron–nickel alloys can improve creep and stress rupture properties due to the spheroidization of precipitates [1,2,3,4,5,6,7,8,9,10,11,12]. Moreover, the stress required for plastic deformation can be increased by an addition of magnesium due to substitutional solid solution strengthening and causing an increase in dislocation density, prolonging work hardening [13].
There is very little work reported on the dynamic recrystallization of nickel-base and iron–nickel superalloys containing magnesium. Previous work by some of the current authors characterized the microstructure in hot deformed alloy 825 by optical microscopy and electron backscatter diffraction (EBSD). It was shown that no significant dynamic recrystallization had occurred [14,15]. Instead, a substructure dominated by low-angle grain boundaries was formed. The present work studies the effect of trace additions of magnesium on the mechanical behavior of cast alloy 825 after one-hit hot-deformation, with emphasis on whether or not dynamic recrystallization occurs.
The onset of dynamic recrystallization is triggered at a critical stress, σ c , and critical strain, ε c [16,17,18] or when some minimum dislocation density value is exceeded [19,20]. During hot deformation, stress increases continuously until work hardening is balanced by the removal of dislocations via dynamic recrystallization. At this point, the strain hardening rate, θ , becomes zero. The corresponding stress and strain are known as peak stress, σ p , and peak strain, ε p . The corresponding microstructure is called a “necklace” structure and consists of grains that are still undergoing recrystallization at the end of the deformation [21]. Such a structure was observed and reported in the current alloy in a previous paper [15]. The critical strain,   ε c , is often approximately 0.8   ε p [22] and the critical stress,   σ c , is often approximately 0.9   σ p [23,24]. The formation of the necklace structure coincides with a sudden reduction in the flow stress following the work hardening regime. In the stress–strain curves of constant strain rate, stress will thus decrease after the peak stress and, once the necklace structure is fully formed, reach a plateau called the steady-state stress. This is because the reduction in flow stress due to the formation of the necklace structure is exhausted and the material exhibits a dynamic balance between recrystallization and work hardening. Dynamic recrystallization may also occur without any apparent peak in the flow stress [25].
In order to model the material behavior during the hot deformation, it is important to determine the values of critical, peak and steady-state stress. Except in the case of a visible peak in the flow curve—which is usually promoted by high temperatures and low strain rates—direct measurement of peak stress and peak strain are difficult. It is even more complex to measure critical stress and critical strain. One established method to find these values from experimental stress–strain data is to relate them with the Zener–Hollomon parameter, Z , (Equation (1), where ε ˙ is the deformation strain rate, Q is the activation energy for the rate-limiting process in the deformation and R and T have their usual meanings) and dynamic recrystallization kinetics [17,25]. The dynamically recrystallized grain size, D DRX , is highly sensitive to the deformation conditions, which can be adequately represented by the Zener–Hollomon parameter. A power law function (Equation (2) with 0.27 n 0.4 ) has been reported in studies on the discontinuous dynamic recrystallization of austenite with low stacking fault energy during hot working [26,27,28,29,30]. The current alloy has a moderate stacking fault energy and so is not entirely dissimilar to the austenite reported in the aforementioned studies. In this discontinuous regime, recrystallized grains nucleate on prior grain boundaries [18]. This strong temperature and strain rate dependence of the dynamically recrystallized grain size becomes much weaker as deformation temperature decreases. The dominant mechanism of dynamic recrystallization changes from discontinuous to continuous. In the first case, recrystallized grains are found only on prior grain boundaries and a necklace structure is observed. This mechanism is favored in situations where deformation strain is localized in the microstructure. In the second case, which is favored when deformation can take place throughout the microstructure, recrystallized grains nucleate near prior boundaries and within the bulk of deformed grains [18,28,29]. Under the continuous recrystallization regime, the mean dynamically recrystallized grain size, D D , can be also expressed by a power law function of the Zener–Hollomon parameter with a much smaller exponent, n ~ 0.1 (Equation (2)) [28,29,30]:
Z = ε ˙ exp ( Q / R T )
D D = C Z n
In the current study, the influence of a magnesium addition on the deformation behavior of alloy 825 was investigated for the first time using one-hit compression testing. The critical and peak stresses and strains are measured. The microstructure was investigated using electron backscatter diffraction to determine the nature of the microstructure after compression testing.

2. Materials and Methods

2.1. Materials

Samples of alloy 825 with the addition of magnesium (Alloy A, Table 1) were manufactured by argon oxygen decarburization (AOD) refining and then ingot cast. Samples without the addition of magnesium (Alloy B, Table 1) were produced by AOD-refining, followed by continuous casting.

2.2. Hot Compression Tests

Cylindrical compression test pieces with a diameter of 10   mm and a length of 15   mm in Alloy A were machined with the compression axis parallel to the ingot axis from a constant radial position, which corresponds to places where columnar grains were found to be occur. Hot compression test pieces of Alloy B were produced with the same dimensions as the test pieces of Alloy A with the compression axis parallel to the long axis of the continuously cast blooms in a region where grains were found to be columnar. Moreover, isothermal deformation tests were conducted on a Gleeble-3500 thermomechanical simulator (Dynamic Systems Inc. (DSI), New York, NY, USA) at temperatures from 1100 to 1250   at 50   intervals and with target strain rates of 0.1 , 1.0 , and 10.0   s 1 (Figure 1). These temperatures were chosen to prevent the phenomenon of barreling, which results in inhomogeneous strains in compression testing samples [16]. The typical deviation in test temperatures was ± 5   and the actual strain rate did not deviate by more than 10% from the target strain rate. The calibration of the Gleeble thermomechanical simulator showed a precision of ± 1% in both stress and temperature measurement. For simplicity, the test conditions will be referenced with respect to their target values in this paper. The samples were compressed to a degree of height reduction of 50%, corresponding to a target true strain of 0.7, and the actual strain was 0.68 ± 0.04 .
Following the convention in published literature for compression testing, all compressive stresses and strains are defined as positive in this paper. Tests were carried out under two conditions: a constant temperature in the range of 1200 and   1250   , and at two different temperatures of 1100 and 1150   . These conditions were selected as the dynamic recrystallization was not complete and the flow stress was not affected by the cast grain structure or grain size [14,15]. Samples tested at two temperatures were initially heated to the homogenization temperature of 1200   for 100   s . The samples were then cooled to the deformation temperature at a rate of 5     s 1 . The samples were held at each deformation temperature for 30   s . Samples were then compressed by a load of 100   kN under vacuum, before being quenched in high pressure air to a temperature of between 1000 and 200   . The deformed samples were cut parallel to the axis of compression and prepared for metallography following standard procedures. The specimens were then electrochemically etched for optical microscopy (Zeiss microscopy, Oberkochen, Germany) in a solution of 10   g oxalic acid and 100   mL   water for 3 to 60   s under an applied potential of 6   V .
The measurement of peak stress and strain was achieved using the measured work hardening rate, θ = d σ d ε | T ,   ε ˙ [17], which was calculated from the stress and strain measurements by averaging the slopes of two adjacent points for each data point (Equation (3), where σ and ε are the coordinates of each data point):
θ = 0.5 ( σ n + 1 σ n ε n + 1 ε n + σ n σ n 1 ε n ε n 1 )
To overcome noise in the data, a curve smoothing by fitting with a high-order polynomial to the stress–strain curves were used to eliminate fluctuations [18,19,20].
During the strain test, the strain hardening coefficient, θ , decreases quickly with the increase in stress, σ , (and strain, ε ). This means that the rate of increase in the flow stress decreases and is due to dynamic recovery. This corresponds to deformation from the onset of plastic deformation to the point at which subgrains have formed in the material. Eventually, θ = σ and the conditions at this time are defined as the critical stress, σ c , and critical strain, ε c . Beyond this strain, dynamic recrystallization begins. During subsequent deformation, σ continues to increase and θ reduces to zero. The stress at which this occurs is defined as the peak stress ,   σ p . Similarly, the corresponding strain is defined as the peak strain ε p . At this point, there is a balance between the work hardening and softening by recovery and recrystallization. θ then decreases to the minimum before rising again. When it increases to zero, there must be a new balance between work hardening and softening. The stress at this point is defined the steady state stress, σ s with a corresponding steady state strain, ε s . The definitions of the points are summarized in Figure 2 [21].
The onset of dynamic recrystallization can also be detected from inflections in plots of ln   θ versus ln σ and ln   θ versus ε , regardless of the presence of stress peaks in the flow curves [17,22,23,24,25,26].

2.3. Electron Backscatter Diffraction Analysis

Samples for EBSD were ground and polished to a 3   μ m finish using diamond paste and then to a finish of 0.05   μ m using colloidal silica. EBSD was conducted using a Zeiss Sigma field emission gun scanning electron microscope (Carl Zeiss Microscopy GmbH, Oberkochen, Germany). The data were acquired and processed using the software TSL OIM Analysis 7 (AMETEK, Inc., Berwyn, PA, USA). Orientation imaging microscopy map and the misorientation angle of grains were calculated from the EBSD results. For each sample, a single EBSD scan with a size step of 3.0   µ m was acquired, covering an area of 2319   µ m × 1737   µ m ( ~ 4.03   mm 2 ). In addition, two EBSD scans with size step of 1.0   µ m were acquired for all samples, covering an area of 581   µ m × 435   µ m ( ~ 0.253   mm 2 ). This was used to estimate dynamic recrystallized grain size (line intercept method). For each deformation condition, a standard error of the average value was performed on three scans (standard error of the mean value, σ M , is related to the standard deviation of each individual measurement, σ and the square root of the total number, N , of data sets, Equation (4)):
σ M = σ N 0.5
A size step of 0.2   µ m , covering an area of ~ 0.01   mm 2 was also used for local scans of the recrystallized microstructure. In the present work, a grain boundary is defined by EBSD when the change in orientation across it exceeds 5 ° [14,27]. This is known as the grain tolerance angle [28,29]. Twin boundaries (defined as boundaries with a misorientation of 60° about 111 axes) were ignored when estimating the recrystallized grain size. Boundaries which are classified as high-angle (misorientation angle, θ > 10 ° ) are interpreted as fully formed grain boundaries, whereas low angle boundaries ( 2 °   <   θ   <   10 ° ) are interpreted as sub-grain boundaries comprising a high density of dislocations. The minimum misorientation angle, θ , detected between grains. was 2 ° and the maximum was 62.7 ° . The grain orientation spread technique was used to distinguish the dynamically recrystallized grains from the deformed matrix [29,30,31,32,33]. If a grain has a grain orientation spread of < 2 ° , it is interpreted as a recrystallized grain. Higher values are taken to indicate that a grain has either not undergone recrystallization or has deformed significantly after being formed by recrystallization [28,29]. In addition, EBSD was used to investigate deformation texture and recrystallized texture by the inspection of the inverse pole figure of each sample. The fraction of recrystallized grains, the number density of dynamically recrystallized grains (excluding twins) and dynamically recrystallized grain size (excluding twins) were investigated.

3. Results

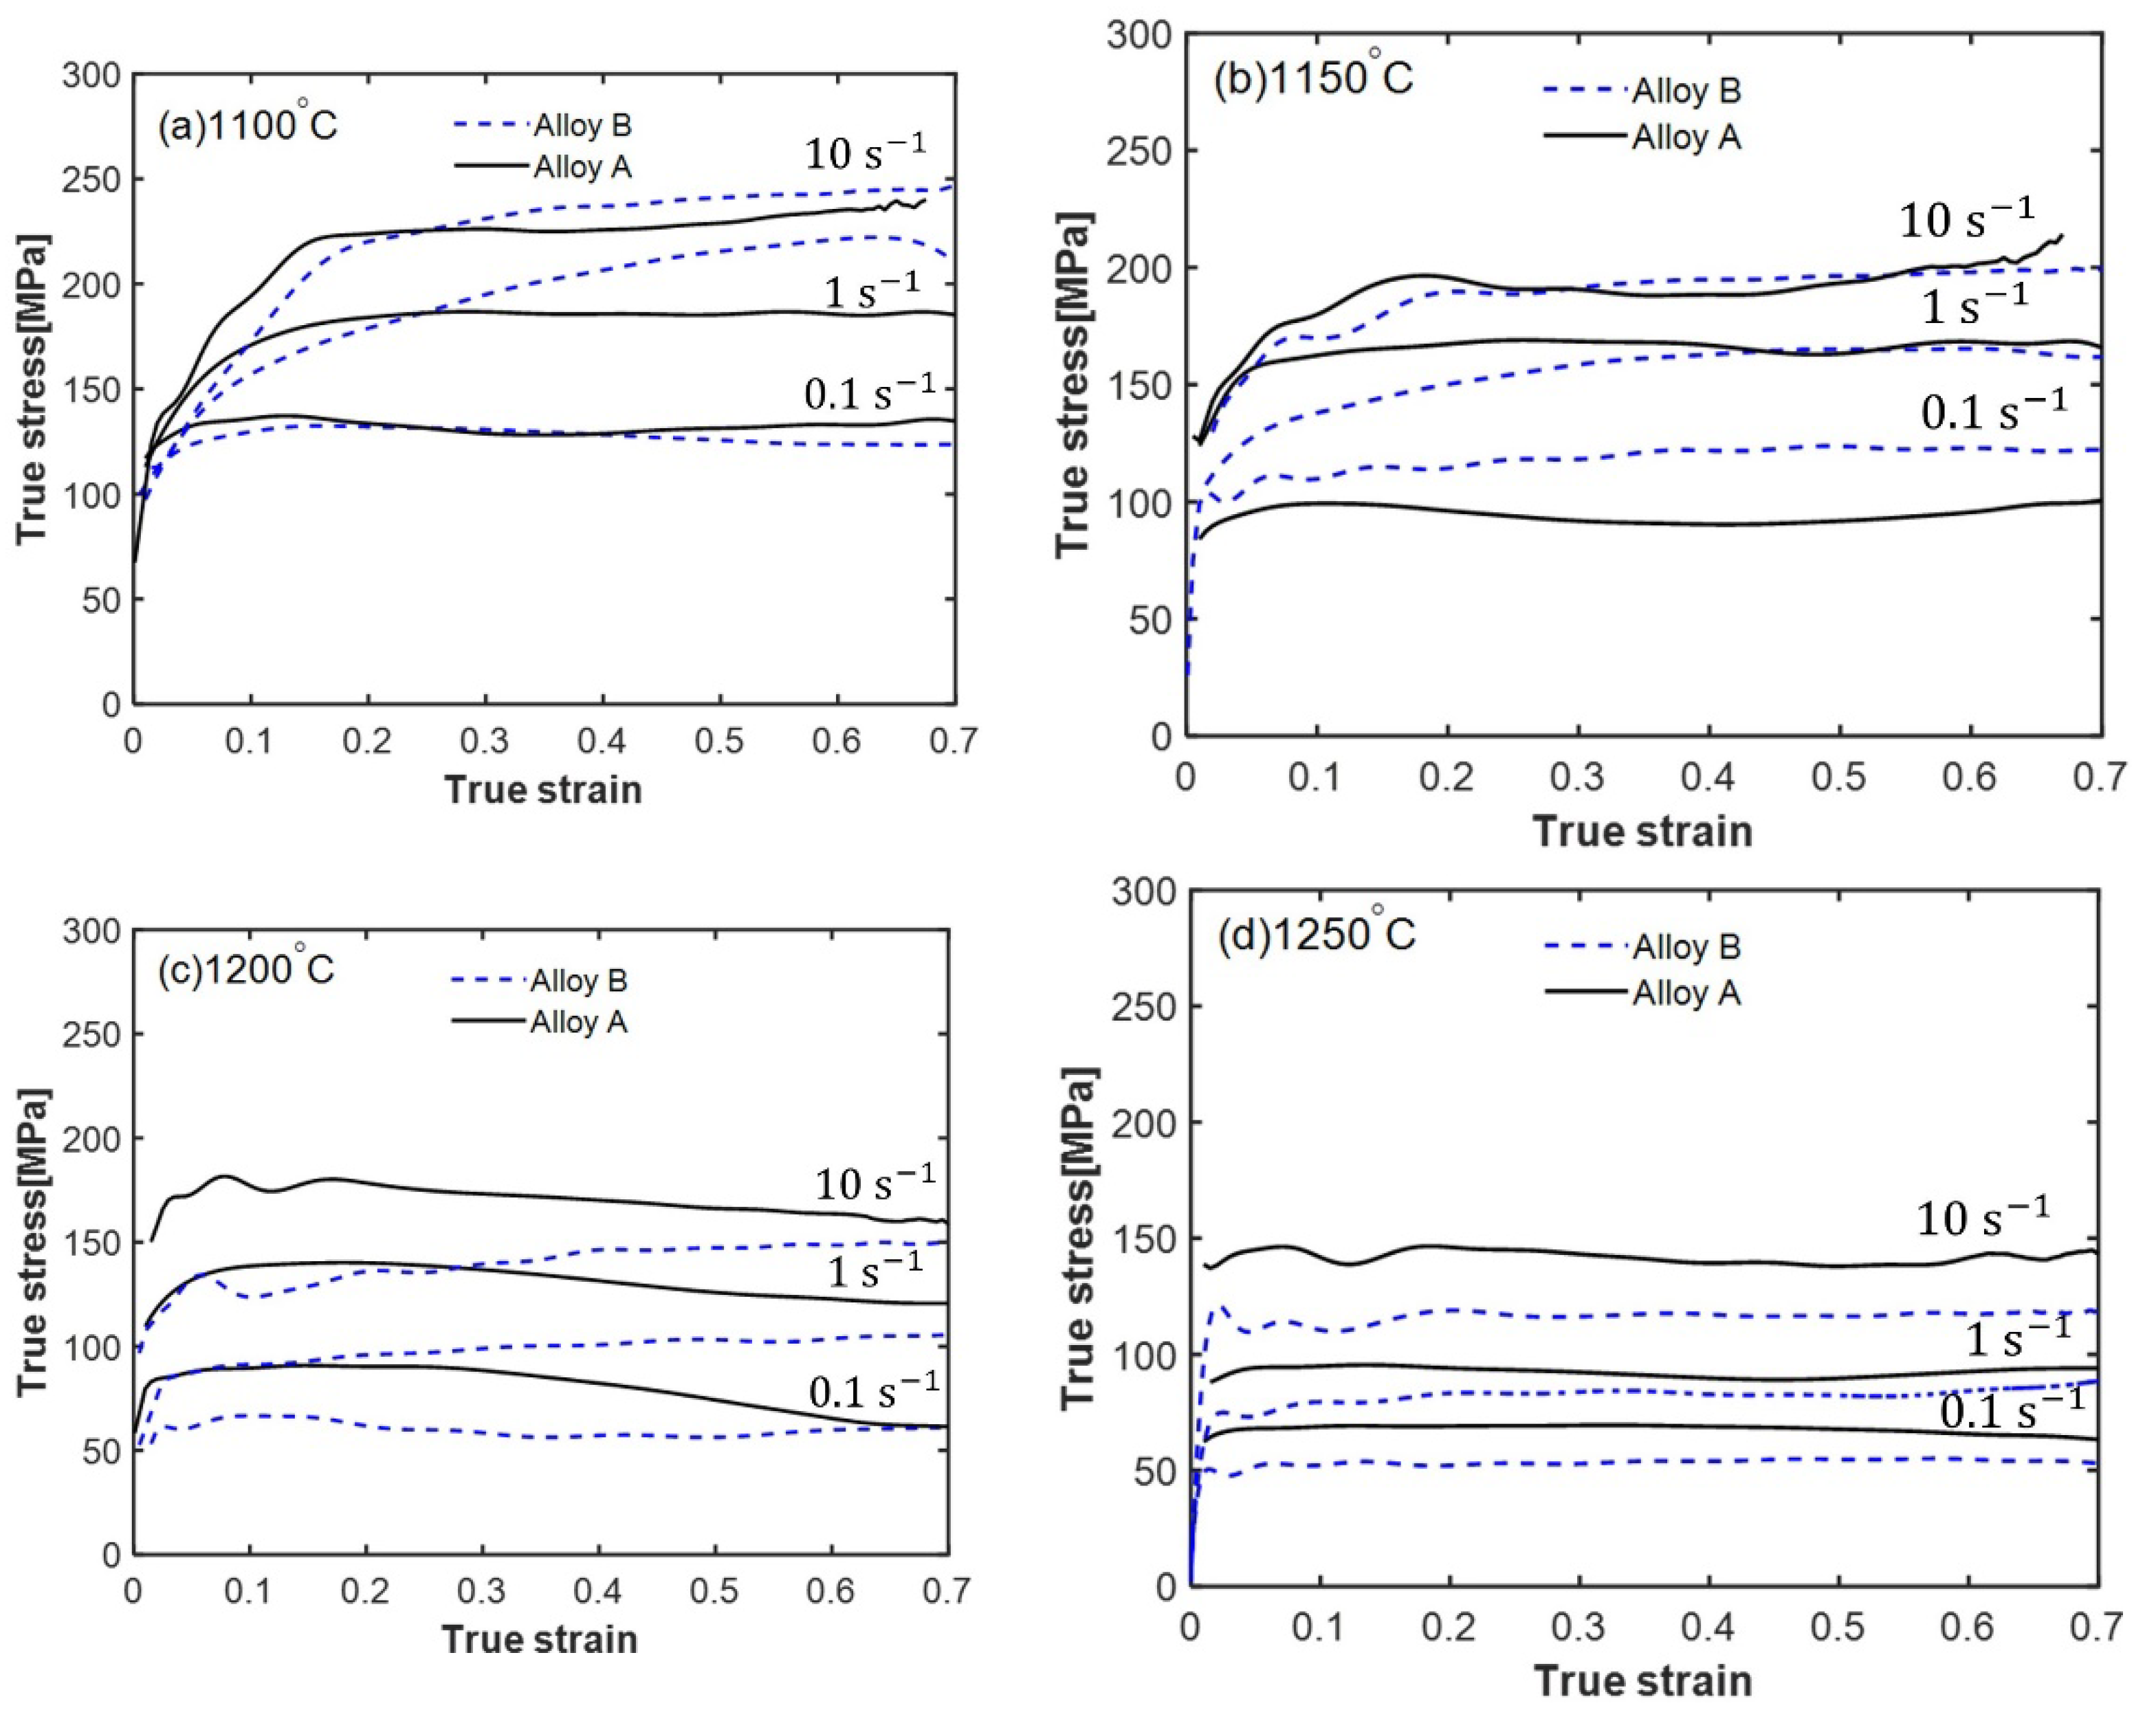
3.1. Stress–Strain Curves

The flow stress in both Alloys A and B increases with the strain rate and decreases with deformation temperature (Figure 3). The peak stress of Alloy A was significantly higher than that of Alloy B for each condition, with the sole exception of a deformation at 1150   and a strain rate of 0.1   s 1 . Alloy A exhibits slight flow softening at all strain rates and at temperatures between 1100 and   1200   , which is visible as a reduction in the flow stress in the stress–strain curves during deformation (Figure 3a–c). Alloy B shows no such softening behavior. At a temperature of 1200 and   1250   , the flow curves of Alloy A are located above those of Alloy B and Alloy B almost showed a steady-state stress. The stress–strain curves of Alloy A show a softening behavior throughout the test at   1200   (Figure 3c) but show a steady-state stress at 1250   (Figure 3d). The difference between the highest recorded stress and stresses at strains higher than that at which the highest stress was observed become less significant as the strain rate increases and/or the deformation temperature decreases. There is no clear peak at a strain rate of 10 s−1 for any test temperature: in some cases, it may be possible to identify feasible candidates for peak stresses, but none of them are a clearly well defined peak and is either followed by a second peak (e.g., Alloy B at   1200   ) or a very slight reduction in stress (e.g., Alloy B at 1150   ) .

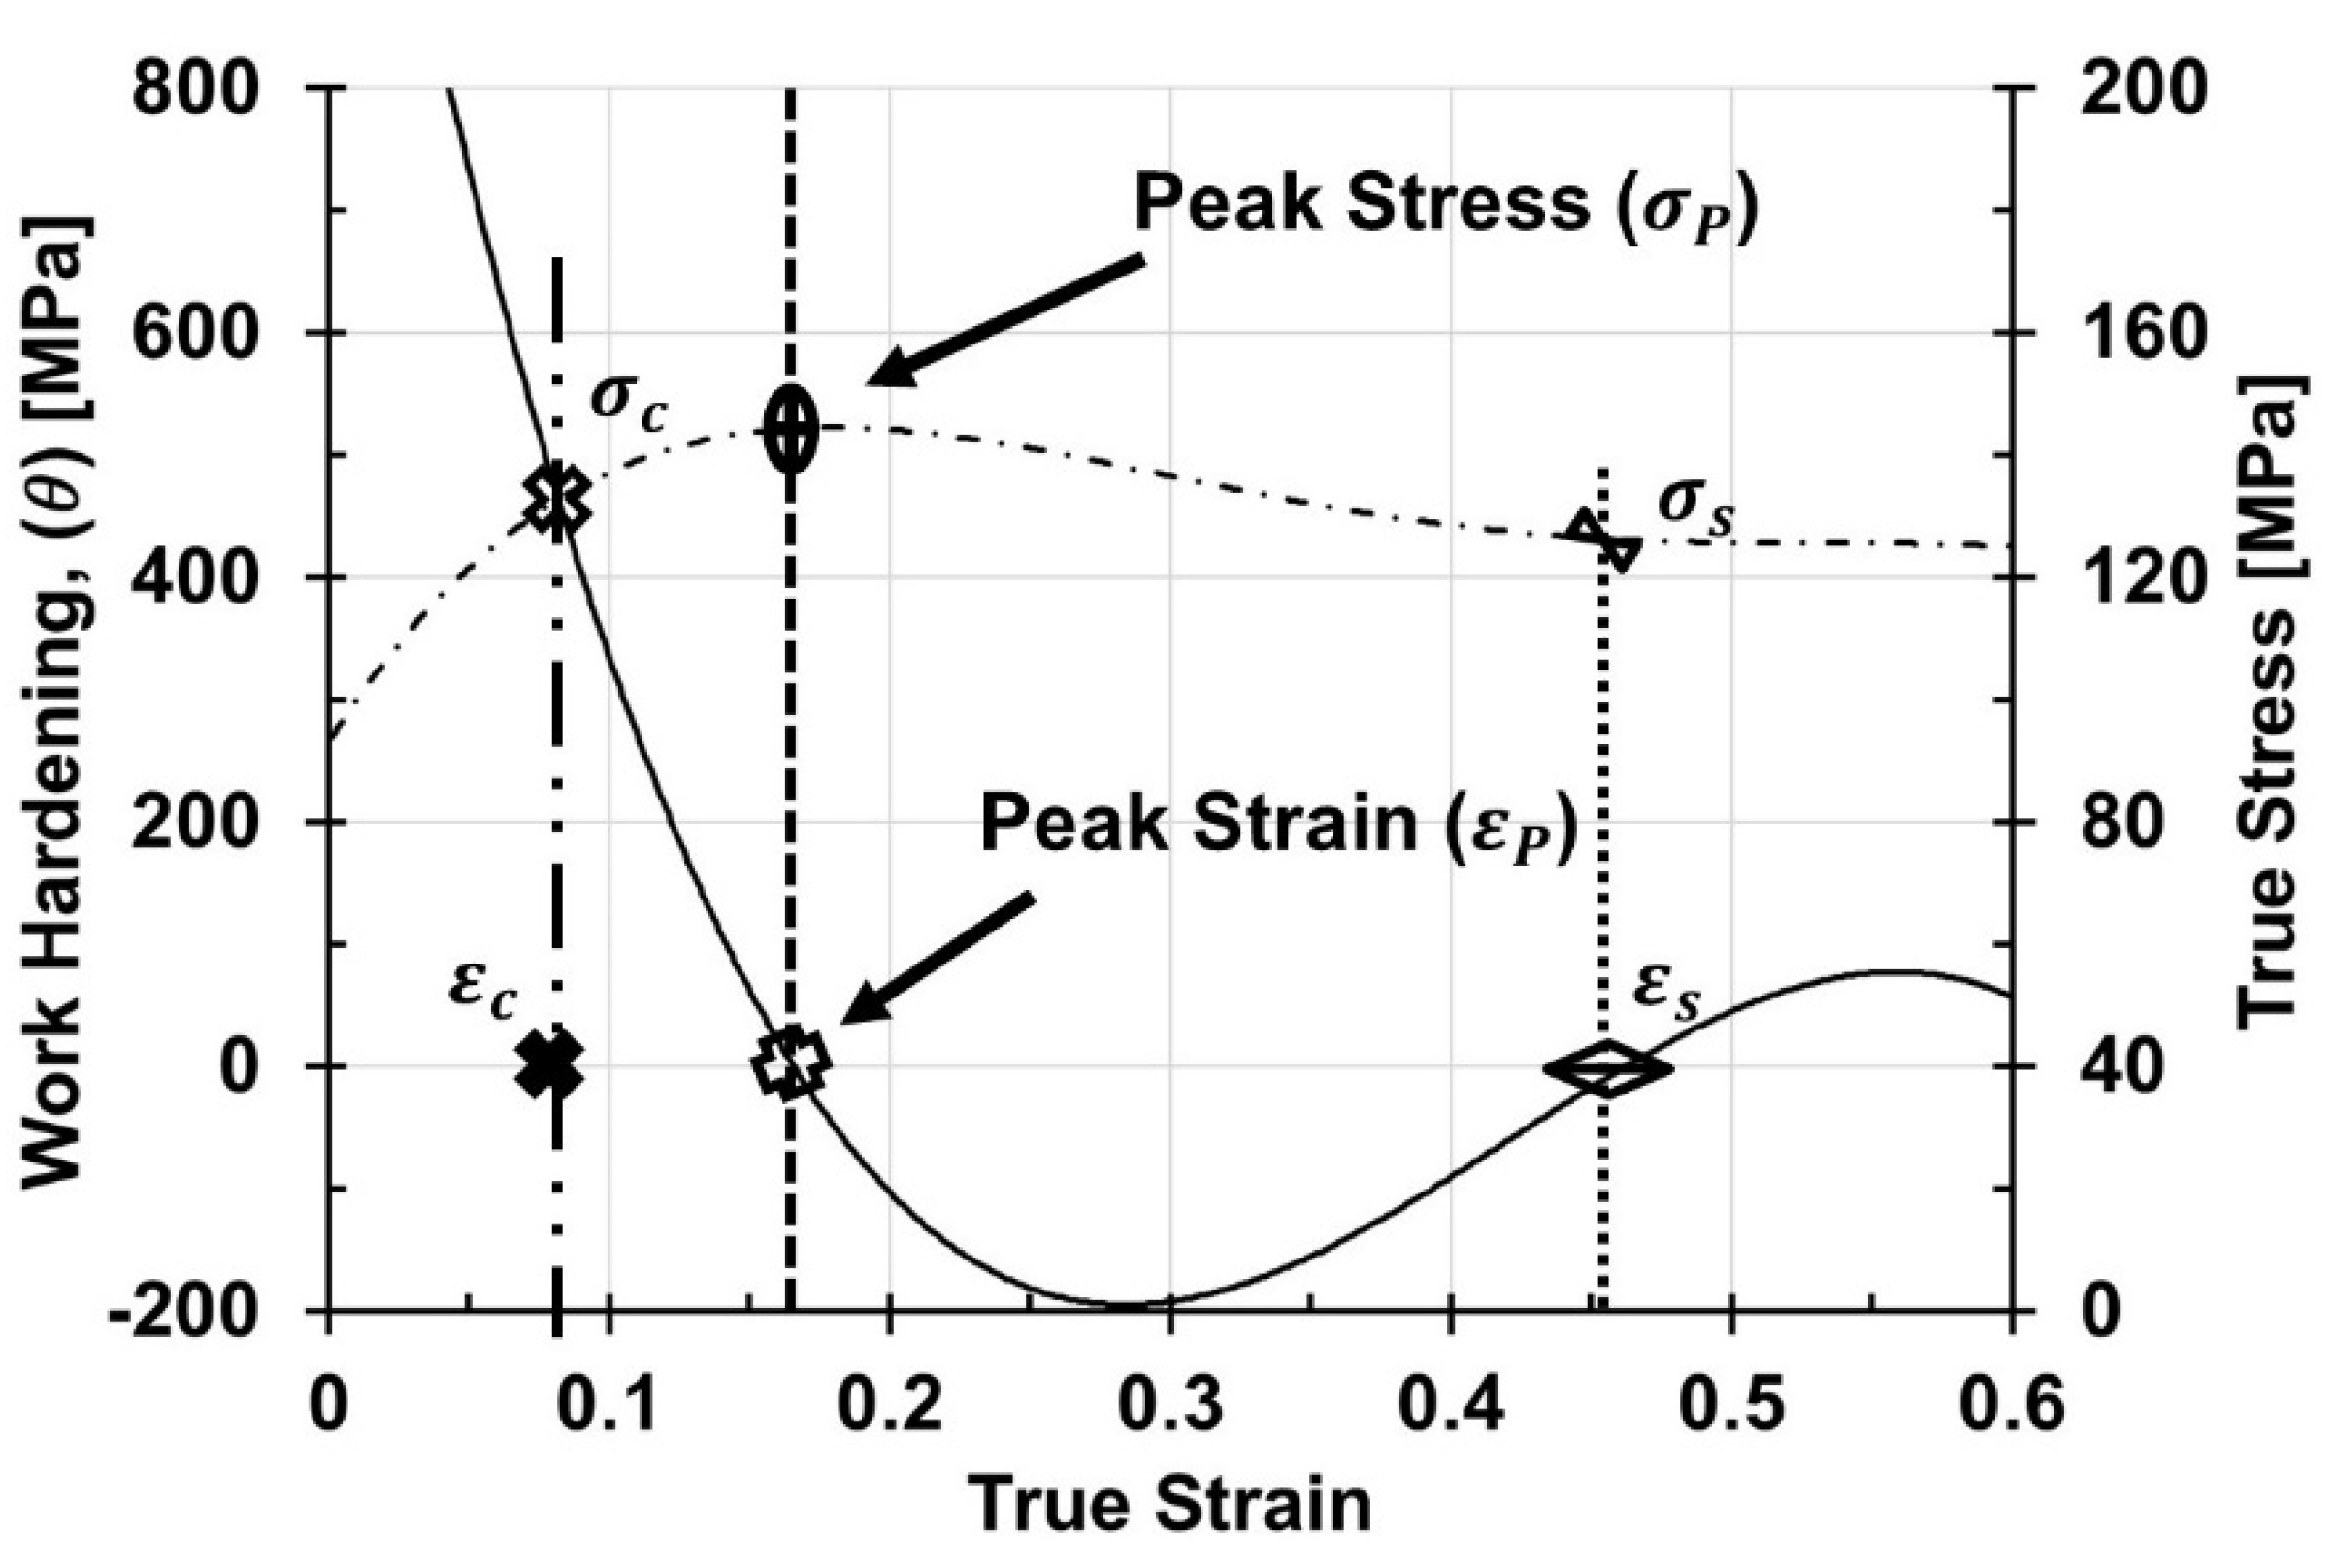
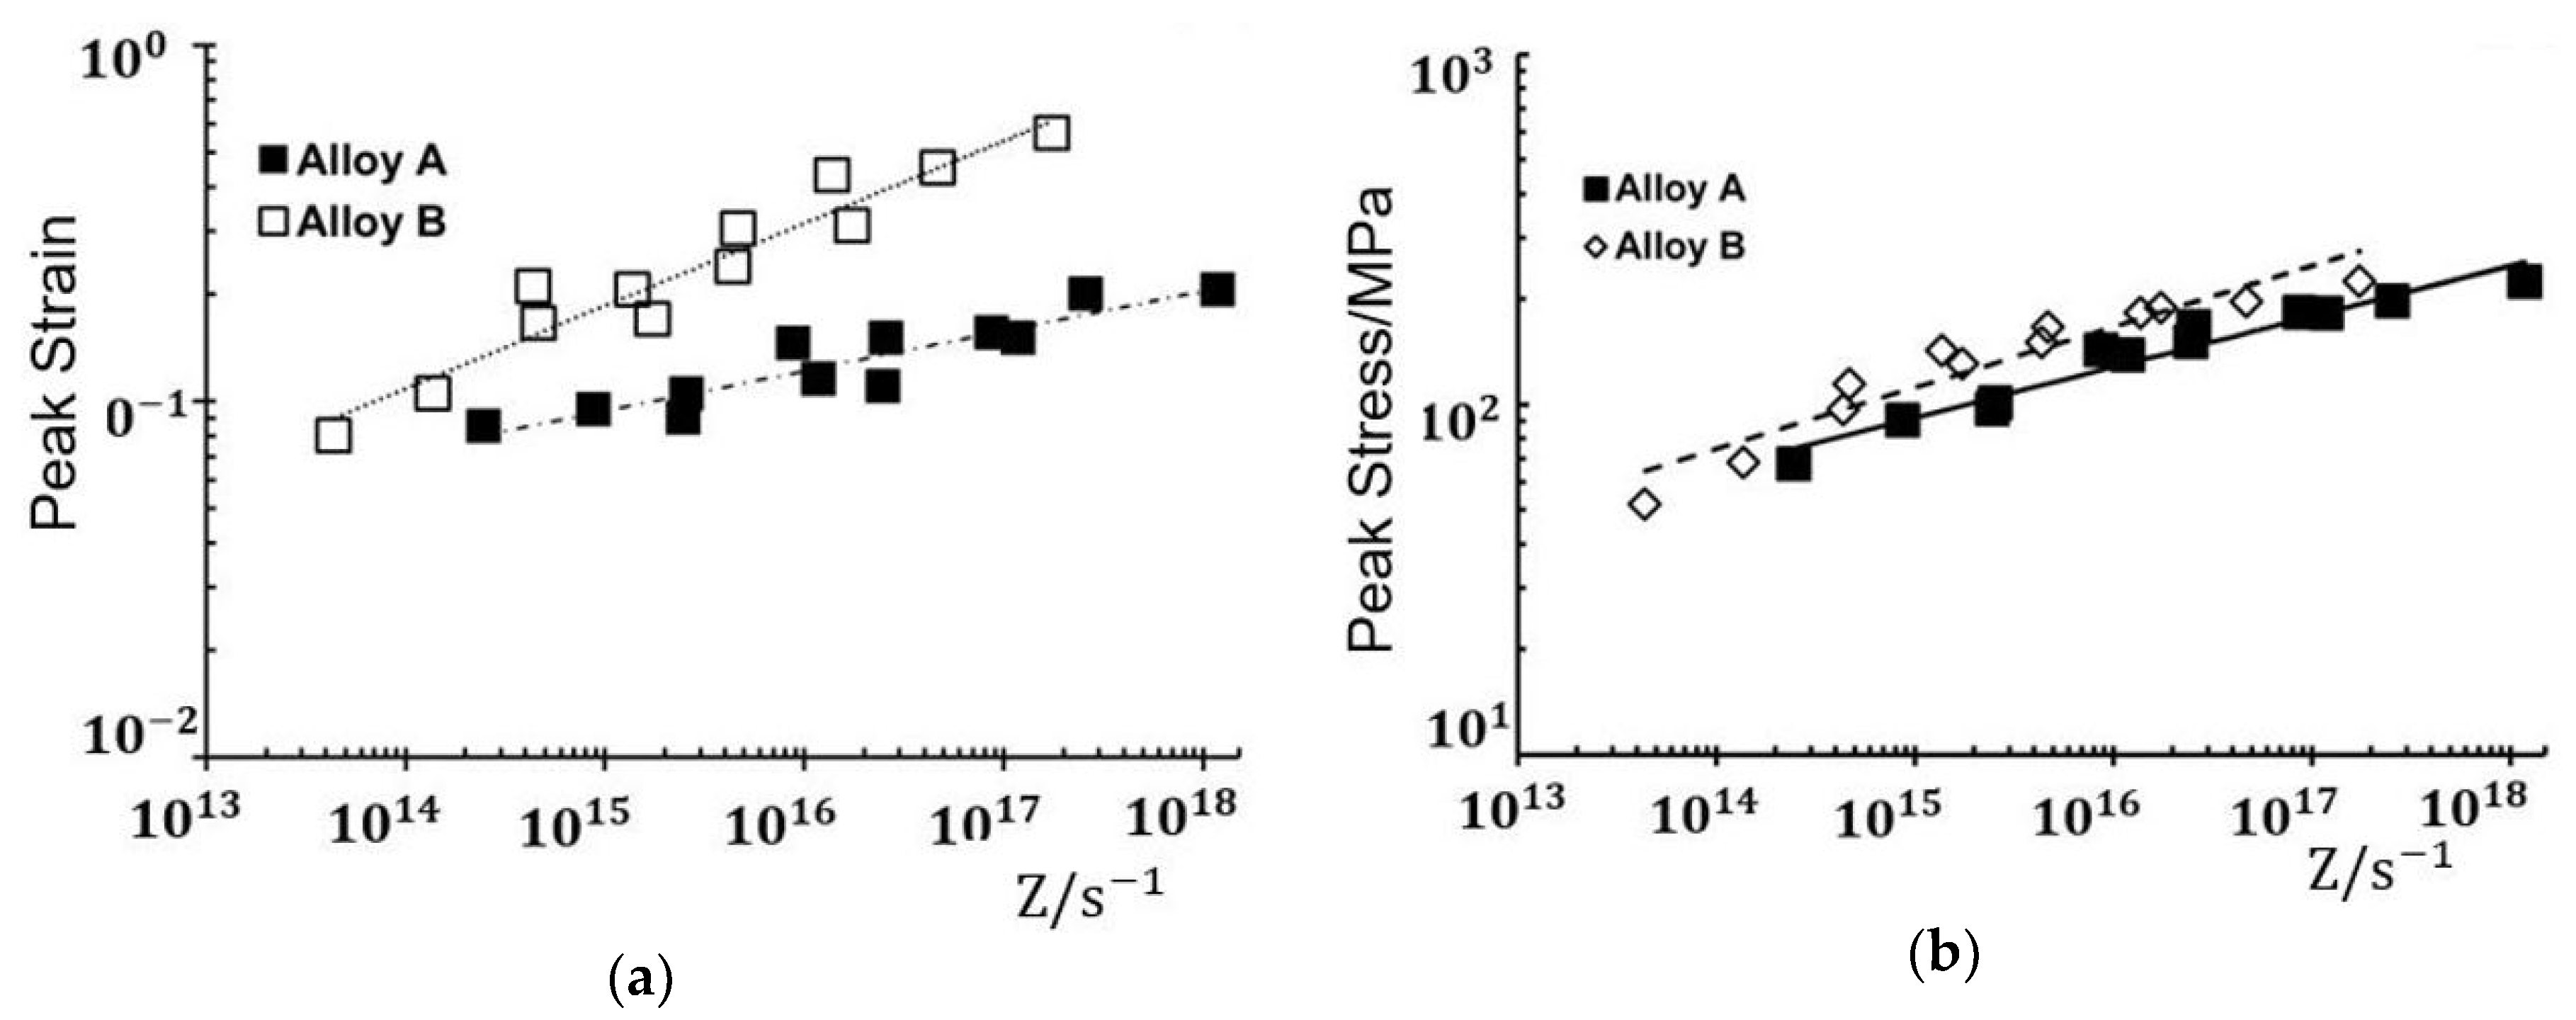
3.2. Peak Strain and Peak Stress

The peak strain, ε p , and peak stress, σ p , were defined as occurring at a point at which the work hardening rate first fell to zero. Both the peak strain and peak stress decrease with increasing deformation temperatures and increase with the increasing strain rates (Figure 4). For all deformation conditions, the peak strain of Alloy B was approximately 25% to 150% higher than that of Alloy A. At 1200 and 1250   , the peak stress of Alloy A was approximately 10 to 15% higher than that of Alloy B for all strain rates. However, neither composition has a consistently higher value of peak stress. Furthermore, the differences in the peak strain between different temperatures were smaller in Alloy A, compared to Alloy B.

3.3. Evolution of Microstructure

3.3.1. Initial Structure before Deformation

Inspection of the results of EBSD analysis of transverse samples in the as-solution annealed condition (Figure 5) shows that both samples A and B are composed of large fully recrystallized grains with an average grain size, D 0 , of 558 ± 80   µ m (Alloy A) and 565 ± 65   µ m (Alloy B), measured using the intercept method (Equation (4), where multiple random straight lines of length d i intercept a total of N grains). Alloy A contains grains aligned with 110 , 111 and 112 directions, while Alloy B has grains oriented close to 001 directions:
D 0 = 1 N i n d i

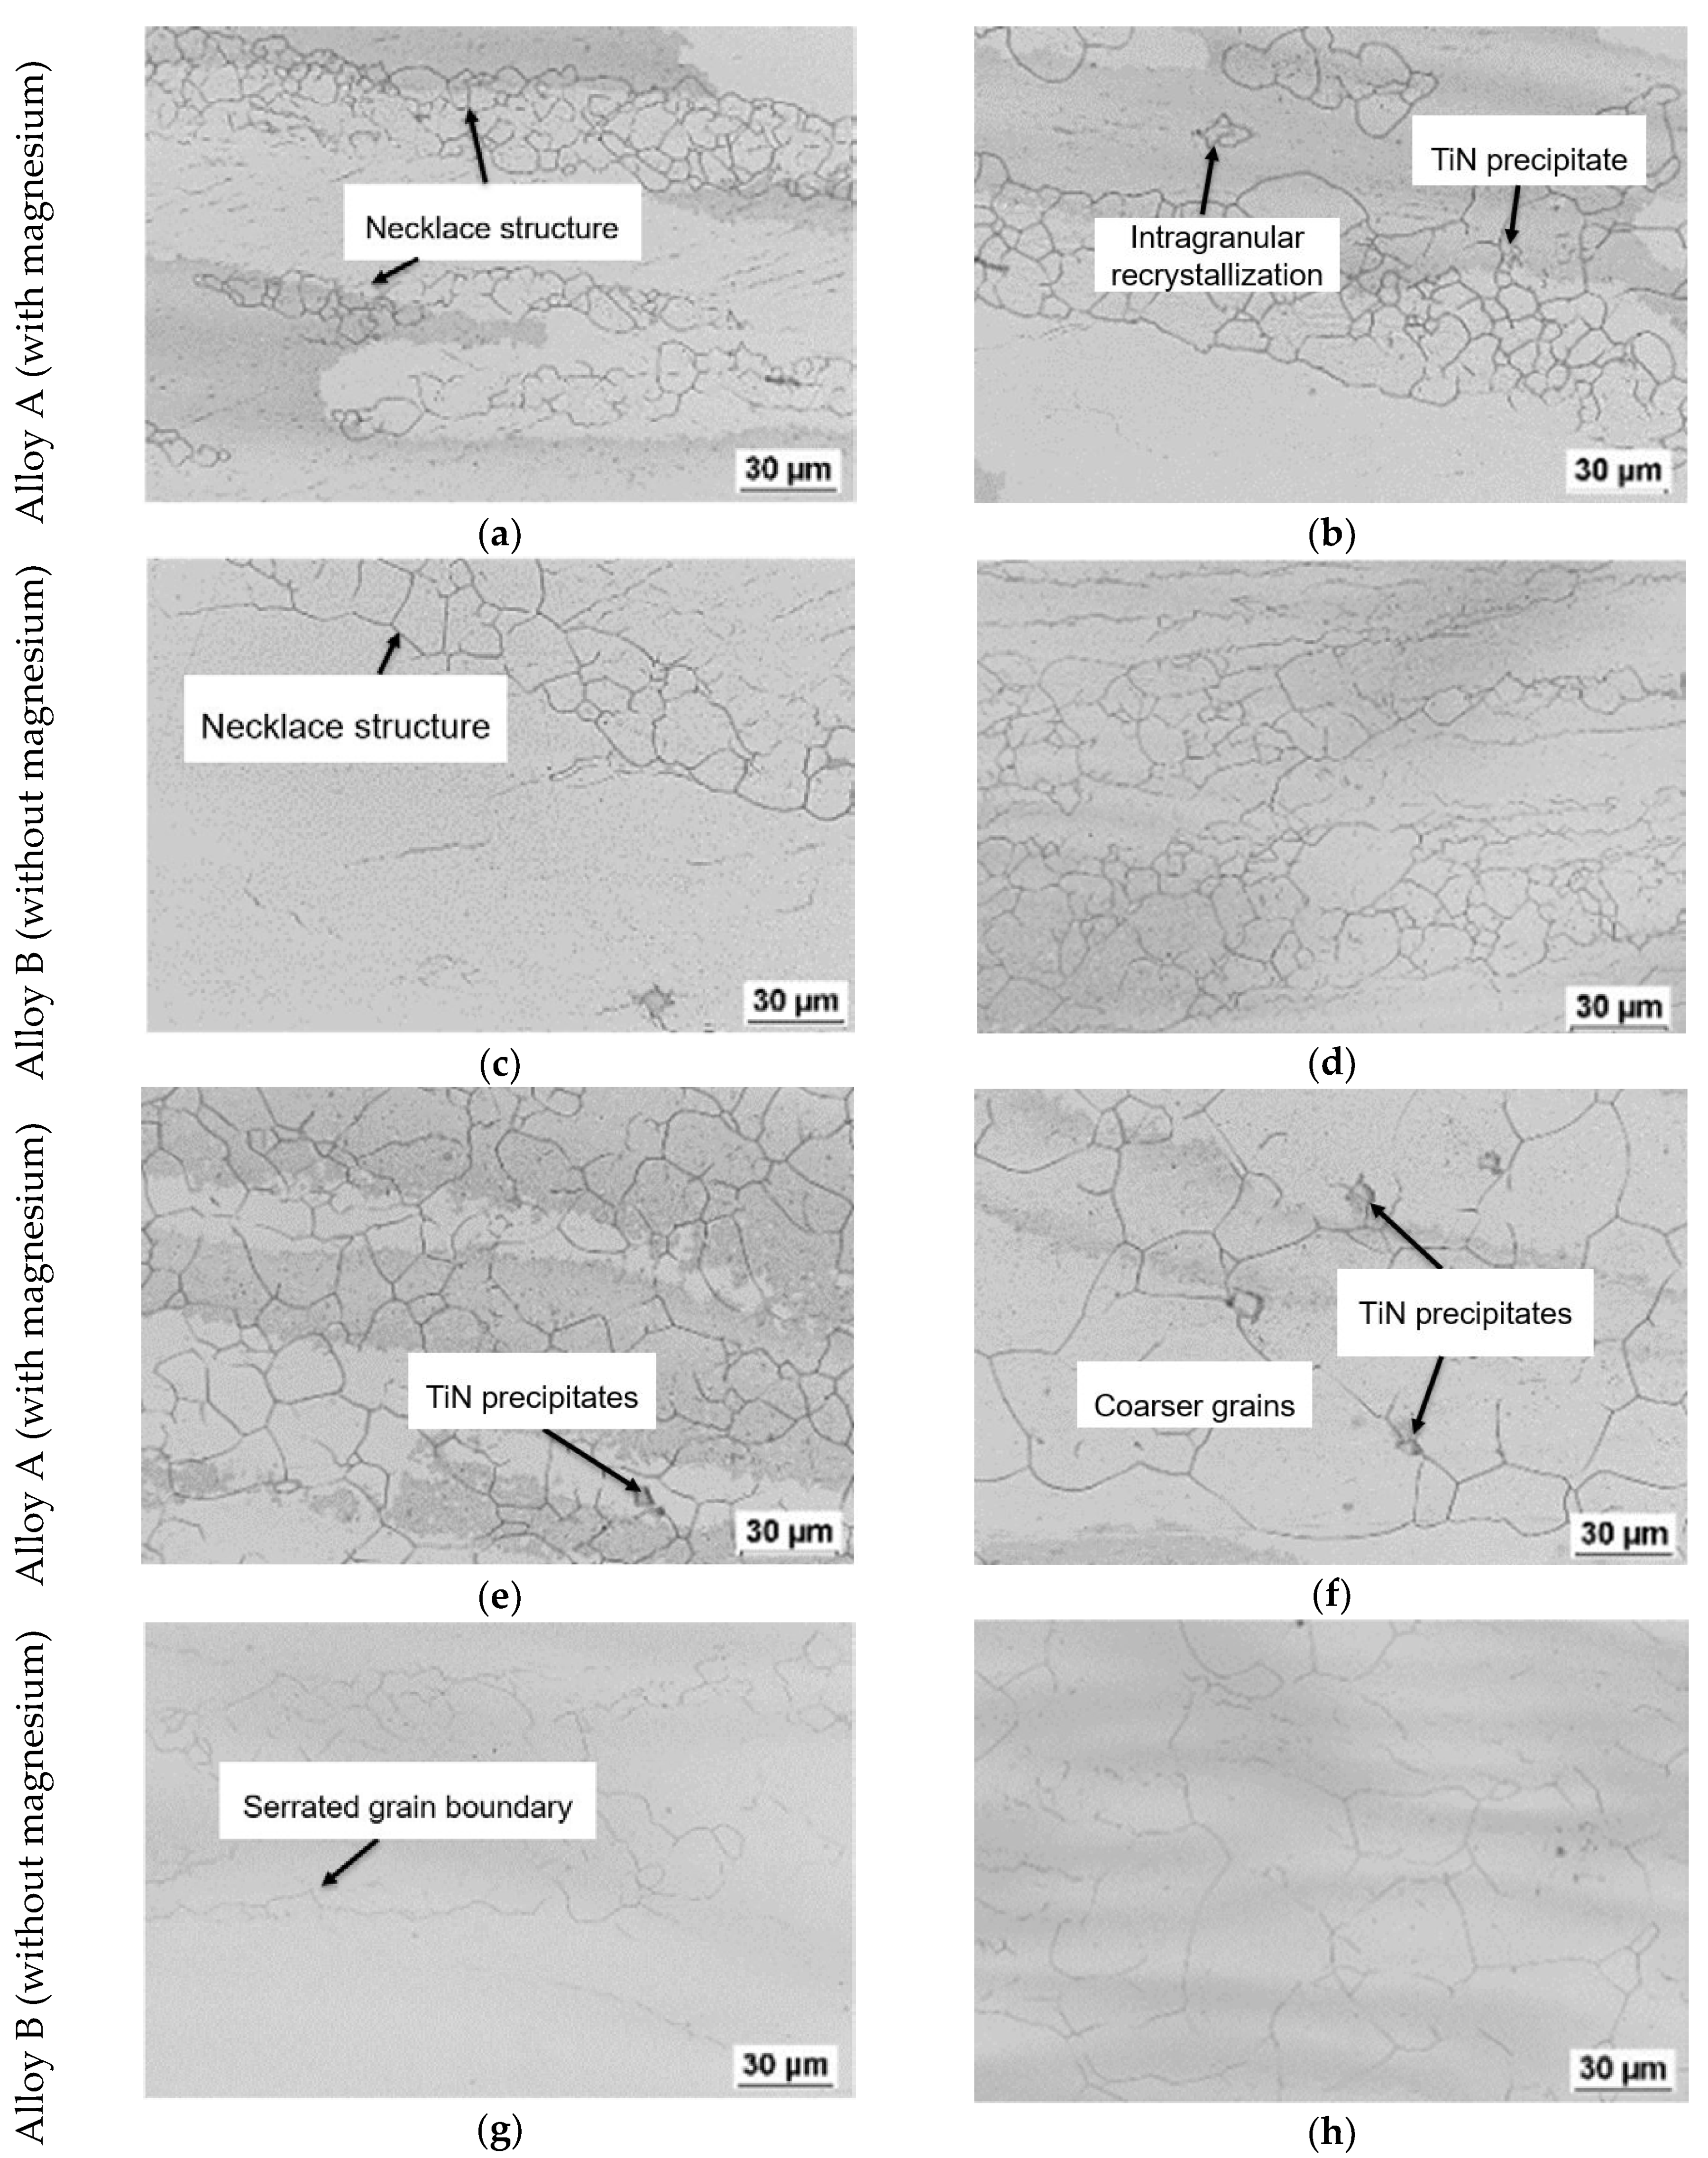
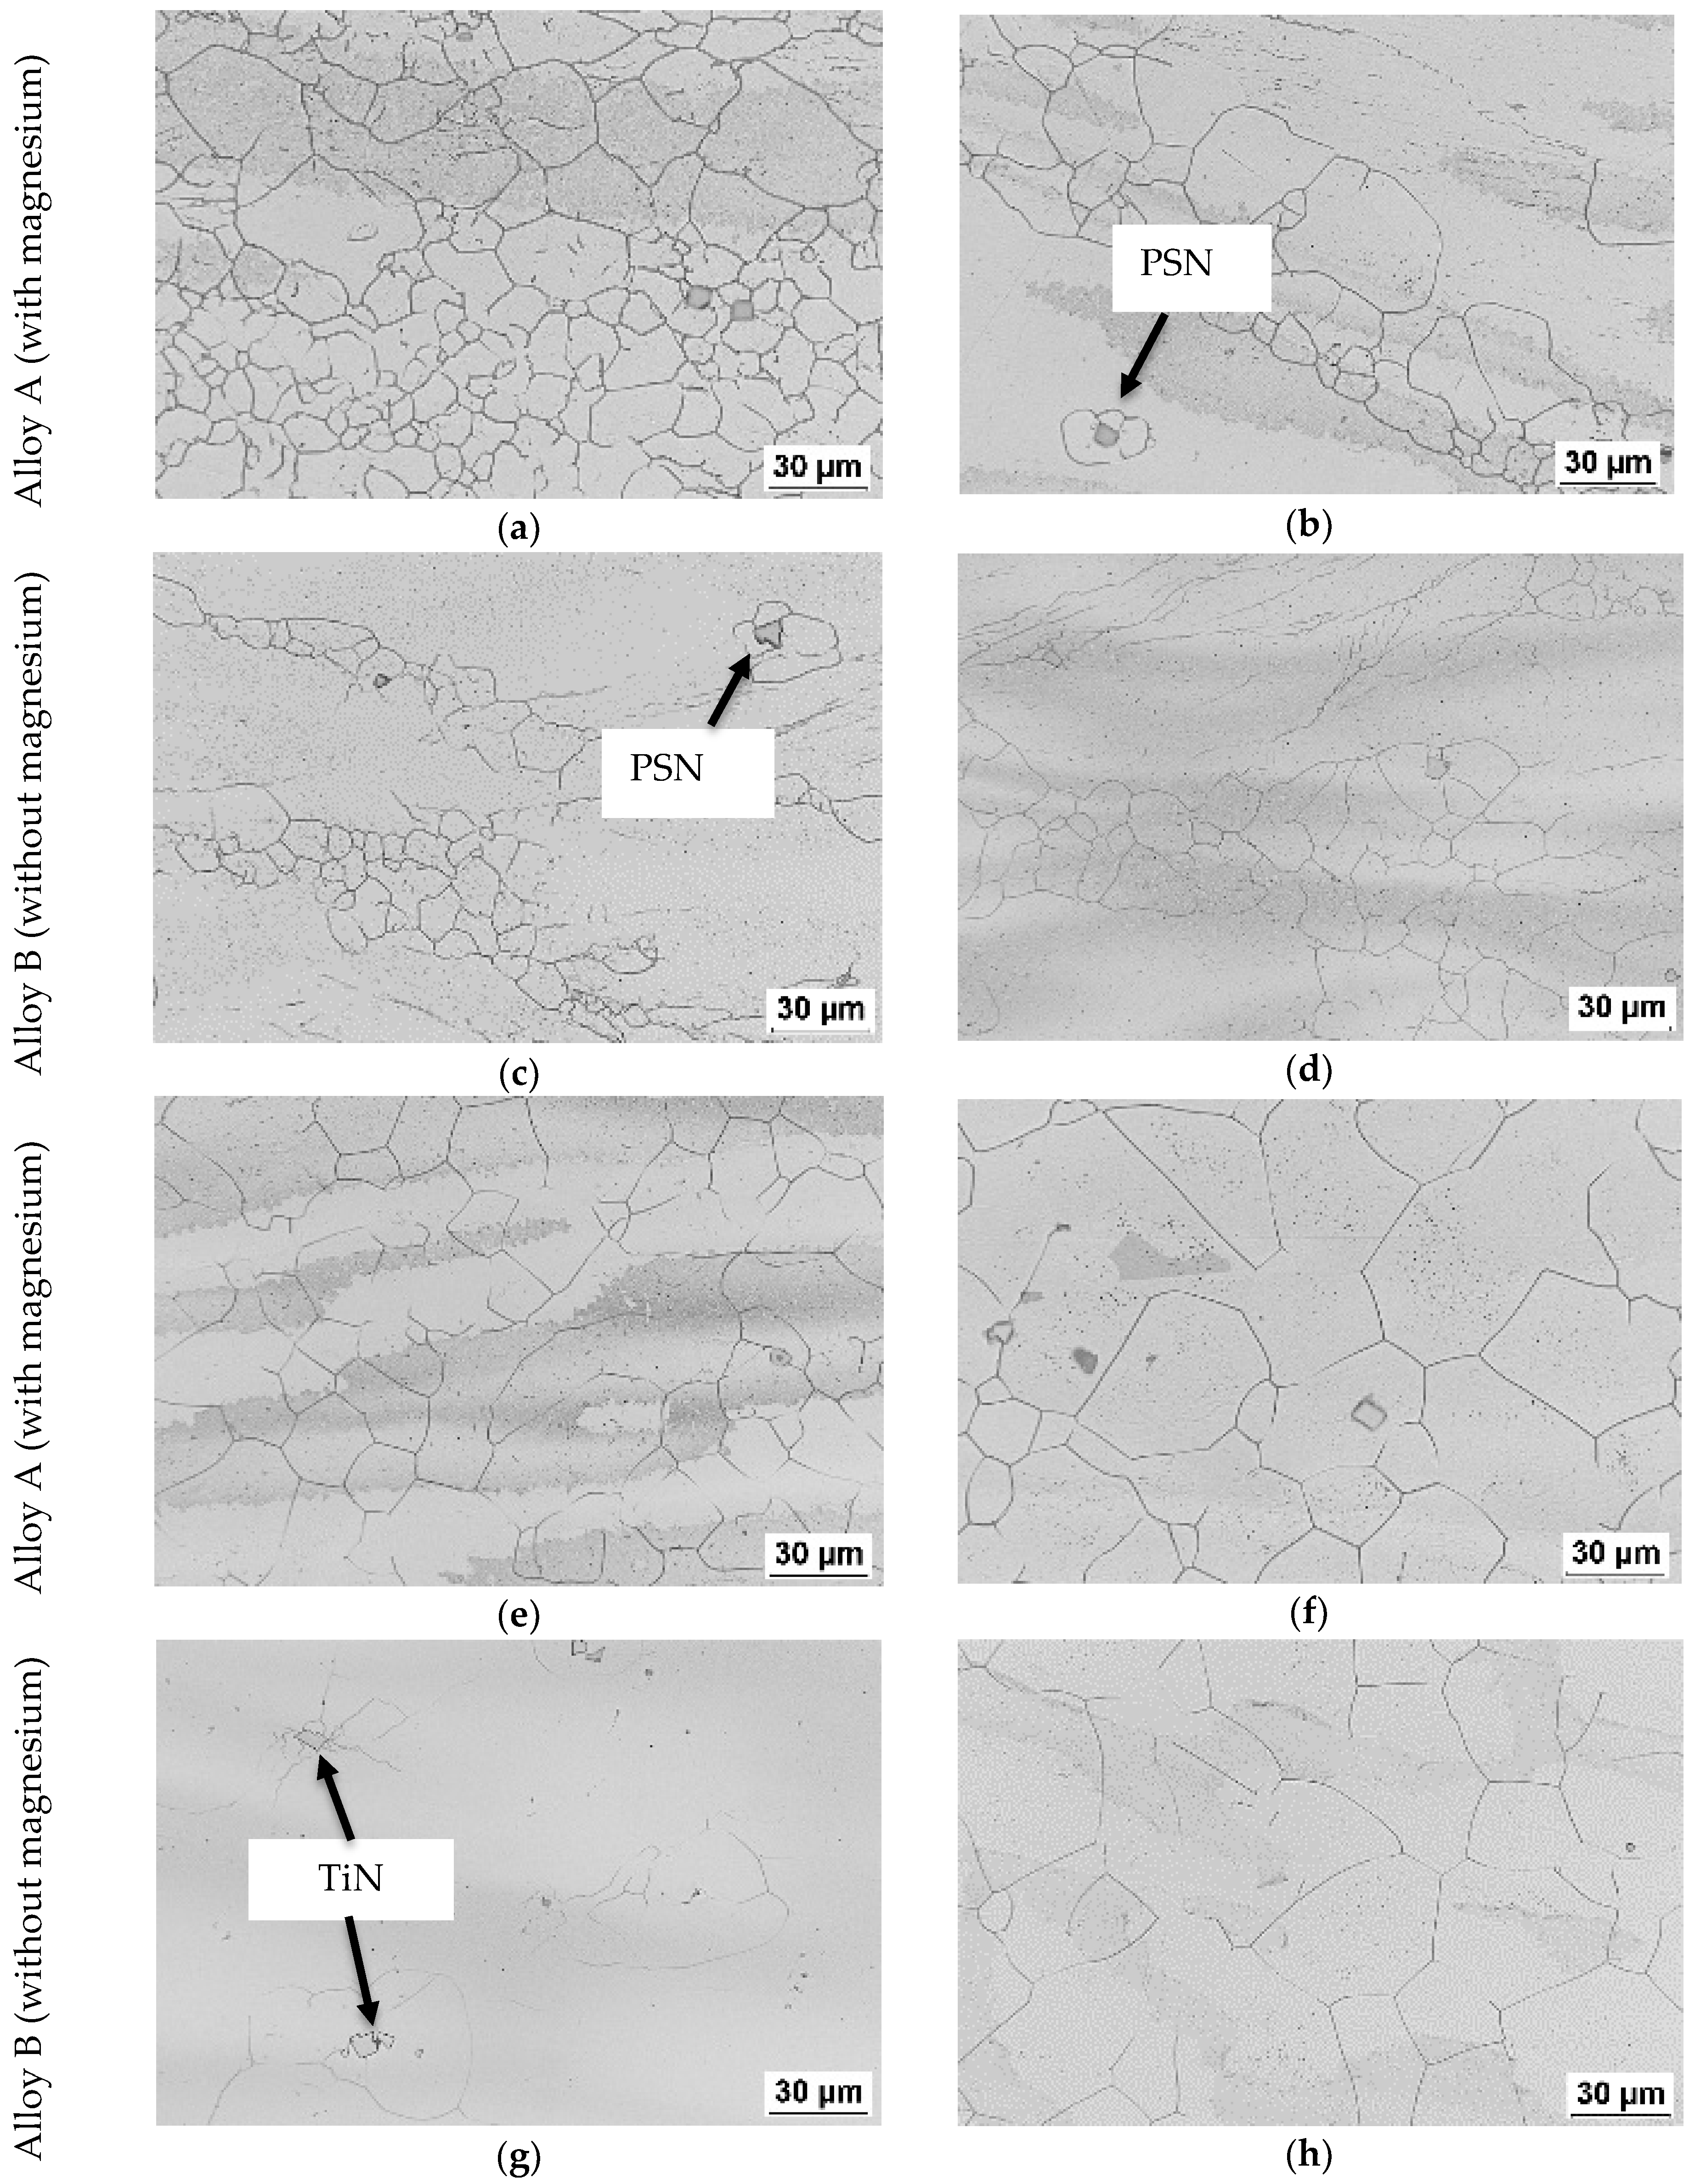
3.3.2. Microstructure after Hot Compression Testing

The deformed microstructure consists of serrated grain boundaries, bulging non-recrystallized grains, intragranular recrystallization and partially recrystallized grains (also termed a necklace structure) (Figure 6, Figure 7 and Figure 8), which are also all reported in previous published work [14,15,27].
A large number of coarse grains and a necklace structure was observed in compressed samples of both alloys deformed at a strain rate of 0.1   s 1 at 1100 and 1150   (Figure 6a–d). Optical micrographs after deformation at a strain rate of 0.1   s 1 and deformation temperatures of 1200 and 1250   show that equiaxed grains dominated (Figure 6e–h). Finely dispersed second-phase particles identified to be titanium nitride (TiN) were found at the grain boundaries in samples deformed at 1200   , (Figure 6e,g, Figure 7e,g and Figure 8e,g). Furthermore, small, recrystallized grains were also observed, marked by the circle in the micrograph, (Figure 6h).
The prevalence of dynamically recrystallized grains in both materials is seen to decrease with increasing deformation temperature at a strain rate   10 . 0   s 1 (Figure 8). Non-recrystallized grains and elongated deformed grains in Alloy A were observed at temperatures from 1100 to 1200   . Necklace structures were also observed in both trials at 1150   . However, it can also be observed that the fraction of recrystallized grains in sample A seems higher than that of the equivalent sample B at all deformation temperatures. In addition, large numbers of recrystallized grains surrounded by large TiN particles were observed in Alloy B at a temperature of 1200   with a strain rate of   10 . 0   s 1 (Figure 8g). In addition, refined dynamically recrystallized grains were observed in all samples deformed at 1100 and 1150   and also in sample A at 1200     . The recrystallized grains were larger following deformation at a temperature of   1250   , compared to lower temperatures.
Large numbers of recrystallized grains surrounded by large precipitates were observed in Alloy A after a hot-deformation at a temperature of 1250   and a strain rate of 0.1   s 1 (Figure 9). The precipitates were elongated along the grain boundary and appear to consist of a central globular particle around which a cubic particle grew. Energy Dispersive X-ray spectroscopy (EDS) analysis shows that the central globular particle is rich in oxygen, aluminum and magnesium, which is consistent with a mixture of MgO and Al2O3 (Table 2, spectrum 1). The larger cubic particle around the central particle was rich in titanium and nitrogen and corresponds to a TiN inclusion (Table 2, spectrum 2). The titanium signal from the central cubic particle is likely to come from the outer particle, since it is not possible to prevent the electron beam from spreading in the sample and generating an X-ray signal from the region around the central precipitate.

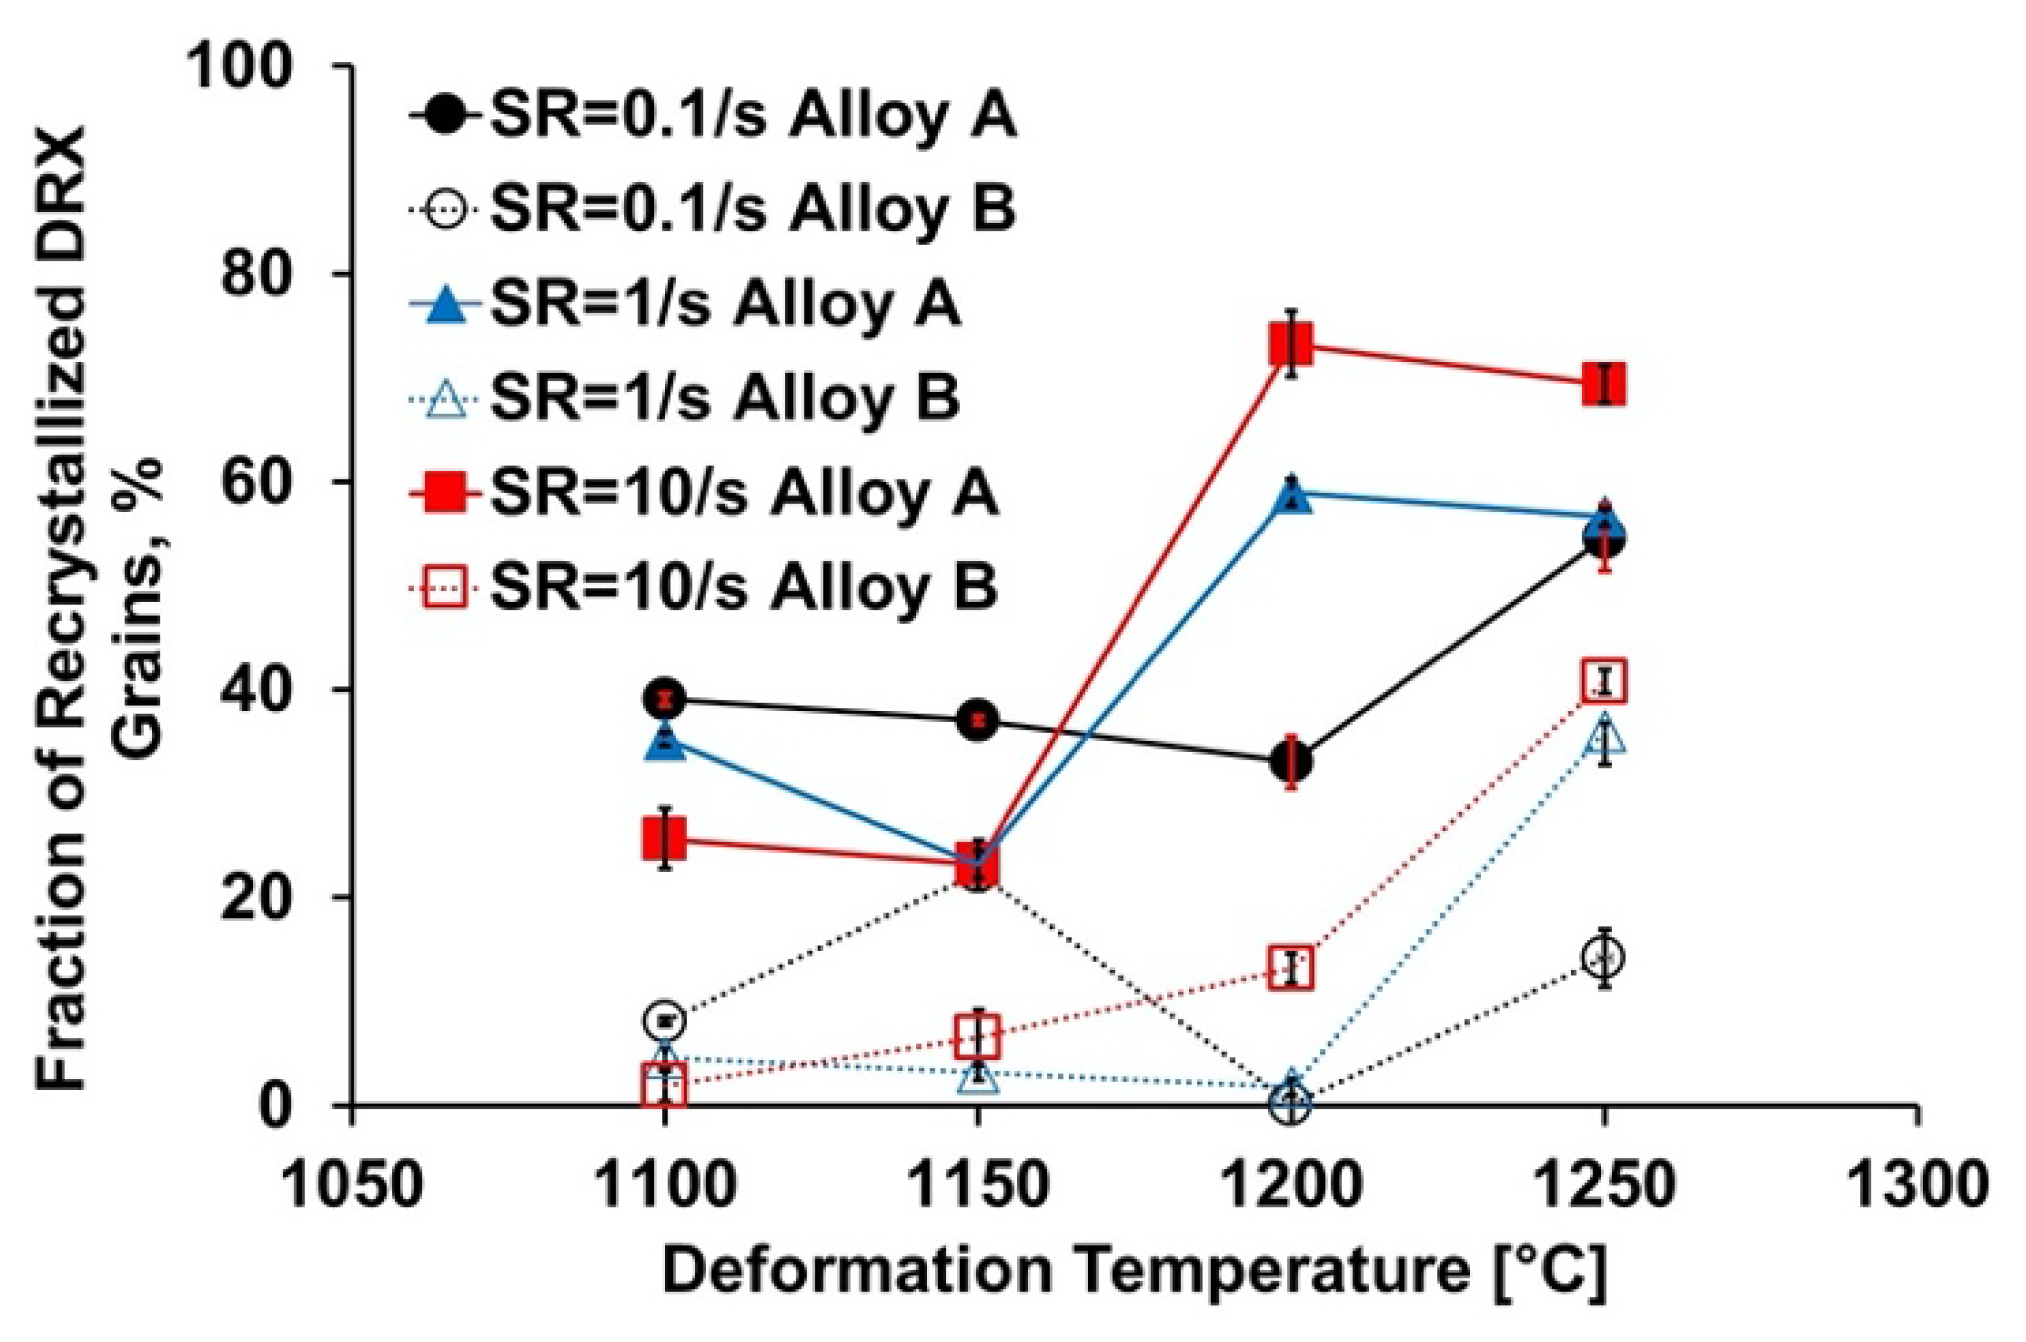
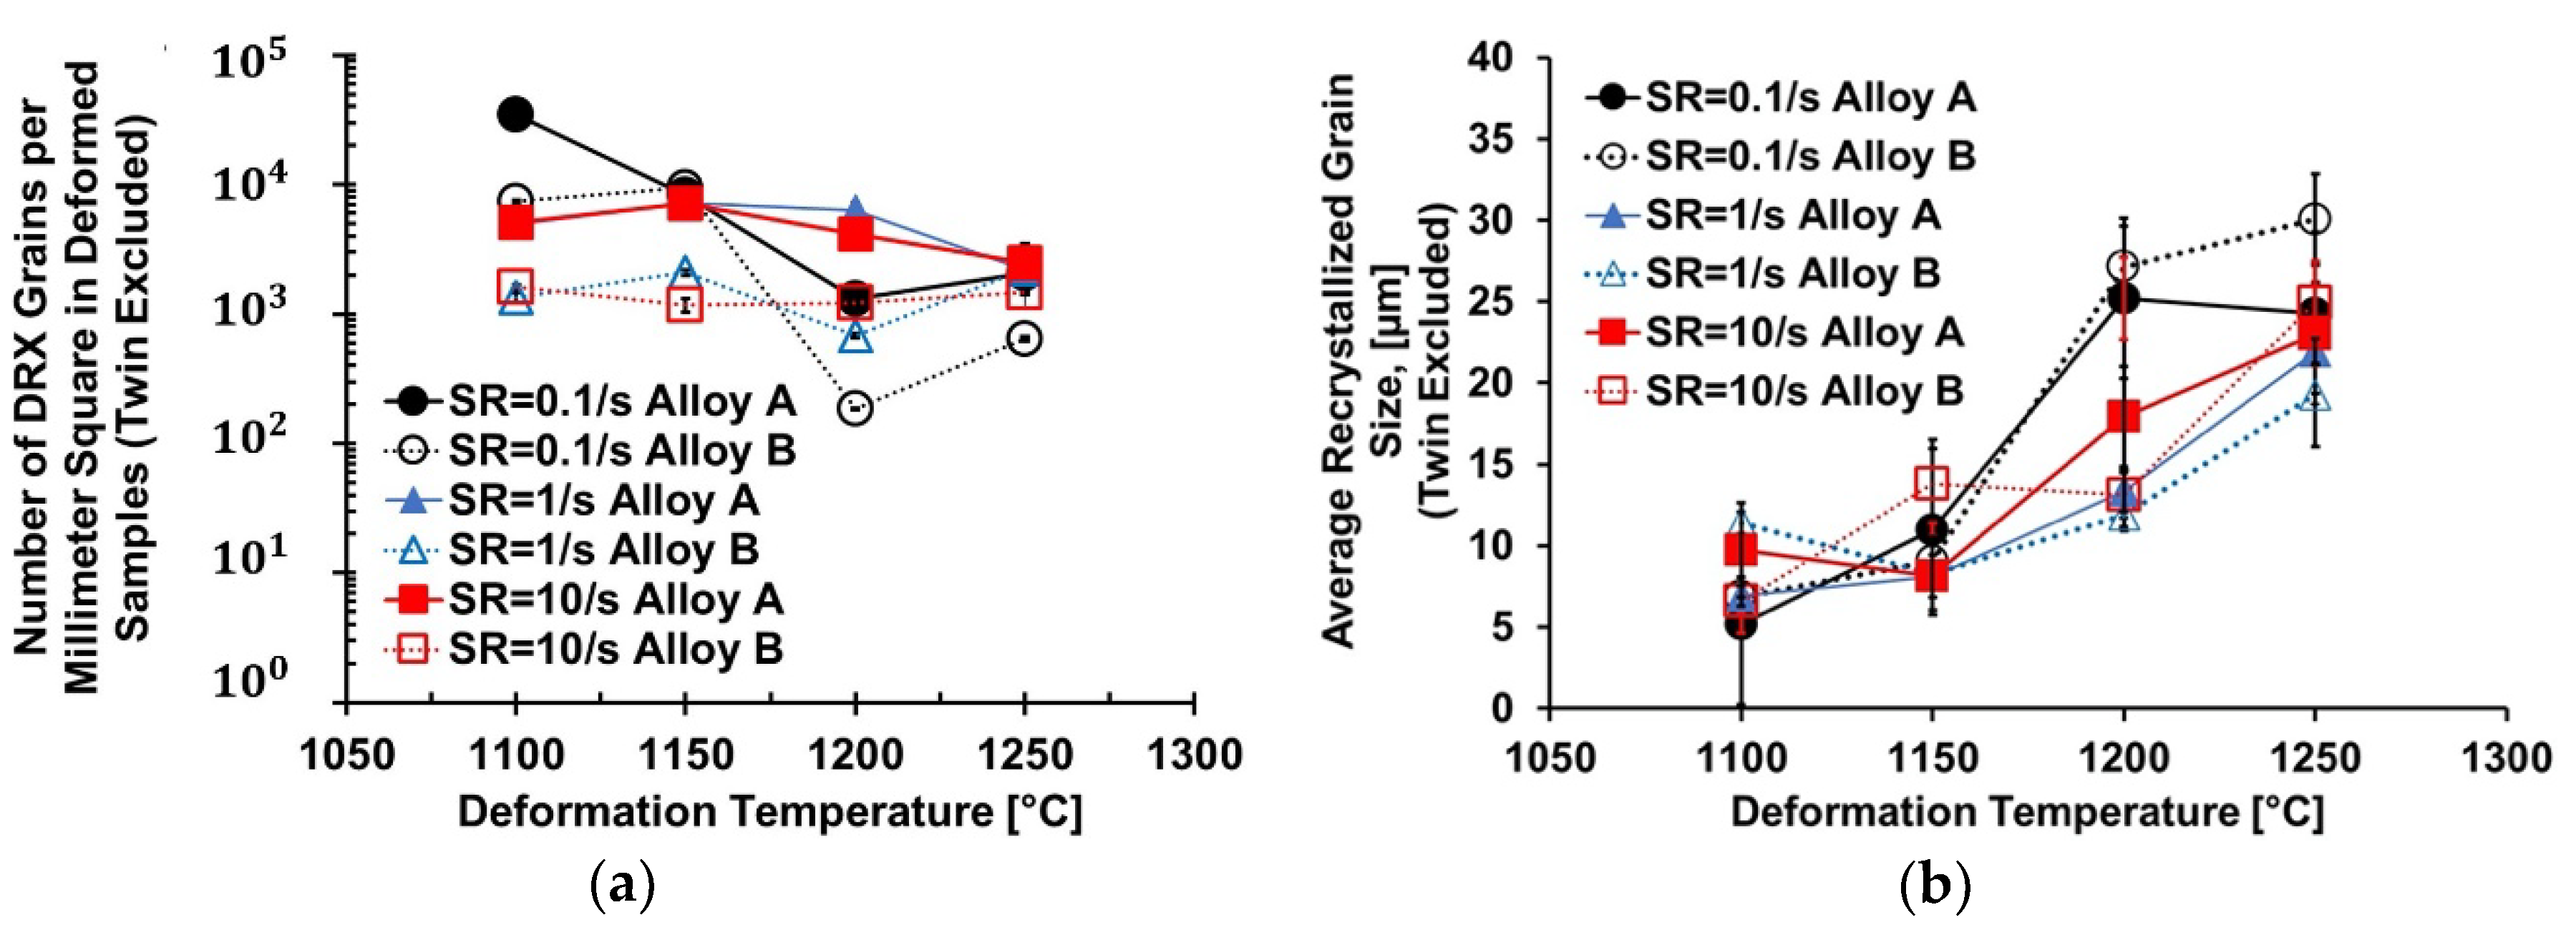
3.3.3. Dynamically Recrystallized Grains

The number fraction of grains that have undergone dynamic recrystallization is between 50 and 90% lower in Alloy B compared to Alloy A for each deformation temperature, according to the grain orientation spread analysis of EBSD data (Figure 10, original grain orientation spread data are available online as Supplementary Files). This finding is consistent with results shown in Figure 6 to Figure 8. Below   1200   , the fraction of dynamically recrystallized grains decreases with increasing strain rates for both compositions, but generally increases following deformation at 1200   and above. However, at deformation temperatures of 1200   and 1250   , the fraction of dynamic recrystallized grains increases with increasing strain rates for both alloys.
The number of recrystallized grains per unit area is almost constant as a function of temperature for a given combination of composition and strain rate (Figure 11a). The exception is for a deformation at 1100   and 0.1   s 1 , after which the frequency of recrystallized grains is significantly higher in Alloy A, compared to Alloy B. Up to a deformation temperature of 1150   , there is no significant change in the average recrystallized grain size as a function of strain rate. However, there is a decrease in the average dynamically recrystallized grain size with an increased strain rate at both 1200 and 1250   (Figure 11b). There is also a weak increase in the average dynamically recrystallized grain size as a function of temperature for both compositions.

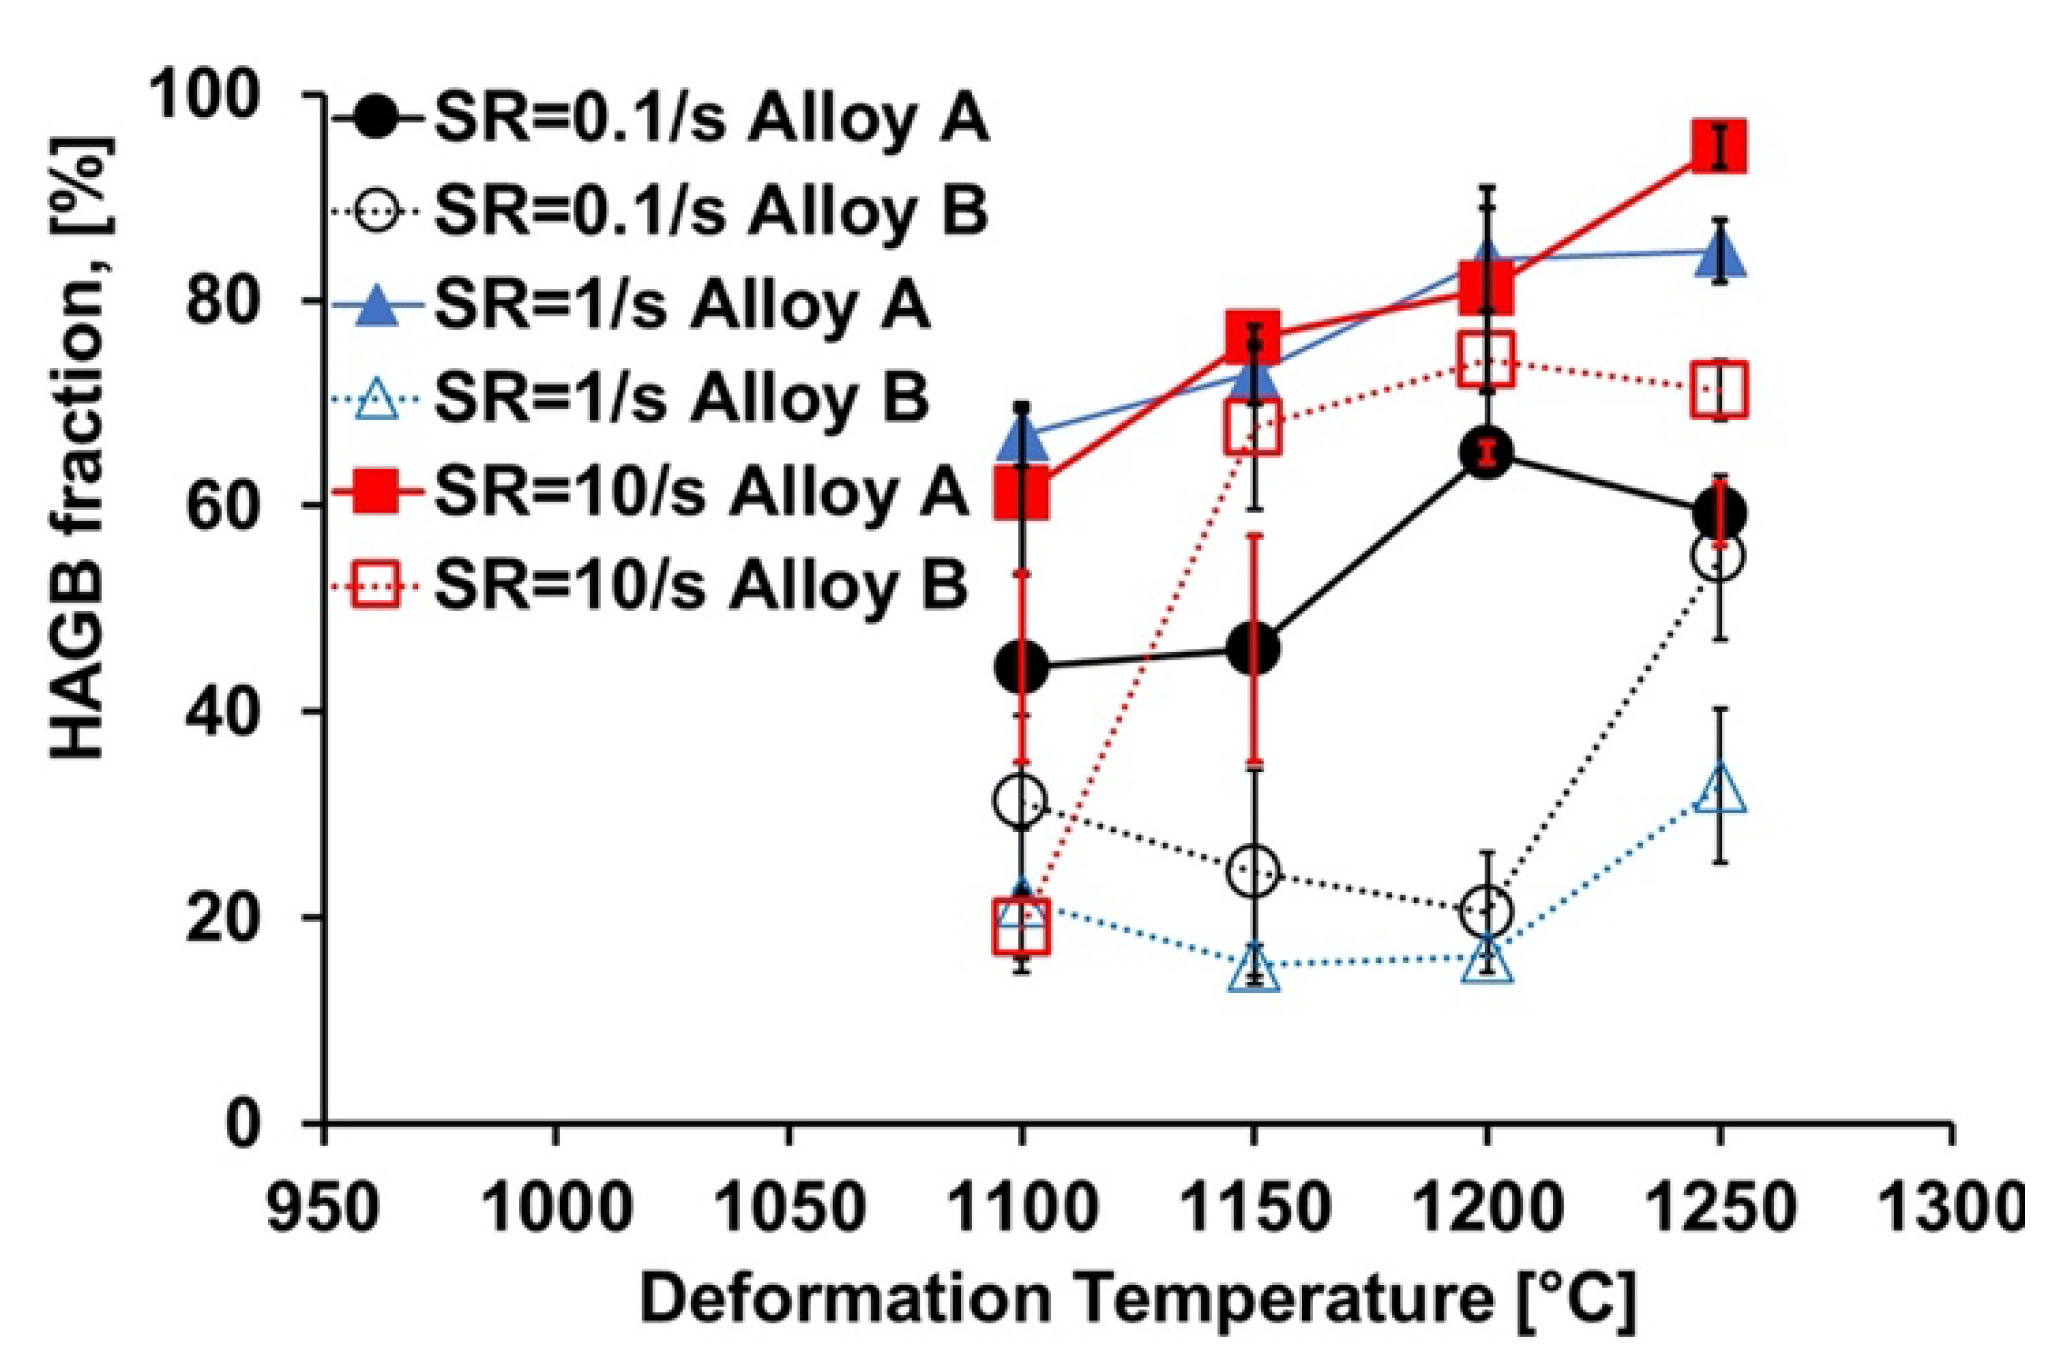
3.3.4. Grain Boundaries

The fraction of high angle grain boundaries in Alloy A is approximately between 25% and 70% higher than that of Alloy B for any given strain rate for any given set of conditions (Figure 12). Such high angle boundaries include twins and grains that are likely to be recrystallized. Conversely, low angle grain boundaries are likely to be deformed but not recrystallized.
At a strain rate of 0.1 and 1.0   s 1 , the fraction of high angle grain boundaries in Alloy B initially decreases with an increased deformation temperature up to 1200   , after which it increases. At a strain rate of 10.0   s 1 , the fraction of high angle grain boundaries in Alloy B increases with the deformation temperature.
The fraction of low angle grain boundaries generally decreases with increasing temperature for any given combination of chemistry and strain rate (Figure 12). The fraction of low angle grain boundaries is higher in sample B than in sample A for all combinations of strain rate and temperature. This is a good agreement with the observations made by optical microscopy and EBSD.

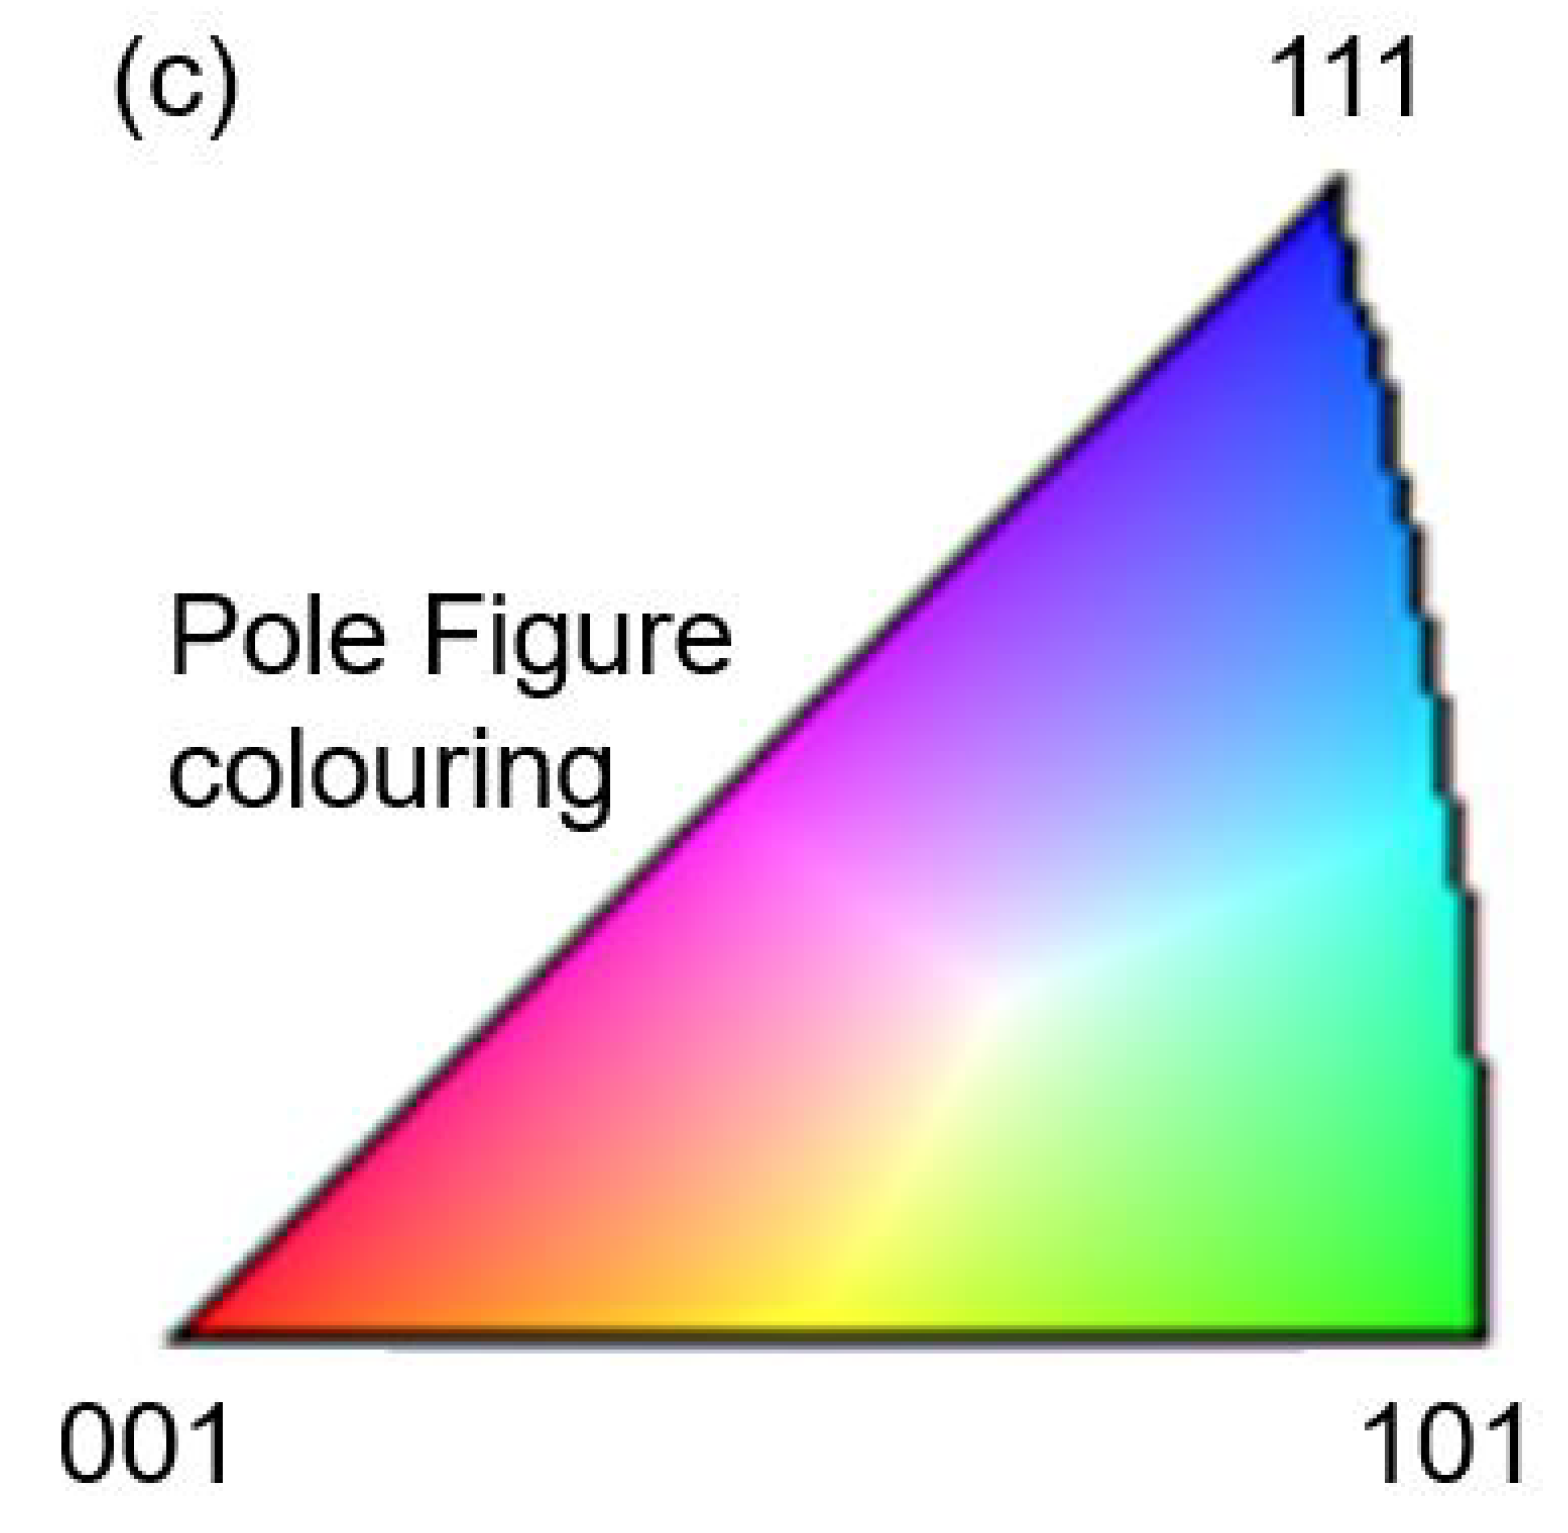
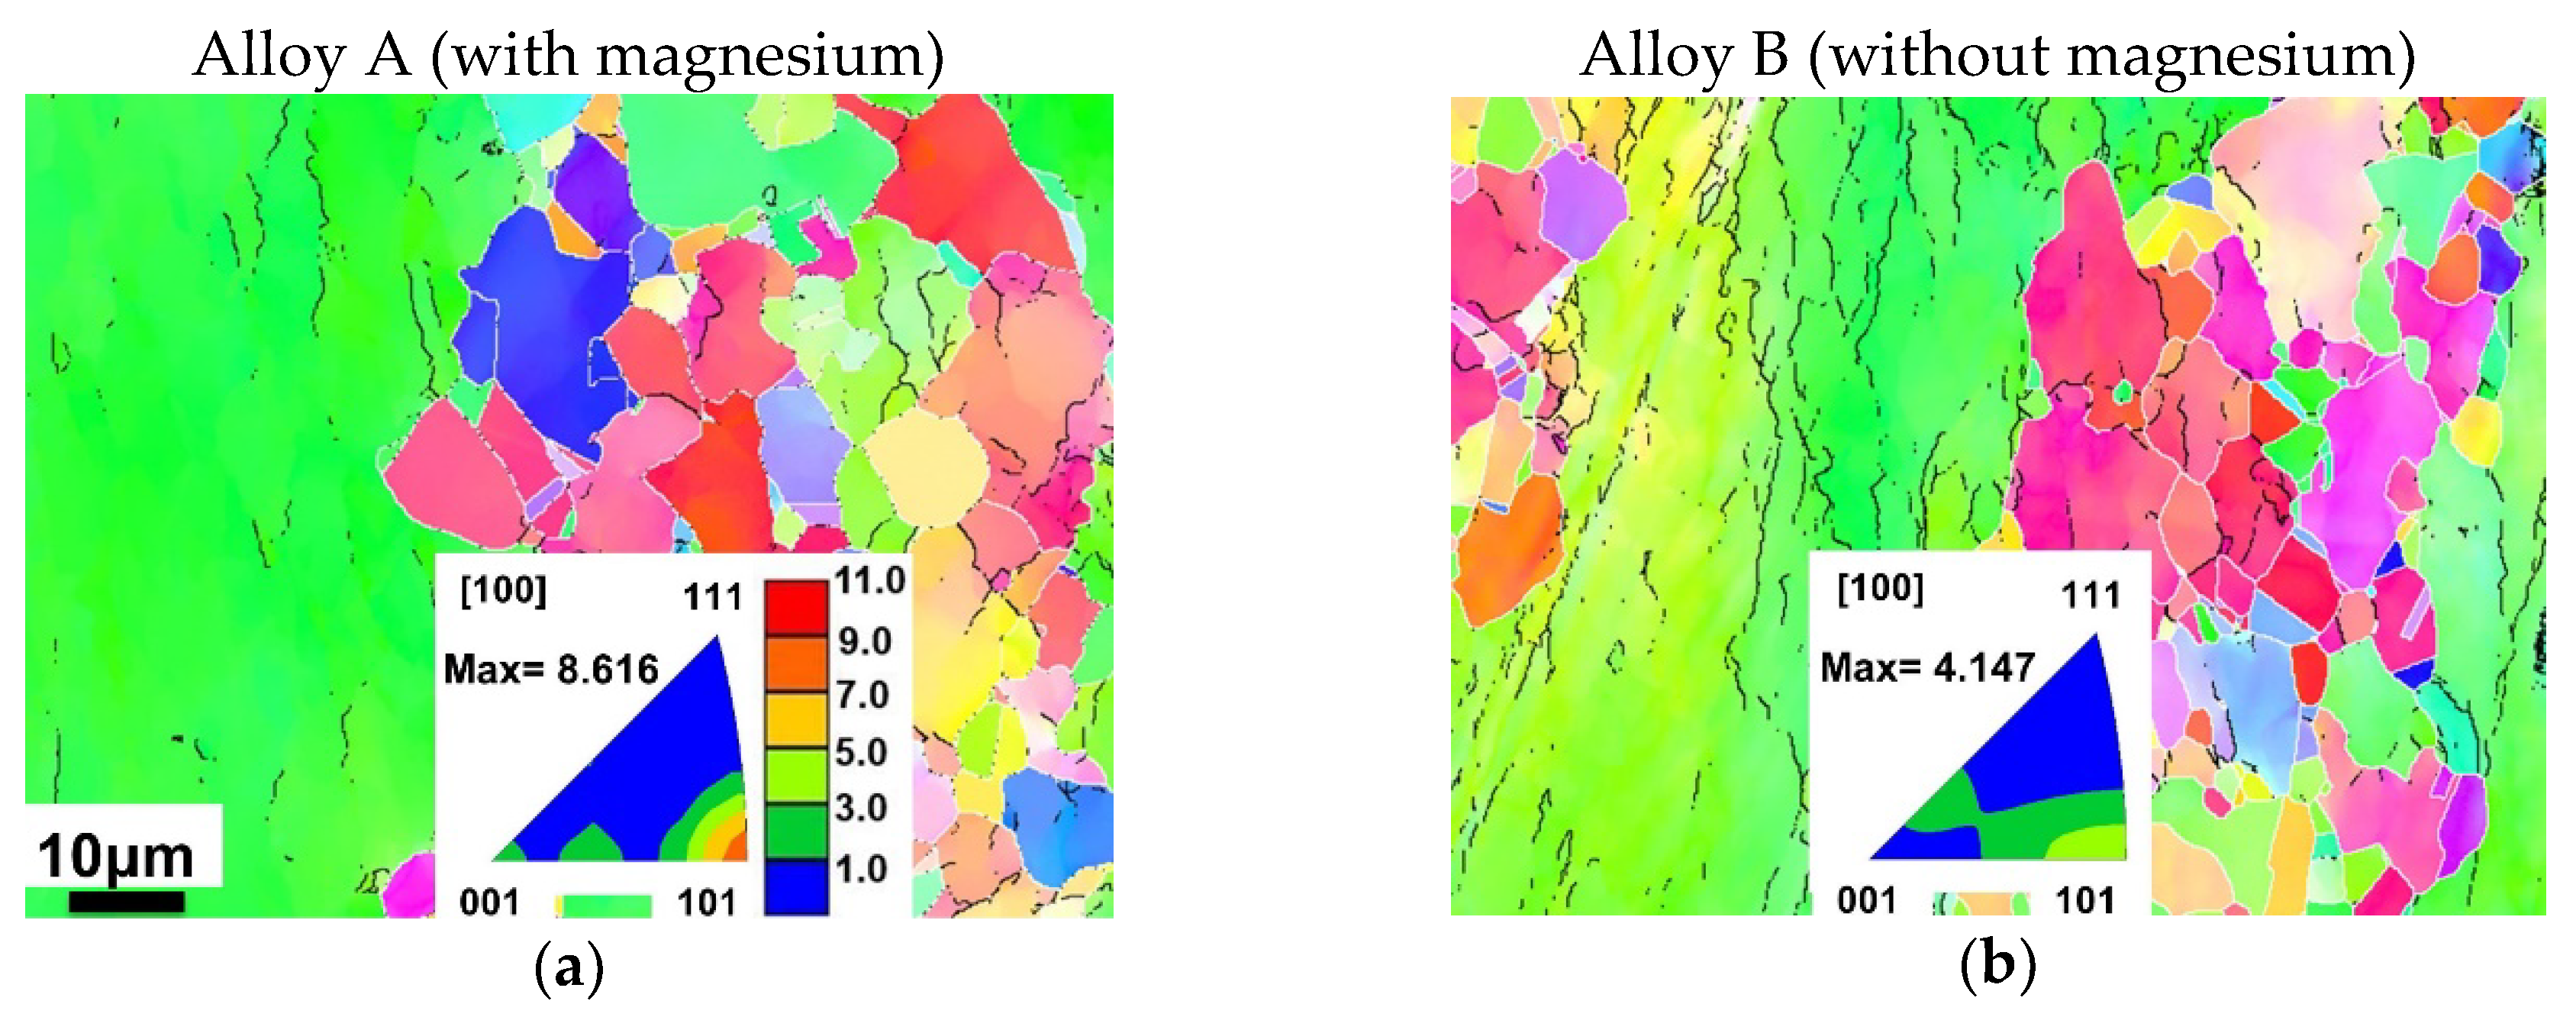
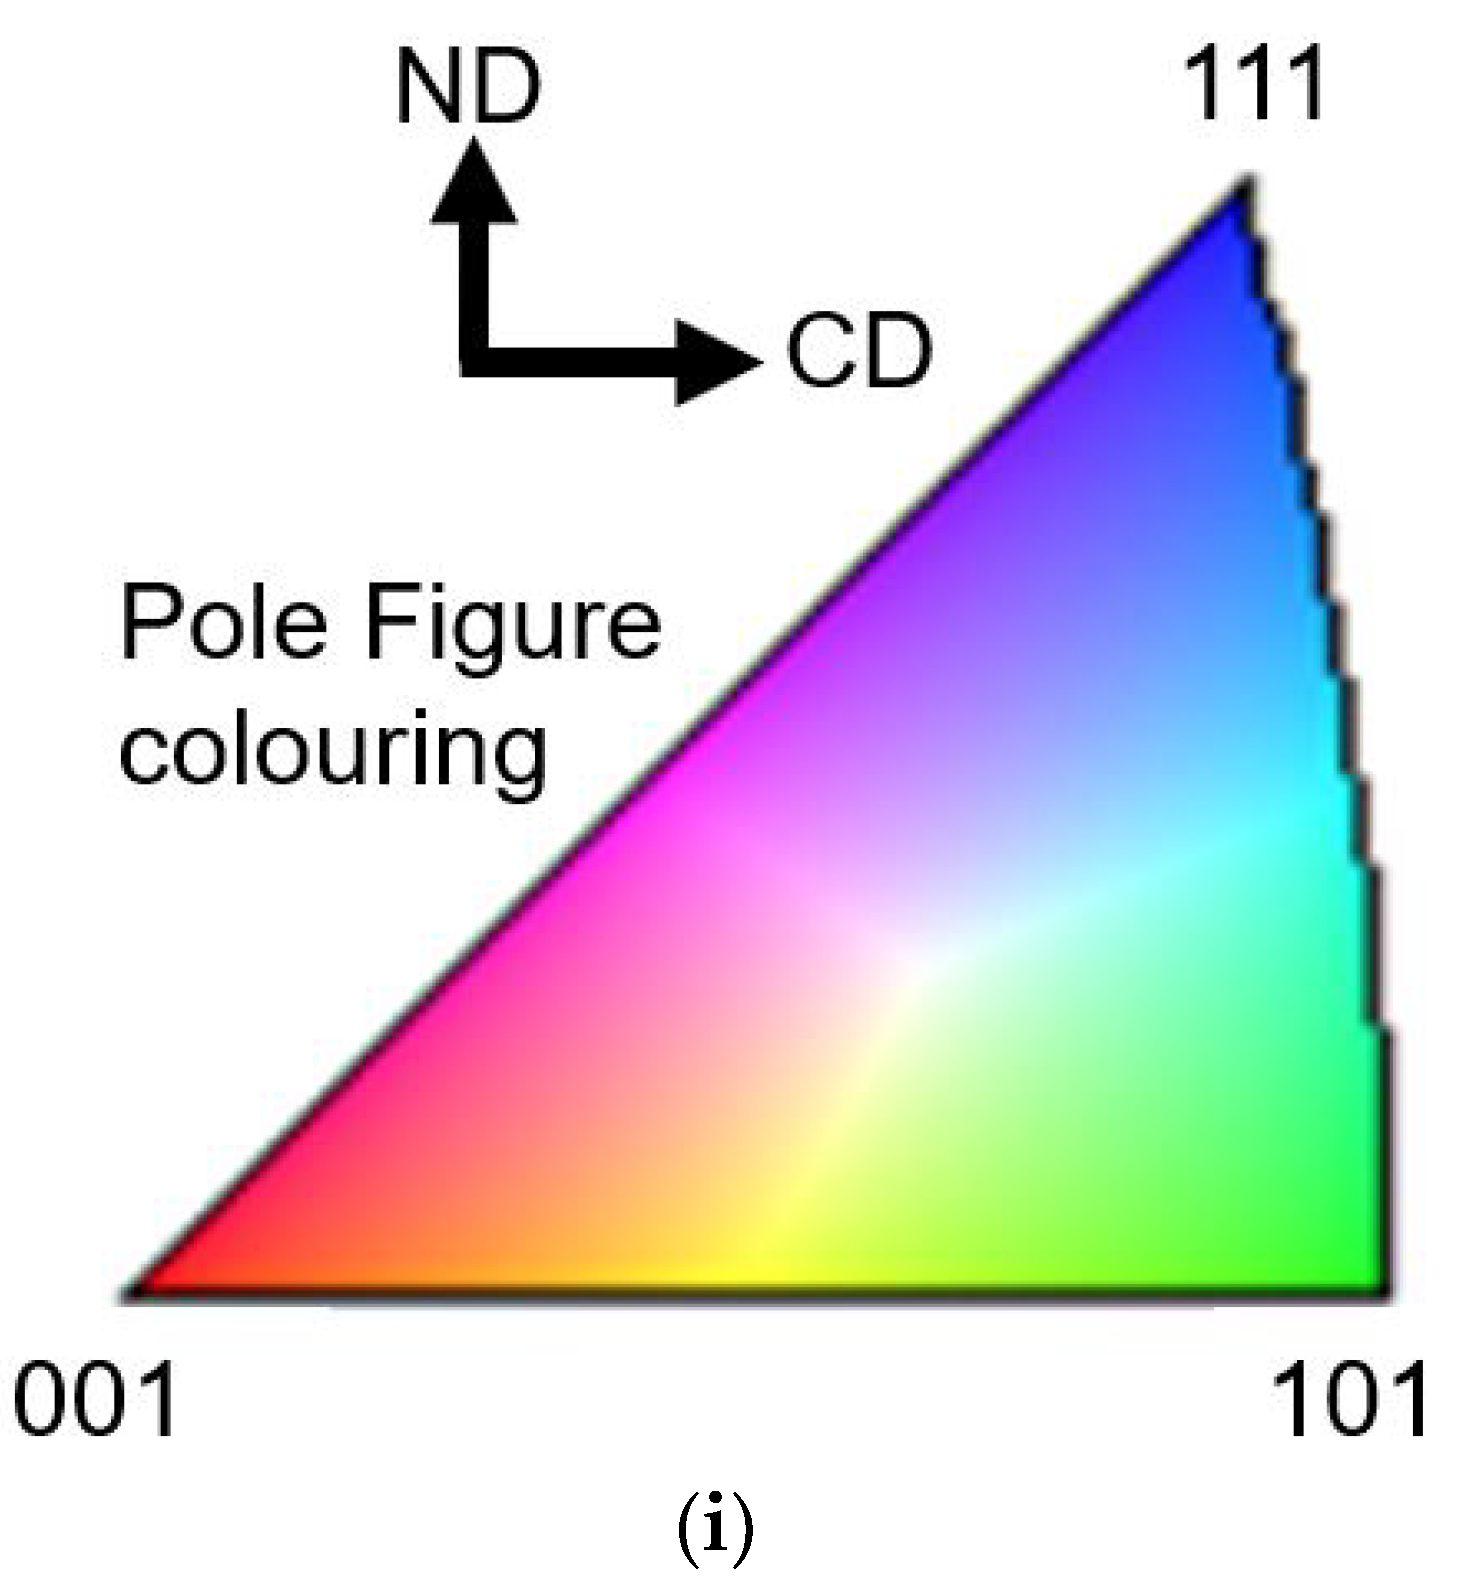
3.3.5. Crystallographic Texture

Inverse pole figure maps of samples deformed at 0.1   s 1 at 1100 and 1250   at all three strain rates demonstrate that the texture for both alloys is a double fiber texture with 110 and 100 parallel to the compression direction (CD) (Figure 13, Figure 14 and Figure 15). Results from all three EBSD scans (one with a step size of 3.0 µm and two with a step size of 1.0 µm) for each sample in Figure 13, Figure 14 and Figure 15. An example of the maximum <110> pole density of the overall microstructure was found to be 8.616 and 10.546 for sample A at 1100 °C with a strain rate of 0.1 s−1 and 1250 °C with a strain rate of 10 s−1, respectively, to a compressive strain of 0.7, while the maximum <110> pole density was 4.147 and 4.198 for sample B for the same deformation conditions.
Following hot-deformation at a strain rate of 1.0   s 1 , Alloy A is found to have a 110 fiber texture at   1100   and predominantly a 100 fiber texture at 1250   . Alloy B was found to have a 110 fiber texture following deformation at all deformation temperatures, except at 1250   (Figure 13).
After hot-deformation at a strain rate of 10.0   s 1 , the texture of the deformed (non-recrystallized) grains in Alloy A is a 110 fiber texture at all deformation temperatures. However, a 100 fiber texture dominates at all deformation temperatures in Alloy B (Figure 14). In addition, a decrease in total low angle grain boundaries with a simultaneous increase in the high angle grain boundaries is apparent in both alloys as the temperature increases.

4. Discussion

4.1. Hot Deformation Stress Behaviour

The flow stresses in Alloys A and B increase with an increase in the strain rate and decrease with an increased deformation temperature (Figure 3). This is conventional behavior for dislocation-mediated deformation, as reported in the work that led to the well known Zener–Hollomon parameter [34,35,36,37]. This behavior is seen in austenitic stainless steels and other nickel-base alloys [38,39]. The fact that alloy A had higher flow stresses at temperatures of 1200   and above can be attributed to the presence of fine precipitates and/or a solute drag effect caused by magnesium atoms in alloy A. This is due to the fact that magnesium atoms are significantly smaller than the other metal atoms in the alloys and so impart a large lattice strain. There is no apparent explanation as to why alloy B exhibited a higher peak stress than alloy A at below 1200   . Both the solid solution strengthening and the presence of magnesium-based precipitates effects will impede dislocation glides and the movement of grain boundaries in alloy A, compared to alloy B [40]. If a grain boundary motion is hindered, grain growth will be reduced, and the average grain size will be lower, as is observed. This will lead to an increased strengthening due to grain refinement. Due to the size of grains in the current study, grain refinement strengthening will occur by a dislocation pile-up at grain boundaries—the Hall–Petch effect. Most of the stress–strain curves show a single peak stress followed by a gradual fall towards a steady state stress (Figure 3). This is consistent with a material undergoing dynamic recrystallization [41]. However, the stress increases continuously during the compression tests at 10   s 1 , Figure 3c,d. This suggests that, at that strain rate, the material undergoes a continuous dynamic recrystallization and this mechanism is not sufficient to balance work hardening at any point during the deformation [42]. It is well known that peak stress and strain decrease with increasing deformation temperatures and increase with increasing strain rates, as may be seen in the form of the Zener–Hollomon parameter (Equation (1)).

4.2. Microstructure Analysis

4.2.1. Microstructure before Deformation

It appears that the grains in the Alloy A in the as-annealed sample have stronger orientations (Figure 5a, a double fiber texture with 110 and 111 ) compared to Alloy B (Figure 5b, a fiber texture with 100 ) [41]. Alloy A also exhibits a fiber compression texture 110 , which is consistent with other materials that have face-centered cubic crystal structures [43]. This is also consistent with stress–strain curves for the deformation tests (Figure 3). In general, the flow stress curves for Alloy A was slightly above that of the Alloy B over all deformation temperatures, similar to other compression studies published in literature [40].

4.2.2. Effect of Deformation Conditions on Microstructure

A large number of coarse grains and a necklace structure was observed in the compressed samples of both alloys A and B, deformed at a strain rate of 0.1   s 1 at both 1100 and 1150   , Figure 6a,b. This has been attributed to a discontinuous dynamic recrystallization, in which recrystallized grains nucleate on prior grain boundaries when the local dislocation density exceeds that required to drive recrystallization [40,42,44]. The same combination of structures has been found in Incoloy 945, in which recrystallization was determined to be caused by the bulging and subgrain rotation mechanisms [43]. Optical micrographs after deformation at a strain rate of 0.1   s 1 at a deformation temperature of either 1200 or 1250   show that equiaxed grains dominated the microstructure. This has been identified to be the result of a continuous dynamic recrystallization, where recrystallized grains can also nucleate in the body of prior grains [40].
Finely dispersed second-phase particles TiN were found at the grain boundaries at a high temperature of 1200   (Figure 6, Figure 7 and Figure 8). This tends to retard the growth of recrystallized grains [41]. This is in a good agreement with previous observations in which it was shown that TiN which precipitates in a Fe–20 wt% Cr Alloy are effective at pinning grain growth [45]. Non-recrystallized grains and elongated deformed grains in Alloy A were observed in at temperatures from 1100   to 1200   (Figure 8a,b,e). This is because deformation at the highest strain rate leads to a high stored energy, which in turn causes more dislocations to form. The limited deformation time under the highest strain rate (deformation time occurs in ~0.07 s) restricts the onset of dynamic recrystallization [41,46]. Dynamically recrystallized grains were observed in all microstructures below 1200   and were larger following the deformation temperature of 1200   in the case of alloy A. It is concluded that the size of dynamically recrystallized grains is sensitive to deformation temperatures and strain rates (or, equivalently, to the Zener–Hollomon parameter, Z ) in both alloys. No dynamic recrystallization was observed in Alloy B following a compression at 10   s 1 . It is expected that there is an insufficient dislocation density to provide a large enough driving force for a dynamic recrystallization to occur. This is consistent with findings from other nickel-base alloys [43].

4.2.3. Dynamically Recrystallized Grains

The fraction of grains that have undergone dynamic recrystallization is lower in Alloy B for each deformation temperature (Figure 10). This finding is consistent with the results shown in Figure 6, Figure 7 and Figure 8. Below 1200   , the fraction of dynamically recrystallized grains decreases with the increasing strain rates for both compositions but increases after a deformation at temperatures equal to and higher than 1200   . This is because the deformation at a high strain rate provides more stored energy and dislocations than a low strain rate [41,46]. However, at a deformation temperature of 1200 and 1250   , the fraction of dynamic recrystallized grains increases with increasing strain rates for both structures. This is attributed to the formation of subgrains with associated (occasional) nucleations of grain boundary bulging, which results in a large fraction of grains being recrystallized through subgrain rotation.

4.2.4. Fraction of High Angle Grain Boundaries

It was clear from the results that a discontinuous recrystallization was responsible for the formation of the microstructure in alloy A following a deformation at a strain rate of 0.1   s 1 (Figure 13). This is attributed to the nucleation of grain boundary bulging and a necklace structure on pre-existing grain boundaries [41]. Conversely, a continuous recrystallization occurred in alloy B at a strain rate of 1 s−1, as shown in Figure 14d,f. This is due to that the recrystallized grains nucleated inside a non-recrystallized grain. At a strain rate of 10.0   s 1 , the fraction of high angle grain boundaries in Alloy A increases with an increase in deformation temperature (Figure 12). This is because the deformed structure is consumed by the recrystallizing grains, which form with high angle grain boundaries and undergo little deformation once they have nucleated [41].

4.2.5. Texture Development

The differences in texture following a deformation between the two chemistries might be attributed to the differences in alloy composition. Samples alloyed with magnesium showed a much stronger orientation of 101 crystallographic directions parallel to the axis of compression (also the longitudinal axis during casting) after deformation under all conditions tested. A similar strong texture has been observed in other studies into the hot-deformation of nickel alloys [43]. Furthermore, the as-cast samples alloyed with magnesium show stronger orientations compared to those that are not alloyed with magnesium. It is suspected that the texture is preserved, and possibly enhanced, due to the effect of magnesium on the stacking fault energy of the alloy. It is well known that alloying additions can have a significant effect on stacking fault energies in face-centered cubic metals, including nickel-base alloys [47,48]. A change in stacking fault energy could lead to a change in active slip system away from the standard { 111 } 1 1 ¯ 0 for face-centred cubic metals and such interplay between stacking faults and slip systems has been reported in literature [49]. Alloy B (no magnesium) exhibits the expected texture after compression, with the <100> directions parallel to the axis of compression—dislocations moving parallel to 1 1 ¯ 0 in the direction of maximum shear, which will occur at 45° to the axis of compression, and lead to the preferential alignment of 100 directions with the axis of compression. Alloy A (with magnesium) has mostly 110 directions parallel to the axis of compression in the non-recrystallized microstructure, which suggests that the slip may have occurred in a different slip direction. While this explanation is consistent with existing literature and the current findings, it is speculative and requires further study.
A change in stacking fault energy could also explain the change in recrystallization behavior due the addition of magnesium, and this has been demonstrated in other studies [50]. However, this is also speculative and further study is required to investigate the origin of this effect.
In Alloy A, there was a high prevalence of high angle grain boundaries that showed a misorientation angle of 60°, which is indicative of twin boundaries. This suggests that the stacking fault energy of Alloy A is lower than that of Alloy B. In turn, this suggest that sub-grain rotation, and hence recrystallization, is easier in Alloy A.
The increase in the total fraction of grain boundaries that are low-angle grain boundaries in Alloy B at deformation temperatures at temperatures from 1100 to 1200   , (Figure 12), except at a strain rate of 10   s 1 is due to an efficient dynamic recovery. The recrystallization occurs by a subgrain rotation, which is supported by the current results [42].
Conversely, the differing textures of the as-cast material (Figure 5) could lead to changes in slip and recrystallization behavior during subsequent deformation, by affecting the Schmidt factors for candidate slip systems in the two cases. Further study is needed to identify the effect responsible for the change in the behavior of the two compositions.

4.3. Modelling of Flow Stress and Microstructural Behavior

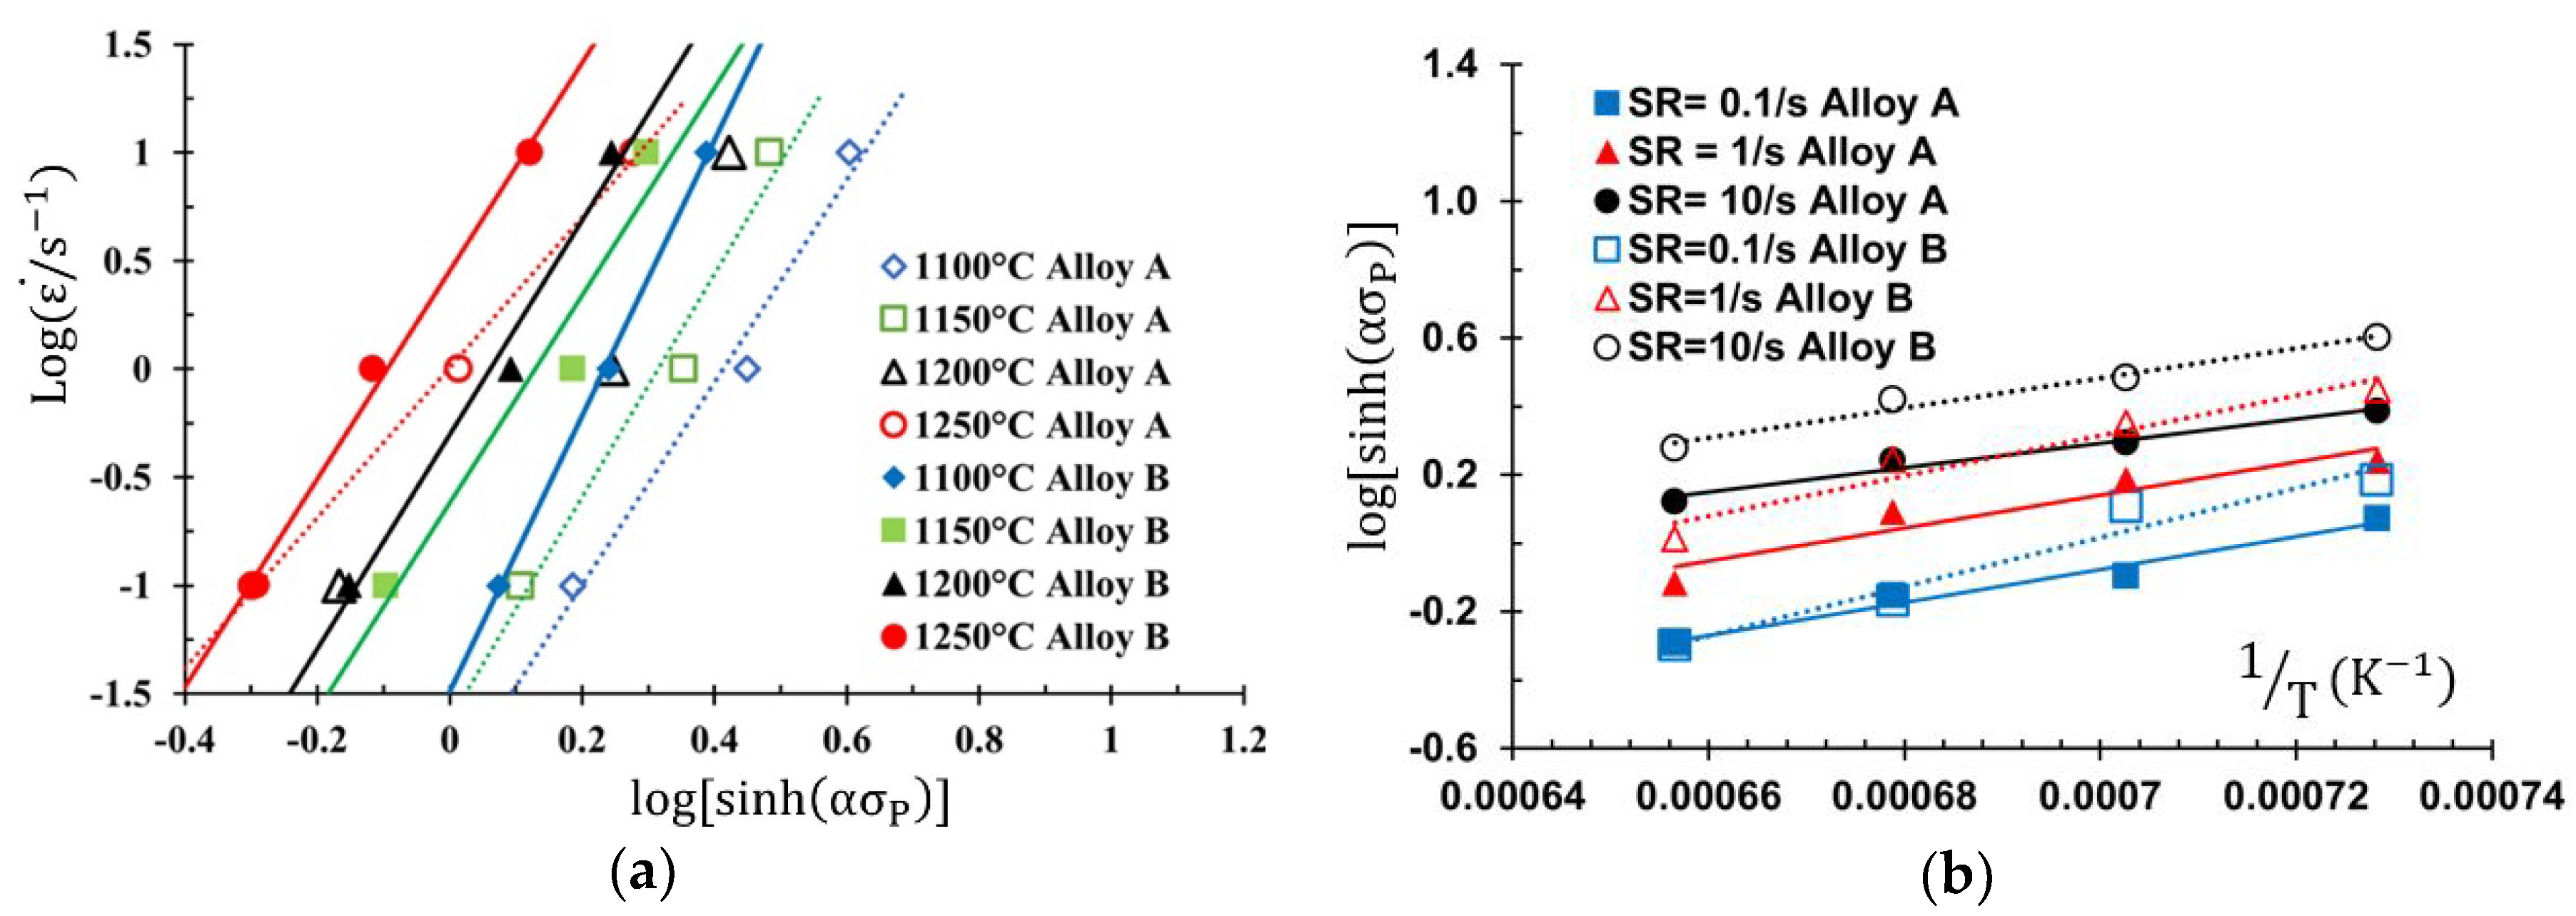
4.3.1. Determination of Material Constants

An evaluation of the Zener–Hollomon parameter and a derivation of the deformation activation energy can provide valuable insight into the material behavior. In the current study, the deformation conditions lead to Zener–Hollomon parameters that cover a wide range ( 13.5 log 10 Z 18.5 ). In addition, both the peak stress and peak strain show a linear dependence on the Zener–Hollomon parameter (Figure 16) and can be expressed as p Z q with and q as the regression fitting parameters (Table 3).
For a given value of the Zener–Hollomon parameter, both the peak strain and peak stress of Alloy A are lower than those of Alloy B. This implies that the onset of a dynamic recrystallization in Alloy A is initiated before that of Alloy B, as some source of strain softening is required to reduce the work hardening rate to zero and meet the definition of peak stress. The only significant source of strain softening in this case is a dynamic recrystallization. Moreover, the differences in the peak strains and stresses between the alloys are higher at the higher values of the Zener–Hollomon parameter (Figure 16). The peak strain value is used to deduce the extent of a dynamic recrystallization [17,22,24,51]. It is clear that both the peak stresses and peak strains increase with an increase in the value of the Zener–Hollomon parameter (Figure 16), meaning that the high deformation temperature and low strain rate lead to a greater extent of dynamic recrystallization in otherwise identical conditions. This finding is consistent with the microstructural results (Section 3.3). Thus, the small magnesium addition is found to be more advantageous on the dynamic recrystallization when the hot compression is carried out under high deformation conditions.
The relation between the true stress, strain rate and deformation temperature have been shown to be described by Arrhenius-type laws (Equations (6)–(8), where A , n , n , α and β are dimensionless material constants, Q p , Q E and Q H are the activation energy for deformation assuming a power, an exponential and hyperbolic-sine equation, ε ˙ is the deformation strain rate.   σ   is the peak true stress and R and T have their usual meanings) [52]:
Z P = ε . exp ( Q p R T ) = A   σ n
Z E = ε . exp ( Q E R T ) = A exp ( β σ )
Z S = ε . exp ( Q H R T ) = A [ sin h ( α σ ) ] n
At a constant deformation temperature, the partial differential functions of Equations (9) and (10) with respect to σ P yield the following equations for estimating n and β :
log 10 ε ˙ log 10 σ P | T = n
log 10 ε ˙ σ P | T = β
Linear regression analysis of log 10 ε ˙ versus log 10 σ P and log 10 ε ˙ versus σ P is carried out to determine n and   β , respectively, and the respective plots are shown in Figure 17a,b. The values for n and   β for Alloy A and Alloy B are calculated for each deformation temperature. Each value is averaged and the mean values of n and β for Alloy A are 7.0 and 0.051, respectively. The corresponding values for Alloy B are 6.2 and 0.047. The average value of the material constant, α , can be calculated from the product of a division of the average value of β by the average value of n and may be derived from Figure 17. The value of α is equal to 7.3 × 10 3 for alloy A and 9.3 × 10 3 for alloy B.
From the slope of the linear relationship between log 10 ε ˙ and log 10 ( sinh [ α σ ] ) (Figure 18a), the value of the parameter n for alloy A can be estimated to be 5.2 and that of alloy B can be estimated to be 4.1. The average values of Q H   can then be obtained from the values estimated from Figure 17, Figure 18 and Figure 19 and Equation (8). The average value of Q H   for alloy A and alloy B are equal to 430 and 450   kJ   mol 1 , respectively. This matches very well with some other superalloys obtained through different methodologies (from 416 to 486   kJ   mol 1 , Table 4) [38,39,53,54,55,56,57,58].

4.3.2. Strain Rate/Flow Stress Model

The activation energy value for the deformation of alloy B was found to be higher than that of Alloy A. In addition, previous studies using the same methods reported activation energies of 438   kJ   mol 1 [53] and 416   kJ   mol 1 [54], which are in good agreement with the values from the current study. For alloy 825 (as used in the current study), the constitutive equations may also be expressed as Equations (11) and (12), where the subscript A and B refer to the alloys in the current study, all other symbols have the meanings previously defined and the peak stress is given in megapascal [52]:
ε ˙ A = 1.8 × 10 21   [ sinh ( 0.0073 σ p ) ] 5.2 exp ( 430000 R T )
ε ˙ B = 6.4 × 10 16   [ sinh ( 0.0093 σ p ) ] 4.1 exp ( 450000 R T )
By using the relation between the average grain size formed after dynamical recrystallization and the Zener–Hollomon parameter ( Z ) in all the specimens (Figure 19), it is possible to derive the activation energy for deformation, Q def . The Zener–Hollomon parameter for Alloy A was calculated by using an activation energy value of Q def = 430   kJ   mol 1 and that for alloy B was Q def = 450   kJ   mol 1 .

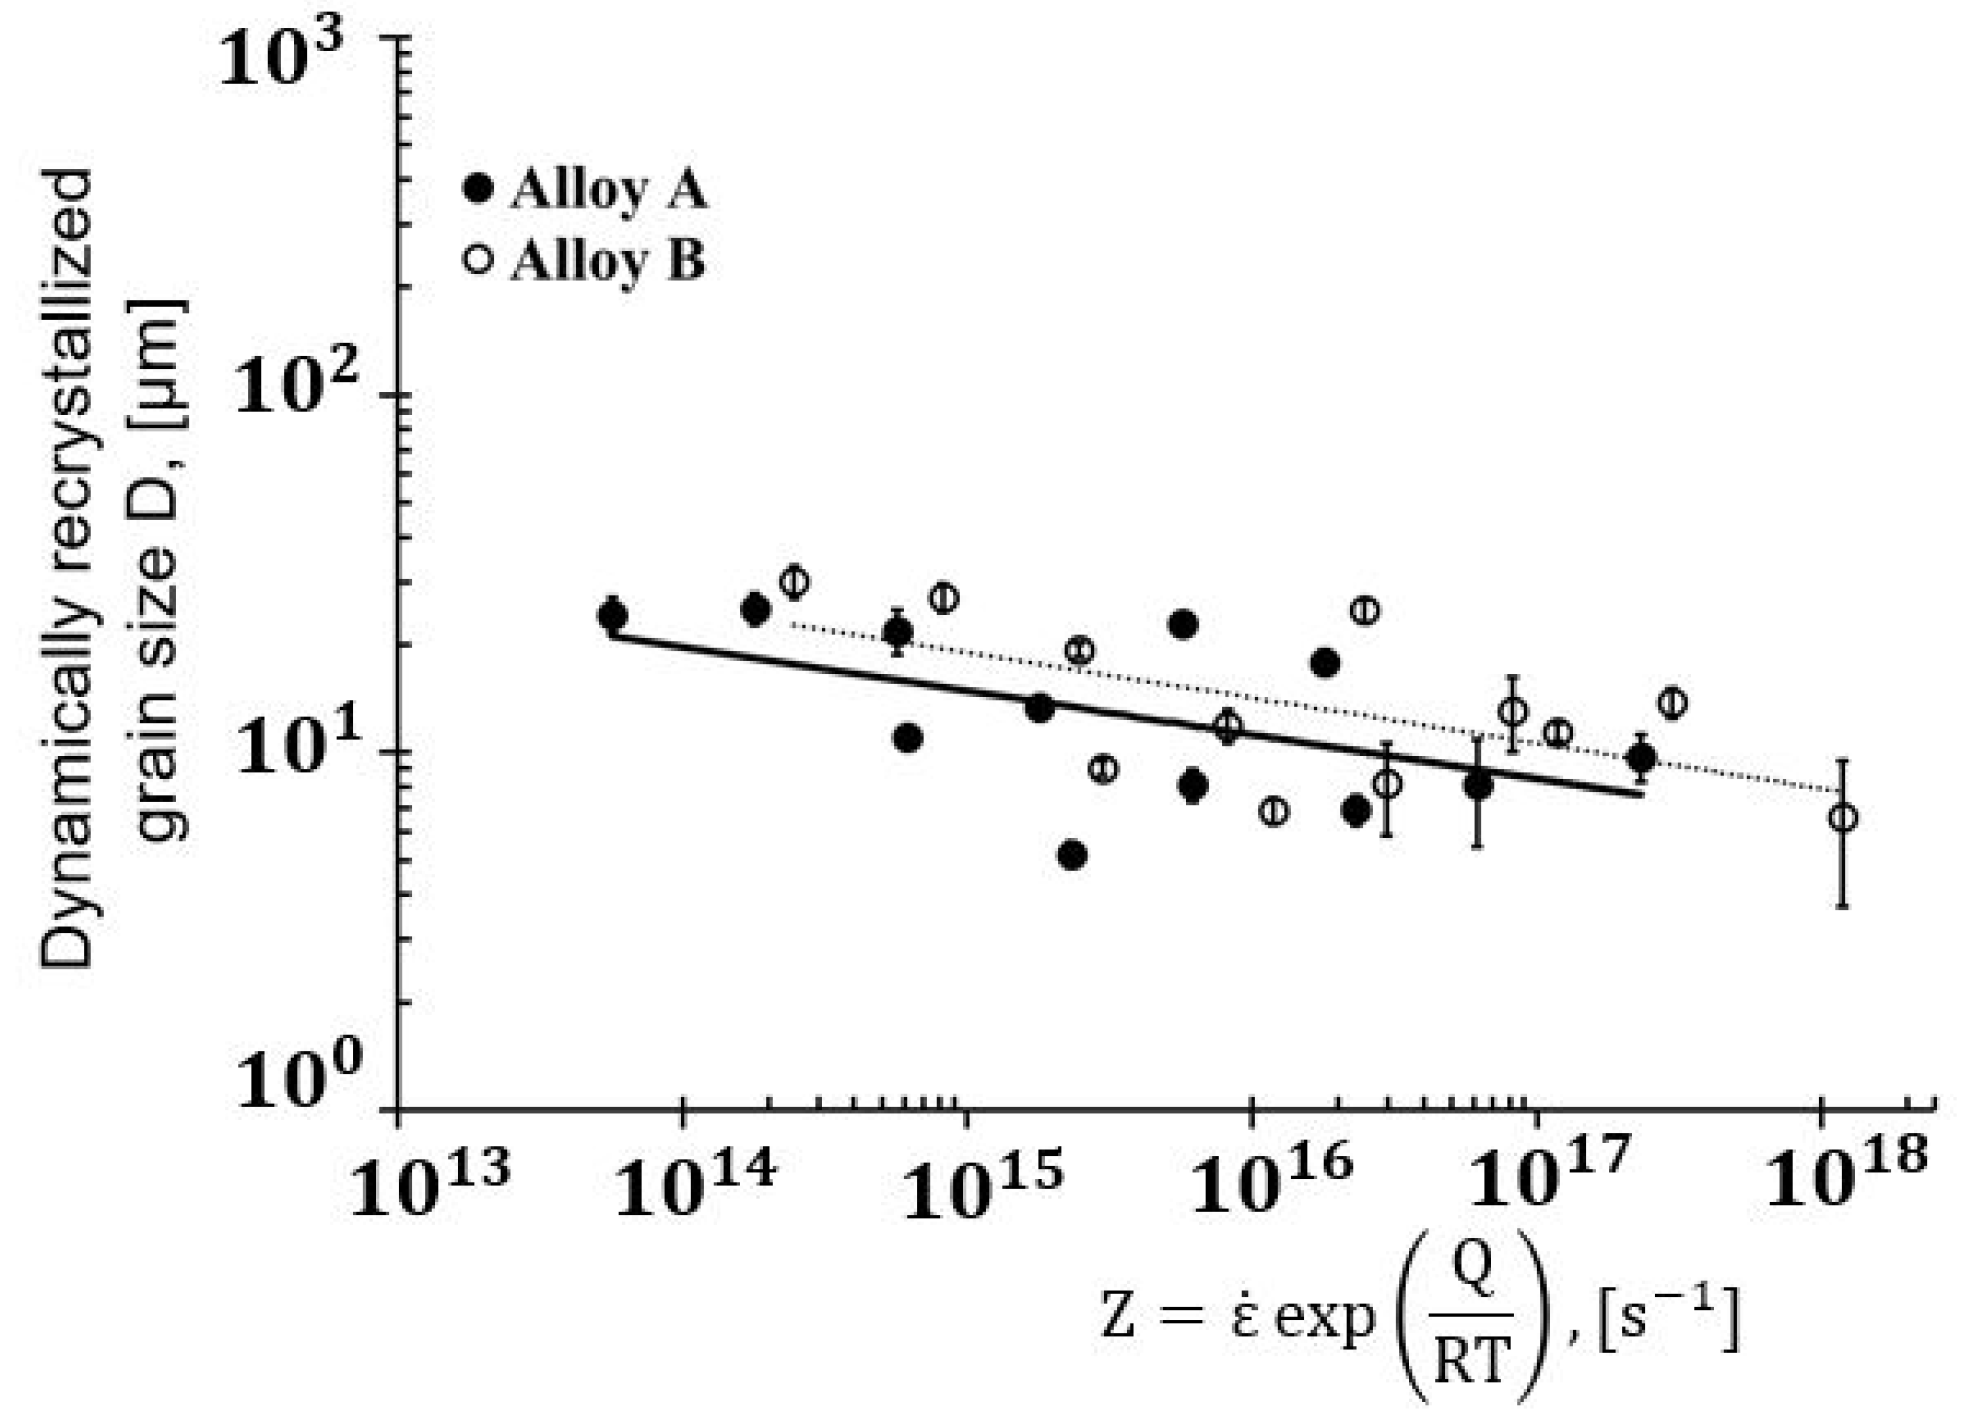
4.3.3. Dynamically Recrystallized Grain Size Model

It was found that the dynamically recrystallized grain size of both alloy A and alloy B is sensitive to the Zener–Hollomon parameter, Z , but not to the initial grain size, D 0 , as stated in the literature [39,58,59,60]. The dynamically recrystallized grain size decreases as the Z value increases (Figure 13a and Figure 14a). The grain size of alloy A is somewhat lower (25 µm) than that of alloy B (27 µm) (Figure 13e). For a given alloy, a power law is proposed to link the dynamically recrystallized grain size to the Zener–Hollomon parameter (Equation (13), where φ has units of length and ω is a dimensionless constant; both constants may be derived from experimental data):
D D = φ Z ω
For alloy A, ω = 0.123 ± 0.059 and φ = 1050 ± 8.5   μ m . For alloy B, ω = 0.127 ± 0.054 and φ = 1530 ± 7.5   μ m . A small power law exponent ( ~ 0.1 ) and low homologous deformation temperatures ( ~ 0.5 ) implies that a continuous dynamic recrystallization occurs [61]. The exponent value ( 0.12 ω 0.13 ) is of the order of those previously reported data in the open literature: 0.19 [59], 0.13 [60], 0.17 [62], 0.25 [63] and 0.2 [64]. Thus, there is a reasonable agreement between the present data and the reported values which included a variety of initial grain sizes and deformation types. Possible explanations for the slight variations of the current study from the literature include the use of different deformation conditions and the small number of data in the current study.
By applying an Arrhenius law and neglecting the uncertainties in the regression analysis for simplicity, the dynamically recrystallized austenite grain size can be estimated as follows [52]:
D D , A = 1050 × Z 0.123 = 1050 ε ˙ 0.123   exp ( 6370 T )
D D , B = 1530 × Z 0.127 = 1530 ε ˙ 0.127   exp ( 6860 T )
These equations can be used to predict and, ultimately, optimize the thermomechanical process to control the dynamically recrystallized grain size of as-deformed alloy 825 after a hot deformation with or without the addition of magnesium. In the case of lower deformation temperatures and higher strain rates (i.e., higher values of the Zener–Hollomon parameter, Z ), the greater accumulation of dislocations results in a more significant strain hardening of the new recrystallized grains. This leads to an increased influence of the nucleation rate and a decreased driving force, which as a consequence, promotes smaller dynamically recrystallized grain sizes. Conversely, under higher temperatures and lower strain rates (lower values of the Zener–Hollomon parameter), the lower rate of dislocation generation results in a reduction in the strain hardening effect and leads to faster grain growth. Nevertheless, in the deformation conditions studies, in the current work, the mechanism of the hot deformation process in both alloys is substantially the same.

5. Conclusions

The hot deformation behavior of cast alloy 825 with and without the addition of magnesium was investigated. The compression temperature was between 1100 and 1250   . The strain rate used in the compression tests was 0.1 ε ˙   /   s 1 10.0 . Based on the results from the current study, the following conclusions may be drawn:
  • The fraction of the high angle grain boundaries and dynamic recrystallized grains is between 43 and 70% higher in alloy 825, which contains a small amount of magnesium alloy 825 for all the temperatures and the strain rates tested in the current study.
  • Deformed grains in the alloy containing magnesium showed a strong preference for a 101 -type directions oriented parallel to the compression axis under all test conditions. However, this texture direction does not dominate in the alloy that was free of magnesium at the intermediate and highest strain rates ( ε ˙ 1.0   s 1 ).
  • Except at a deformation temperature of 1200   , the peak stresses in the alloy that was free of magnesium were between 10 and 15% lower than that in the alloy that contained magnesium for any test condition. Furthermore, the differences in the peak strain between different temperatures are between 25 and 150% smaller when the alloy contains magnesium.
  • The average activation energy for the hot-deformation of alloy 825 that contains magnesium is 430   kJ   mol 1 . Without magnesium, the activation energy is 449   kJ   mol 1 .
  • The relationship between the peak stress, σ P , and the effect of temperature-compensated strain rate (represented by the Zener–Hollomon parameter, Z ) can be expressed by a power law functions, p Z q , with exponents, q , of 0.145 ± 0.011 (Alloy A) and 0.174 ± 0.018 (Alloy B). The decadic logarithm of the coefficient p is 0.21 ± 0.17 with the addition of magnesium and 0.5 ± 0.3 without the presence of magnesium.
  • A power law exists between the dynamically recrystallized grain size, D D , and the Zener–Hollomon parameter, Z . For a given value of the Zener–Hollomon parameter, the dynamically recrystallized grain size was lower when magnesium was present. The dynamically recrystallized grain size of both alloys is given by the following expressions:
    log 10 D D = 3.03 ± 0.93 ( 0.123 ± 0.059 ) Z D   with   the   addition   of   magnesium
    log 10 D D = 3.18 ± 0.88 ( 0.127 ± 0.054 ) Z D   withOUT   the   addition   of   magnesium

Supplementary Materials

The Supplementary Materials are available online at https://www.mdpi.com/2075-4701/11/1/36/s1.

Author Contributions

Conceptualization, M.A.-S., W.M., F.S. and P.G.J.; methodology, M.A.-S., W.M., C.N.H.-S.; validation, M.A.-S.; formal analysis, M.A.-S., C.N.H.-S.; investigation, M.A.-S.; resources, P.G.J. and F.S.; writing—original draft preparation, M.A.-S.; writing—review and editing, W.M, C.N.H.-S. and P.G.J.; visualization, M.A.-S.; supervision, C.N.H.-S., P.G.J. and F.S.; project administration, C.N.H.-S., P.G.J. and F.S. All authors have read and agreed to the published version of the manuscript.

Funding

This research received no external funding.

Institutional Review Board Statement

Not applicable.

Informed Consent Statement

Not applicable.

Data Availability Statement

The data presented in this study are available on request from the corresponding author. The data are not publicly available due to potential commercial sensitivity.

Acknowledgments

M.A. would like to thank Sandvik Materials Technology for the financial support and the permission to publish this paper.

Conflicts of Interest

The authors declare no conflict of interest.

References

  1. Holt, R.T.; Wallace, W. Impurities and trace elements in nickel-base superalloys. Int. Met. Rev. 1976, 21, 1–24. [Google Scholar] [CrossRef]
  2. Banerjee, K. The Role of Magnesium in Superalloys—A Review. Mater. Sci. Appl. 2011, 2, 1243–1255. [Google Scholar] [CrossRef] [Green Version]
  3. Xie, X.; Xu, Z.; Qu, B.; Chen, G.; Radavich, J.F. The role of Mg on structure and mcechanical properties in alloy 718. In Proceedings of the Superalloys 1988 (sixth International Symposium), Champion, PA, USA, 18–22 September 1988; pp. 635–642. [Google Scholar]
  4. Wang, D.; Chen, E. The role of small amounts of magnesium in nickel-base and iron-nickel-base superalloys after high temperature long time exposures. In Proceedings of the Superalloys 718 Metallurgy and Applications; Minerals, Metals & Materials Society (TMS): Pittsburgh, PA, USA, 1989; pp. 611–620. [Google Scholar]
  5. Zengyong, Z.; Peili, M.; Jingyun, Z.; Ying, Y.; Nong, J. Effect of Trace Additions of Magnesium on Creep Crack Growth of a Superalloy. In Proceedings of the Superalloys 1992 (seventh International Symposium), Champion, PA, USA, 20–24 September 1992; pp. 629–635. [Google Scholar]
  6. Chen, G.; Zhu, Q.; Wang, D.; Xie, X. Effects of Magnesium on Niobium Segregation and Impact Toughness in Cast Alloy 718. In Proceedings of the Superalloys 718 Metallurgy and Applications; Minerals, Metals & Materials Society (TMS): Pittsburgh, PA, USA, 1989; pp. 545–551. [Google Scholar]
  7. Ma, P.; Yuan, Y.; Zhong, Z. Creep behavior of magnesium microalloyed wrought superalloys. In Proceedings of the Superalloys 1988 (sixth International Symposium), Champion, PA, USA, 18–22 September 1988; pp. 625–633. [Google Scholar]
  8. He, Y.; Wang, F.; Li, C.; Yang, Z.; Zhang, J.; Li, Y. Effect of Mg content on the hot ductility of wrought Fe-36Ni alloy with Ti addition. Mater. Sci. Eng. A 2016, 673, 99–107. [Google Scholar] [CrossRef]
  9. Muzyka, D.R.; Whitney, C.R. Process for Making Nickel Base Precipitation Hardenable Alloys. U.S. Patent 3,575,734, 20 April 1971. [Google Scholar]
  10. Schramm, J.; Olson, J.H.; Bieber, C.G. Process for Improving Elevated Temperature Strength and Ductility of Nickel-Base Alloys. U.S. Patent 3,512,963, 19 May 1970. [Google Scholar]
  11. Moyer, J.M. Extra Low Carbon Alloy 718. In Proceedings of the Superalloys 1984 (fifth International Symposium), Seven Springs, PA, USA, 7–11 October 1984; pp. 443–454. [Google Scholar]
  12. Kubota, S.; Uehara, T.; Yamaguchi, M.; Toji, A. Ni-based alloy improved in oxidation-resistance, high temperature strength and hot workability. U.S. Patent 6,852,177, 8 February 2005. [Google Scholar]
  13. Verlinden, B.; Driver, J.; Samajdar, I.; Doherty, R. Thermo-Mechanical Processing of Metallic Materials; Elsevier: Amsterdam, The Netherlands, 2007; Volume 11, ISBN 9780080444970. [Google Scholar]
  14. Al-Saadi, M.; Sandberg, F.; Kasarav, A.; Jonsson, S.; Jönsson, P. Microstructure characterisation in alloy 825. Procedia Manuf. 2018, 15, 1626–1634. [Google Scholar] [CrossRef]
  15. Al-Saadi, M.; Sandberg, F.; Karasev, A.; Jönsson, P. Comparative Study of Microstructures Evolution of Columnar and Equiaxed Grain Structurs in Alloy 825 after Hot Compression. In Proceedings of the 3rd International Conference on Ingot Casting, Rolling and Forging, ICRF2018, Stockholm, Sweden, 16–19 October 2018; pp. 107–115. [Google Scholar]
  16. Mitra Basirat, Microstructural Evolution In As-cast Alloys during Plastic Deformation. Ph.D. Thesis, KTH Royal Institute of Technology, Stockholm, Sweden, 2013.
  17. Poliak, E.I.; Jonas, J.J. Critical Strain for Dynamic Recrystallization in Variable Strain Rate Hot Deformation. ISIJ Int. 2003, 43, 692–700. [Google Scholar] [CrossRef]
  18. Mirzadeh, H.; Najafizadeh, A.; Moazeny, M. Flow Curve Analysis of 17-4 PH Stainless Steel under Hot Compression Test. Metall. Mater. Trans. A 2009, 40, 2950–2958. [Google Scholar] [CrossRef]
  19. Azarbarmas, M.; Aghaie-Khafri, M.; Cabrera, J.M.; Calvo, J. Microstructural evolution and constitutive equations of Inconel 718 alloy under quasi-static and quasi-dynamic conditions. Mater. Des. 2016, 94, 28–38. [Google Scholar] [CrossRef] [Green Version]
  20. Mirzadeh, H.; Cabrera, J.M.; Najafizadeh, A. Constitutive relationships for hot deformation of austenite. Acta Mater. 2011, 59, 6441–6448. [Google Scholar] [CrossRef]
  21. Safara Nosar, N.; Sandberg, F.; Engberg, G. Characterization of Hot Deformation Behavior in a 13% Chromium Steel. Mater. Sci. Forum 2018, 941, 458–467. [Google Scholar] [CrossRef] [Green Version]
  22. Poliak, E.I.; Jonas, J.J. Initiation of Dynamic Recrystallization in Constant Strain Rate Hot Deformation. ISIJ Int. 2003, 43, 684–691. [Google Scholar] [CrossRef] [Green Version]
  23. Momeni, A.; Dehghani, K.; Ebrahimi, G.R. Modeling the initiation of dynamic recrystallization using a dynamic recovery model. J. Alloys Compd. 2011, 509, 9387–9393. [Google Scholar] [CrossRef]
  24. Najafizadeh, A.; Jonas, J.J. Predicting the critical stress for initiation of dynamic recrystallization. ISIJ Int. 2006, 46, 1679–1684. [Google Scholar] [CrossRef] [Green Version]
  25. Satheesh Kumar, S.S.; Raghu, T.; Bhattacharjee, P.P.; Appa Rao, G.; Borah, U. Constitutive modeling for predicting peak stress characteristics during hot deformation of hot isostatically processed nickel-base superalloy. J. Mater. Sci. 2015, 50, 6444–6456. [Google Scholar] [CrossRef]
  26. Chen, X.M.; Lin, Y.C.; Wen, D.X.; Zhang, J.L.; He, M. Dynamic recrystallization behavior of a typical nickel-based superalloy during hot deformation. Mater. Des. 2014, 57, 568–577. [Google Scholar] [CrossRef]
  27. Al-Saadi, M.; Sandberg, F.; Hulme-Smith, C.; Karasev, A.; Jönsson, P.G. A study of the static recrystallization behaviour of cast Alloy 825 after hot-compressions. J. Phys. Conf. Ser. 2019, 1270, 012023. [Google Scholar] [CrossRef]
  28. ASTM E2627 Standard Practice for Determining Average Grain Size Using Electron Backscatter Diffraction (EBSD) in Fully Recrystallized Polycrystalline Materials. Astm Int. 2019, 03.01, 1–5.
  29. Raveendra, S.; Mishra, S.; Krishna, K.V.M.; Weiland, H.; Samajdar, I. Patterns of Recrystallization in Warm- and Hot-Deformed. Metall. Mater. Trans. A 2008, 39A, 2760–2771. [Google Scholar] [CrossRef]
  30. Field, D.P.; Bradford, L.T.; Nowell, M.M.; Lillo, T.M. The role of annealing twins during recrystallization of Cu. Acta Mater. 2007, 55, 4233–4241. [Google Scholar] [CrossRef]
  31. Ayad, A.; Allain-Bonasso, N.; Rouag, N.; Wagner, F. Grain Orientation Spread Values in if Steels after Plastic Deformation and Recrystallization. Mater. Sci. Forum 2011, 702–703, 269–272. [Google Scholar] [CrossRef]
  32. Nordström, J.; Siriki, R.; Calmunger, M.; Moverare, J.; Chai, G. TWIP and Fracture Behavior in the Superalloy 625 at Room and Cryogenic Temperatures. Procedia Struct. Integr. 2019, 23, 457–462. [Google Scholar] [CrossRef]
  33. Raveendra, S. Cube Stability in Aluminum. Ph.D. Thesis, Department of Metallurgical Engineering and Materials Science, Indian Institute of Technology Bombay, Bombay, Indian, 2010. [Google Scholar]
  34. Sellars, C.M.; McTegart, W.J. On the mechanism of hot deformation. Acta Metall. 1966, 14, 1136–1138. [Google Scholar] [CrossRef]
  35. Jafari, M.; Najafizadeh, A. Correlation between Zener-Hollomon parameter and necklace DRX during hot deformation of 316 stainless steel. Mater. Sci. Eng. A 2009, 501, 16–25. [Google Scholar] [CrossRef]
  36. Medina, S.F.; Hernandez, C.A. General expression of the Zener-Hollomon parameter as a function of the chemical composition of low alloy and microalloyed steels. Acta Mater. 1996, 44, 137–148. [Google Scholar] [CrossRef]
  37. Zener, C.; Hollomon, J.H. Effect of strain rate upon plastic flow of steel. J. Appl. Phys. 1944, 15, 22–32. [Google Scholar] [CrossRef]
  38. Momeni, A.; Abbasi, S.M.; Morakabati, M.; Badri, H.; Wang, X. Dynamic recrystallization behavior and constitutive analysis of Incoloy 901 under hot working condition. Mater. Sci. Eng. A 2014, 615, 51–60. [Google Scholar] [CrossRef]
  39. Al-Saadi, M. Hot Deformation Behaviour of Alloy SAN60. R&D Metallurgy, AB Sandvik Materials Technology: Sandviken, Sweden, Unpublished Research; 2018. [Google Scholar]
  40. Huang, K.; Logé, R.E. A review of dynamic recrystallization phenomena in metallic materials. Mater. Des. 2016, 111, 548–574. [Google Scholar] [CrossRef]
  41. Humphreys, J.; Rohrer, G.S.; Rollett, A. Recrystallization and Related Annealing Phenomena, 2nd ed.; Elsevier: Amsterdam, The Netherlands, 2014; ISBN 0080441645. [Google Scholar]
  42. Dudova, N.; Belyakov, A.; Sakai, T.; Kaibyshev, R. Dynamic recrystallization mechanisms operating in a Ni-20%Cr alloy under hot-to-warm working. Acta Mater. 2010, 58, 3624–3632. [Google Scholar] [CrossRef]
  43. Coryell, S.P.; Findley, K.O.; Mataya, M.C.; Brown, E. Evolution of microstructure and texture during hot compression of a Ni-Fe-Cr superalloy. Metall. Mater. Trans. A Phys. Metall. Mater. Sci. 2012, 43, 633–649. [Google Scholar] [CrossRef]
  44. Sakai, T.; Belyakov, A.; Kaibyshev, R.; Miura, H.; Jonas, J.J. Dynamic and post-dynamic recrystallization under hot, cold and severe plastic deformation conditions. Prog. Mater. Sci. 2014, 60, 130–207. [Google Scholar] [CrossRef] [Green Version]
  45. Janis, J.; Karasev, A.; Nakajima, K.; Jönsson, P.G. Effect of Secondary Nitride Particles on Grain Growth in a Fe-20 mass% Cr Alloy Deoxidised with Ti and Zr. ISIJ Int. 2013, 53, 476–483. [Google Scholar] [CrossRef] [Green Version]
  46. Lin, Y.C.; Wu, X.Y.; Chen, X.M.; Chen, J.; Wen, D.X.; Zhang, J.L.; Li, L.T. EBSD study of a hot deformed nickel-based superalloy. J. Alloys Compd. 2015, 640, 101–113. [Google Scholar] [CrossRef]
  47. Muzyk, M.; Pakiela, Z.; Kurzydlowski, K.J. Generalized stacking fault energy in magnesium alloys: Density functional theory calculations. Scr. Mater. 2012, 66, 219–222. [Google Scholar] [CrossRef]
  48. Siegel, D.J. Generalized stacking fault energies, ductilities, and twinnabilities of Ni and selected Ni alloys. Appl. Phys. Lett. 2005, 87, 1–3. [Google Scholar] [CrossRef] [Green Version]
  49. Ullrich, C.; Eckner, R.; Krüger, L.; Martin, S.; Klemm, V.; Rafaja, D. Interplay of microstructure defects in austenitic steel with medium stacking fault energy. Mater. Sci. Eng. A 2016, 649, 390–399. [Google Scholar] [CrossRef]
  50. Hughes, D.A.; Lebensohn, R.A.; Wenk, H.R.; Kumar, A. Stacking Fault Energy and Microstructure Effects on Torsion Texture Evolution. The Royal Society Stable. Society 2008, 456, 921–953. [Google Scholar]
  51. Wang, L.; Liu, F.; Zuo, Q.; Chen, C.F. Prediction of flow stress for N08028 alloy under hot working conditions. Mater. Des. 2013, 47, 737–745. [Google Scholar] [CrossRef]
  52. Sellars, C.M.; Tegart, W.J.M. Hot Workability. Int. Met. Rev. 1972, 17, 1–24. [Google Scholar] [CrossRef]
  53. Niikura, M.; Takahashi, K.; Ouchi, C. Microstructural Change of Austenite in Hot Working with Very High Reduction. Trans. ISIJ 1987, 27, 485–491. [Google Scholar] [CrossRef] [Green Version]
  54. Yang, L.; Geng, Z.; Zhang, M.; Dong, J. Study on hot deformation behavior and numerical simulation for hot extrusion process of corrosion resistant 825 alloy. Procedia Eng. 2012, 27, 997–1007. [Google Scholar] [CrossRef] [Green Version]
  55. Lewandowski, M.S.; Sahai, V.; Wilcox, R.C.; Matlock, C.A.; Overfelt, R.A. High Temperature Deformation of Inconel 718 Castings. In Proceedings of the Superalloys 718, 625, 706 and Various Derivatives (1994); Minerals, Metals & Materials Society (TMS): New York, NY, USA, 1994; pp. 345–354. [Google Scholar]
  56. Nowotnik, A. Effect of high temperature deformation on the structure of Ni based superalloy. J. Achiev. Mater. Manuf. Eng. 2008, 27, 115–122. [Google Scholar]
  57. Garcia, C.I.; Wang, G.D.; Camus, D.E.; Loria, E.A.; DeArdo, A.J. Hot Deformation Behavior of Superalloy 718. Superalloys 718, 625, 706 Var. Deriv. 1994, 1, 293–302. [Google Scholar]
  58. Yu, M.; Li, J.; Tang, H.; Bao, Y. Hot Working Characteristics of Corrosion-Resistant Alloys G3 and 825. J. Iron Steel Res. Int. 2011, 18, 68–72. [Google Scholar] [CrossRef]
  59. Shaban, M.; Eghbali, B. Characterization of Austenite Dynamic Recrystallization under Different Z Parameters in a Microalloyed Steel. J. Mater. Sci. Technol. 2011, 27, 359–363. [Google Scholar] [CrossRef]
  60. Pereda, B.; Fernández, A.I.; López, B.; Rodriguez-Ibabe, J.M. Effect of Mo on Dynamic Recrystallization Behavior of Nb-Mo Microalloyed Steels. ISIJ Int. 2007, 47, 860–868. [Google Scholar] [CrossRef] [Green Version]
  61. Torganchuk, V.; Morozova, A.; Tikhonova, M.; Kaibyshev, R.; Belyakov, A. Grain sizes and dislocation densities in fcc-metallic materials processed by warm to hot working. J. Phys. Conf. Ser. 2019, 1270, 012039. [Google Scholar] [CrossRef]
  62. Dehghan-Manshadi, A.; Barnett, M.R.R.; Hodgson, P.D.D. Hot Deformation and Recrystallization of Austenitic Stainless Steel: Part I. Dynamic Recrystallization. Metall. Mater. Trans. A 2008, 39, 1359–1370. [Google Scholar] [CrossRef] [Green Version]
  63. Maki, T.; Okaguchi, S.; Tamura, I. Dynamic Recrystallization in Ferritic Stainless Steel. In Strength of Metals and Alloys (ICSMA 6); Elsevier: Amsterdam, The Netherlands, 1982; pp. 529–534. [Google Scholar]
  64. Matsui, T. High Temperature Deformation and Dynamic Recrystallization Behavior of Alloy718. Mater. Trans. 2013, 54, 512–519. [Google Scholar] [CrossRef] [Green Version]
Figure 1. Schematic representation of the samples, applied thermomechanical processes and sectioning geometries for the hot compression tests. The tests were conducted on a Gleeble-3500 thermomechanical simulator.
Metals 11 00036 g001
Figure 2. Work hardening rate (solid line) and true stress (dash line) as a function of true strain for temperature of 1200   and strain rate of 1   s 1 for Alloy A.
Metals 11 00036 g002
Figure 3. True stress–true strain curves for alloy 825 tested at strain rates ranging from 0.1 to 10 s−1 and temperatures of (a) 1100 °C, (b) 1150 °C, (c) 1200 °C, and (d) 1250 °C. The vertical order of the dashed lines is the same as for the solid lines. Solid lines are for samples that contain magnesium; dashed lines represent data for samples to which magnesium has not been added. To aid a clear comparison, the y axis range is kept constant in all subfigures.
Metals 11 00036 g003
Figure 4. Effect of the deformation temperature on (a) peak strain and (b) peak stress. The uncertainties in both peak stress and peak strain are estimated to be ± 2%.
Metals 11 00036 g004
Figure 5. EBSD image of the sections normal to the longitudinal direction in the casting of samples of (a) Alloy A and (b) Alloy B after solution annealing at 1200 °C; (c) key used for the coloring of the pole figure maps shown in (a,b) is given. The regions displayed are representative of the entire material and two additional EBSD scans of each alloy are available online as Supplementary files.
Metals 11 00036 g005aMetals 11 00036 g005b
Figure 6. Micrographs after the hot deformation at 0.1 s−1 of the materials and at temperatures of (a,c) 1100 °C, (b,d) 1150 °C, (e,g) 1200 °C, and (f,h) 1250 °C. The fraction of recrystallized grains in Alloy A is higher than that of Alloy B at all deformation temperatures.
Metals 11 00036 g006
Figure 7. Micrographs after hot deformation at 1 s−1 of the materials and at temperatures of (a,c) 1100 °C, (b,d) 1150 °C, (e,g) 1200 °C, and (f,h) 1250 °C. The fraction of recrystallized grains in Alloy A is higher than that of Alloy B at all deformation temperatures.
Metals 11 00036 g007
Figure 8. Micrographs after hot deformation at 10.0   s 1 of the materials and at temperatures of (a,c) 1100   , (b,d) 1150   , (e,g) 1200   , and (f,h) 1250   . The fraction of recrystallized grains in Alloy A is higher than that of Alloy B at all deformation temperatures. PSN stands for particle simulated nucleation.
Metals 11 00036 g008
Figure 9. Morphology of a representative precipitate observed at a grain boundary. EDS analysis suggests that the central precipitate consists of a mixture of Al2O3 and MgO, while the square precipitate surrounding it is likely to be TiN (spectrum 2 of EDS analysis) which forms on the Al2O3–MgO particle.
Metals 11 00036 g009
Figure 10. Effect of deformation temperature on the fraction of dynamically recrystallized grains. The error bars represent the standard error about the mean value.
Metals 11 00036 g010
Figure 11. After hot deformation and excluding twins: (a) the number of dynamically recrystallized grains per square millimeter; and (b) the average dynamically recrystallized grain size. The error bars represent the standard error of the mean value.
Metals 11 00036 g011
Figure 12. Effect of the deformation temperature on the fraction of high angle grain boundaries. The error bars represent the standard error about the mean value. It should be noted that the remainder of the angle grain boundaries in each measurement are classified as low-angle grain boundaries.
Metals 11 00036 g012
Figure 13. Microstructural evolution following hot-deformation at a strain rate of 0.1   s 1 and at temperatures with high angle grain boundaries (a,b) 1100   , (c,d) 1150   , (e,g) 1200   , and (f,h) 1250   . Each image is overlaid with high angle grain boundaries (white) and low angle grain boundaries (black). All images are presented using the same scale. (i) The color map of the pole figure maps shown in (ah). The regions displayed are representative of the entire material. CD means the direction parallel to the direction of casting the length of the continuously cast strand, or the long direction of the ingot, as appropriate). ND means the orientation normal to the casting direction, CD.
Metals 11 00036 g013aMetals 11 00036 g013b
Figure 14. Microstructural evolution following hot-deformation at a strain rate of 1 s−1 and at temperatures of (a,c) 1100 °C, (b,d) 1150   , (e,g) 1200   , and (f,h) 1250   . Each image is overlaid with high angle grain boundaries (white) and low angle grain boundaries (black). All images are presented using the same scale. (i) The color map of the pole figure maps shown in (ah). The regions displayed are representative of the entire material.
Metals 11 00036 g014aMetals 11 00036 g014b
Figure 15. Microstructural evolution following hot-deformation at a strain rate of 10 s−1 and at temperatures of (a,c) 1100 °C, (b,d) 1150   , (e,g) 1200   , and (f,h) 1250   . Each image is overlaid with high angle grain boundaries (white) and low angle grain boundaries (black). All images are presented using the same scale. (i) The color map of the pole figure maps shown in (ah). The regions displayed are representative of the entire material.
Metals 11 00036 g015aMetals 11 00036 g015b
Figure 16. Relation between (a) the peak strain and (b) peak stress with the Zener–Hollomon parameter.
Metals 11 00036 g016
Figure 17. The relationship between the decadic logarithm of the strain rate, log 10 ε ˙ , and (a) the decadic logarithm of peak stress, log 10 σ P and (b) peak stress, σ P , as a function of different deformation temperature.
Metals 11 00036 g017
Figure 18. The relationship between (a) the decadic logarithms of the strain rate and the hyperbolic sine of the product of peak stress and the parameter, α , log 10 ε ˙ and log 10 [ sinh ( α σ P ) ] at a constant deformation temperature, and (b) the decadic logarithm of the product of peak stress and the parameter, α , log 10 [ sinh ( α σ P ) ] and the inverse of absolute temperature, T 1 , at a constant strain rate.
Metals 11 00036 g018
Figure 19. The relationship between dynamically recrystallized grain size and Zener–Hollomon parameter, Z . The standard error of the mean dynamically recrystallized grain size in measurements was calculated.
Metals 11 00036 g019
Table 1. Chemical compositions of alloy 825 in this study. All compositions expressed in wt%. Levels of carbon and sulfur were measured using combustion photometry. Combustion analysis was used for carbon and nitrogen. X-ray fluorescence spectrometry was used for other elements. Uncertainty estimates for C and N measurements are taken from data in standard ASTM E1018-11. The uncertainty estimates of the other elements are taken from ASTM E572-13.
ElementsCSCrMoCoTiCuNMgFeO
Alloy A0.020<5 ppm22.203.090.0780.761.580.0120.0076307 ppm
Alloy B0.007<5 ppm22.082.530.0450.801.600.01003210 ppm
Uncertainty0.010.0010.0010.03-0.0030.0020.0050.0001--
Table 2. Composition of precipitate observed at grain boundaries in Alloy A after hot-deformation at 1250   and a strain rate of 0.1   s 1 .
ElementONTiAlMgNiFeCr
Spectrum 1 35.2 ± 0.2 0 30.0 ± 0.2 21.9 ± 0.1 11.2 ± 0.1 0.8 ± 0.1 0.4 ± 0.1 0.4 ± 0.1
Spectrum 2 0 11.7 ± 0.2 82.2 ± 0.3 0 0 1.5 ± 0.1 1.3 ± 0.1 1.3 ± 0.1
Table 3. Fitted parameters and q for the peak strain and stress in both alloys where the fit is of the form p Z q .
AlloyParameter log p q
A ε P 2.7 ± 0.2 0.112 ± 0.015
σ P 0.21 ± 0.17 0.145 ± 0.011
B ε P 4.2 ± 0.3 0.23 ± 0.02
σ P 0.5 ± 0.3 0.174 ± 0.018
Table 4. Activation energies for high-temperature deformation of the as-cast alloy 825 with and without the addition of magnesium as well as for some other nickel-base superalloys obtained via different methodologies. “W” stands for wrought, “PHS” stands for precipitation hardened super-alloy, “SS” stands for solid solution, and “CW” stands for cold worked nickel-base alloy. “HS” stands for hyperbolic-sine, and “Exp” stands for exponential.
Alloy Type of Cast Processing Temperature/°C Strain Rate Interval/s−1 Total True Strain Type of Constitutive Equation Activation Energy for Hot Deformation/kJ mol−1 References
Alloy AColumnarCW1100 to 12500.1 to 100.7HS430.2Current
Alloy BColumnarCW1100 to 12500.1 to 100.7HS448.8Current
42% Ni
(Alloy 825)
WSS800 to 11501 to 500.7–2.5Exp438[53]
Alloy 825WSS1050 to 12000.1 to 100.7HS416.6[54]
IN706CastSS900 to 1100 5 × 10 4 to 10-Exp472[55]
Inconel 718CastPHS950 to 1150 1 × 10 4 to 4 × 10 4 1.9HS450.8[56]
Inconel 718CastPHS900 to 11770.005 to 5-HS483[57]
INCOLOY901CastPHS950 to 11000.001 to 0.10.7HS415.7[38]
Alloy G3WSS1100 to 12000.1 to 100.16–0.75HS486[58]
Alloy 625WSS950 to 12000.1 to 100.7HS434[39]
Publisher’s Note: MDPI stays neutral with regard to jurisdictional claims in published maps and institutional affiliations.

