Impact of Land Management on Water Resources, a South African Context


Abstract
:1. Introduction
1.1. Theoretical Background
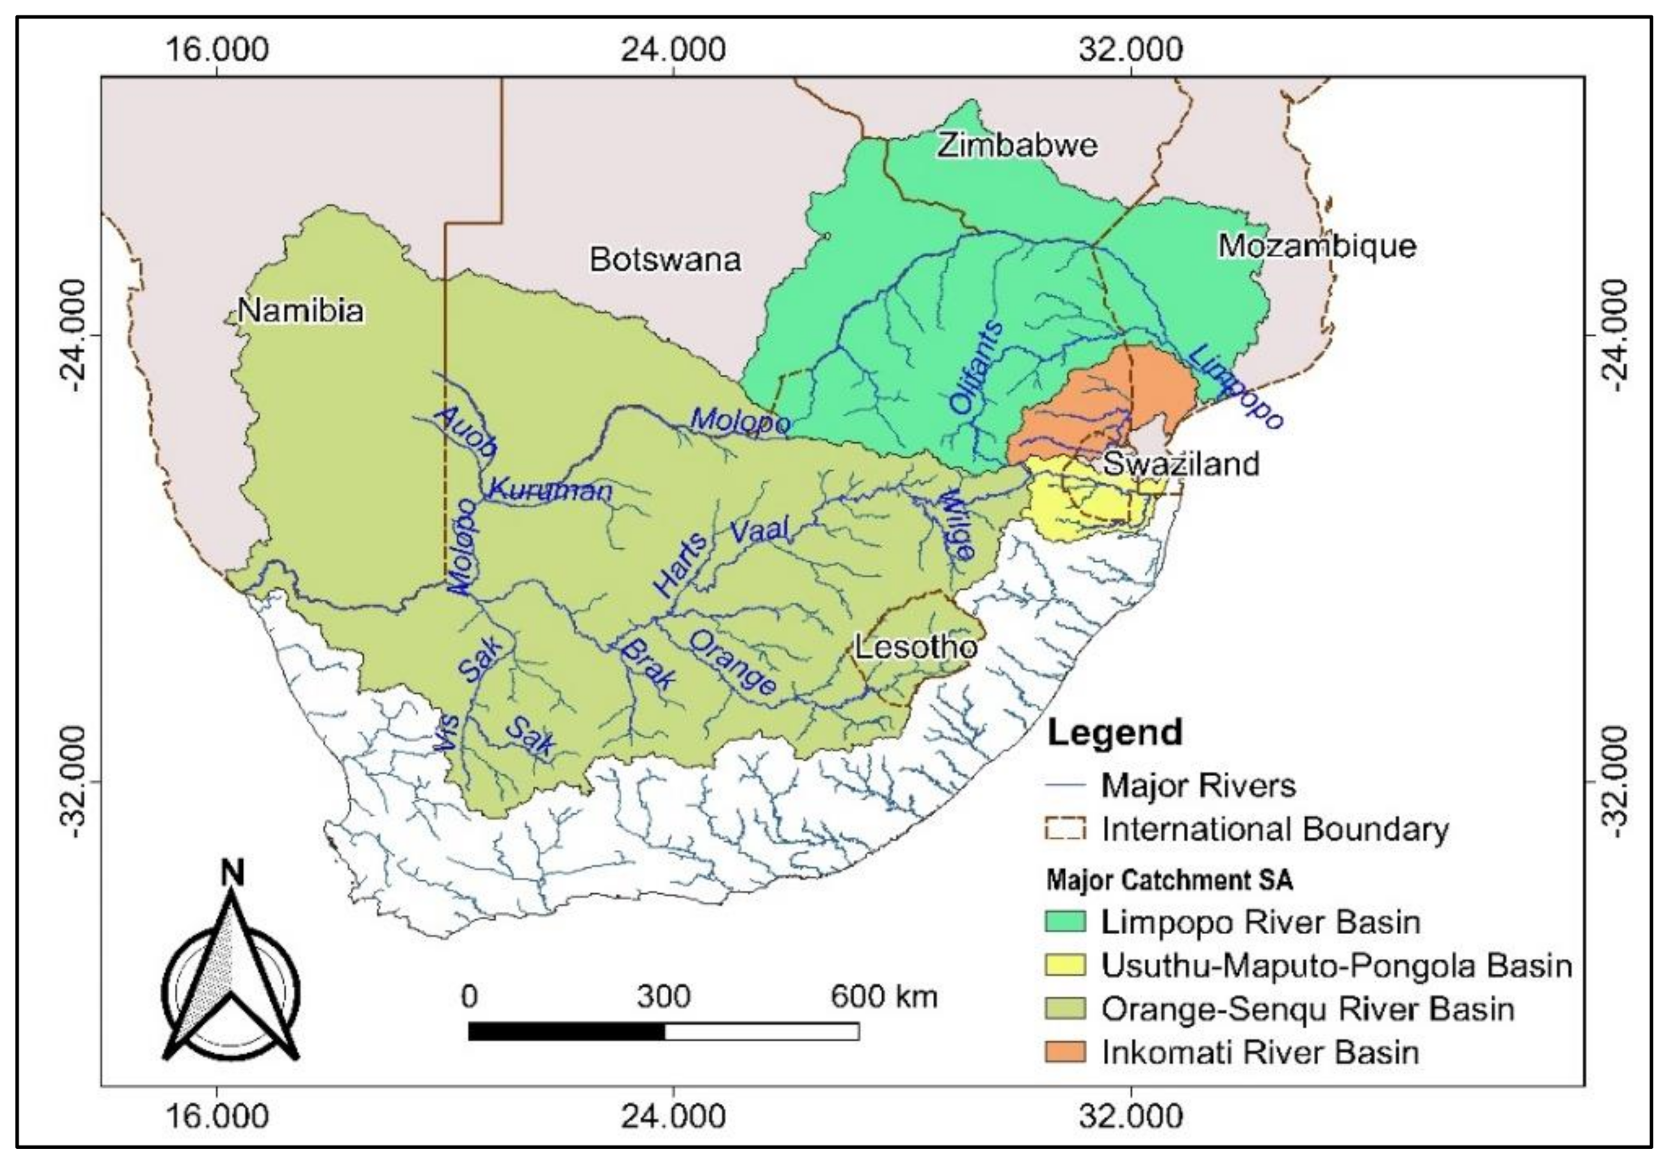
1.1.1. Overview of South Africa’s Water Resources
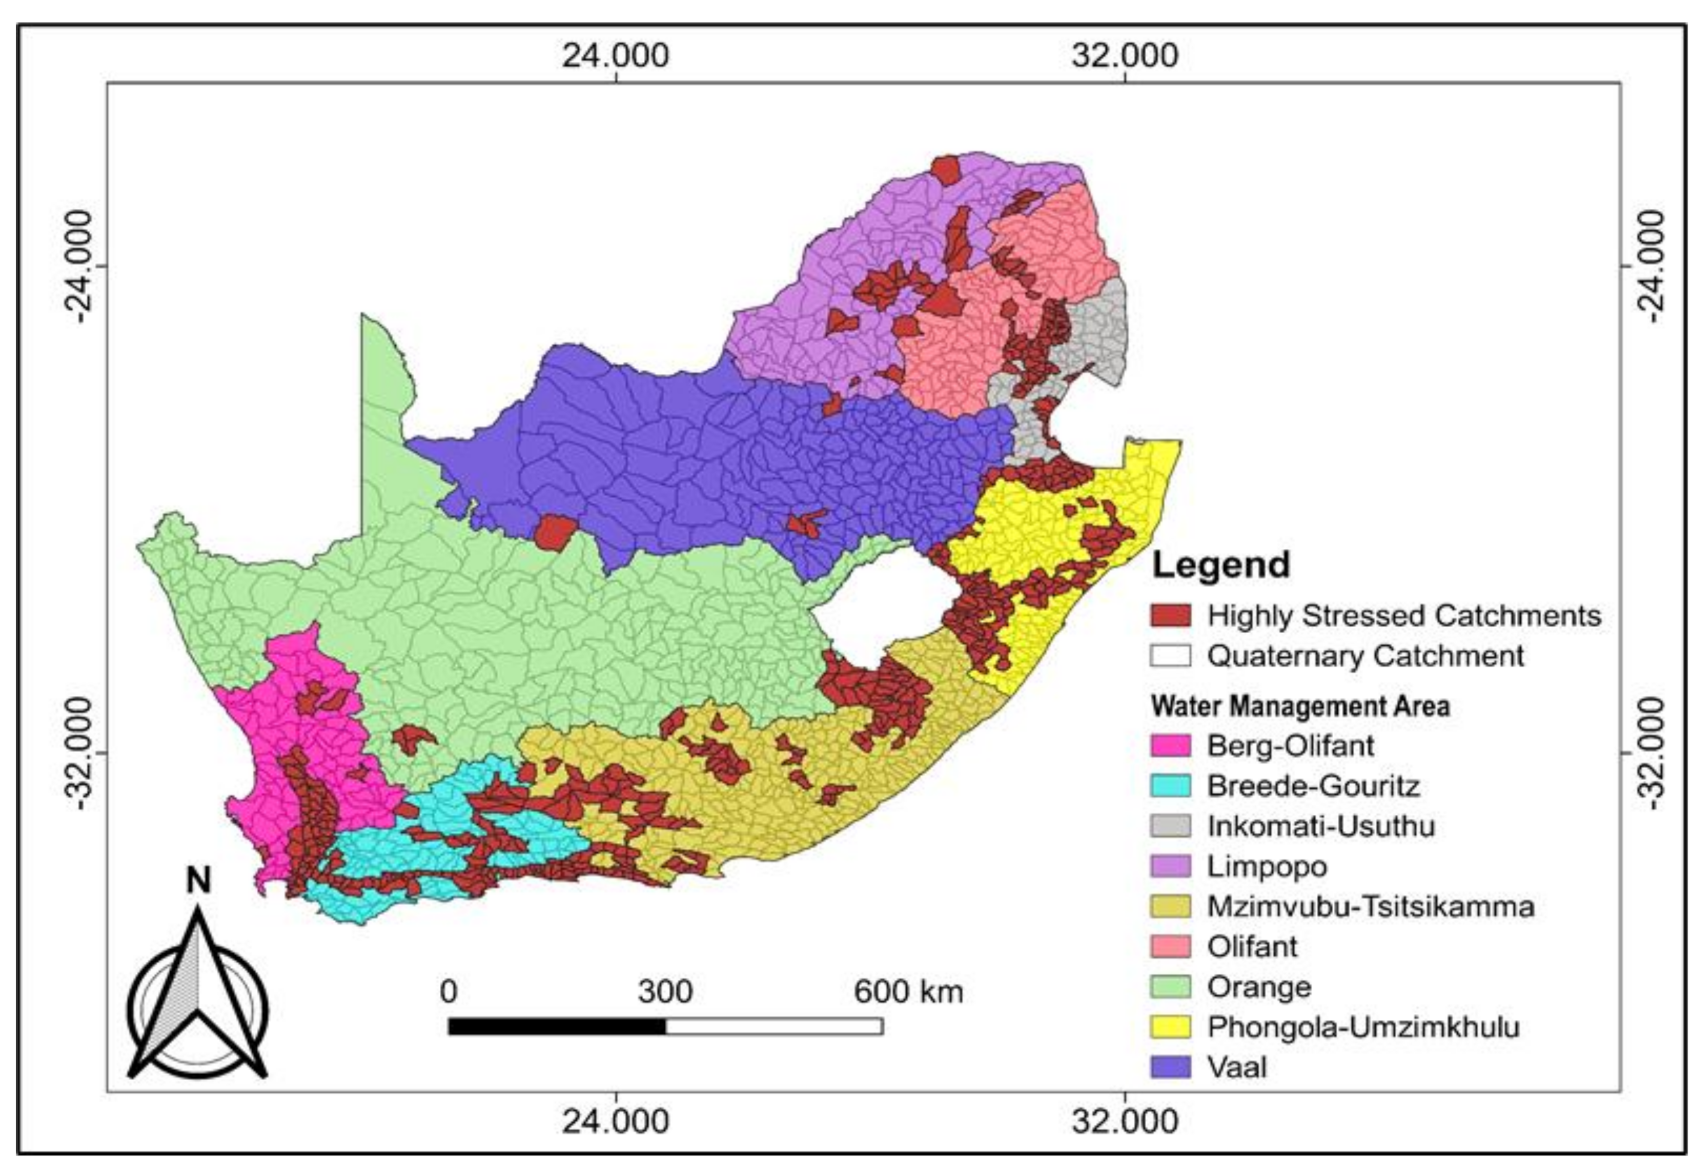
1.1.2. Water Resource Management in South Africa
- The natural conditions (soil and rock type, landforms, and topology), ecosystem, the combined impacts of climatic changes affecting the availability of run-off.
- Population increase and the need for economic development leading to increased water demand and increased pollution of available water resources.
- Water resource management policies governing relevant authorities in managing water resources.
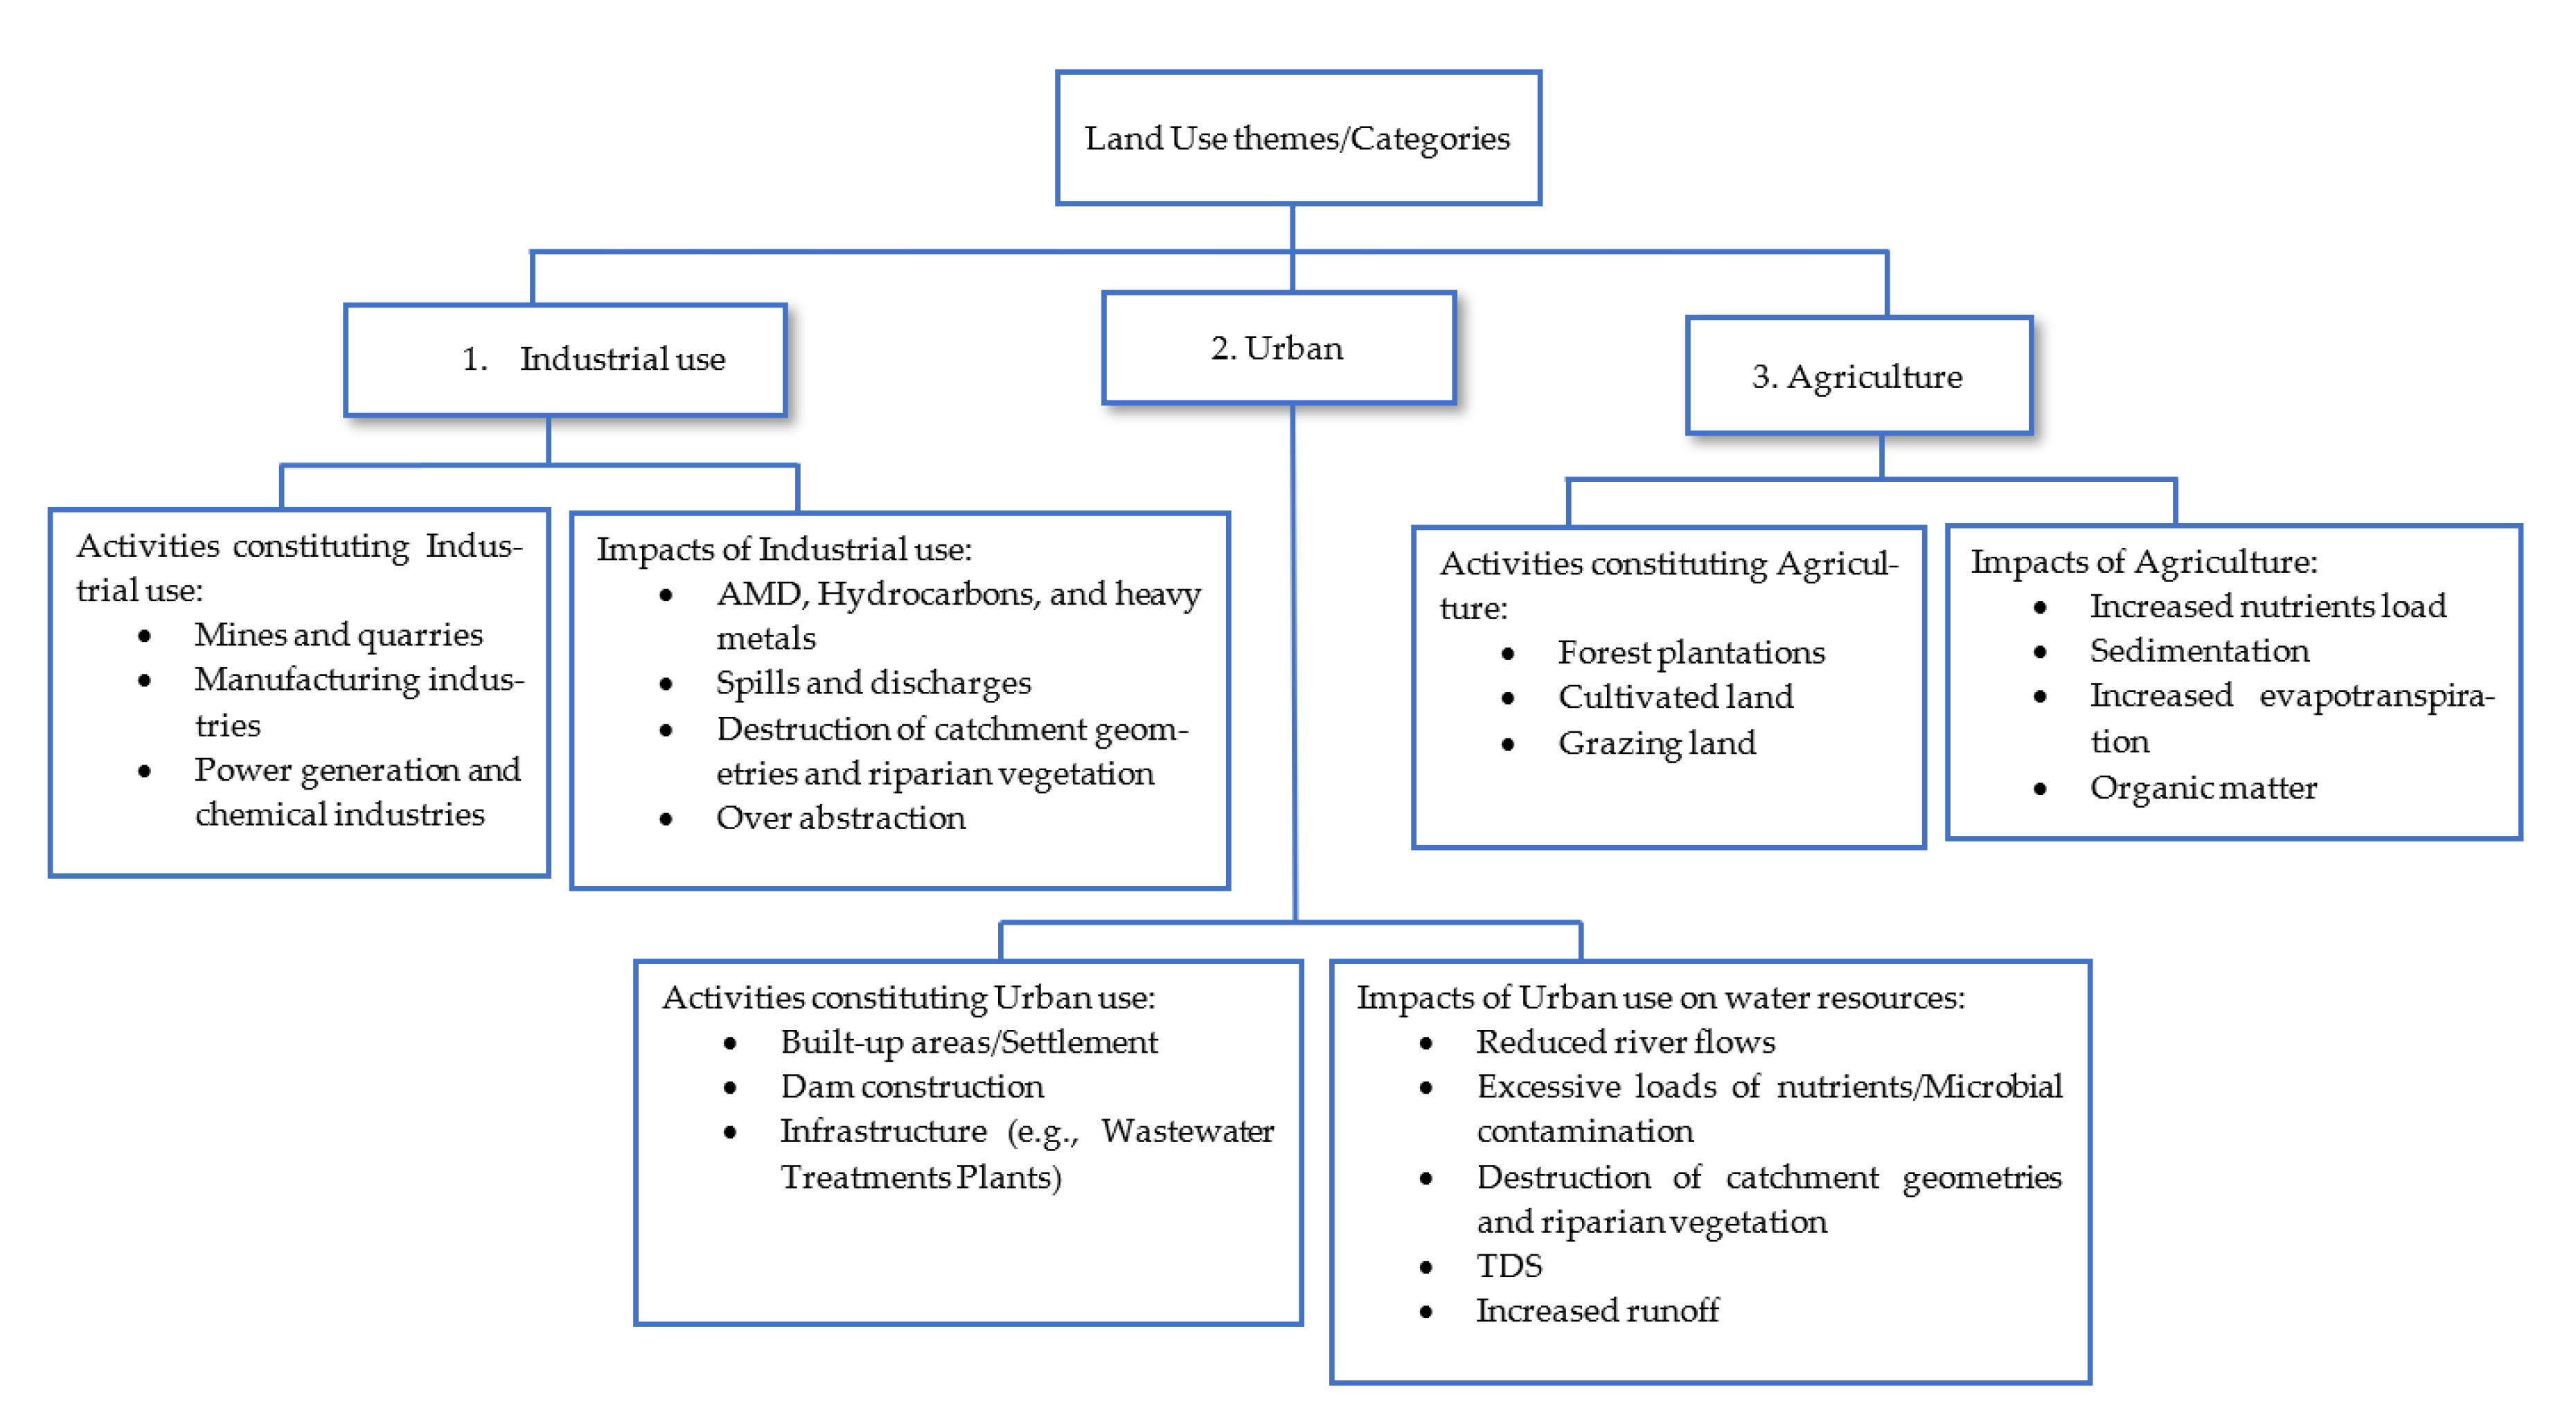
1.1.3. Land Use and Land Management in South Africa
2. Methodology
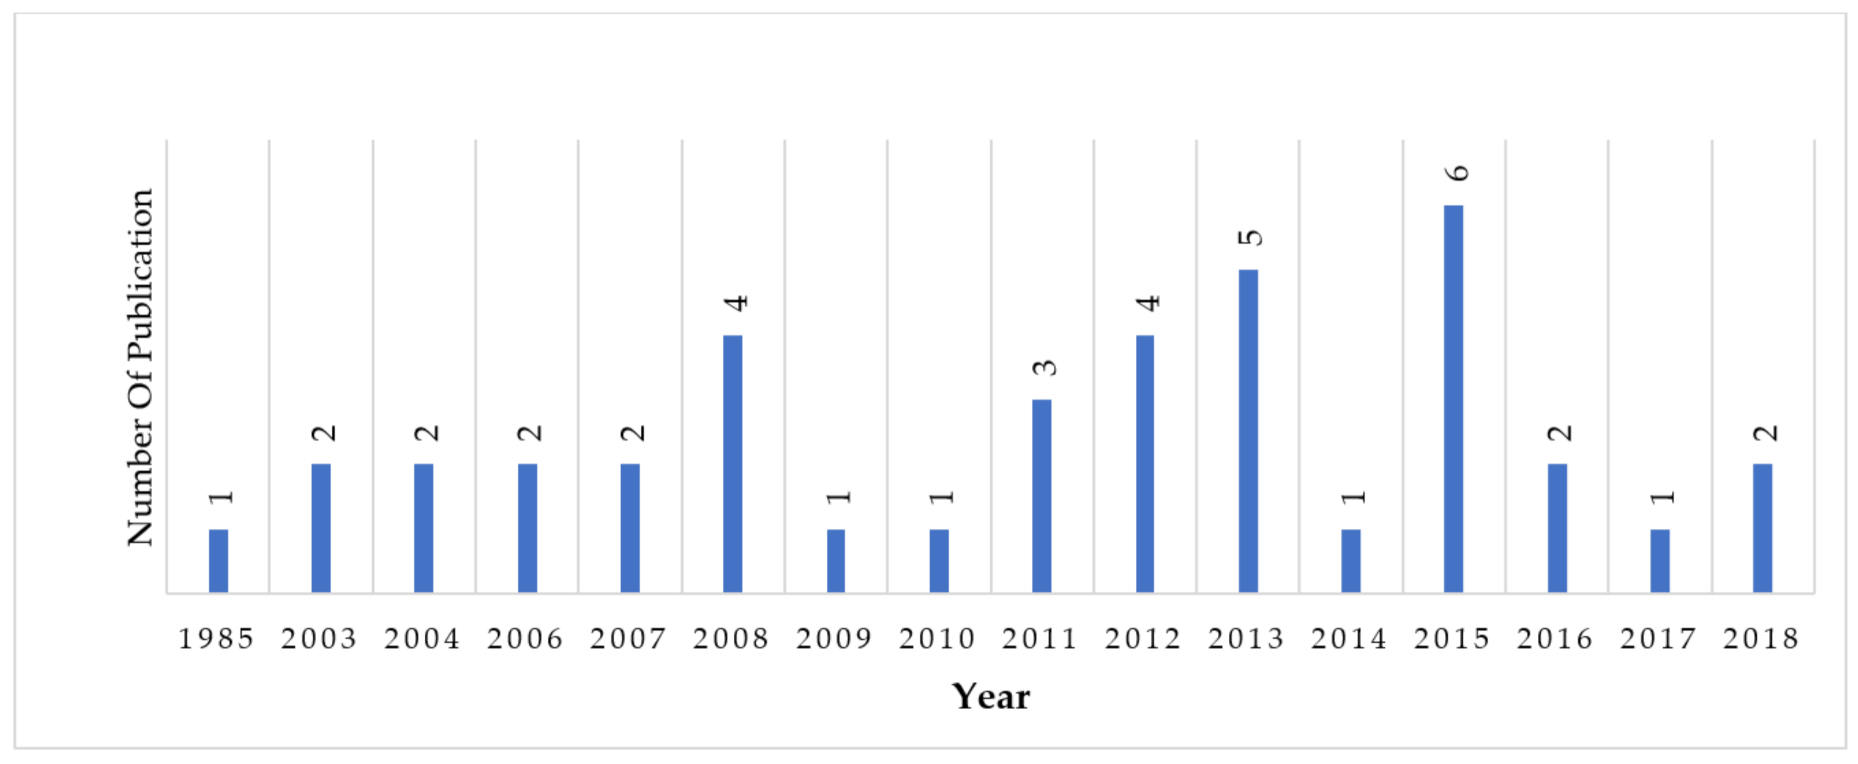
2.1. Article Selection
2.2. Data Extraction
3. Results
3.1. Water Quantity
3.1.1. Runoff and Infiltration
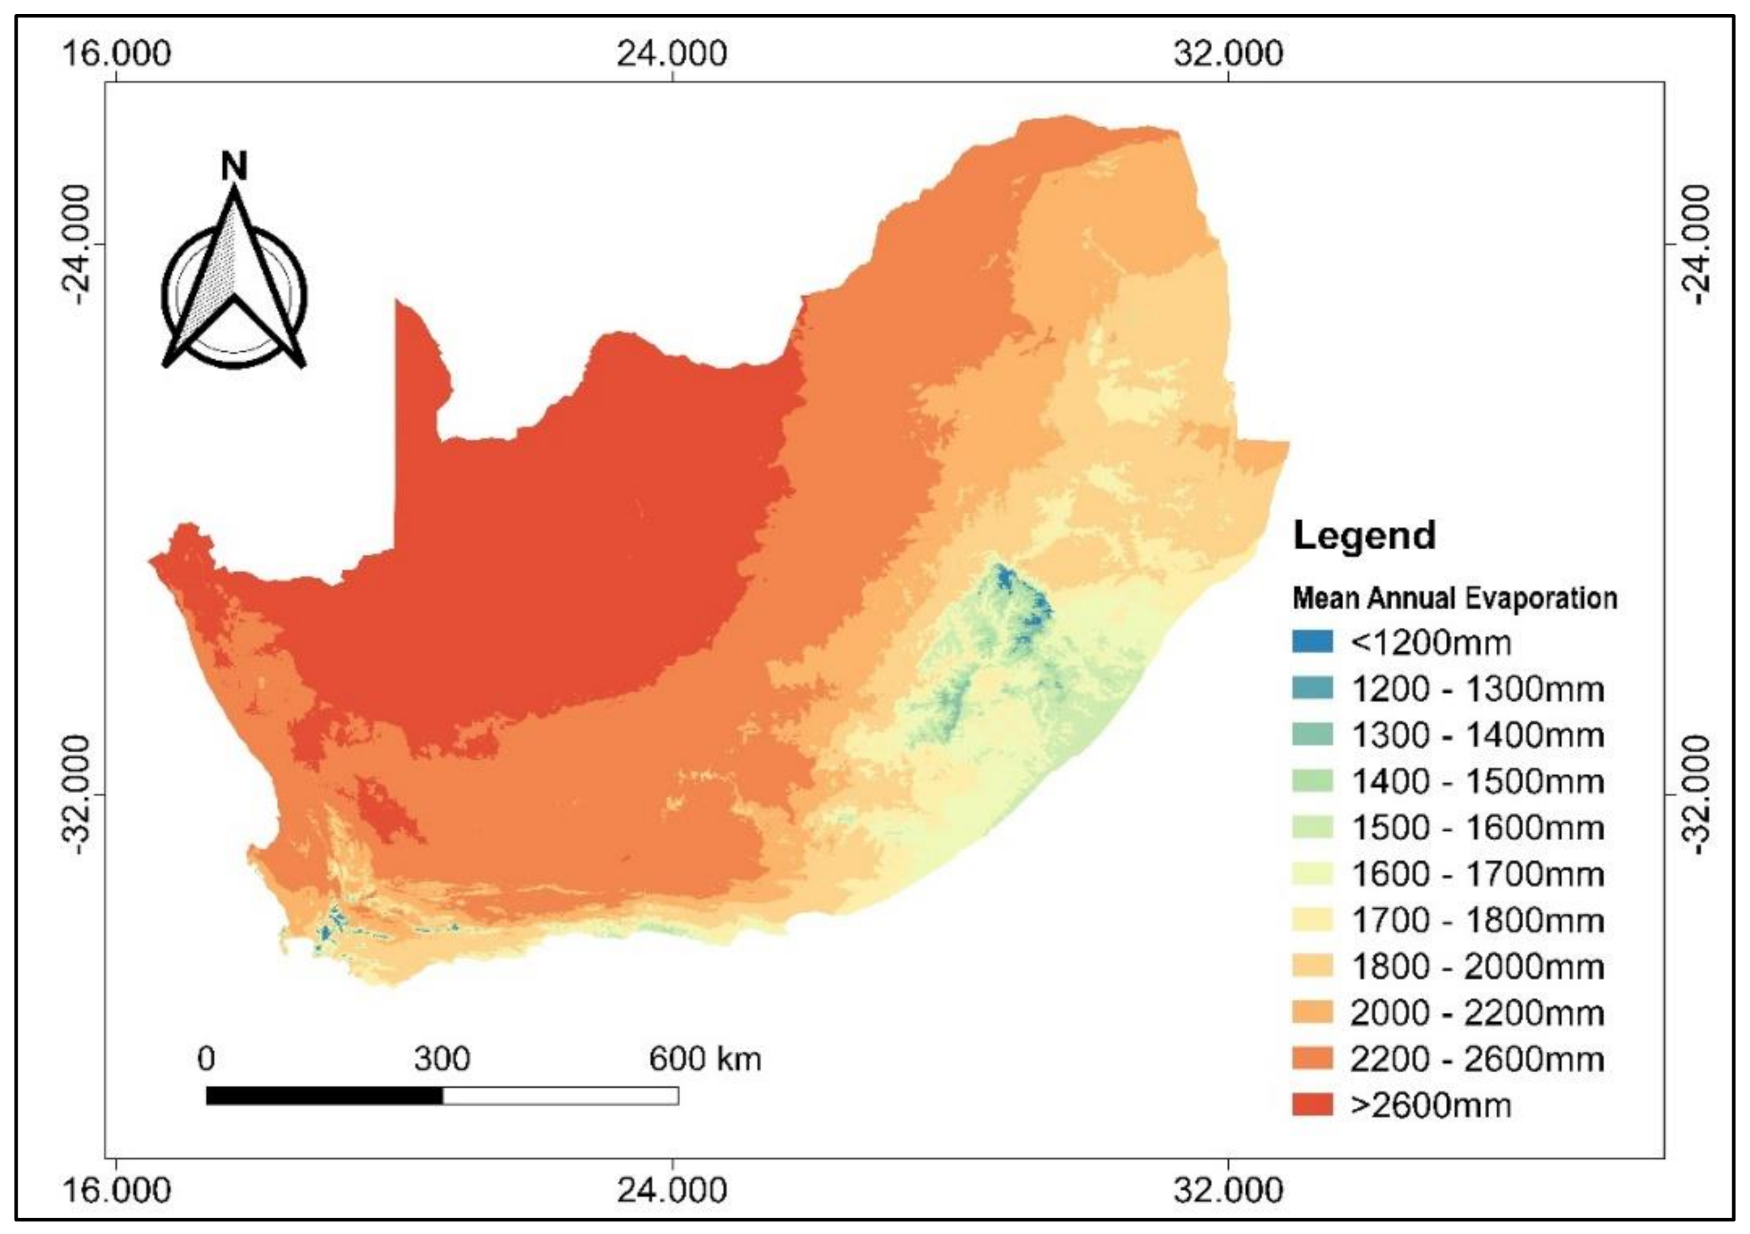
3.1.2. Evaporation/Evapotranspiration
3.2. Water Quality
3.2.1. Surface Water Quality
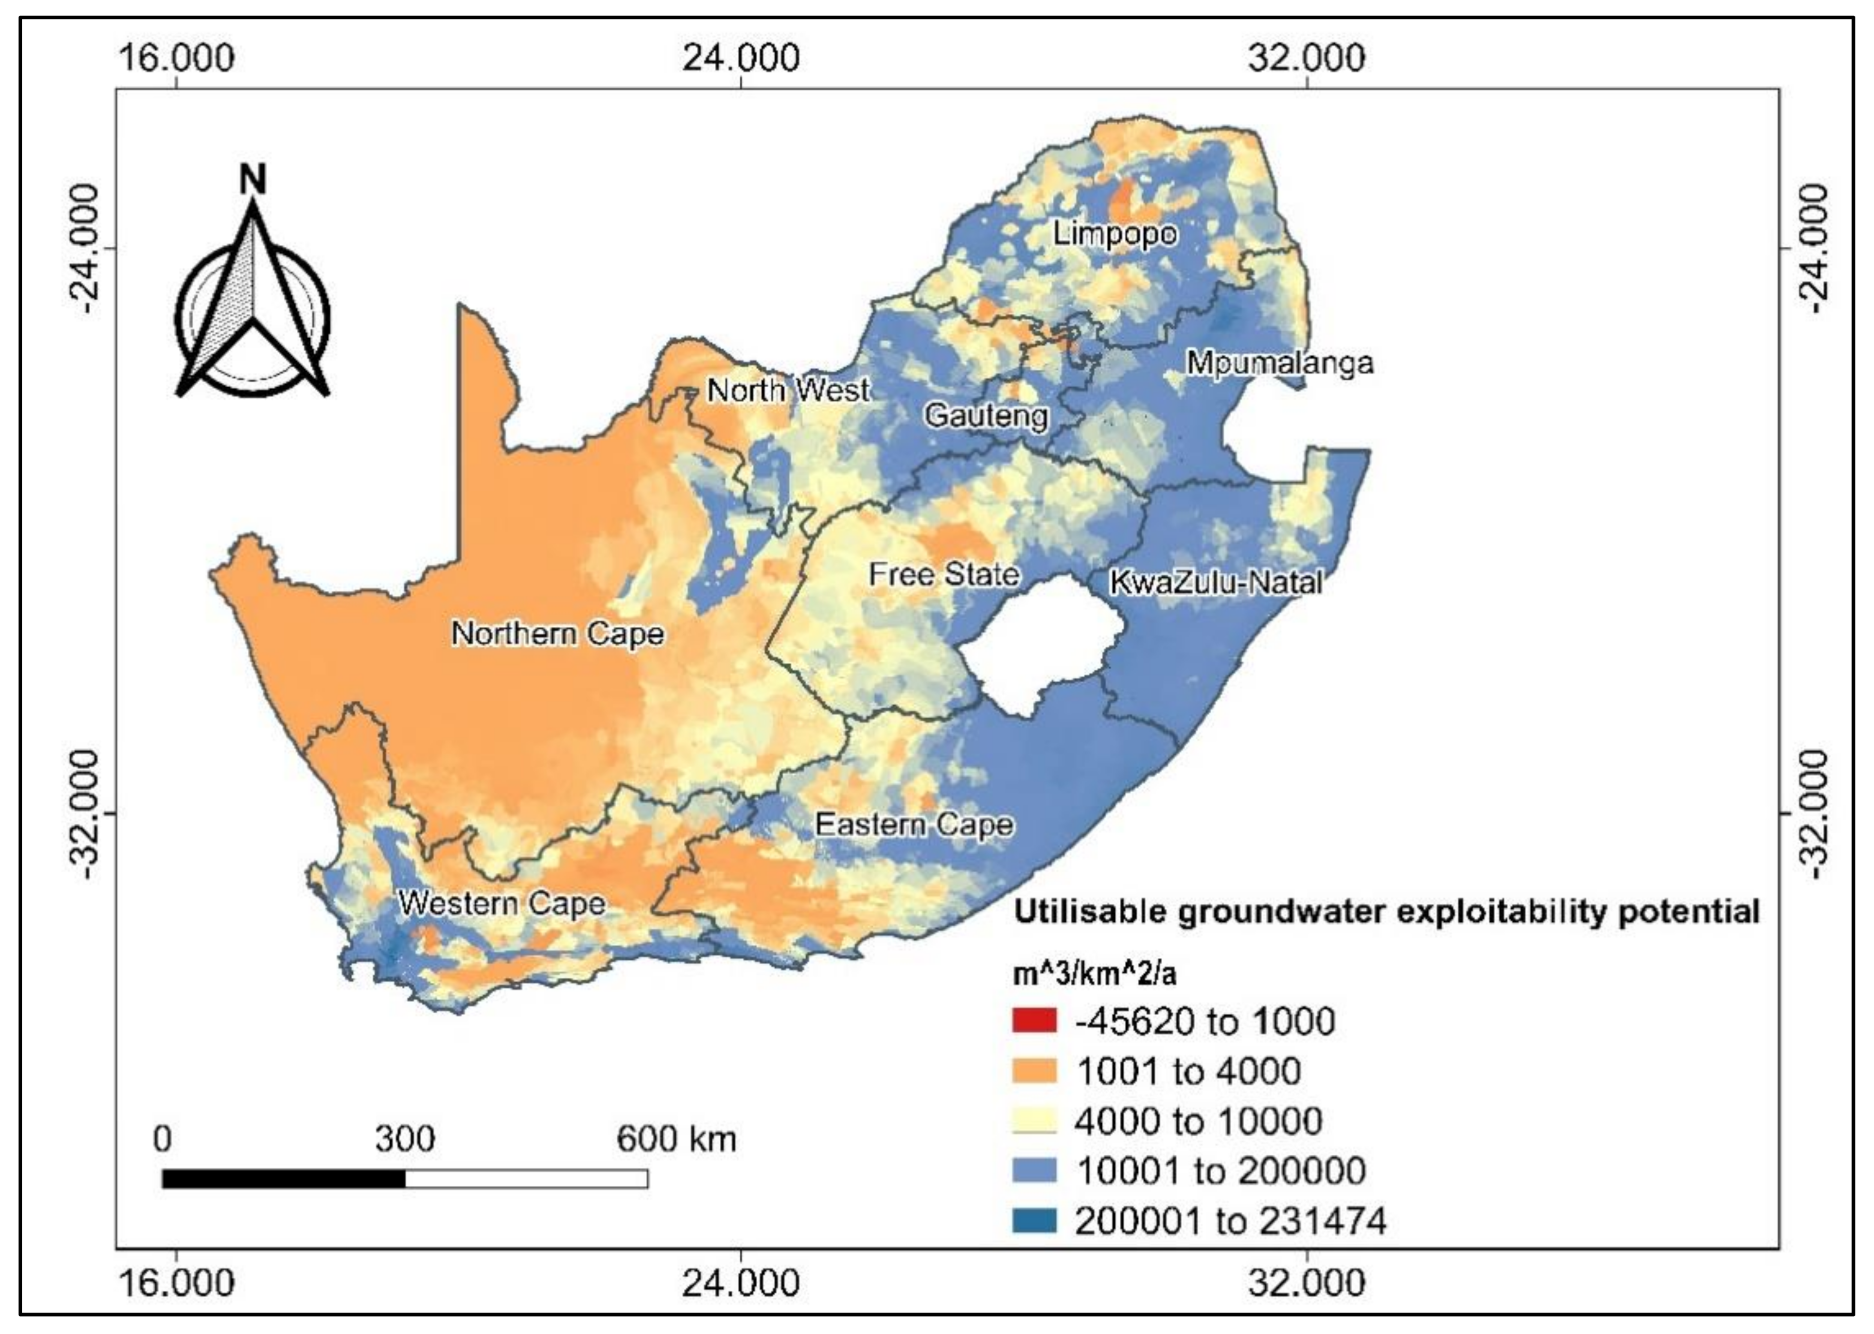
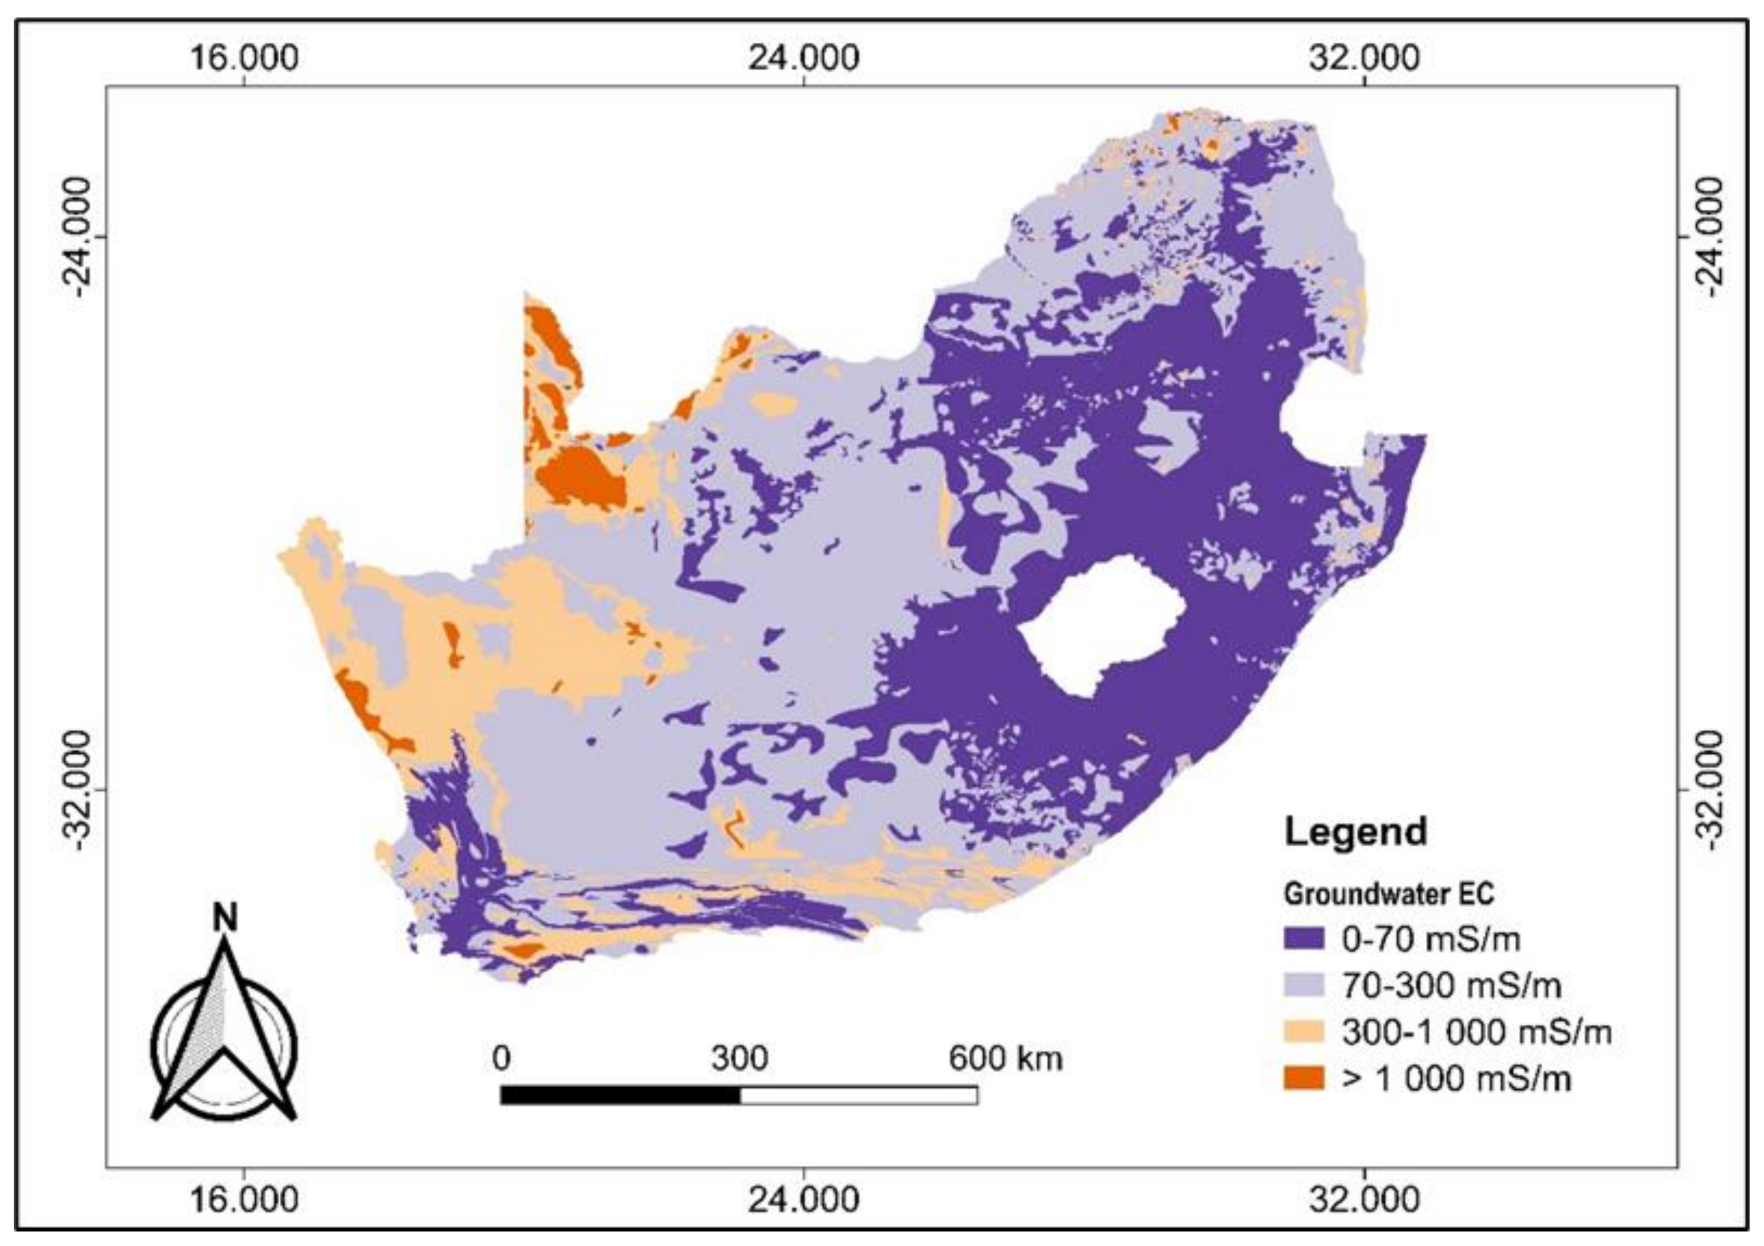
3.2.2. Groundwater Quality
4. Discussions and Suggestions
4.1. Water Quantity
4.2. Water Quality
4.3. Possible Solutions for the Major Users
4.3.1. Low-Cost Technologies
4.3.2. Amendments of Policies and Programs
4.3.3. Public Participation and Capacity Building at All Levels
5. Conclusions
Author Contributions
Funding
Institutional Review Board Statement
Informed Consent Statement
Data Availability Statement
Acknowledgments
Conflicts of Interest
Appendix A. List of the Driest Countries [98,119].

| COUNTRY | TOTAL AREA (1000 HA) | POP 2005 | POP 2017 (X 1000 INHABITATS) | PRECIPITATION (MM/YR) | TOTAL ANNUAL RENEWABLE WATER RESOURCES PER CAPITA 2005 (M3/YR) | TOTAL RENEWABLE WATER RESOURCES PER CAPITA 2017 (M3/YR) | |
|---|---|---|---|---|---|---|---|
| 1. | Kuwait | 1782 | 2595 | 4137 | 100 | 8 | 5 |
| 2. | Gaza Strip | 1376 | 300 | 41 | |||
| 3. | United Arab Emirates | 8360 | 3051 | 9400 | 100 | 49 | 16 |
| 4. | Bahamas | 1388 | 317 | 395 | 1300 | 63 | 1770 |
| 5. | Qatar | 1161 | 619 | 2639 | 100 | 86 | 22 |
| 6. | Maldives | 30 | 328 | 436 | 2000 | 91 | 69 |
| 7. | Saudi Arabia | 214,969 | 24,919 | 32,938 | 100 | 96 | 73 |
| 8. | Libyan Arab Jamahiriya | 175,954 | 5659 | 6375 | 100 | 106 | 109,8 |
| 9. | Malta | 32 | 396 | 431 | 400 | 130 | 117 |
| 10. | Singapore | 72 | 4315 | 5709 | 2500 | 139 | 105 |
| 11. | Bahrain | 78 | 739 | 1493 | 100 | 157 | 78 |
| 12. | Jordan | 8932 | 5614 | 9702 | 100 | 160 | 97 |
| 13. | Yemen | 52,797 | 20,733 | 28,250 | 200 | 198 | 74 |
| 14. | Israel | 2207 | 6560 | 8322 | 400 | 250 | 214 |
| 15. | Barbados | 43 | 271 | 286 | 2100 | 296 | 280 |
| 16. | Oman | 30,950 | 2935 | 4636 | 100 | 340 | 302 |
| 17. | Djibouti | 2320 | 712 | 957 | 200 | 420 | 314 |
| 18. | Algeria | 238,174 | 32,339 | 41,318 | 100 | 440 | 282 |
| 19. | Tunisia | 16,361 | 9937 | 11,532 | 300 | 460 | 400 |
| 20. | Saint Kitts And Nevis | 26 | 42 | 55 | 2100 | 560 | 434 |
| 21. | Rwanda | 2634 | 8481 | 12,208 | 1200 | 610 | 1089 |
| 22. | Cabo Verde | 403 | 473 | 546 | 400 | 630 | 549 |
| 23. | Antigua And Barbuda | 44 | 73 | 102 | 2400 | 710 | 510 |
| 24. | Egypt | 100,145 | 73,390 | 97,552 | 100 | 790 | 589 |
| 25. | Kenya | 58,037 | 32,420 | 49,700 | 700 | 930 | 618 |
| 26. | Burkina Faso | 27,422 | 13,393 | 19,193 | 700 | 930 | 703 |
| 27. | Morocco | 44,655 | 31,064 | 35,740 | 300 | 930 | 811 |
| 28. | Cyprus | 925 | 808 | 1180 | 500 | 970 | 661 |
| 29. | South Africa | 121,909 | 45,214 | 56,717 | 500 | 1110 | 905 |
| 30. | Denmark | 4292 | 5375 | 5734 | 700 | 1120 | 1046 |
| 31. | Lebanon | 1045 | 3708 | 6082 | 700 | 1190 | 740 |
| 32. | Czech Rep | 7887 | 10,226 | 10,618 | 700 | 1290 | 1238 |
| 33. | Somalia | 63,766 | 10,312 | 14,743 | 300 | 1380 | 997 |
| 34. | Malawi | 11,848 | 12,337 | 18,622 | 1200 | 1400 | 928 |
| 35. | Pakistan | 79,610 | 157,315 | 197,016 | 300 | 1420 | 1253 |
| 36. | Syrian Arab Rep. | 18,518 | 18,223 | 18,270 | 300 | 1440 | 920 |
| 37. | Korea, Rep. | 10,034 | 47,951 | 50,982 | 1100 | 1450 | 1367 |
| 38. | Eritrea | 11,760 | 4297 | 5069 | 400 | 1470 | 1443 |
| 39. | Comoros | 186 | 790 | 814 | 1800 | 1520 | 1474 |
| 40. | Zimbabwe | 39,076 | 12,932 | 16,530 | 700 | 1550 | 1210 |
| 41. | Poland | 31,268 | 38,551 | 38,171 | 600 | 1600 | 1585 |
| 42. | Haiti | 2775 | 8437 | 10,981 | 1400 | 1660 | 1278 |
| 43. | Ethiopia | 110,430 | 72,420 | 104,957 | 800 | 1680 | 1162 |
| 44. | Lesotho | 3036 | 1800 | 2233 | 800 | 1680 | 1353 |
| 45. | India | 328,726 | 1,081,229 | 1,339,180 | 1100 | 1750 | 1427 |
| 46. | Belgium | 3053 | 10,340 | 11,429 | 800 | 1770 | 1601 |
| 47. | Puerto Rico | 887 | 3898 | 3663 | 2100 | 1820 | 1938 |
| 48. | Germany | 35,758 | 82,526 | 82,114 | 700 | 1870 | 1875 |
| 49. | Sudan | 64,433 | 34,333 | 12,576 | 400 | 1880 | 3936 |
| 50. | Uzbekistan | 44,740 | 26,479 | 31,911 | 200 | 1900 | 1531 |
| 51. | Iran, Islamic Rep. | 174,515 | 69,788 | 81,163 | 200 | 1970 | 1688 |
| 52. | China | 960,001 | 1,320,892 | 1,441,131 | 600 | 2140 | 1971 |
| 53. | Burundi | 2783 | 7068 | 10,864 | 1200 | 2190 | 1154 |
| 54. | Mauritius | 204 | 1233 | 1265 | 2000 | 2230 | 2175 |
| 55. | Nigeria | 92,377 | 127,117 | 190,886 | 1200 | 2250 | 1499 |
| 56. | Dominican Republic | 4867 | 8872 | 10,767 | 1400 | 2370 | 2183 |
| 57. | Tanzania | 94,730 | 37,671 | 57,310 | 1100 | 2420 | 1680 |
| 58. | United Kingdom | 24,361 | 59,648 | 66,182 | 1200 | 2460 | 2221 |
| 59. | Uganda | 24,155 | 26,699 | 42,863 | 1200 | 2470 | 1402 |
| 60. | Ghana | 23,854 | 21,377 | 28,834 | 1200 | 2490 | 1949 |
| 61. | Tajikistan | 14,138 | 6,298 | 8,921 | 500 | 2540 | 2456 |
| 62. | Sri Lanka | 6561 | 19,218 | 20,877 | 1700 | 2600 | 2529 |
| 63. | Niger | 126,700 | 12,415 | 21,447 | 200 | 2710 | 1585 |
| 64. | Spain | 50,594 | 41,128 | 46,354 | 600 | 2710 | 2405 |
| 65. | Bulgaria | 11,100 | 7829 | 7085 | 600 | 2720 | 3006 |
| 66. | Moldova, Rep. | 3385 | 4263 | 4051 | 600 | 2730 | 3029 |
| 67. | Ukraine | 60,355 | 48,151 | 44,223 | 600 | 2900 | 3964 |
| 68. | Iraq | 43,505 | 25,856 | 38,275 | 200 | 2920 | 2348 |
| 69. | Togo | 5679 | 5017 | 7798 | 1200 | 2930 | 1885 |
| 70. | China, Taiwan Prov. | 22,894 | 2400 | 2930 | |||
| 71. | Trinidad And Tobago | 513 | 1307 | 1369 | 1800 | 2940 | 2805 |
| 72. | Turkey | 78,535 | 72,320 | 80,745 | 600 | 2950 | 2621 |
| 73. | Macedonia, Fr Yugoslav Rep. | 2571 | 2066 | 2083 | 600 | 3100 | 3072 |
| 74. | Italy | 30,134 | 57,346 | 59,360 | 800 | 3340 | 3223 |
| 75. | Japan | 37,797 | 127,800 | 127,484 | 1700 | 3360 | 3373 |
| 76. | France | 54,909 | 60,434 | 64,980 | 900 | 3370 | 3247 |
| 77. | Cuba | 10,988 | 11,328 | 11,485 | 1300 | 3370 | 3319 |
| 78. | Korea, Dem. People’s Rep. | 12,054 | 22,776 | 25,491 | 1400 | 3390 | 3027 |
| 79. | Armenia | 2974 | 3052 | 2930 | 600 | 3450 | 2652 |
| 80. | Jamaica | 1099 | 2676 | 2890 | 2100 | 3510 | 3744 |
| 81. | Azerbaijan | 8660 | 8447 | 9829 | 400 | 3580 | 3529 |
| 82. | Senegal | 19,671 | 10,339 | 15,851 | 700 | 3810 | 2459 |
| 83. | El Salvador | 2104 | 6614 | 6378 | 1700 | 3810 | 4119 |
| 84. | Benin | 11,476 | 6918 | 11,176 | 1000 | 3820 | 2361 |
| 85. | Mauritania | 103,070 | 2980 | 4420 | 100 | 3830 | 2579 |
| 86. | Kyrgyzstan | 19,995 | 5208 | 6045 | 400 | 3950 | 3907 |
| 87. | Eswatini | 1736 | 1083 | 1367 | 800 | 4160 | 3299 |
| 88. | Mexico | 196,438 | 104,931 | 129,163 | 800 | 4360 | 3576 |
| 89. | Côte D’lvoire | 32,246 | 16,897 | 24,295 | 1300 | 4790 | 3463 |
| 90. | Chad | 128,400 | 8854 | 14,900 | 300 | 4860 | 3067 |
| 91. | Turkmenistan | 48,810 | 4940 | 5758 | 200 | 5000 | 4302 |
| 92. | Gambia | 1130 | 1462 | 2101 | 800 | 5470 | 3808 |
| 93. | Netherlands | 4154 | 16,227 | 17,036 | 800 | 5610 | 5342 |
| 94. | Philippines | 30,000 | 81,408 | 104,918 | 2300 | 5880 | 4565 |
| 95. | Belarus | 20,760 | 9852 | 9468 | 600 | 5890 | 6115 |
| 96. | Thailand | 51,312 | 63,465 | 69,038 | 1600 | 6460 | 6353 |
| 97. | Reunion | 767 | 2100 | 6520 | |||
| 98. | Luxemburg | 259 | 459 | 584 | 900 | 6750 | 5998 |
| 99. | Greece | 13,196 | 10,977 | 11,160 | 700 | 6760 | 6129 |
| 100. | Botswana | 58,173 | 1795 | 2292 | 400 | 6820 | 5340 |
| 101. | Portugal | 9223 | 10,072 | 10,330 | 900 | 6820 | 7493 |
| 102. | Kazakhstan | 272,490 | 15,403 | 18,204 | 200 | 7120 | 5955 |
| 103. | Lithuania | 6529 | 3422 | 2890 | 700 | 7280 | 8478 |
| 104. | Mali | 124,019 | 13,409 | 18,542 | 300 | 7460 | 6472 |
| 105. | Switzerland | 4129 | 7164 | 8476 | 1500 | 7470 | 6312 |
| 106. | Bangladesh | 14,763 | 149,664 | 164,670 | 2700 | 8090 | 7451 |
| 107. | Nepal | 14,718 | 25,725 | 29,305 | 1300 | 8170 | 7173 |
| 108. | Guatemala | 10,889 | 12,661 | 16,914 | 2700 | 8790 | 7562 |
| 109. | Namibia | 82,429 | 2011 | 2534 | 300 | 8810 | 15,750 |
| 110. | Bosnia And Herzegoniva | 5121 | 4186 | 3507 | 1000 | 8960 | 10,693 |
| 111. | Slovakia | 4903 | 5407 | 5448 | 800 | 9270 | 9196 |
| 112. | Romania | 2384 | 22,280 | 19,679 | 600 | 9510 | 10,773 |
| 113. | Austria | 8388 | 8120 | 8735 | 1100 | 9570 | 8895 |
| 114. | Zambia | 75,261 | 10,924 | 17,094 | 1000 | 9630 | 6131 |
| 115. | Estonia | 4534 | 1308 | 1310 | 600 | 9790 | 9779 |
| 116. | United State Of America | 983,151 | 297,043 | 324,459 | 700 | 10,270 | 9459 |
| 117. | Angola | 124,670 | 14,078 | 29,784 | 1000 | 10,510 | 4983 |
| 118. | Hungary | 9303 | 9831 | 9722 | 600 | 10,580 | 10,697 |
| 119. | Viet Nam | 33,123 | 82,481 | 95,541 | 1800 | 10,810 | 9254 |
| 120. | Mozambique | 78,638 | 19,182 | 29,669 | 1000 | 11,320 | 7317 |
| 121. | Georgia | 6970 | 5074 | 3912 | 1000 | 12,480 | 16,189 |
| 122. | Indonesia | 191,358 | 222,611 | 263,991 | 2700 | 12,750 | 7648 |
| 123. | Ireland | 7028 | 3999 | 4762 | 1100 | 13,000 | 10,920 |
| 124. | Albania | 2875 | 3194 | 2930 | 1000 | 13,060 | 10,307 |
| 125. | Sao Tome And Principe | 96 | 165 | 204 | 2200 | 13,210 | 10,671 |
| 126. | Mongolia | 156,412 | 2630 | 3076 | 200 | 13,230 | 11,313 |
| 127. | Honduras | 11,249 | 7099 | 9265 | 2000 | 13,510 | 9947 |
| 128. | Latvia | 6449 | 2286 | 1950 | 600 | 15,510 | 17,918 |
| 129. | Slovenia | 2068 | 1982 | 2080 | 1200 | 16,080 | 15,322 |
| 130. | Cameroon | 47,544 | 16,296 | 24,054 | 1600 | 17,520 | 11,769 |
| 131. | Madagascar | 58,730 | 17,901 | 25,571 | 1500 | 18,830 | 13,179 |
| 132. | Sweden | 44,743 | 8886 | 9911 | 600 | 19,580 | 17,556 |
| 133. | Serbia And Monteneng | 8836 | 10,519 | 8791 | 19,820 | 18,451 | |
| 134. | Guinea-Bissau | 3613 | 1538 | 1861 | 1600 | 20,160 | 16,873 |
| 135. | Myanmar | 67,659 | 50,101 | 53,371 | 2100 | 20,870 | 21,885 |
| 136. | Argentina | 278,040 | 38,871 | 44,271 | 600 | 20,940 | 19,792 |
| 137. | Finland | 33,845 | 5215 | 5523 | 500 | 21,090 | 19,917 |
| 138. | Brunei Darussala | 577 | 366 | 429 | 2700 | 23,220 | 19,827 |
| 139. | Malaysia | 33,034 | 24,876 | 31,624 | 2900 | 23,320 | 18,341 |
| 140. | Congo, Dem Rep. | 234,486 | 54,417 | 81,340 | 1500 | 23,580 | 3027 |
| 141. | Croatia | 5659 | 4416 | 4189 | 1100 | 23,890 | 25,185 |
| 142. | Australia | 774,122 | 19,913 | 24,450 | 500 | 24,710 | 20,123 |
| 143. | Guinea | 24,586 | 8620 | 12,717 | 1700 | 26,220 | 17,771 |
| 144. | Costa Rica | 5110 | 4250 | 4906 | 2900 | 26,450 | 23,033 |
| 145. | Sierra Leone | 7230 | 5168 | 7557 | 2500 | 30,960 | 21,172 |
| 146. | Russian Federation | 1,709,825 | 142,397 | 143,990 | 500 | 31,650 | 31,426 |
| 147. | Ecuador | 25,637 | 13,192 | 16,625 | 2100 | 32,170 | 26,611 |
| 148. | Cambodia | 18,104 | 14,482 | 16,005 | 1900 | 32,880 | 29,747 |
| 149. | Fiji | 1827 | 847 | 906 | 2600 | 33,710 | 31,530 |
| 150. | Nicaragua | 13,037 | 5597 | 6218 | 2400 | 35,140 | 26,455 |
| 151. | Central Africa Rep. | 62,298 | 3912 | 4659 | 1300 | 36,910 | 30,264 |
| 152. | Uruguay | 17,622 | 3439 | 3457 | 1300 | 40,420 | 49,812 |
| 153. | Bhutan | 3839 | 2325 | 808 | 1700 | 40,860 | 96,582 |
| 154. | Brazil | 851,577 | 180,654 | 209,288 | 1800 | 45,570 | 41,316 |
| 155. | Panama | 7542 | 3177 | 4099 | 2700 | 46,580 | 33,984 |
| 156. | Venezuela, | 91,205 | 26,170 | 31,977 | 1900 | 47,120 | 41,436 |
| 157. | Colombia | 114,175 | 44,914 | 49,066 | 2600 | 47,470 | 48,098 |
| 158. | Equatorial Guinea | 2805 | 507 | 1268 | 2200 | 51,280 | 20,505 |
| 159. | Paraguay | 40,675 | 6018 | 6811 | 1100 | 55,830 | 1835 |
| 160. | Lao Peoples Dem. Rep. | 23,680 | 5787 | 6858 | 1800 | 57,640 | 48,629 |
| 161. | Chile | 75,670 | 15,996 | 18,055 | 700 | 57,640 | 51,127 |
| 162. | Liberia | 11,137 | 3487 | 4732 | 2400 | 66,530 | 49,028 |
| 163. | Bolivia | 109,858 | 8973 | 11,052 | 1100 | 69,380 | 51,936 |
| 164. | Peru | 128,522 | 27,567 | 32,165 | 1500 | 69,390 | 58,449 |
| 165. | Belize | 2297 | 261 | 375 | 2200 | 71,090 | 57,993 |
| 166. | New Zealand | 26,771 | 3904 | 4706 | 1700 | 83,760 | 69,486 |
| 167. | Norway | 62,522 | 4552 | 5305 | 1100 | 83,920 | 74,081 |
| 168. | Solomon Islands | 2890 | 491 | 611 | 3000 | 91,040 | 73,123 |
| 169. | Canada | 998,467 | 31,744 | 36,624 | 500 | 91,420 | 79,238 |
| 170. | Gabon | 26,767 | 1351 | 2025 | 1800 | 121,390 | 81,975 |
| 171. | Papua New Guinea | 46,284 | 5836 | 8251 | 3100 | 137,250 | 97,079 |
| 172. | Congo | 34,200 | 3818 | 5261 | 1600 | 217,920 | 158,145 |
| 173. | Suriname | 16,382 | 439 | 563 | 2300 | 277,900 | 175,719 |
| 174. | Guyana | 21,497 | 767 | 778 | 2400 | 314,210 | 348,374 |
| 175. | Iceland | 10,300 | 292 | 335 | 1000 | 582,190 | 507,463 |
| 176. | French Guiana | 182 | 2900 | 736,260 | |||
| 177. | Greenland | 57 | 600 | 10,578,950 | |||
| 178. | Saint Vincent | 39 | 121 | 110 | 1600 | 910 | |
| 179. | Saint Lucia | 62 | 150 | 179 | 2300 | 1678 | |
| 180. | Grenada | 34 | 80 | 108 | 1500 | 1855 | |
| 181. | Dominica | 75 | 79 | 74 | 3400 | 2706 | |
| 182. | Aruba | 101 | |||||
| 183. | Bermuda | 82 | 1500 | ||||
| 184. | French Polynesia | 248 | |||||
| 185. | Guadeloupe | 443 | 200 | ||||
| 186. | Martinique | 395 | 2600 | ||||
| 187. | New Caledonia | 233 | 1500 | ||||
| 188. | Saint Helena | 5 | 800 | ||||
| 189. | Samoa | 284 | 180 | 196 | 3000 | ||
| 190. | Seychelles | 46 | 82 | 95 | 2000 | ||
| 191. | Tonga | 75 | 105 | 108 | 2000 | ||
| 192. | West Bank | 2386 | 1 | ||||
Appendix B. The Geographical Location Covered by the Publications.
| Author | Landuse | Aspect | Impact | Location |
|---|---|---|---|---|
| Dabrowski et al. [6] | Agricultural activities, WWTP, industries, mining, river damming | Surface Water quality and quality | Excess nutrients and E coli. load, eutrophication, sedimentation, reduced streamflow, destruction of riparian zone | Upper Umngeni River Catchment (KZN) and Upper Olifant River (Mpumalanga) |
| Soko and Gyedu-Ababio [5] | Industrial effluent, Sewage discharge, Farming, domestic runoff | Surface Water Quality | Increased nutrients, high concentration of Chloride, high salinity and TDS | Crocodile River Catchment, Mpumalanga |
| Gyamfi et al. [10] | Urban and agriculture expansion | Water quantity | Increased evapotranspiration, Increased runoff | Olifant River Basin |
| Mukheibir and Sparks [29] | Water resource management | Water quantity | Driving forces for water future | South Africa |
| Stevens and van Koppen [30] | Mining, Agriculture, urbanisation | Surface and groundwater Water quality and quantity | AMD, Abstraction, reduced infiltration, increased runoff | South Africa |
| Muller et al. [32] | Urbanisation, agriculture, industrial use and Mining | Water quality | Water pollution | South Africa |
| Hornby et al. [33] | Drought and Water demand from different water sectors | Water quantity | Decreased dam storages, streamflow and groundwater storage | Msinga, KwaZulu-Natal |
| Schulze [35] | Forestry, Industrial and mining, Agriculture, invasive alien plants, urban expansion | Water quantity and water quality | Enhanced deep percolation, runoff losses, sewage and industrial effluent, sedimentation | South Africa |
| Nel and Driver [37] | Agricultural and mining expansion | Water quantity | Modification of river length | South Africa |
| Oberholster and Ashton [43] | Spray irrigation practices, Sewage effluent | Surface Water quality | Eutrophication | South Africa |
| McCarthy [40] | Mining | Water quality | AMD | South Africa with special focus on Olifants and Vaal River Catchments |
| DEAT [41] | Urbanisation, irrigation, industries, WWTP | Surface and groundwater quality and water quantity | Over-abstraction, changes in timing of flow, low flows, chemical waste, excessive nutrients, increased salinity | South Africa |
| Namugizea et al. [47] | Built-up areas, Cultivated areas | Surface water quality | Increased concentration of nutrients, increased sediment-related variables | Umngeni River Catchment |
| Albhaisi et al. [66] | Forest plantation | Groundwater quantity | Decrease in groundwater recharge, | Berg Catchment, Western Cape |
| Driver et al. [90] | Land use | Water quality | River health | South Africa |
| Saraiva Okello et al. [103] | Forestry, irrigated agriculture, urbanisation | Surface water quantity | Changes in streamflow | Inkomati River Catchmnet |
| Hobbs et al. [62] | Groundwater quality | Crocodile River Catchment | ||
| Parsons [63] | Invasive plants | Groundwater resources | Reduced flow | South Africa |
| Basson and Rossouw [65] | Urban use, industrial, mining | Water quality and water quantity | Reduced return flow, water pollution | Crocodile River Catchment west |
| Schulze et al. [67] | Groundwater quantity | Groundwater recharge | South Africa | |
| van Dijk and van Vuuren [68] | Dam construction | Water quantity | Evaporation loss | South Africa |
| Schulze et al. [69] | Water quantity | Climate | South Africa | |
| Jovanovic et al. [70] | Land use | Water quantity | Evapotranspiration | South Africa |
| Van Der Laan et al. [73] | Sugarcane | Water quality | EC, pH, Inorganic matter, Phosphate | South Africa |
| Mema [76] | WWTP | Water quality | Sewage discharge | South Africa |
| DWS [75] | WWTP and agriculture | Water quality and Water quantity | Microbial contamination | South Africa |
| Edokpayi et al. [77] | WWTP | Water quality | Sewage effluent | Limpopo Province |
| Ground-Truth [78] | Water quality | State of Rivers | KwaZulu Natal | |
| VDM [80] | WTTP | Sewage discharge | Limpopo Province | |
| DWA [64] | WWTP | Water quantity and water quality | Sewage discharge | Mpumalanga |
| Hart et al. [81] | Agricultural activities | Water quality | Phosphorus | |
| Dabrowski and de Klerk [83] | WWTW and mining activities | Water quality | Sewage effluent, Excessive nutrients, High concentration of ortho-phosphate, nitrogen, TDS, AMD | Upper Olifant River Catchments |
| Graham and Matthew [86] | Pit Latrines | Groundwater Quality | High levels of contaminates | Global |
| Holland [87] | Pit latrines | Groundwater quality | Contamination | Limpopo Province |
| Mbombela SoER [88] | Agricultural and industrial activities, pit toilets, soild waste dumping | Surface and groundwater quality | Sewage effluent, organic pollution, sedimentation, invasive alien plants | Mpumalanga |
| Vinger et al. [89] | Pit laterine | Groundwater quality | High levels of fluoride | South Africa |
| Odiyo and Makungo [91] | Groundwater Quality | High levels of Flouride | Siloam, Limpopo | |
| Odiyo and Makungo [92] | Groundwater quality | High concentrations of fluoride and nitrates, microbial concentrations from Pit latrines | Siloam, Limpopo |
References
- Cosgrove, W.J.; Loucks, D.P. Water management: Current and future challenges and research directions. Water Resour. Res. 2015, 51, 4823–4839. [Google Scholar] [CrossRef] [Green Version]
- Wu, P.; Tan, M. Challenges for sustainable urbanization: A case study of water shortage and water environment changes in Shandong, China. Procedia Environ. Sci. 2012, 13, 919–927. [Google Scholar] [CrossRef] [Green Version]
- Kumar, N.; Tischbein, B.; Kusche, J.; Beg, M.K.; Bogardi, J.J. Impacts of land-use change on the water resources of the Upper Kharun Catchment, Chhattisgarh, India. Reg. Environ. Chang. 2017, 17, 2373–2385. [Google Scholar] [CrossRef]
- Sauka, S. Flood Risk Assessment of the Crocodile River, Mpumalanga. Master’s Dissertation, University of Witwatersrand, Johannesburg, South Africa, 2016. [Google Scholar]
- Soko, M.I.; Gyedu-Ababio, T. The Spatial and Temporal Variations of Ichythyofauna and Water Quality in the Crocodile River (East), Mpumalanga, South Africa. J. Water Resour. Prot. 2015, 7, 152–170. [Google Scholar] [CrossRef] [Green Version]
- Dabrowski, J.; Bruton, S.; Dent, M.; Graham, M.; Hill, T.; Murray, K.; Rivers-Moore, N.; van Deventer, H. Linking Land Use to Water Quality for Effective Water Resource and Ecosystem Management; WRC Report No.1984/1/13; Water Research Commission: Pretoria, South Africa, 2013. [Google Scholar]
- Teixeira, Z.; Teixeira, H.; Marques, J.C. Systematic processes of land use/land cover change to identify relevant driving forces: Implications on water quality. Sci. Total Environ. 2014, 470–471, 1320–1335. [Google Scholar] [CrossRef] [PubMed] [Green Version]
- Miserendino, M.L.; Casaux, R.; Archangelsky, M.; Di Prinzio, C.Y.; Brand, C.; Kutschker, A.M. Assessing land-use effects on water quality, in-stream habitat, riparian ecosystems and biodiversity in Patagonian northwest streams. Sci. Total Environ. 2011, 409, 612–624. [Google Scholar] [CrossRef]
- Yu, D.; Shi, P.; Liu, Y.; Xun, B. Detecting land use-water quality relationships from the viewpoint of ecological restoration in an urban area. Ecol. Eng. 2013, 53, 205–216. [Google Scholar] [CrossRef]
- Gyamfi, C.; Ndambuki, J.M.; Salim, R.W. Hydrological Responses to Land Use/Cover Changes in the Olifants Basin, South Africa. Water 2016, 8, 588. [Google Scholar] [CrossRef]
- Guzha, A.C.; Rufinoa, M.C.; Okothb, S.; Jacobsa, S.; Nóbregae, R.L.B. Impacts of land use and land cover change on surface runoff, discharge and low flows: Evidence from East Africa. J. Hydrol. Reg Stud. 2018, 15, 49–67. [Google Scholar] [CrossRef]
- du Plessis, A.; Harmse, T.; Ahmed, F. Quantifying and predicting the water quality associated with land cover change: A case study of the Blesbok Spruit Catchment, South Africa. Water 2014, 6, 2946–2968. [Google Scholar] [CrossRef] [Green Version]
- Kibena, J.; Nhapi, I.; Gumindoga, W. Assessing the relationship between water quality parameters and changes in landuse patterns in the Upper Manyame River, Zimbabwe. Phys. Chem. Earth 2014, 67–69, 153–163. [Google Scholar] [CrossRef]
- Welde, K.; Gebremariam, B. Effect of land use land cover dynamics on hydrological response of watershed: Case study of Tekeze Dam watershed, northern Ethiopia. ISWCR 2017, 5, 1–16. [Google Scholar] [CrossRef]
- Issaka, S.; Ashraf, M.A. Impact of soil erosion and degradation on water quality: A review. Geol. Ecol. Landsc. 2017, 1, 1–11. [Google Scholar] [CrossRef] [Green Version]
- Ashton, P.J.; Hardwick, D.; Breen, C.M. Changes in Water Availability and Demand within South Africa’s Shared River Basins as Determinants of Regional Social-Ecological Resilience. In Exploring Sustainability Science: A Southern African Perspective; Burns, M.J., Weaver, A., Eds.; Stellenbosch University Press: Stellenbosch, South Africa, 2008; pp. 279–310. [Google Scholar]
- Gibson, D.J.D. Land degradation in the Limpopo Province, South Africa. Master’s Dissertation, University of the Witwatersrand, Johannesburg, South Africa, 2006. [Google Scholar]
- Calder, I.R.; Aylward, B. Forest and floods: Moving to an Evidence-based Approach to Watershed and Integrated Flood Management. Water Int. 2006, 31, 87–99. [Google Scholar] [CrossRef]
- Cui, X.; Graf, H.; Langmann, B.; Chen, W.; Huang, R. Hydrological Impacts on the South Coast Tibetan Plateau. Earth Interacts 2007, 11. Available online: http://earthinteractions.org (accessed on 13 March 2020).
- Zhou, F.; Xu, Y.; Chen, Y.; Xu, C.-Y.; Gao, Y.; Du, J. Hydrological response to urbanization at different spatio-temporal scales simulated by coupling of CLUE-S and the SWAT model in the Yangtze River Delta region. J. Hydrol. 2013, 485, 113–125. [Google Scholar] [CrossRef]
- Baker, T.J.; Miller, S.N. Using the Soil and Water Assessment Tool (SWAT) to assess land use impact on water resources in an East African watershed. J. Hydrol. 2013, 486, 100–111. [Google Scholar] [CrossRef]
- Chaves, J.; Neill, C.; Germer, S.; Neto, S.G.; Krusche, A.; Elsenbeer, H. Land management impact on runoff sources in small Amazon watersheds. Hydrol. Process 2008, 22, 1766–1775. [Google Scholar] [CrossRef]
- Department of Environmental Affairs (DEA). 2nd South Africa Environment Outlook. A Report on the State of the Environment; Department of Environmental Affairs: Pretoria, South Africa, 2016. [Google Scholar]
- WWF-SA. Water: Facts & Futures; WWF-SA: Cape Town, South Africa, 2016. [Google Scholar]
- Masindi, V.; Duncker, L. State of Water and Sanitation in South Africa. In CSIR Built Environment 2016; CSIR: New Delhi, India. [CrossRef]
- Edokpayi, J.N.; Odiyo, J.O.; Durowoju, O.S. Impacts of wastewater on surface water quality in developing countries: A case study of South Africa. In Water Quality; Tutu, H., Ed.; InTechOpen: London, UK, 2017; pp. 401–416. [Google Scholar] [CrossRef] [Green Version]
- Makungo, R.; Odiyo, J.O. Estimating groundwater levels using system identification models in Nzhelele and Luvuvhu areas, Limpopo Province, South Africa. Phys. Chem. Earth 2017. [Google Scholar] [CrossRef]
- Molobela, I.P.; Sinha, P. Management of water resources in South Africa: A review. Afr. J. Environ. Sci. Tech. 2011, 5, 993–1002. [Google Scholar] [CrossRef]
- Mukheibir, P.; Sparks, D. Water Resource Management and Climate Change in South Africa: Visions, Driving Factors and Sustainable Development Indicators; Report for Phase I of the Sustainable Development and Climate Change project; Energy and Development Research Centre, University of Cape Town: Cape Town, South Africa, 2003. [Google Scholar]
- Stevens, J.; van Koppen, B. Trends and Outlook: Agricultural Water Management in Southern Africa: Country Report South Africa; USAID: Southern Africa, 2015. [Google Scholar]
- Rodda, S.N.; Stenström, T.A.; Schmidt, S.; Dent, M.; Bux, F.; Hanke, N.; Buckley, C.A.; Fennemore, C. Water security in South Africa: Perceptions on public expectations and municipal obligations, governance and water re-use. Water SA 2016, 42, 456. [Google Scholar] [CrossRef] [Green Version]
- Muller, M.; Schreiner, B.; Smith, L.; van Koppen, B.; Sally, H.; Aliber, M.; Cousins, B.; Tapela, B.; van der Merwe-Botha, M.; Karar, E.; et al. Water security in South Africa. Development Planning Division; Working Paper Series No. 12; DBSA: Midrand, South Africa, 2009. [Google Scholar]
- Hornby, D.; Vanderhaeghen, Y.; Versfeld, D.; Ngubane, M. A Harvest of Dysfunction: Rethinking the Approach to Drought, its Causes and Impacts in South Africa; Report for Oxfam South Africa; Oxfam South Africa: Johannesburg, South Africa, 2016. [Google Scholar]
- Mukheibir, P. The Impact of Climate Change on Small Municipal Water Resource Management: The Case of Bredasdorp SA; Energy Research Centre, UCT: Cape Town, South Africa, 2007. [Google Scholar]
- Schulze, R.E. Water Resources and Hydrological Challenges in South Africa within a Climate Change Context. In A 2011 Perspective on Climate Change and the South African Water Sector; Schulze, R.E., Ed.; RSA, WRC Report TT 518/12; Water Research Commission: Pretoria, South Africa, 2007; pp. 127–138. [Google Scholar]
- Kahinda, J.M.; Boroto, J.R. IWRM SURVEY AND STATUS REPORT: South Africa; Global Water Partnership: Pretoria, South Africa, 2009. [Google Scholar]
- Nel, J.L.; Driver, A. National River Ecosystem Accounts for South Africa. Discussion document for Advancing SEEA Experimental Ecosystem Accounting Project; South African National Biodiversity Institute: Pretoria, South Africa, 2015. [Google Scholar]
- Maps of world. Rivers of South Africa. 2013. Available online: http://www.mapspfworld.com/amp/south-africa/river-map.html (accessed on 14 March 2020).
- Oberholster, P.J.; Ashton, P.J. An Overview of the Current Status of Water Quality and Eutrophication in South African Rivers and Reservoirs, State of the Nation Report. Parliamentary Grant Deliverable: Pretoria, South Africa, 2008. [Google Scholar]
- McCarthy, T.S. The impact of acid mine drainage in South Africa. S. Afr. J. Sci. 2011, 107, 7. [Google Scholar] [CrossRef]
- Department of Environmental Affairs and Tourism (DEAT). South Africa Environment Outlook. Chapter 3, Inland water. In A Report on the State of the Environment; Department of Environmental Affairs and Tourism: Pretoria, South Africa, 2016. [Google Scholar]
- Middleton, B.J.; Bailey, A.K. Water Resources of South Africa, 2005 Study (WR2005); WRC Report No TT380/08; Water Research Commission: Pretoria, South Africa, 2009. [Google Scholar]
- Department of Water Affairs and Forestry (DWAF). Olifants River Water Resources Development Project. Department of Water Affairs and Forestry: Pretoria, South Africa, 2004. Available online: http://www.dwaf.gov.za/Projects/olifant (accessed on 11 March 2020).
- Berjak, L. Water Resource Management in South Africa. Master’s Dissertation, University of Natal, Pietermaritzburg, South Africa, 2003. [Google Scholar]
- Department of Water Affairs (DWA). National Water Resource Strategy, 2nd ed.; DWA: Pretoria, South Africa, 2013. [Google Scholar]
- DWA. Groundwater Strategy. Water Resources Planning Systems. Department of Water Affairs: Pretoria, South Africa, 2010. [Google Scholar]
- Namugizea, J.N.; Jewitta, G.; Graham, M. Effects of land use and land cover changes on water quality in the uMngeni river catchment, South Africa. Phys. Chem. Earth 2018. [Google Scholar] [CrossRef]
- Herrfahrdt-Pahle, E. South African water governance between administrative and hydrological boundaries. Clima. Dev. 2010, 2, 111–127. [Google Scholar] [CrossRef]
- DWAF. National Water Resource Strategy, 1st ed.; DWAF: Pretoria, South Africa, 2004. [Google Scholar]
- Department of Water Affairs and Forestry (DWAF). Resource Directed Management of Water Quality: Introduction, 2nd ed.; Water Resource Planning Systems Series, Sub-Series No. WQP 1.7.6. DWAF: Pretoria, South Africa, 2006; ISBN 0-621-36786-9. [Google Scholar]
- DWAF. White Paper on National Water Policy for South Africa; DWAF: Pretoria, South Africa, 1997. [Google Scholar]
- Food and Agriculture Organisation (FAO). Global Forest Resources Assessment; FAO forestry paper 147; FAO: Rome, Italy, 2005; p. 17. [Google Scholar]
- Pretorius, D.J. Mapping Land Use Systems at National Scale for Land Degradation Assessment Analysis in South Africa. In support of the soil protection programme. Department of Agriculture: South Africa, 2009. [Google Scholar]
- Ngcofe, L.; Hickson, R.; Singh, P. The South African land cover change detection derived from 2013_2014 and 2017_2018 land cover products. SAJG 2019, 8, 160–177. [Google Scholar] [CrossRef]
- DEA. 1990 South African National Land-Cover legend, DEA/CARDNO SCPF002: Implementation of Land Use Maps for South Africa. DEA: Pretoria, South Africa, 2015. [Google Scholar]
- Charlton, S. The State of Land Use Management in South Africa. Land Use Management and the Second Economy, 2nd economy Strategy; Urban Landmark: Muldersdrift, South Africa, 2008. [Google Scholar]
- Nel, V. Can the South African Land Use Management System be an effective tool in Creating Low(er) Carbon cities? 45th ISOCARP Congress; 2009. [Google Scholar]
- Bollens, S.A. Urban Planning and intergroup conflict: Confronting a fractured public interest. In Dialogues in Urban and Regional Planning, Global Planning Educational Association Network; Stiftel, B., Watson, V., Eds.; Routldege: London, UK and New York, NY, USA, 2005; pp. 209–246. [Google Scholar]
- Ovens, W.; Kitchin, F.; Parnell, S.; Williams, A. Land Management and Democratic Governance in Johannesburg: Overview Report; Commissioned by Urban Landmark, PlanAct and CUBES, with Ford Foundation Fundingm; PlanAct: Braamfontein, South Africa, 2007. [Google Scholar]
- Feil, A.D.; Schreiber, D.; Haetinger, C.; Strasburg, V.J.; Barkert, C.L. Sustainability Indicators for Industrial Organizations: Systematic Review of Literature. Sustainability 2019, 11, 854. [Google Scholar] [CrossRef] [Green Version]
- Nowell, L.S.; Norris, J.M.; White, D.E.; Moules, N.J. Thematic Analysis: Striving to meet the Trustworthiness Criteria. Int. J. Qual. Methods. 2017. [Google Scholar] [CrossRef]
- Hobbs, P.J.; Hodgson, F.D.I.; van Tonder, G.J.; Muller, J.L. Evaluation of the Crocodile River Stream Aquifer Data by Finite Element Simulation; WRC Report No. 113/3/87; Department of Water Affairs: Pretoria, South Africa, 1985. [Google Scholar]
- Parsons, R. Surface Water—Groundwater Interaction in a Southern African Context; Report No. TT 218/03; Water Research Commission: Pretoria, South Africa, 2004. [Google Scholar]
- DWA. Water Requirements and Availability Reconciliation Strategy for the Mbombela Municipal Area. Current and Future Water Requirements and Water Resources, Final, 2014; PWMA 05/x22/00/2012/3; DWA: Pretoria, South Africa, 2014; Available online: http://www.dwa.gov.za/Projects/WRAR/Documents/Mbombela%20Reconciliation%20Strategy%20%20FINAL%20signed.pdf (accessed on 12 June 2019).
- Basson, M.S.; Rossouw, J.D. Crocodile (West) River Reconciliation Strategy: Version 1. The development of a reconciliation Strategy for the Crocodile (West) Water Supply System; Report: P WMA 03/000/00/3608; DWA: Pretoria, South Africa, 2008. [Google Scholar]
- Albhaisi, M.; Brendonck, L.; Batelaan, O. Predicted impacts of land use change on groundwater recharge of the upper Berg catchment, South Africa. Water SA 2013, 39, 2. [Google Scholar] [CrossRef] [Green Version]
- Schulze, R.E.; Kunz, R.P.; Bulcock, L.M. Climate Change, Recharge into the Groundwater Store and Baseflow: A 2011 Perspective. In A 2011 Perspective on Climate Change and the South African Water Sector; WRC Report TT 518/12; Schulze, R.E., Ed.; Water Research Commission: Pretoria, South Africa, 2011; Chapter 5.3; pp. 145–151. [Google Scholar]
- van Dijk, M.; van Vuuren, S.J. Destratification induced by bubble plumes as a means to reduce evaporation from open impoundments. Water SA 2008, 35, 2. [Google Scholar] [CrossRef] [Green Version]
- Schulze, R.E.; Maharaj, M.; Warburton, M.L.; Gers, C.J.; Horan, M.J.C.; Kunz, R.P.; Clark, D.J. South African Atlas of Climatology and Agrohydrology; WRC Report No 1489/1/08, 2008; Water Research Commission: Pretoria, South Africa, 2008. [Google Scholar]
- Jovanovic, N.; Mu, Q.; Bugan, R.D.H.; Zhao, M. Dynamics of MODIS evapotranspiration in South Africa. Water SA 2015, 41. [Google Scholar] [CrossRef] [Green Version]
- DWAF. Berg River Baseline Monitoring Programme. Final Report—Volume 1: Introduction to the Berg River Catchment; Groundwater and Hydrology; Ractliffe, G., Ed.; DWAF: Pretoria, South Africa, 2007. [Google Scholar]
- Water Research Commission (WRC). Water Resources of South Africa 2012 Study; Water Research Commission: Pretoria, South Africa, 2012. [Google Scholar]
- Van der Laan, M.; van Antwerpen, R.; Bristow, K.L. River water quality in the northern sugarcane-producing regions of South Africa and implications for irrigation: A scoping study. Water SA 2012, 38, 1. [Google Scholar] [CrossRef] [Green Version]
- Khatri, N.; Tyagi, S. Influences of natural and anthropogenic factors on surface and groundwater quality in rural and urban areas. Front Life Sci. 2015, 8, 23–39. [Google Scholar] [CrossRef]
- Department of Water and Sanitation (DWS). National Water Resource Strategy; DWS: Pretoria, South Africa, 2013. [Google Scholar]
- Mema, V. Impact of poorly maintained wastewater sewage treatment plants-lessons from South Africa. ReSource 2010, 12, 60–65. [Google Scholar]
- Edokpayi, J.N.; Odiyo, J.O.; Msagati, T.A.M.; Popoola, E.O. Removal efficiency of faecal indicator organisms, nutrients and heavy metals from a peri-urban wastewater treatment plant in Thohoyandou, Limpopo Province, South Africa. Int. J. Environ. Res. Public Health 2015, 12, 7300–7320. [Google Scholar] [CrossRef]
- GroundTruth. eThekwini Municipality State of Rivers Report: Final Summary Report; GroundTruth: Pietermaritzburg, South Africa, 2007. [Google Scholar]
- DWAF. Annual Report 2007/08; DWAF: Pretoria, South Africa, 2008. [Google Scholar]
- Vhembe District municipality (VDM). Final IDP, 2017/18-2021/22; VDM: Thohoyandou, South Africa, 2017. [Google Scholar]
- Hart, M.R.; Quin, B.F.; Nguyen, M.L. Phosphorus runoff from agricultural land and direct fertilizer effects: A review. J. Environ. Qual. 2004, 33, 1954–1972. [Google Scholar] [CrossRef]
- Jarvie, H.P.; Neal, C.; Withers, P.J.A. Sewage-effluent phosphorus: A greater risk to river eutrophication than agricultural phosphorus? Sci. Total Environ. 2006, 360, 246–253. [Google Scholar] [CrossRef]
- Dabrowski, J.M.; de Klerk, L.P. An assessment of the impact of different land use activities on water quality in the upper Olifants River catchment. Water SA 2013, 39, 2. [Google Scholar] [CrossRef] [Green Version]
- DWAF. Middle Vaal Water Management Area: Water Resources Situation Assessment—Main Report; DWAF Directorate National Water Resource Planning, DWAF report No. P0900/00/0101. 2002b; DWAF: Pretoria, South Africa, 2002. [Google Scholar]
- Ndoziya, A.T.; Hoko, Z.; Gumindoga, W. Research Paper: Assessment of the impact of pit latrines on groundwater contamination in Hopley Settlement, Harare, Zimbabwe. J. Water Sanit. Hyg. Dev. 2019, 9, 464–476. [Google Scholar] [CrossRef] [Green Version]
- Graham, J.P.; Polizzotto, M.L. Pit latrines and their impacts on groundwater quality: A systematic review. Environ. Health Perspect. 2013, 121, 521–530. [Google Scholar] [CrossRef] [Green Version]
- Holland, M. Hydrogeological Characterisation of Crystalline Basement Aquifers within the Limpopo Province, South Africa. Ph.D. Thesis, University of Pretoria, Pretoria, South Africa, 2011. Available online: https://repository.up.ac.za/bitstream/handle/2263/25713/Complete.pdf?sequence=9 (accessed on 5 April 2020).
- SoER. Mbombela State of the Environment Report; Mbombela Local Municipality: Mbombela, South Africa, 2003. [Google Scholar]
- Vinger, B.; Hlophe, M.; Selvaratnam, M. Relationship between nitrogenous pollution of borehole waters and distances separating them from pit latrines and fertilized fields. Life Sci. J. 2012, 9, 402–407. [Google Scholar]
- Driver, A.; Sink, K.J.; Nel, J.N.; Holness, S.; Van Niekerk, L.; Daniels, F.; Jonas, Z.; Majiedt, P.A.; Harris, L.; Maze, K. National Biodiversity Assessment 2011: An Assessment of South Africa’s Biodiversity and Ecosystems; Synthesis Report; South African National Biodiversity Institute and Department of Environmental Affairs: Pretoria, South Africa, 2012. [Google Scholar]
- Odiyo, J.O.; Makungo, R. Fluoride concentrations in groundwater and human health impact in Siloam Village, Limpopo Province, South Africa. Water SA 2012, 38, 731–736. [Google Scholar]
- Odiyo, J.O.; Makungo, R. Chemical and microbial quality of groundwater in Siloam Village, implications to human health and sources of contamination. Int. J. Environ. Res. Public health 2018, 15, 317. [Google Scholar] [CrossRef] [PubMed] [Green Version]
- Schoeman, F.; Newby, T.S.; Tompson, M.W.; Van den Berg, E.C. South African National Land-cover Change Map. SAJG 2013, 2, 94–105. [Google Scholar]
- DEA. 2013–2014 South African National land-cover class area stats, DEA/CARDNO SCPF002; DEA: Pretoria, South Africa, 2015. [Google Scholar]
- Statistics South Africa (Stats SA). Natural R.esource Accounts. Land Accounts Including Land Use and Land Cover for SA, 1994/1995; STATS SA: Pretoria, South Africa, 2004. [Google Scholar]
- DEA. DEA E1434 Land-Cover, 2018 South African National Land-Cover Change Assessments (Comparison of SANLC 2018 with SANLC’s 1990 & 2013/14); DEA: Pretoria, South Africa, 2019. [Google Scholar]
- Donnenfeld, Z.; Crookes, C.; Hedden, S. A Delicate Balance: Water Scarcity in South Africa. South. Afr. Rep. 2018, 13, 1–24. [Google Scholar]
- FAO. AQUASTAT Main Database—Food and Agriculture Organization of the United Nations (FAO). 2016. Available online: http://www.fao.org/nr/water/aquastat/data/query/index.html;jsessionid=35159C0ABB6B679B0FEB0EDA9B85AC96 (accessed on 5 December 2020).
- DWAF. South African Water Quality Guidelines. Volume 1, Domestic Water use second edition. 1996. [Google Scholar]
- Cornard, J. An Overview of the Basics of Groundwater Quality. Unpublished. Available online: http://noframe.data.dirisa.org/2sarva/themes-1/groundwater/topical-issues/groundwater-quality/ (accessed on 5 May 2020).
- DWAF. Internal Strategic Perspectives, Inkomati Water Management Area; Report No. P WMA 05/000/00/0303. No.1; Department of Water Affairs and Forestry: Pretoria, South Africa, 2004. [Google Scholar]
- DWAF. Achievements of the River Health Programme 1994–2004: A National Perspective on the Ecological Health of Selected South African Rivers; The National Aquatic Ecosystem Health Monitoring Programme (River Health Programme); DWAF: Pretoria, South Africa, 2006. [Google Scholar]
- Saraiva Okello, A.M.L.; Masih, I.; Uhlenbrook, S.; Jewitt, G.P.W.; van der Zaag, P.; Riddell, E. Drivers of spatial and temporal variability of streamflow in the Incomati River basin. Hydrol. Earth Syst. Sci. 2015, 19, 657–673. [Google Scholar] [CrossRef] [Green Version]
- Munyao, J.M. Water Pollution in A Riparian Community: The Case of River Athi In Makueni County, Kenya. Master’s Thesis, South Eastern Kenya University, Kitui, Kenya, 2 August 2018. [Google Scholar]
- Cullis, J.D.S.; Rossouw, N.; du Toit, G.; Petrie, D.; Wolfaardt, G.; de Clercq, W.; Horn, A. Economic risks due to declining water quality in the Breede River catchment. Water SA 2018, 44, 464–447. [Google Scholar] [CrossRef] [Green Version]
- Megersa, M.; Beyene, A.; Ambelu, A.; Woldeab, B. The use of indigenous plant species for drinking water treatment in developing countries: A review. JBES 2014, 5, 269–281. [Google Scholar]
- Jodi, M.L.; Birnin-Yauri, U.A.; Yahaya, Y.; Sokoto, M. The use of some plants in water purification A. GARJCMS 2012, 1, 71–75. [Google Scholar]
- Odiyo, J.O.; Basey, O.J.; Aoyi, O.; Chimuka, L. Coagulation efficiency of Dicerocaryum eriocarpum plant. Water SA 2017, 43, 1–6. [Google Scholar] [CrossRef] [Green Version]
- Bassey, O.J.; Odiyo, J.O.; Chimuka, L.; Aoyi, O.; Bassey, B.J. Application of mucilage from dicerocaryum eriocarpum plant as biosorption medium in the removal of selected heavy metals. J. Environ. Manage. 2016, 177, 365–372. [Google Scholar]
- Ndiritu, J.G.; Odiyo, J.O.; Makungo, R.; Ntuli, C.; Mwaka, B. Yield reliability analysis for optimizing rural domestic water supply from combined rainwater harvesting and run-of-river abstraction. Hydrol. Sci. J. 2011, 56, 238–248. [Google Scholar] [CrossRef]
- City of Mbombela. City of Mbombela Vision 2030-Strategy, Final Draft; SPPSU-SpatialiZe (Pty) Ltd.: Mbombela, South Africa, 2017. [Google Scholar]
- Jacobs-Mata, I.; de Wet, B.; Banoo, I.; Meissner, R.; de Lange, W.; Strydom, W. Understanding Residential Water-Use Behaviour in Urban South Africa; Alive2green: Cape Town, South Africa, 2018. [Google Scholar]
- Van der Merwe-Botha, M. Water Quality: A Vital Dimension of Water Security. Development Planning Division; Working Paper Series No. 14; DBSA: Midrand, South Africa, 2009. [Google Scholar]
- Norris, V. Review Article: The Use of Buffer Zones to Protect Water Quality. Water Resour. Manage. 1993, 7, 257–272. [Google Scholar] [CrossRef]
- Mayer, P.M.; Reynolds, S.K.; McCutchen, M.D.; Canfield, T.J. Riparian Buffer width, Vegetative Cover, and Nitrogen Removal effectiveness: A Review of Current Science and Regulations; Cincinnati, O.H., Ed.; U.S. Environmental Protection Agency: Washington, DC, USA, 2006. [Google Scholar]
- Nare, L.; Odiyo, J.O.; Francis, J.; Potgieter, N. Framework for effective community participation in water quality management in Luvuvhu River catchment of South Africa. Phys. Chem. Earth 2011, 36, 1063–1070. [Google Scholar] [CrossRef]
- Parsons, R.; Jolly, J. The Development of a Systematic Method for Evaluating Site Suitability for Waste Disposal based on Geohydrological Criteria; Report No. TT 67/94; Water Research Commission: Pretoria, South Africa, 1994. [Google Scholar]
- National Department of Agriculture (NDA). 2005 Strategic Plan for the National Department of Agriculture. Directorate Agricultural Information Services: Pretoria, South Africa, 2005. Available online: http://www.nda.agric.za/docs/strat_plan_05.htm (accessed on 11 March 2020).
- FAO. Water a Shared Responsibility. The United Nation World Water Development Report 2; FAO: Paris, France, 2006. [Google Scholar]

| Database | Data Retrieved | Date Accessed |
|---|---|---|
| WR2012 | Spatial data (shapefiles) | 15 July 2020 |
| FAO-AQUASTATS | South African freshwater withdrawal data | 15 July 2020, revised 5 December 2020 |
| FAO | Global total water renewable data | 15 July 2020 |
| Land-Cover Category | 1990 (%) [94] | 1994/1995 (%) [93,95] | 2000 (%) [41] | 2005 (%) [93] | 2013/14 (%) [95] | 2017/18 (%) [96] |
|---|---|---|---|---|---|---|
| Cultivated areas | 11.1 | 12.4 | 10.5 | 11.9 | 11.2 | 11.0 |
| Forest plantations | 1.5 | 1.5 | 1.4 | 1.6 | 1.5 | 1.7 |
| Total Agriculture use | 12.6 | 13.9 | 11.9 | 13.5 | 12.7 | 12.7 |
| Mines | 0.2 | 0.1 | 0.2 | 0.2 | 0.3 | 0.2 |
| Urban areas | 2.2 | 1.1 | 1.5 | 2 | 2.3 | 2.8 |
| Total Land use | 15 | 15.1 | 13.6 | 15.7 | 15.3 | 15.7 |
Publisher’s Note: MDPI stays neutral with regard to jurisdictional claims in published maps and institutional affiliations. |
© 2021 by the authors. Licensee MDPI, Basel, Switzerland. This article is an open access article distributed under the terms and conditions of the Creative Commons Attribution (CC BY) license (http://creativecommons.org/licenses/by/4.0/).
Share and Cite
Nkosi, M.; Mathivha, F.I.; Odiyo, J.O. Impact of Land Management on Water Resources, a South African Context. Sustainability 2021, 13, 701. https://doi.org/10.3390/su13020701
Nkosi M, Mathivha FI, Odiyo JO. Impact of Land Management on Water Resources, a South African Context. Sustainability. 2021; 13(2):701. https://doi.org/10.3390/su13020701
Chicago/Turabian StyleNkosi, Mary, Fhumulani I. Mathivha, and John O. Odiyo. 2021. "Impact of Land Management on Water Resources, a South African Context" Sustainability 13, no. 2: 701. https://doi.org/10.3390/su13020701