Communication

Heat Rate Prediction of Combined Cycle Power Plant Using an Artificial Neural Network (ANN) Method

by
Yondha Dwika Arferiandi
1,*,
Wahyu Caesarendra
2 and
Herry Nugraha
3
1
Engineering Department, Cilegon Combined Cycle Power Plant, PT Indonesia Power, Cilegon 42454, Indonesia
2
Faculty of Integrated Technologies, Universiti Brunei Darussalam, Jalan Tungku Link, Gadong BE1410, Brunei
3
Research, Innovation and Engineering Department, Head Office, PT Indonesia Power, Jakarta 12950, Indonesia
*
Author to whom correspondence should be addressed.
Sensors 2021, 21(4), 1022; https://doi.org/10.3390/s21041022
Submission received: 28 December 2020 / Revised: 19 January 2021 / Accepted: 23 January 2021 / Published: 3 February 2021
(This article belongs to the Special Issue Artificial Intelligence for Fault Diagnostics and Prognostics)

Abstract

:
Heat rate of a combined cycle power plant (CCPP) is a parameter that is typically used to assess how efficient a power plant is. In this paper, the CCPP heat rate was predicted using an artificial neural network (ANN) method to support maintenance people in monitoring the efficiency of the CCPP. The ANN method used fuel gas heat input (P1), CO2 percentage (P2), and power output (P3) as input parameters. Approximately 4322 actual operation data are generated from the digital control system (DCS) in a year. These data were used for ANN training and prediction. Seven parameter variations were developed to find the best parameter variation to predict heat rate. The model with one input parameter predicted heat rate with regression R2 values of 0.925, 0.005, and 0.995 for P1, P2, and P3. Combining two parameters as inputs increased accuracy with regression R2 values of 0.970, 0.994, and 0.984 for P1 + P2, P1 + P3, and P2 + P3, respectively. The ANN model that utilized three parameters as input data had the best prediction heat rate data with a regression R2 value of 0.995.

1. Introduction

Combined cycle power plants (CCPPs) are one of the power plants types that could produce electricity with high efficiency and low air pollutant. However, the CCPPs production cost is relatively higher than the coal-fired power plant due to prime energy costs. Hence, operating CCPPs as efficiently as possible is required to decrease production costs. CCPP highest efficiency could be achieved with maximum load and operating in base load. Unfortunately, energy supply instability is a common problem of CCPPs in Indonesia. This issue leads the CCPP management staff struggling to predict the performance of their CCPP. Assessing historical performance data using machine learning will help to predict the CCPP performance accurately.
Some literature about gas turbine (GT) or CCPP modeling with machine learning has been studied. Wood [1] used the transparent open box (TOB) to predict the combined cycle gas turbine’s power output. Liu et al. [2] predicted gas turbine performance with high dimensional model representation (HDMR) and an artificial neural network (ANN). A distributed control system (DCS) was utilized as a tool to provide selected input data. It was presented that the holistic ANN model had a higher accuracy to predict gas turbine performance. The ANN was utilized to describe the micro gas turbine performance and effectively evaluate it in a real installation in any climate as presented by Bartolini et al. [3]. Anvari et al. [4] utilized an ANN on combined cooling heating and power (CCHP) to predict GT performance prediction. Some underlying parameters were chosen as inputs but did not include any fuel gas characteristics. Fast et al. [5] developed an ANN model to predict the performance of an industrial GT. Relative humidity, ambient pressure and ambient temperature were used as input parameters. It was reported that the best possible modeling of the plant was optimized for 10,000 epochs. Rossi et al. [6] reported ANN modeling for baseline consumption of a combined heat and power plant. Elfaki et al. [7] predicted the electrical output power of CCPP using the regression ANN model. Moreover, ANN has been applied to other GT-based application [8,9,10,11]. ANN is also widely used in power plants with multiple objectives. Smrekar et al. [12] predicted power generated by a coal-fired power plant. Thermal efficiency and power plant pollutant were also predicted with ANNs [13,14,15,16].
To date, there is no actual study predicting CCPP performance using fuel gas characteristics such as gas heat units in million British thermal units (MMBTU) or CO2 percentage, even though those two parameters are usually used in the gas purchase agreement between the gas suppliers and power plant operator. Furthermore, the power plant operator usually has a plant efficiency written in their contract with the regulator. Omar et al. [17] showed that decreasing power generation leads to higher specific fuel consumption.
According to the research gap, this paper proposes a prediction method of CCPP heat rate performance with gas heat unit in million British thermal units (MMBTUs), carbon dioxide (CO2) percentage contain in the fuel gas and generated power in megawatts (MW) as input parameters. Some studies above showed that ANN is effective in predicting gas turbine performance. Therefore, an ANN was used as a machine learning tool to predict the power plant heat rate.

2. Materials and Methods

Artificial neural networks are a technology-based on studies of the brain and nervous system. These networks emulate a biological neural network, but they use a reduced set of biological neural systems concepts. Specifically, ANN models simulate the electrical activity of the brain and nervous system. Processing elements (also known as either a neurodes or perceptrons) are connected to other processing elements. Typically, the neurodes are arranged in a layer or vector, with the output of one layer serving as the input to the next layer and possibly other layers. A neurode may be connected to all or a subset of the neurodes in the subsequent layer, with these connections simulating the brain’s synaptic connections. Weighted data signals entering a neurode simulate a nerve cell’s electrical excitation and, consequently, the transference of information within the network or brain. The input values to a processing element are multiplied by a connection weight that simulates the strengthening of neural pathways in the brain. Through the adjustment of the connection strengths or weights, learning is emulated in ANNs [18].
An ANN is comprised of an input layer, hidden layers and an output layer. All input nodes have their weight connection of a neuron. Then the relationship between input parameters and output parameters is learned through the iterative training process. Linear and nonlinear activation functions are included in the ANN system, resulting in a good prediction of nonlinear behavior systems.
The components of ANNs are neurons, transfer functions and predefined layers. In a multilayer perceptron (MLP), the transfer function used are tan-sigmoid (tansig), log-sigmoid (logsig), and linear purelin functions [19]. Tansig receives the signal in (−∞, +∞) and converts them to output signal within a (−1, +1) range. Logsig receives the input signals in the range of (−∞, +∞) and transfers them to the (0, 1) limit. Pureline is a linear function that maps the input data between (−∞, +∞) and results in the identical data in (−∞, +∞) interval [4].
Our proposed method for predicting heat rate in a CCPP was developed and demonstrated for a 740 MW CCPP with configuration two GTs, two heat recovery Sseam generators (HRSGs), and one steam turbine. However, this paper only provides predictions with configuration 1-1-1 (one GT and one HRSG stop) due to a lack of gas supply. Real operation data were collected over one year (2019). Figure 1 presents this paper’s flowchart. The input parameters in this paper were MMBTU, CO2 percentage and power generated in MW. Total generated power of the CCPP, from a GT and steam turbine, recorded by a distributed control system (DCS) was used as an input parameter in this paper. Since the DCS did not provide a fuel gas heating unit in MMBTUs and CO2 percentage, the gas supplier’s hourly data were used. The gas provided by the supplier went to the combustion chamber and was used as a fuel for the GT. The exhaust gas from the process was used to feed the HRSG. Since the total heat from these two processes is equal to the gas supplied, the gas data from supplier was used. Equation (1) was used to calculate the plant heat rate [20].
HR = Mf   x   HHV P
where: HR = Heat Rate (kcal/kWh); Mf = Fuel gas flow (kNm3/h); HHV = High Heating Value (BTU/SCF); P = power output (MW).
One input parameter was used with the ANN to see the result in predicting the heat rate. Two combined parameters were used with the ANN to see the result in predicting the heat rate. And finally, the three combined parameters were used with the ANN to see the result in predicting the heat rate. Fuel gas flow was recorded in a DCS and a High Heating Value (HHV) recorded by the gas suppliers and used in this paper. As shown in Figure 1, the generated power recorded by the DCS was the key to get clean data, as per 15 min of data recorded by the DCS collected and evaluated. The data was normalized by rounding it to the nearest multiple of five, then evaluated by comparing it with data 15 min before and after. If the normalized data had an equal value with data 15 min before and after, the data would continue to the next step. If the value was not equal, then it was terminated. This step was necessary to determine whether the CCPP was in steady-state load condition or not. The measured data were selected carefully to remove the transient during start-up, shut down and load change. Finally, 4322 clean data were provided in steady-state power plant conditions, as presented in Table 1. The input parameters were combined as shown in Table 2 to find the best combination to predict heat rate.
A feed-forward backpropagation network type was implemented in all ANN models and trained using gradient descent with momentum and adaptive learning rate backpropagation (traingdx). Mean squared error (MSE) was used as the loss function. With a back-propagation algorithm, the learning function changed the weight between the neurons to reduce the difference. Since success implementation for power plant application has been shown in other studies [2,5,8], the tansig and purelin activation function was implemented in this paper. One hidden layer was used with purelin as a transfer function. The total neuron used was one neuron. ANN structure for the model with one input parameter is shown in Figure 2.
Two input parameters were combined as presented in the Table 2. In these models, two hidden layers were used. The first hidden layer used four neurons as a rule of thumb of the hidden layer as the input layer square, and the second hidden layer used 1 neuron. The transfer function used in the first hidden layer was tansig, and the second hidden layer used purelin as a transfer function. The ANN structure for the model with two input parameters is shown in Figure 3.
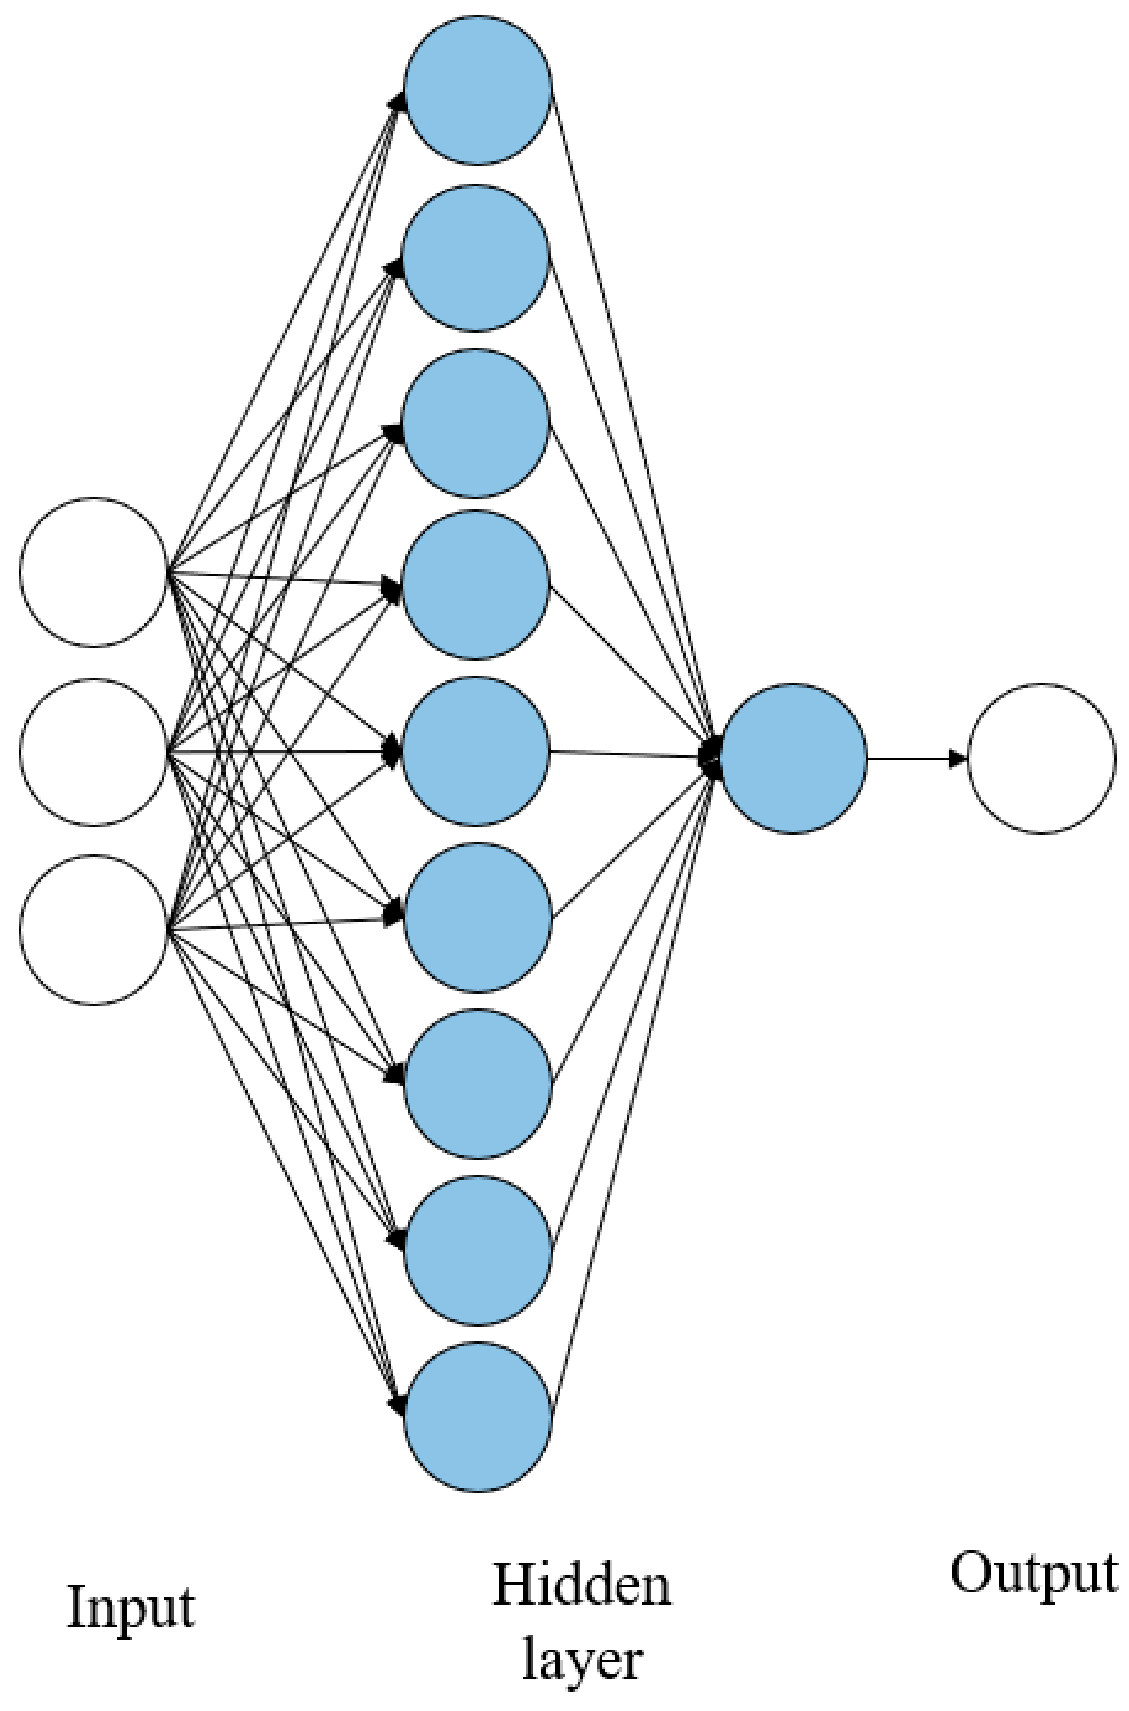
The last model was the combination of all three input parameters. Two hidden layers were used, with the first hidden layer using nine neurons as a rule of thumb of the hidden layer as the input layer square, and the second layer used 1 neuron. The first layer used tansig as a transfer function, and the second layer used purelin as a transfer function. Figure 4 shows the ANN structure for the model with three input parameters:
The output parameter for all models was the plant heat rate, since the plant heat rate was usually used in a contractual agreement to judge whether the power plant was operated efficiently or not. Each model used 10,000 epoch iterations and 1000 validation checks. Data used for training was 50%, while 25% was used for validation and the other 25% used for the test.

3. Results

3.1. One Input Parameter

Utilizing only one parameter, each model failed to execute until ten thousand iterations. Each model always met the maximum validation check. P2 had the highest iteration check among them with 1534 iteration, while P1 and P3 were only able to execute 1031 and 1025 iteration, respectively. Figure 5 shows training data for P1, P2 and P3, while Figure 6, Figure 7 and Figure 8 shows their regression. P1 and P3 show R2 for all data of 0.925 and 0.954, respectively. P2 only resulted in R2 0.048. With low R2 results from these ANN models, we could see that with only one parameter, the ANN did not meet the expectation of predicting the heat rate. Moreover, with only CO2 percentage as an input parameter, it could not predict the power plant heat rate.

3.2. Two Input Parameters

According to the training results in Figure 9, two input parameters were used in model P1 + P2, P1 + P3, and P2 + P3. P1 + P2 failed to execute 10,000 iteration to reach the maximum validation check allowance, while P1 + P3 and P2 + P3 successfully executed up to 10,000 iterations. P1 + P2 was only able executed up to 5346 iterations. Figure 10, Figure 11 and Figure 12 show the model P1 + P2, P1 + P3, and P2 + P3 regressions R2 were 0.970, 0.994, and 0.984, respectively. It was shown that utilized fuel gas input and power output could predict the power plant heat rate more accurately than fuel gas input with CO2 percentage or CO2 percentage with power output.

3.3. Three Input Parameters

All three input parameters are combined in this section, and the training results are presented in Figure 13. Ten thousand iterations were successfully executed with zero validation checks. Figure 14 shows that the regression R2 for model g was 0.995, which was the highest number among all models. Based on these results, utilizing fuel gas input, CO2 percentage and power output together as input parameters in ANN could lead to more accurate power plant heat rate prediction.
Twenty five percent of 4322 data were used as test data to evaluate the ANN model performance. As many as 1081 data, as shown in Table 3 and Table 4, were obtained, and the absolute error percentage was used to see which data had the lowest error numbers. As shown in Table 5, P1 + P2 + P3 had the lowest average error with 0.19%, and P2 had the highest average error with 1.84%. P1 maximum error was the highest as shown in Figure 15 and Table 4 with 7.83%, and the maximum error of P1 + P2 + P3 was the lowest with 1.4681%.

4. Discussion

The experimental results showed that ANN could predict CCPP heat rate performance with correct input parameters. Those models with one input parameter were not able to execute 10,000 epoch iterations. The ANN always met the maximum validation check allowances. Combining two parameters could lead to a better heat rate prediction. P1 + P3 that used fuel gas heat input and power output was a more accurate model than the other models with two input parameters. P1 + P2 was the only two parameter input that did not meet the iteration expected. The training stopped at 5346 iterations because the validation check met the maximum allowance. The combination of P2 + P3 could meet the expected iteration. However, the R2 regression was only 0.984, and the validation check was 17. Combining three input parameters, P1 + P2 + P3, could produce better accuracy. Table 6 shows that P1 + P2 + P3 led to the highest regression R2 value. It also had a zero validation check. A validation check refers to the number of errors from the dataset. Lower validation checks could lead to higher accuracy from the model to predict the desired data. The experiment data showed that adding CO2 percentage as an input parameter could lead to higher accuracy in predicting CCPP heat rate value. All the variation had average error data lower than 2%. This indicates that the NN could predict heat rate accurately, and the P1 + P2 + P3 with the lowest error data could be the best variation to predict heat rate.
Input parameter, P1 + P2 + P3 as listed in Table 5, were used in ANN method to predict the actual heat rate as presented in Table 6 with 1028 data predictions. The average error for prediction was 2.52% with max error value 10.88%

5. Conclusions

Based on our experiment, the conclusions obtained are as follows:
  • Utilizing one parameter as an input could not bring an accurate heat rate prediction. The ANN regression R2 value for fuel gas energy (MMBTU), CO2 percentage (%), and power output (MW) were 0.925, 0.005, and 0.954, respectively.
  • The regression R2 values for two input parameters, where fuel gas energy (MMBTU) + CO2 percentage (%), fuel gas energy (MMBTU) + Power (MW), and CO2 percentage (%) + Power (MW), were 0.970, 0.994, and 0.984, respectively.
  • The combination of all three parameters showed the best result of the ANN model. The regression R2 value was 0.995 with zero validation check and the lowest average error data.
  • The three parameter combination resulted in the lowest average error in experimental data with 0.19%
  • Utilizing fuel gas energy (MMBTU), CO2 percentage (%), and power output (MW) as inputs can lead to an accurate CCPP heat rate prediction.
This experiment was successful given that an accurate CCPP heat rate prediction was made with three input parameters. Adding more parameters like GT model, equivalent operating hours, trip history, or other parameters, might lead to a more accurate and more widely applicable ANN in predicting CCPP heat rate.

Author Contributions

Conceptualization, Y.D.A. and W.C.; methodology, W.C.; software, W.C.; validation, Y.D.A., and W.C.; formal analysis, W.C.; investigation, Y.D.A.; resources, Y.D.A.; data curation, Y.D.A.; writing—original draft preparation, Y.D.A.; writing—review and editing, W.C.; visualization, Y.D.A.; supervision, W.C. and H.N.; funding acquisition, Y.D.A. and H.N. All authors have read and agreed to the published version of the manuscript.

Funding

The APC of this publication was funded by PT Indonesia Power.

Conflicts of Interest

The authors declare no conflict of interest.

References

  1. Wood, D.A. Combined cycle gas turbine power output prediction and data mining with optimized data matching algorithm. SN Appl. Sci. 2020, 2, 1–21. [Google Scholar] [CrossRef] [Green Version]
  2. Liu, Z.; Karimi, I.A. Gas turbine performance prediction via machine learning. Energy 2020, 192, 116627. [Google Scholar] [CrossRef]
  3. Bartolini, C.; Caresana, F.; Comodi, G.; Pelagalli, L.; Renzi, M.; Vagni, S. Application of artificial neural networks to micro gas turbines. Energy Convers. Manag. 2011, 52, 781–788. [Google Scholar] [CrossRef]
  4. Anvari, S.; Taghavifar, H.; Saray, R.K.; Khalilarya, S.; Jafarmadar, S. Implementation of ANN on CCHP system to predict trigeneration performance with consideration of various operative factors. Energy Convers. Manag. 2015, 101, 503–514. [Google Scholar] [CrossRef]
  5. Fast, M.; Assadi, M.; De, S. Development and multi-utility of an ANN model for an industrial gas turbine. Appl. Energy 2009, 86, 9–17. [Google Scholar] [CrossRef]
  6. Rossi, F.; Velázquez, D.; Monedero, I.; Biscarri, F. Artificial neural networks and physical modeling for determination of baseline consumption of CHP plants. Expert Syst. Appl. 2014, 41, 4658–4669. [Google Scholar] [CrossRef]
  7. Elfaki, E.A.; Hassan, A.H. Prediction of electrical output power of combined cycle power plant using regression ANN model. J. Power Energy Eng. 2018, 6, 17–38. [Google Scholar] [CrossRef] [Green Version]
  8. Tüfekci, P. Prediction of full load electrical power output of a base load operated combined cycle power plant using machine learning methods. Int. J. Electr. Power Energy Syst. 2014, 60, 126–140. [Google Scholar] [CrossRef]
  9. Rua Orozco, D.J.; Venturini, O.J.; Escobar Palacio, J.C.; del Olmo, O.A. A new methodology of thermodynamic diagnosis, using the thermoeconomic method together with an artificial neural network (ANN): A case study of an externally fired gas turbine (EFGT). Energy 2017, 123, 20–35. [Google Scholar] [CrossRef]
  10. Plis, M.; Rusinowski, H. A mathematical model of an existing gas-steam combined heat and power plant for thermal diagnostic systems. Energy 2018, 156, 606–619. [Google Scholar] [CrossRef]
  11. Palme, T.; Breuhaus, P.; Assadi, M.; Klein, A.; Kim, M. New Alstom Monitoring Tools Leveraging Artificial Neural Network Technologies. ASME Turbo Expo 2011, 281–292. [Google Scholar] [CrossRef]
  12. Smrekar, J.; Pandit, D.; Fast, M.; Assadi, M.; De, S. Prediction of power output of a coal-fired power plant by artificial neural network. Neural Comput. Appl. 2009, 19, 725–740. [Google Scholar] [CrossRef]
  13. Fantozzi, F.; Desideri, U. Simulation of power plant transients with artificial neural networks: Application to an existing combined cycle. Proc. Inst. Mech. Eng. 1998, 212, 299–313. [Google Scholar] [CrossRef]
  14. Flynn, D.; Ritchie, J.; Cregan, M. Data Mining Techniques Applied to Power Plant Performance Monitoring. In IFAC Proceedings Volumes; Elsevier: Amsterdam, The Netherlands, 2005; Volume 38, pp. 369–374. [Google Scholar]
  15. Lu, S.; Hogg, B. Dynamic nonlinear modelling of power plant by physical principles and neural networks. Int. J. Electr. Power Energy Syst. 2000, 22, 67–78. [Google Scholar] [CrossRef]
  16. Pan, L.; Flynn, D.; Cregan, M. Statistical Model for Power Plant Performance Monitoring and Analysis. In Proceedings of the 2007 42nd International Universities Power Engineering Conference, Brighton, UK, 4–6 September 2007; pp. 121–126. [Google Scholar]
  17. Khudair, O.A.; Abass, K.A.; Abed, N.S.; Ali, K.H.; Abdulaziz, S.; Shaboot, A.C. Theoretical Investigation For The Effect of Fuel Quality on Gas Turbine Power Plants. J. Phys. Conf. Ser. 2018, 1003, 012022. [Google Scholar] [CrossRef]
  18. Walzcak, S.; Narciso, C. Artificial Neural Network. Available online: https://www.researchgate.net/publication/288156361_Artificial_Neural_Networks (accessed on 2 December 2020).
  19. Taghavifar, H.; Mardani, A.; Taghavifar, L. A hybridized artificial neural network and imperialist competitive algorithm opti-mization approach for prediction of soil compaction in soil bin facility. Measurement 2013, 46, 2288–2299. [Google Scholar] [CrossRef]
  20. ASME. ASME PTC 22—2005 Gas Turbine Performance Test Code. Available online: https://www.twirpx.com/file/866220/ (accessed on 2 December 2020).
Figure 1. Flowchart of the research method.
Sensors 21 01022 g001aSensors 21 01022 g001b
Figure 2. ANN structure for one input parameter (P1, P2 and P3).
Sensors 21 01022 g002
Figure 3. ANN structure for two input parameters (P1 + P2, P1 + P3 and P2 + P3).
Sensors 21 01022 g003
Figure 4. ANN structure for three input parameters (P1 + P2 + P3).
Sensors 21 01022 g004
Figure 5. Training results of (a) P1, (b) P2 and (c) P3.
Sensors 21 01022 g005
Figure 6. P1 regression result.
Sensors 21 01022 g006
Figure 7. P2 regression result.
Sensors 21 01022 g007
Figure 8. Regression result of P3.
Sensors 21 01022 g008
Figure 9. Training results of (a) P1 + P2, (b) P1 + P3 and (c) P2 + P3.
Sensors 21 01022 g009aSensors 21 01022 g009b
Figure 10. Regression result of P1 + P2.
Sensors 21 01022 g010
Figure 11. Regression result of P1 + P3.
Sensors 21 01022 g011
Figure 12. Regression result of P2 + P3.
Sensors 21 01022 g012
Figure 13. Training result of P1 + P2 + P3.
Sensors 21 01022 g013
Figure 14. Regression of P1 + P2 + P3.
Sensors 21 01022 g014
Figure 15. ANN result error.
Sensors 21 01022 g015
Table 1. Actual operation data used.
NoFuel Gas Heat Input (MMBTU) 1CO2 Percentage (%)Power Output (MW)Heat Rate (kcal/kWh)
12197.8213.678302.521878.26
22197.8213.678302.521878.26
32197.8213.678302.881876.03
42197.8213.678303.211873.99
52196.7983.636303.091874.17
62196.7983.636302.341878.82
72197.4233.563302.731876.23
82197.4233.5633031874.56
92200.3183.614303.031876.92
102202.6823.577303.121876.68
43132165.6013.719305.011816.48
43142165.6013.7190303.661824.56
43152165.6013.7190304.171821.5
43162165.6013.7190304.681818.45
43172157.4973.595303.871816.67
43182155.633.716302.851820.62
43192155.633.716303.31817.92
43202151.1223.901302.071823.05
43212150.7593.804301.861823.44
43222150.7593.804302.281820.91
1 Milion British Thermal Unit.
Table 2. Input and output parameter for the artificial neural network (ANN) model.
GroupVariationParameter DescriptionOutput Parameter
One input ParameterP1Fuel gas energy (MMBTU)heat rate
P2CO2 percentage (%)heat rate
P3Power (MW)heat rate
Two input Parameters P1 + P2Fuel gas energy (MMBTU) & CO2 percentage (%)heat rate
P1 + P3Fuel gas energy (MMBTU) & Power (MW)heat rate
P2 + P3CO2 percentage (%) & Power (MW)heat rate
Three input parametersP1 + P2 + P3Power (MW) & Fuel gas energy (MMBTU)heat rate
Table 3. Test data for P1, P2, P3 and P1 + P2.
NoActualP1ErrorP2ErrorP3ErrorP1 + P2Error
11930.121961.381.62%1858.553.71%1962.811.69%1928.670.08%
21943.561961.380.92%1858.554.37%1965.961.15%1928.670.77%
31918.191962.032.29%1858.323.12%1960.442.20%1929.100.57%
41930.221962.031.65%1858.323.72%1963.291.71%1929.100.06%
51927.701962.031.78%1858.323.60%1962.691.82%1929.100.07%
61929.721962.031.67%1858.323.70%1963.171.73%1929.100.03%
71933.591962.411.49%1858.153.90%1964.121.58%1929.300.22%
81928.041962.411.78%1858.153.63%1962.811.80%1929.300.07%
91936.641962.411.33%1858.154.05%1964.831.46%1929.300.38%
101927.541962.411.81%1858.153.60%1962.691.82%1929.300.09%
10721816.481811.500.27%1860.872.44%1814.070.13%1821.540.28%
10731824.561811.500.72%1860.871.99%1816.740.43%1821.540.17%
10741821.501811.500.55%1860.872.16%1815.730.32%1821.540.00%
10751818.451811.500.38%1860.872.33%1814.720.21%1821.540.17%
10761816.671814.290.13%1860.402.41%1816.320.02%1822.700.33%
10771820.621814.930.31%1860.862.21%1818.340.13%1822.980.13%
10781817.921814.930.16%1860.862.36%1817.450.03%1822.980.28%
10791823.051816.470.36%1861.582.11%1819.880.17%1823.710.04%
10801823.441816.600.38%1861.202.07%1820.300.17%1823.740.02%
10811820.911816.600.24%1861.202.21%1819.470.08%1823.740.16%
Table 4. Test data for P1 + P3, P2 + P3 and P1 + P2 + P3.
NoActualP1 + P3ErrorP2 + P3ErrorP1 + P2 + P3Error
11930.121930.850.04%1935.110.26%1932.780.14%
21943.561938.250.27%1939.500.21%1943.220.02%
31918.191924.420.32%1932.040.72%1923.870.30%
41930.221931.080.04%1935.930.30%1933.330.16%
51927.701929.690.10%1935.120.38%1931.350.19%
61929.721930.800.06%1935.770.31%1932.940.17%
71933.591932.520.06%1937.240.19%1935.610.10%
81928.041929.450.07%1935.460.38%1931.220.16%
91936.641934.190.13%1938.210.08%1938.010.07%
101927.541929.170.08%1935.290.40%1930.820.17%
10721816.481821.280.26%1820.620.23%1820.140.20%
10731824.561827.360.15%1822.060.14%1826.510.11%
10741821.501825.090.20%1821.520.00%1824.120.14%
10751818.451822.790.24%1820.980.14%1821.710.18%
10761816.671821.520.27%1822.220.31%1820.360.20%
10771820.621825.020.24%1822.910.13%1824.360.21%
10781817.921822.980.28%1822.440.25%1822.220.24%
10791823.051825.820.15%1823.510.02%1825.790.15%
10801823.441826.540.17%1823.790.02%1826.290.16%
10811820.911824.650.21%1823.350.13%1824.340.19%
Table 5. Test result error summary.
Input ParameterMax ErrorAverage Error
P17.84%0.73%
P24.81%1.84%
P35.42%0.58%
P1 + P25.80%0.49%
P1 + P32.10%0.23%
P2 + P35.14%0.41%
P1 + P2 + P31.47%0.19%
Table 6. CCPP heat rate actual prediction with ANN.
NoActualPredictionError
12462.342404.592.35%
22429.132436.050.28%
32461.902433.801.14%
42446.282431.910.59%
52443.302414.701.17%
62433.572431.620.08%
72460.702434.821.05%
82462.242438.580.96%
92436.632451.690.62%
102447.932437.340.43%
10192447.892447.840.00
10202451.292430.370.01
10212445.202444.250.00
10222439.772394.990.02
10232420.732431.860.00
10242453.712437.440.01
10252423.182422.990.00
10262409.582432.120.01
10272439.652412.530.01
10282431.932421.860.00
Publisher’s Note: MDPI stays neutral with regard to jurisdictional claims in published maps and institutional affiliations.

