Abstract
The present work highlights some of the dynamic couplings observed in a series of tests performed in a wave basin with a scaled-model of a Floating Offshore Wind Turbine (FOWT) with semi-submersible substructure. The model was moored by means of a conventional chain catenary system and an actively controlled fan was used for emulating the thrust loads during the tests. A set of wave tests was performed for concomitant effects of not aligned wave and wind. The experimental measurements illustrate the main coupling effects involved and how they affect the FOWT motions in waves, especially when the floater presents a non-negligible tilt angle. In addition, a frequency domain numerical analysis was performed in order to evaluate its ability to capture these effects properly. The influence of different modes of fan response, floater trim angles (changeable with ballast compensation) and variations in the mooring stiffness with the offsets were investigated in the analysis. Results attest that significant changes in the FOWT responses may indeed arise from coupling effects, thus indicating that caution must be taken when simplifying the hydrodynamic frequency-domain models often used as a basis for the simulation of FOWTs in waves and in optimization procedures for the design of the floater and mooring lines.
1. Introduction
Parametric optimization of floater and moorings is a procedure frequently employed in the first stages of the design of a new Floating Offshore Wind Turbine (FOWT). In this approach, simplified models are often used for predicting the dynamics of the system while ensuring that the process will meet the time constraints imposed by the design. A trade-off is then established between the accuracy of force and motion predictions and the computational demand of an optimization procedure. In this context, the predictions of motions in waves is generally based on pre-computed hydrodynamic loads or motion transfer functions obtained from radiation/diffraction codes [1,2,3]. Moreover, hydrodynamic coefficients derived from panel methods are also the basis for seakeeping time-domain simulations that take into account the coupled dynamics of floater, rotor and mooring lines, considering not only the wave-frequency motions but also the slow-motions induced by second-order effects.
On the other hand, experimental methodologies for studying FOWT behaviour under wave and wind have been adopted. Different approaches for emulating the rotor wind forces can be found in the literature, such as using Reynolds scaled wind [4], cables [5,6] and active fans [7,8,9,10]. The use of cables or active fans demands a code integration with real-time rotor load prediction in a software-in-the-loop scheme (SIL). A more detailed review of these experimental techniques can be found in [11,12,13].
Nevertheless, some of the distinguishing characteristics of a typical FOWT, such as the relatively light hull, make its dynamics more susceptible to the effects induced by couplings with the mooring lines and, of course, the rotor loads; part of these effects may arise from external causes that can be difficult to properly predict when preparing the hydrodynamic model. This may be even more important for concepts that do not use active ballast compensation, a trend that may be favored as the turbines become more tolerant to higher inclinations and accelerations of the rotor nacelle assembly (RNA).
The present work is part of an R&D project conducted cooperatively by the Universidade de São Paulo and the University of Tokyo, in which different FOWT concepts were proposed and evaluated for operating in a particular site on the Brazilian coast [14,15,16]. Using the NREL (National Renewable Energy Laboratory) 5 MW turbine [17] as a reference for the wind turbine, one of the main objectives of the project was to develop, calibrate and test the performance of a computational tool designed for parametric optimization of the floater and mooring system geometries.
Here, the results of the wave basin tests performed with one of the concepts will be shown, together with the changes required in the numerical model for obtaining a proper reproduction of the model response. The tests included concomitant effects of not aligned waves and wind and an active fan was used to emulate the rotor thrust during the tests, according to the loads predicted by a BEMT (blade element momentum theory) code integrated to the tests in a SIL scheme. Two different wind speeds were used, a mild wind condition in the below-rated regime and a more intense one, corresponding to the maximum rotor thrust. In both cases, no active blade pitch control was considered, but the thrust was corrected by the BEMT model according to apparent wind velocities induced by the model motions.
Another important aspect concerns the ballast compensation. The FOWT desgin used in the tests includes an active ballast control for adjusting the floater trim. For the tests, however, no active ballast control was employed, but two different strategies were adopted: in the first one, a shift of the ballast mass was made to compensate most of the tilt induced by the mean rotor thrust; in the second approach, no compensation was made, leading to situations with somewhat large tilt angles, especially in the condition of maximum thrust.
As one may anticipate, this set of variations in the rotor loads and in the floater attitude (trim angles) resulted in significant changes in the FOWT motion response. These changes were detectable both in the decay tests and in the wave tests, and one of the main objectives of the analyses presented herein is to evaluate which effects dominated the variations and to assess if one would be able to predict them accurately when using simplified frequency-domain models.
For this assessment, one must take into account the fluctuations of the rotor thrust due to the tower motions. In this respect, a series of previous works dealing with this problem is available in the literature, and they explain very well most of the consequences that should be expected. For instance, [18] models the damping effect induced by the thrust variations, and [19] observes that an “apparent inertia” may also result for conditions when the blade pitch is controlled, due to a phase shift between the thrust response and the nacelle accelerations. Yet, the floater tilt can also impose significant changes, especially in the FOWT pitch motion response. One of the main issues in this case is the heave-pitch dynamic coupling that appears as a result of the mean trim angle. Here, both hydrodynamic effects and mooring line tensions may play important roles. These heave-pitch coupling effect was also noticed by [20] in an experimental campaign with a semisubmersible FOWT under waves and constant wind thrust. Finally, there are the general variations of the mooring stiffness due to the horizontal offsets of the floater, which may potentially contribute to the changes observed in the motions. This is the case for the low-frequency surge/sway motions in particular, a fact already observed by [19].
In the following sections, all the possible causes of changes in the motion response will be explored and corrections in the linear numerical model will be made in an attempt to reproduce these changes properly. Some important conclusions will be drawn concerning the ballast compensation and the evaluation of the mooring stiffness and external (hydrodynamic and aerodynamic) damping effects. First, however, a description of the model and experimental setup will be made, followed by the main considerations adopted in wind turbine characterization and the hydrodynamic model of the FOWT. Section 3 will provide the main results from both numerical and physical tests and a discussion on the level of agreement obtained in the predictions. Finally, the main conclusions derived from this analysis will be summarized in Section 4.
2. Materials and Methods
This section first presents the Jappaku FOWT [14] floating structure and its mooring system, which is followed by a description of the experimental setup adopted in the model tests and the presentation of the main features of the radiation-diffraction numerical model employed for predicting of its responses in waves.
2.1. FOWT Geometry and Mooring System
The Jappaku FOWT floating structure consists of a semisubmersible hull with a central column that supports the turbine tower and three orbital columns disposed in a triangular shape. The central column presents a larger diameter if compared to the orbital ones. For the purpose of the present model tests, the columns are connected by a set of deck bracings, as presented in Figure 1. The scale factor adopted for the tests was 1:80. Following the developments presented in a previous work [15], heave plates are adopted in each column as a means to tune the natural periods of motions and to increase the viscous damping levels in resonant conditions. Table 1 brings the main properties of the Jappaku FOWT in both, full and model scales (1:80). Ballast weights were distributed in the model to match the position of the center of gravity and the inertias of the full scale FOWT with the help of commercial software Edtools® [21].
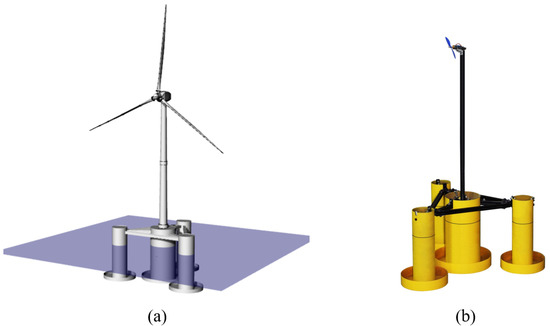
Figure 1.
Details of the Jappaku Floating Offshore Wind Turbine (FOWT): (a) concept for the full scale and (b) model scale (1:80).

Table 1.
Jappaku FOWT hull main properties.
The FOWT model was moored in the wave basin by means of three catenary mooring lines, as presented in Figure 2. Each mooring line was composed of two different segments: chain (bottom) and polyester wire (upper segment). Fairleads were located at the bottom of the side columns, under the heave plates, at a radius corresponding in full scale to 30 m from the axis of the central column. The water depth corresponds to 302.8 m in full scale, and the anchor radius was 543.1 m. Table 2 shows the mooring system main properties in both full and model scales.
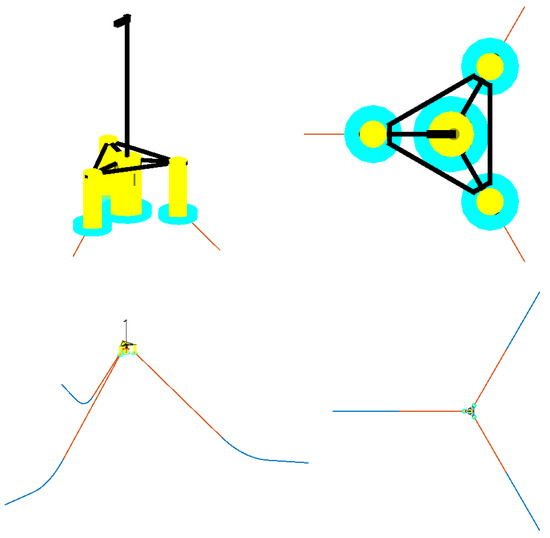
Figure 2.
Jappaku FOWT mooring system by Edtools® software in full scale.
Table 2.
Jappaku FOWT mooring system main properties.
2.2. Experimental Setup
The experimental tests were conducted at thewave basin of the Numerical Offshore Tank Laboratory (TPN) of the Universidade de São Paulo (Figure 3). The facility consists of a squared 14 m × 14 m × 4 m (length, width, depth) basin with flap-type wave makers distributed all around, which are also responsible for active wave absorption (complete information on the wave basin can be found in [22]). In this new set of tests, the main purposes were to evaluate the catenary anchoring systems and the effects of the wind emulated by an actuator in a software-in-the-loop (SIL) approach.
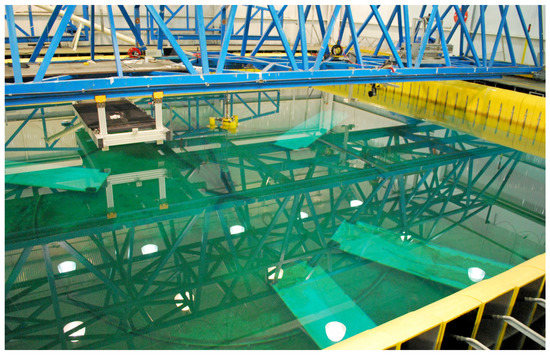
Figure 3.
TPNwave basin.
Experimental characterization of the response in waves was obtained with white-noise type waves, with and without wind emulation. In the present paper, only the tests performed for characterizing the first-order motions of the FOWT will be addressed. The significant wave height was equivalent to 1.9 m with constant energy distribution over a range of period from 6.4 s to 27 s. Figure 4 presents the wave measurements obtained in the wave basin and the PSD (power spectrum density) derived from it, for illustration purposes.
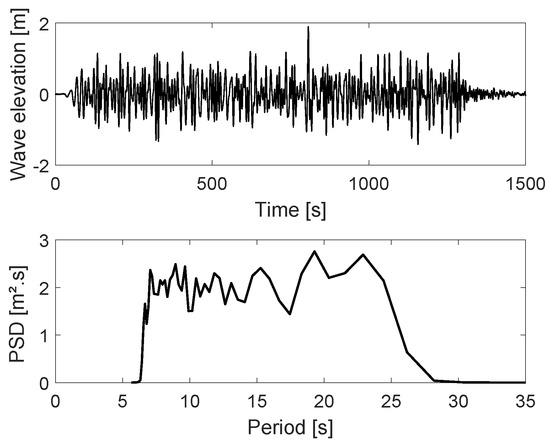
Figure 4.
White noise wave type characteristics.
A set of two wave probes (WP) was used to measure the waves during the tests: one was positioned ahead of the model location (meaning waves hit this WP before reaching the model) and the other was placed sideways. A third WP was positioned at the model location during wave calibration as wave reference and later removed for the model tests. The model motions were measured using a Qualisys® optical tracking system with cameras positioned above the model in the instrumentation bridge. Four stationary infrared cameras were used to track a set of six passive markers attached to the model structure. The redundancy of cameras and markers was used to provide accuracy and reliability for the motion measurements, with residual measurement for each marker being less than 1.0 mm. The sampling frequency adopted during the measurements was 100 Hz.
2.3. Wind Force Emulation Using a Software-in-the-Loop (SIL) Scheme
The aerodynamic thrust provided by the real rotor was emulated in model scale during the tests by using a SIL approach, thus allowing to consider the Froude scaling law for both hydro and aerodynamic loads. For performing this task, a previously developed algorithm that computes the aerodynamic loads on the rotor based on BEMT was integrated in the tests. The position data recorded by the camera tracking system and the motion velocities computed in six degrees of freedom (dof) served as input to the SIL model. The computer then sent the required aerodynamic thrust calculated in each time sample to a wind actuator composed of a computer interface, a motor driver ESC (electronic speed control) and, finally, to a brushless motor with a propeller.
The BEMT code with the model of the NREL 5 MW turbine was implemented in C++ and compiled for running in MATLAB (details on the BEMT routine can be found in [23,24]).
2.4. Wind Actuator
The characterization of the actuator for the calibration of the aerodynamic thrust was performed in a fixed bench (Figure 5). The input command of the ESC is in PWM (pulse width modulation) that varies from 0 to 100% of thrust. A load cell measured the thrust force, providing the data required to derive the calibration curve relating PWM and thrust. A typical step response curve is shown in Figure 6, for 4 N of thrust force in model scale. The signal patch highlighted in red marks the sample range used for computing the mean force for that specific PWM value. A non-negligible rise time of approximately 0.8 s can be observed in the measurement, but one must note that, in this case, the propeller starts from rest, whereas during the experiments in waves the dynamic modulation of thrust occurs around a mean value, with variations that are generally only a small percentage of the mean thrust.
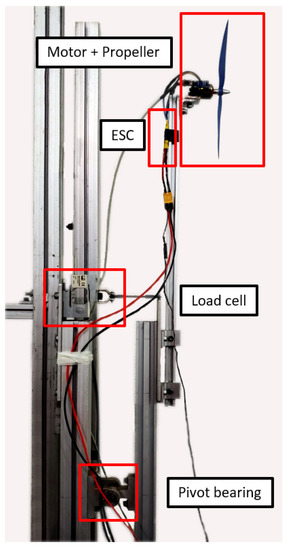
Figure 5.
Bench calibration of wind thrust actuator.
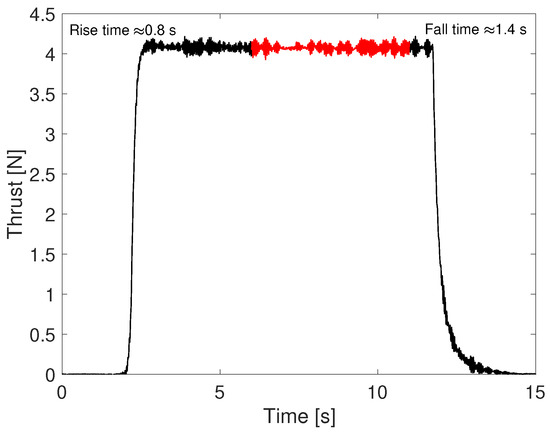
Figure 6.
Typical actuator step response of 6000 RPM.
To attest that time-delays would not undermine the rotor effects in the wave tests, a second set of bench experiments was conducted in which the input signal generated by the BEMT routine in the white-noise wave tests was used to measure the actuator response. The BEMT was adjusted to execute wind speed of 11.6 m/s. Figure 7 shows the thrust time traces for two test repetitions. A fair reproduction of the forces was observed during the whole experiments. The difference of the force measured by the load cell and the required one was generally below 10 kN with peaks of 20 kN (0.019 N and 0.039 N in model scale, respectively), for mean thrust of more than 600 kN. Another result observed is the frequency response of the actuator. In Figure 8, the transfer function could be observed as a bode plot in the range of the white-noise wave energy, from 0.0385 Hz to 0.15 Hz. It is notable that the phase is not shifted in high frequencies. It remains in a band of 10 deg apart from the input command. The magnitude loss was reasonably adjusted to an exponential decay-like exp(-2.9*f). However, it is possible to note that in the low frequency range, corresponding to periods higher than 20 s, the actuator loss is negligible [24]).
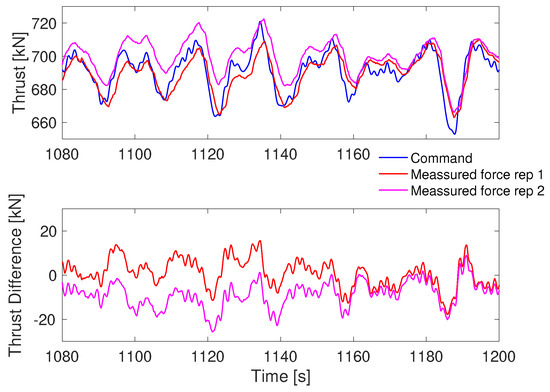
Figure 7.
Time domain response of wind thrust actuator.
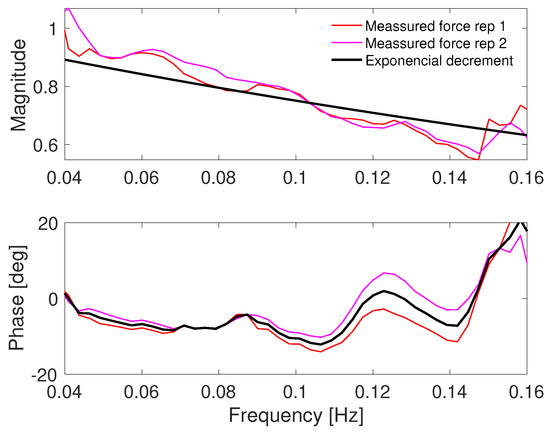
Figure 8.
Frequency domain response of wind thrust actuator.
2.5. Wind Turbine Characterization
The NREL 5 MW reference wind turbine [17] was considered in the tests. Two different wind velocities were tested: 7.8 m/s (intermediate condition in the power output curve) and 11.6 m/s (maximum thrust force). The optimized power output curve of the turbine is shown in Figure 9.
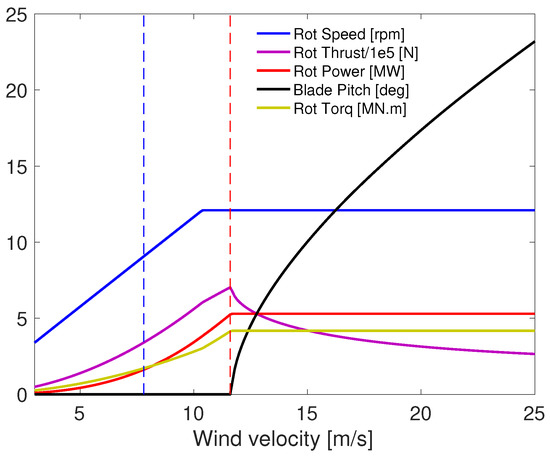
Figure 9.
Wind turbine response curve.
It is important to mention that no active rotor control effects were considered during the tests. The rotor speed is taken as constant for each wind velocity and no changes of blade-pitch are modeled, even for the higher wind velocity (11.6 m/s). The variations in thrust therefore arise exclusively from the change in the apparent wind velocity induced by the tower motions.
2.6. Numerical Model
The Jappaku floater dynamics in waves was numerically evaluated in the frequency domain by the radiation-diffraction code WAMIT® [25]. Hull geometry and mass/inertia matrix were pre-computed using Edtools® through parametric structure modeling [26]. In the numerical mesh, hull columns were represented by high-order surfaces with panel size 5, while the heave plates were modeled using dipole panels (zero-thickness). Figure 10 brings the panels limits adopted for the WAMIT® mesh. The mass/inertia matrix adopted for the analysis of the FOWT in even-keel configuration (no ballast shift) is presented in Equation (1) (in ton and m). As discussed in Section 3, a second numerical model was constructed, considering a heeled mesh, as presented in Figure 11, and with a similar correction of the ballast mass made in the physical model. In addition, the linearized external mooring stiffness was taken into account considering the six dof, with the stiffness matrix computed by means of the analytical formulation proposed in [27]. As shown in Section 3, the mooring system stiffness dependency on both the floater mean position and the mean attitude of the platform (trim/heel) had to be considered for a proper modeling of the motions. Finally, the viscous effects arising from both hydrodynamic and aerodynamic loads were included in an external linearized damping matrix, whose calibration will be discussed ahead.
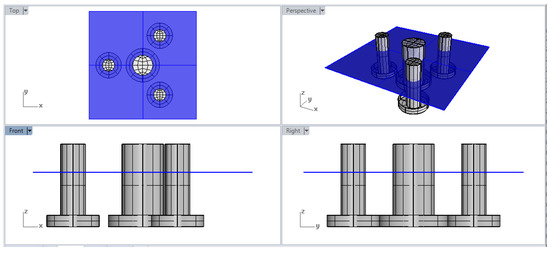
Figure 10.
High-order mesh of columns and heave plates—Even keel.
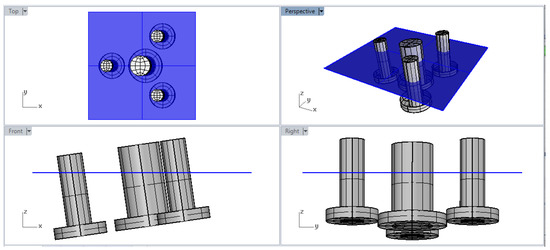
Figure 11.
High-order mesh of columns and heave plates—Heeled.
For computing the effects of the rotor forces in frequency-domain, a linearized approach already applied by [18,19] was adopted. Considering the thrust force represented in Equation (2), and observing that the apparent wind speed at the rotor axis results from the composition of the steady wind and the periodic velocities induced by the floater surge and pitch motions at the hub position (Equation (3)), the wind force is derived.
being A the turbine disk area, the thrust coefficient and V the apparent wind speed
with denoting the mean (absolute) wind speed and L the distance from CG to the rotor hub. and are the surge and pitch motions of the floater, which, since the model is linear, oscillate at the same angular frequency as the incoming waves. Hence, it is possible to relate the thrust fluctuations to the rigid-body velocities and, consequently, to the floater RAOs:
Equation (4) is derived assuming that the variations in rotor thrust are instantaneous, meaning that there are no phase shifts as the ones that might be produced, for instance, by changes in blade pitch. This means that the rotor forces are in phase with the floater velocities, acting as an (external) aerodynamic damping. Regarding coefficient , it can be extracted directly from the response curve of the turbine, illustrated in Figure 9.
In the results presented in the next section, it was assumed that this aerodynamic damping was the main source of external damping regarding the floater pitch motions, and its effects were taken into account by considering the external damping coefficients and in the WAMIT® model (further details in Section 3.2).
3. Results and Discussion
This section presents the main experimental results and discusses the strategies adopted to reproduce them in the numerical model. Firstly, the effects of wind forces on surge, heave and pitch natural periods obtained from decay tests are investigated and comments on the hull mean position and attitude are drawn. Response in waves are presented in Section 3.2, aiming to study the concomitant effect of not aligned wave and wind. For the present study, the angle between waves and wind is 30°, as shown in Figure 12.
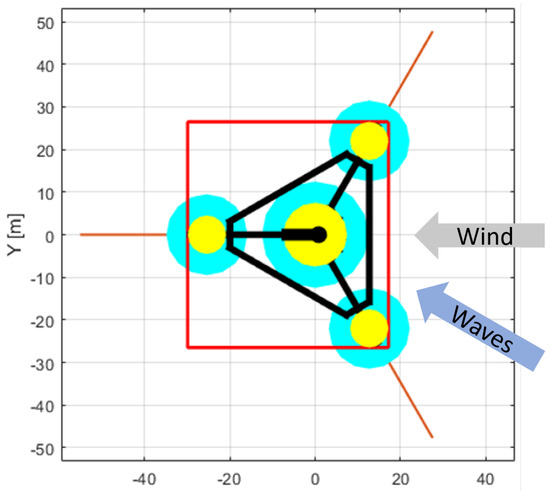
Figure 12.
Wind and wave incidences with respect to the Jappaku Hull.
3.1. Decay Tests
Decay tests were carried out to assess natural periods and damping levels. Table 3 brings the experimental results for natural periods for surge, heave and pitch motions. Three wind velocities were considered—no wind, m/s and m/s. In addition, two different initial inclination angles of the floater were taken into account: even keel and +5° trim (hereafter, the latter condition will be denoted by “with trim adjustment (TA)”). The TA was adopted in the tests to reduce the mean tilt angles for m/s and m/s wind conditions, thus emulating the effects of a ballast compensation. Table 4 presents the mean surge and mean trim angles for both conditions, with and without TA.
Table 3.
Experimental results for surge, heave and pitch natural periods for each wind condition.
Table 4.
Experimental results for mean surge and hull trim for different wind conditions with and without trim adjustment (TA).
The wind thrust force induces significant changes in the surge and pitch natural periods obtained from the decay tests. In fact, similar results are found in the literature [19,28,29]. However, the origins of surge and pitch shifting in period are different. Due to the mean thrust load, the FOWT platform drifts to a mean point far from the trivial unloaded position. As discussed by [27,30], the new equilibrium position changes the mooring system stiffness, mainly for horizontal motions, as they are the most affected by mooring restoring forces. Figure 13 brings the stiffness-offset relation, considering different tilt angles of the floater, for surge, pitch and heave motions only (possible couplings included). Notice that the plots in Figure 13 represent the coefficients of the 3 × 3 symmetric mooring system stiffness matrix ([27]). As a consequence of this change, the natural periods also change. Table 5 presents the comparison between the natural periods estimated from the decay tests and those predicted by the numerical model. Mass/inertia and hydrostatic stiffness matrices were computed using Edtools® with added mass matrix obtained from WAMIT®.
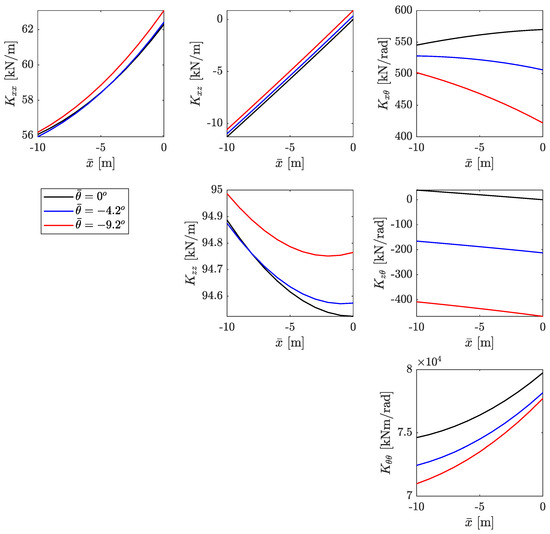
Figure 13.
Mooring system stiffness coefficients as functions of surge offset and mean trim.
Table 5.
Surge, heave and pitch natural periods for each wind condition (without trim adjustment).
The natural periods numerically obtained present a fair agreement with experimental data for surge and heave motions, but the same cannot be said regarding the pitch motion. For surge motion, the WAMIT® model with the adjusted mooring stiffness (from 62 kN/m to 56 kN/m) predicts the physical model response quite well. In Figure 13, it is notable how the mean offset and attitude of the system change the stiffness coefficients, with the offset, being the principal reason for period changing. In turn, changes in the mooring stiffness or phase shifts of the rotor loads do not seem to explain the reduction observed for the pitch period and further investigation on this issue is needed.
Finally, Table 6 brings the values of the linear and quadratic damping coefficients derived from the free decay measurements together with the values of the linearized damping coefficients. The linear and linearized dampings are expressed as a percentage of the critical damping for each dof, while the quadratic damping coefficients are presented as a percentage of the mass/inertia of the respective dof. The estimation of the damping levels followed the procedures presented in [31]. The thrust force notably increases the surge and pitch damping ratios. This effect is even more pronounced in the latter. Regarding the quadratic terms, the damping coefficient (i.e., proportional to the square of the velocity) is the most affected by the increase of wind velocity. For the linearized damping model, the result indicates that the linearized damping ratio also grows with the wind velocity for surge and pitch, but remains practically unchanged for heave motion. It is important to emphasize that the results present similar trends concerning the ones presented by [19].
Table 6.
Experimental results for surge, heave and pitch linear and quadratic, and linearized damping ratios for each wind condition.
3.2. Responses in Waves
For assessing the concomitant effects of wind and waves, Response Amplitude Operator (RAOs) were derived from the experimental white-noise type wave test. Figure 14 depicts the heave and pitch RAOs, for all the three wind conditions tested: no wind, m/s and m/s. Only the cases without TA are shown at this first moment.
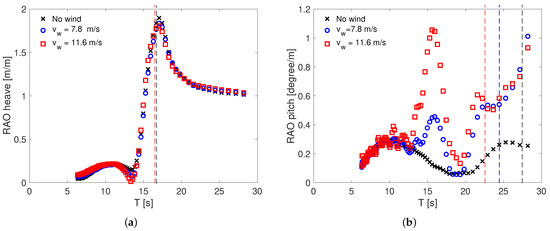
Figure 14.
Concomitant effects of wind and waves on the RAO at different wind velocities (without TA): (a) heave and (b) pitch. The dashed lines represent the experimental natural periods from Table 5.
The pitch RAO is observed to substantially change with the wind thrust, similarly to what could be inferred from decay tests. It is also remarkable that the pitch response for the conditions with wind in Figure 14b present an additional peak at T ≈ 16 s (i.e., near natural period in heave) when compared to the no wind case, pointing to a relevant coupling effect between heave and pitch. Furthermore, a significant increase in the resonant response can be readily identified.
The reasons for the heave-pitch coupling were first experimentally investigated. For this, the two trim conditions presented in Table 4 are considered: with and without TA. Figure 15 brings pitch RAO for wind velocities m/s and m/s. Mean trim angles for both velocities are shown in the legend.
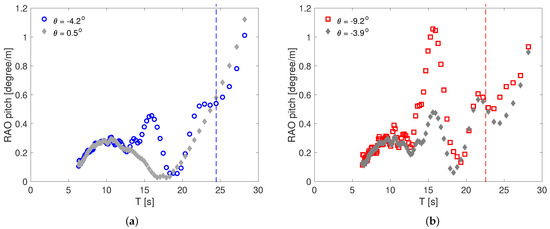
Figure 15.
Concomitant effects of wind and waves on the RAO with and without TA: (a) m/s and (b) m/s. The dashed lines represent the experimental natural periods from Table 5.
By comparing the results, it is possible to realize that the effect induced by ballast changing is remarkable, especially in Figure 15a, as the adjusted trim for m/s leads to a pitch response that is almost the same observed for the no wind condition. From Figure 15b, it is possible to conclude that the heave-pitch coupling increases significantly with the mean trim angles.
In order to better understand the behavior of the wave test, a progressive approach for the corrections of the numerical model will be presented next. Firstly, the platform tilt is investigated. Then, hydro and aerodynamic related damping coefficients are proposed. The following paragraphs present the results of this sequence of changes when taking into account the worst wind case in terms of trim, that is, m/s.
The effect of the trim angle was investigated by means of the construction of two numerical meshes: one in even keel condition and another with the proper trim . Figure 16 brings the comparison between the numerical predictions with both meshes and the experimental heave and pitch RAOs. Marked curves and full lines represent experimental and numerical results, respectively. Both, no wind (in black) and m/s (in red) are presented. Note the that the only effect of the wind on the numerical model up to this point is the heeled mesh. It is also important to mention that the proper mooring system stiffness (i.e., taking into account the mean offset and attitude of the platform) was considered for the WAMIT® model.
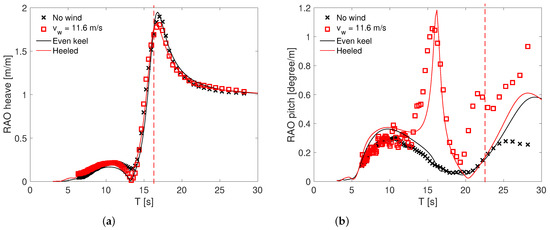
Figure 16.
Numerical and experimental RAO for concomitant wind and waves for m/s (without TA): (a) heave and (b) pitch. The dashed lines represent the experimental natural periods from Table 5.
From Figure 16b, the mean potential effects arising from the hull tilt can be concluded to indeed be the main responsible for the appearance of the additional peak near the heave natural frequency. In practice, this effect can be mitigated by using an active control of the floater ballast, or at least in part if a static mean tilt is adopted as a design measure in view of the prevalent wind directions. However, if higher tilt angles of the FOWT are tolerated, these results indicate that additional caution should be taken in the numerical modelling to avoid inaccuracies in the motion predictions.
Still from Figure 16b, it is remarkable that simply modeling the structure with proper trim is not sufficient to recover the motion amplitudes for periods higher than 18 s. In fact, one may readily notice that the canceling frequency and peaks from the numerical model are not yet in good agreement with the experiments. Thus, a second step for the numerical modeling was to introduce a proper adjustment of external damping coefficients, both from aero and hydrodynamic sources, based on the test data and the wind turbine response curve. Special care was taken for the off-diagonal terms, responsible for coupling effects. Surge and pitch motions are well known to be often strongly coupled for FOWT structures, but the experiments indicate that external heave-pitch damping coefficients are also relevant. As mentioned before, this coupling is more significant the larger the trim angle is. Then, both surge-pitch and heave-pitch damping coefficients seem to be necessary to reproduce the cancellation point and peaks observed in the experiment, as illustrated by Figure 17.
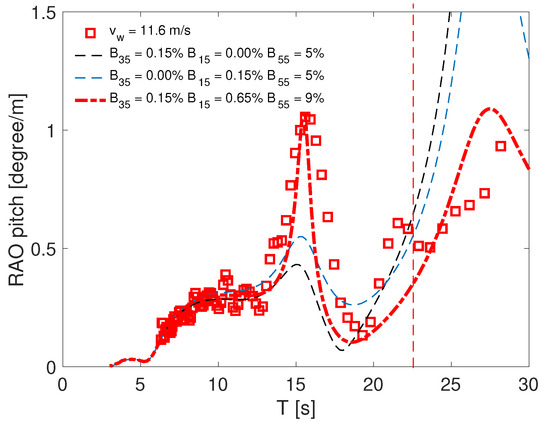
Figure 17.
Numerical damping adjustment based on the test data and the wind turbine response curve.
The main hypothesis for the heave-pitch external damping term is that it is due to hydrodynamic viscous drag, which is not computed by a potential flow tool such as WAMIT®. By modeling the structure with Morison’s elements and linearizing the quadratic drag force with the statistical linearization approach discussed in [32], a preliminary quantification of this damping coefficient was made, apparently with good results. However, this procedure still requires a thorough validation and thus these results will not be used here. Finally, following the formulation presented in Section 2.6, a proper calibration of the aerodynamic damping coefficients was made. For that, the computed value of kN/(m/s) was considered based on the rotor dimensions and the mean wind speed of 11.6 m/s; Then, with the hub height m, the damping coupling terms for surge-pitch were defined as kN s and kNm s. In turn, the heave-pitch coupling was empirically defined as kN s. Figure 18 brings the final calibration of the numerical pitch RAOs, now taking into account these external damping coefficients. Even though some discrepancies still persist for wave periods above 20 s, the predicted amplitudes are now much closer than the ones obtained with the initial version of the numerical model whose calibration was made exclusively based on no wind conditions.
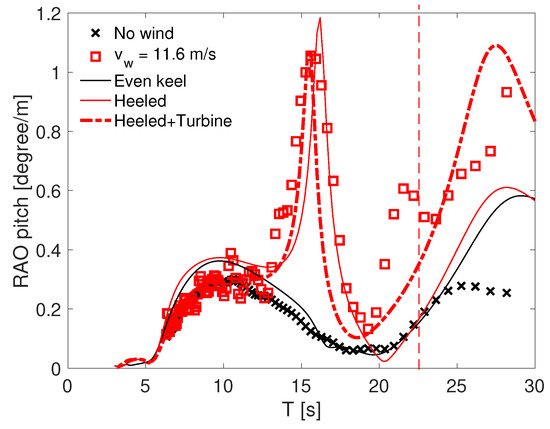
Figure 18.
Final numerical model calibration versus experimental data (without TA). The dashed lines represent the experimental natural periods from Table 5.
In summary, the analysis above indicates that the region close to wave periods of 15 s is mostly affected by the floater tilt angle, whereas for periods above 20 s up to the pitch natural period the aerodynamic rotor coupling is more important. The response in this region also suffers a strong influence of the quadratic viscous damping terms and, therefore, different adjustments would be needed for different wave heights.
4. Conclusions
Experimental and numerical results for a four-column semisubmersible FOWT concept under concomitant effects of not aligned wave and wind were presented. Wind was emulated by means of an actively controlled fan, using a SIL scheme. The model drifts were restrained by a set of three catenary mooring lines, with anchors placed at the basin floor. The test conditions induced different tilt levels to the floater which were only partly compensated by ballast adjustment or not compensated at all. Thus, a diverse scenario in which different combinations of mean offset, floater tilt, rotor thrust and wave loads were tested.
Decay tests in still water were conducted for conditions with and without wind, rendering the effects of rotor thrust on the resonant periods of oscillation evident. The changes were particularly significant for the surge drift, for which a considerable reduction of the natural period was observed. This was in agreement with previous observations made in the literature, and it was possible to demonstrate that the main cause for this change was the (nonlinear) variation of the mooring stiffness induced by the floater offset from its neutral position, mainly for surge motion. On the other hand, the shift in the pitch resonant period seems to result from couplings with other dof, caused by both hydro and aerodynamic effects. Relevant changes in the level of surge and pitch damping due to the aerodynamic damping produced by the rotor were also observed in the decay tests.
Responses in waves were investigated for an irregular white-noise type wave. Different coupling effects were found, specially in the pitch RAO. In order to further investigate the behaviour observed in the model tests, different versions of the linear hydrodynamic model were considered. Platform tilt was the main reason for a heave-pitch coupling, near the heave natural period. In fact, the changes in the potential added-masses and radiation damping induced by the floater inclination accounted for a considerable part of the changes observed in the pitch motions. However, if no further changes were made, significant discrepancies in the pitch response still remained. A better agreement with the experimental measurements were obtained when considering estimated values of linearized aerodynamic damping coefficients ( and ) together with an off-diagonal heave-pitch coefficient () empirically adjusted.
In summary, the results presented herein show that correcting the frequency-domain model that accounts for the FOWT motions in waves may be a hard task, especially if a relatively large inclination of the floater is considered acceptable (for example, for concepts with no active ballast compensation). This may be particularly important concerning the parametric optimization of the floater geometry, a procedure that is often envisaged for the early design of such devices. In this case, extra care must be taken for guaranteeing that the inaccuracies in the motion transfer functions do not undermine the predictions of important quality parameters such as the nacelle accelerations and maximum angles of inclination. However, optimization procedures are not the only concern. In fact, oftentimes the analysis of the seakeeping behavior of a particular FOWT is performed by means of time-domain simulations that also rely on pre-computed hydrodynamic coefficients obtained in the frequency domain. Again, as can be inferred from the results herein, the inaccuracies in the motion responses may be large due to the nonlinearities induced, for instance, by the variations in mooring configuration and inclinations of the floater.
Author Contributions
Conceptualization, A.N.S., E.B.M. and G.R.F.; methodology, E.B.M., G.A.A., I.F.A., L.H.S.d.C. and P.C.M.; software, E.B.M., G.A.A. and P.C.M.; validation, E.B.M. and G.A.A.; formal analysis, E.B.M., G.A.A. and L.H.S.d.C.; investigation, E.B.M., G.A.A., I.F.A., L.H.S.d.C. and P.C.M.; resources, A.N.S.; data curation, E.B.M., G.A.A., I.F.A. and L.H.S.d.C.; writing—original draft preparation, A.N.S., G.A.A. and P.C.M.; writing—review and editing, A.N.S., G.R.F. and R.T.G.; visualization, G.A.A.; supervision, G.R.F.; project administration, G.R.F.; funding acquisition, A.N.S., G.R.F. and H.S. All authors have read and agreed to the published version of the manuscript.
Funding
This work was developed in the context of the Brazil-Japan collaborative research project n.88887.153223/2017-00 funded by the Brazilian Coordination for the Improvement of Higher Education Personnel (CAPES) and the Japan Society for Promotion of Science (JSPS).
Acknowledgments
Alexandre Simos acknowledges his Research Grant from the Brazilian National Council for Scientific and Technological Development (CNPq). Lucas H. S. Carmo acknowledges CAPES for his PhD grant (Finance code-001).
Conflicts of Interest
The authors declare no conflict of interest.
References
- Sclavounos, P.; Tracy, C.; Lee, S. Floating Offshore Wind Turbines: Responses in a Seastate: Pareto Optimal Designs and Economic Assessment; Department of Mechanical Engineering – Massachusetts Institute of Technology: Cambridge, MA, USA, 2007. [Google Scholar]
- Hall, M.; Brad Buckham, B.; Curran Crawford, C. Evolving Offshore Wind: A Genetic Algorithm-Based Support Structure Optimization Framework for Floating Wind Turbines. In Proceedings of the OCEANS’13 MTS/IEEE, Bergen, Norway, 23–27 September 2013. [Google Scholar]
- Hall, M.; Brad Buckham, B.; Curran Crawford, C. Hydrodynamics-based floating wind turbine support platform optimization: A basis function approach. Renew. Energy 2014, 66, 559–569. [Google Scholar] [CrossRef]
- Roddier, D.; Cermelli, C.; Aubault, A.; Weinstein, A. Windfloat: A floating foundation for offshore wind turbines. J. Renew. Sustain. Energy 2010, 2, 033104. [Google Scholar] [CrossRef]
- Hall, M.; Moreno, J.; Thiagarajan, K. Performance Specifications for Real-Time Hybrid Testing of 1:50-Scale Floating Wind Turbine Models. In Proceedings of the ASME 2014 33rd International Conference on Ocean, Offshore and Arctic Engineering, San Francisco, CA, USA, 8–13 June 2014. [Google Scholar]
- Saude, T.; Chabaud, V.; Thys, M. Real-Time Hybrid Model Testing of a Braceless Semi-Submersible Wind Turbine: Part I—The Hybrid Approach. In Proceedings of the ASME 2016 35th International Conference on Ocean, Offshore and Arctic Engineering, Busan, Korea, 19–24 June 2016. [Google Scholar]
- Azcona, J.; Bouchotrouch, F.; Gonzáles, M.; Garciadía, J.; Munduate, X.; Kelberlau, F.; Nygaard, T.A. Aerodynamic Thrust Modelling in Wave Tank Tests of Offshore Floating Wind Turbines Using a Ducted Fan. J. Phys. Conf. Ser. 2014, 524. [Google Scholar] [CrossRef]
- Battistella, T.; Paradinas, D.D.; Urbán, A.M.; Garcia, R.G. High Fidelity Simulation of Multi-MW Rotor Aerodynamics by Using a Multifan. In Proceedings of the ASME 2018 37th International Conference on Ocean, Offshore and Arctic Engineering, Madrid, Spain, 17–22 June 2018. [Google Scholar]
- Azcona, J.; Bouchotrouch, F.; Vittori, F. Low-frequency dynamics of a floating wind turbine in wave tank–scaled experiments with SiL hybrid method. Wind Energy 2019, 22, 1402–1413. [Google Scholar] [CrossRef]
- Urbán, A.M.; Guanche, R. Wind turbine aerodynamics scale-modeling for floating offshore wind platform testing. J. Wind Eng. Ind. Aerodyn. 2019, 186, 49–57. [Google Scholar] [CrossRef]
- Stewart, G.; Muskulus, M. A Review and Comparison of Floating Offshore Wind Turbine Model Experiments. Energy Procedia 2016, 94, 227–231. [Google Scholar] [CrossRef]
- Chen, P.; Chen, J.; Hu, Z. Review of Experimental-Numerical Methodologies and Challenges for Floating Offshore Wind Turbines. J. Marine. Sci. Appl. 2020, 19, 339–361. [Google Scholar] [CrossRef]
- Gueydon, S.; Bayati, I.; de Ridder, E.J. Discussion of solutions for basin model tests of FOWTs in combined waves and wind. Ocean. Eng. 2020, 209, 107288. [Google Scholar] [CrossRef]
- Gonçalves, R.T.; Franzini, G.R.; Simos, A.N.; Neto, A.G.; Mello, P.C.; Carmo, B.S.; Nishimoto, K.; Malta, E.B.; Vieira, D.P.; Carmo, L.H.S.; et al. A Brazil-Japan Collaboration on a Conceptual Design of a Floating Offshore Wind Turbine for the São Paulo Coast. In Proceedings of the 27th International Congress on Waterborne Transportation, Shipbuilding and Offshore Constructions, Rio de Janeiro, RJ, Brazil, 23–25 October 2018. [Google Scholar]
- Mello, P.C.; Malta, E.B.; da Silva, R.O.P.; Candido, M.H.O.; do Carmo, L.H.S.; Alberto, I.F.; Franzini, G.R.; Simos, A.N.; Suzuki, H.; Gonçalves, R.T. Influence of heave plates on the dynamics of a floating offshore wind turbine in waves. J. Mar. Sci. Technol. 2020. [Google Scholar] [CrossRef]
- Carmo, L.H.S.; Mello, P.C.; Malta, E.B.; Franzini, G.R.; Simos, A.N.; Gonçalves, R.T.; Suzuki, H. ANALYSIS OF A FOWT model in bichromatic waves: An investigation on the effect of combined wave-frequency and slow motions on the calibration of drag and inertial force coefficients. In Proceedings of the ASME 2020 39th International Conference on Ocean, Offshore and Arctic Engineering, Virtual Conference, 3–7 August 2020. [Google Scholar]
- Jonkman, J.; Butterfield, S.; Musial, W.; Scott, G. Definition of a 5-MW Reference Wind Turbine for Offshore System Development. Available online: https://www.nrel.gov/docs/fy09osti/38060.pdf (accessed on 9 February 2021).
- Jonkman, J.M. Influence of control on the pitch damping of a floating wind turbine. In Proceedings of the ASME Wind Energy Symposium, Reno, NV, USA, 7–10 January 2008. [Google Scholar]
- Souza, C.E.; Bachynski, E.E. Changes in surge and pitch decay periods of floating wind turbines for varying wind speed. Ocean. Eng. 2019, 180, 223–237. [Google Scholar] [CrossRef]
- Gueydon, S. OC6 semisubmersible unde waves and constant thrust. In Proceedings of the Oral presentation at DeepWind 2021 Conference, Digital Conference, 13–15 January 2021. [Google Scholar]
- Technomar. EdtoolsX Users’s Manual. 2020. Available online: https://www.technomar.com.br/ (accessed on 9 February 2021).
- Mello, P.C.; Carneiro, M.L.; Tannuri, E.A.; Kassab, F., Jr.; Marques, R.P.; Adamowski, J.C.; Nishimoto, K. A control and automation system for wave basins. J. Mechatron. (Oxf.) 2013, 23, 94–107. [Google Scholar] [CrossRef]
- Ning, A. A Simple Solution Method for the Blade Element Momentum Equations with Guaranteed Convergence. Wind Energy 2014, 1327–1345. [Google Scholar] [CrossRef]
- Pegoraro, B. Modelagem aerodinâmica de turbinas eólicas flutuantes (in Portuguese). Master of Science Thesis, Escola Politécnica da Universidade de São Paulo, São Paulo, Brazil, 2020. [Google Scholar]
- WAMIT, Inc. WAMIT Users’ Manual - Version 7; WAMIT, Inc.: Chestnut Hill, MA, USA, 2012. [Google Scholar]
- Suzuki, H.; Shiohara, H.; Schnepf, A.; Houtani, H.; Carmo, L.H.S.; Hirabayashi, S.; Haneda, K.; Chujo, T.; Nihei, Y.; Malta, E.B.; et al. Wave and wind responses of a very-light fowt with guy-wired-supported tower: Numerical and experimental studies. J. Mar. Sci. Eng. 2020, 8, 841. [Google Scholar] [CrossRef]
- Amaral, G.A. Analytical Assessment of the Mooring System Stiffness. Master’s Thesis, Escola Politécnica da Universidade de São Paulo, São Paulo, Brazil, 2020. [Google Scholar]
- Goupee, A.J.; Kimball, R.W.; Dagher, H.J. Experimental observations of active blade pitch and generator control influence on floating wind turbine response. Renew. Energy 2017, 104, 9–19. [Google Scholar] [CrossRef]
- Bachynski, E.E.; Thys, M.; Sauder, T.; Chabaud, V.; Saether, L.O. Real-time hybrid model testing of a braceless semi-submersible wind turbine. Part II: Experimental results. In Proceedings of the ASME 2016 35th International Conference on Ocean, Offshore and Arctic Engineering, Busan, Korea, 19–24 June 2016. [Google Scholar]
- Pesce, C.P.; Amaral, G.A.; Franzini, G.R. Mooring system stiffness: A general analytical formulation with an application to Floating Offshore Wind Turbines. In Proceedings of the ASME 2018 1st International Offshore Wind Technical Conference, San Francisco, CA, USA, 4–7 November 2018. [Google Scholar]
- Malta, E.B.; Gonçalves, R.T.; Matsumoto, F.T.; Pereira, F.R.; Fujarra, A.L.C.; Nishimoto, K. Damping Coefficient Analyses for Floating Offshore Structures. In Proceedings of the ASME 29th Internatiional Conference on Ocean, Offshore and Arctic Engineering, Shanghai, China, 6–11 June 2010. [Google Scholar]
- Silva, L.S.P.; Morishita, H.M.; Pesce, C.P.; Gonçalves, R.T. Nonlinear analysis of a heaving point absorber in frequency domain via statistical linearization. In Proceedings of the ASME 2019 38th International Conference on Ocean, Offshore and Arctic Engineering, Glasgow, UK, 9–14 June 2019. [Google Scholar]


Publisher’s Note: MDPI stays neutral with regard to jurisdictional claims in published maps and institutional affiliations. |
© 2021 by the authors. Licensee MDPI, Basel, Switzerland. This article is an open access article distributed under the terms and conditions of the Creative Commons Attribution (CC BY) license (http://creativecommons.org/licenses/by/4.0/).