Article

Average Degree of Coverage and Coverage Unevenness Coefficient as Parameters for Spraying Quality Assessment

Institute of Agricultural Engineering, Wrocław University of Environmental and Life Sciences, 37b Chełmońskiego Street, 51-630 Wrocław, Poland
*
Author to whom correspondence should be addressed.
Agriculture 2021, 11(2), 151; https://doi.org/10.3390/agriculture11020151
Submission received: 29 December 2020 / Revised: 4 February 2021 / Accepted: 9 February 2021 / Published: 12 February 2021
(This article belongs to the Special Issue Artificial Neural Networks in Agriculture)

Abstract

:
The purpose of the research was to determine the influence of selected factors on the average degree of coverage and uniformity of liquid spray coverage using selected single and dual flat fan nozzles. The impact of nozzle type, spray pressure, driving speed, and spray angle on the average degree of coverage and coverage unevenness coefficient were studied. The research was conducted with special spray track machinery designed and constructed to control and change the boom height, spray angle, driving speed, and spray pressure. Based on the research results, it was found that the highest average coverage was obtained for single standard flat fan nozzles and dual anti-drift flat fan nozzles. At the same time, the highest values of unevenness were observed for these nozzles. Inverse relationships were obtained for air-induction nozzles. Maximization of coverage with simultaneous minimization of unevenness can be achieved by using a medium droplet size for single flat fan nozzles (volume median diameter (VMD) = 300 μm) and coarse droplet size for dual flat fan nozzles (VMD = 352 μm), with low driving speed (respectively 1.1 m∙s−1 and 1.6 m∙s−1) and angling of the nozzle by 20° in the opposite direction to the direction of travel.

1. Introduction

The use of a chemical method of plant protection results in high yields with significant qualitative values. However, adverse effects may occur during the application of plant protection products. The use of chemicals may cause natural environment pollution, as well as operators of sprayers, are exposed to contact with spray liquid. Also, agricultural products can be contaminated by chemicals what is dangerous for consumers [1,2,3,4,5]. However, the spraying process is still one of the most difficult agrotechnical processes. Efforts have therefore been made to reduce the negative effects for human health and the environment. These activities include the use of air-induction nozzles, the use of decision support tools [1,6,7,8], and injection into trunk trees of plant protection products [9]. In addition, the use of the latest advanced sprayers equipped with various sensors reduces the risk of hazards [10,11]. Scientists have also presented results of research on the exposure of bystanders to the drift liquid. Based on the conducted research, it was shown that adjustment parameters of a sprayer to meteorological conditions result in a reduction of exposure of bystanders. The experiments were carried out in vineyards located in mountainous areas during windless weather [12]. Similar studies were conducted by Butler-Ellis et al. and Kennedy et al. in field and orchard conditions. Scientists developed models that describe pesticide exposure in the short and long terms [13,14,15]. Moreover, the necessity to conduct experiments in regard to epidemiological research was emphasized [16]. The nature of problems in the field of plant protection and the need to take action to reduce them was emphasized by the Food and Agriculture Organization FAO, which established the year 2020 as the International Year of Plant Health.
Research into the modeling of spray drift and the optimization of the spraying process has progressed considerably in recent years. On the basis of the conducted research, scientists have emphasized the importance of knowledge about spray drift. The researchers pointed out, above all, the need for further work on drift curves under field conditions. Emphasis was also placed on the establishment of a system for EU Member States to prevent diffuse contamination.
Baldoin, Friso, and Pezzi, in their studies, used two adjuvants and performed the experiments at wind speed 1, 3, 5 m/s−1, relative humidity 30%, 50%, and 70% at a temperature of 27 °C. On the basis of the conducted experiments, it was found that by the use of adjuvants, the droplet spectrum was modified by eliminating fine and very fine droplets. Thus, the predictions of mathematical modeling were confirmed [17,18,19], while Griesang et al. conducted a study to assess the spray drift potential [20]. Three types of nozzles were selected for testing: air-induction single flat fan, standard dual flat fan, and hollow cone at a pressure of 300 kPa. The application liquid consisted of glyphosate and a combination of glyphosate and adjuvant. Based on the conducted experiments, it was found that after adding the adjuvant to the liquid, the drift of the liquid was reduced by about 40% when using standard dual nozzles. On the other hand, in the case of using an air induction single nozzle, the addition of the adjuvant did not affect the drift, despite the increase in volume median diameter (VMD) value and improvement of droplet uniformity.
Many researchers have developed model-based computational fluid dynamics (CFD). Research has been conducted mainly in orchard crops as well as in greenhouses. CFD modeling has been the dominant technique in the design of air-assisted sprayers in recent years. Duga et al. and Salcedo et al. presented the results of research carried out in orchard crops. The authors presented a 2D and 3D computational model of fluid dynamics (CFD). The model took into account the tree habit and wind flow in the tree crown as well as the speed of the sprayer. On the basis of the model, the amount of liquid carried into the atmosphere (air drift) and into the soil (sedimentation drift) was calculated [21,22].
The aim of the research conducted by Gregorio et al. was to evaluate the drift reduction potential for hollow cone nozzles using light detection and ranging (LiDAR) technology. Based on the analysis of the results of this work, it was concluded that the LiDAR technique is an advantageous alternative in the evaluation of spray drift potential reduction [23,24].
Methods and algorithms of artificial intelligence are increasingly popular and very useful for solving various problems in agriculture. Some of these techniques have been employed for mathematical modeling of complex and nonlinear relationships, prediction, classification, and optimization. Thanks to artificial intelligence algorithms, complex agricultural ecosystems can be better described and understood. Wen et al. developed an unmanned aerial vehicles variable spray system based on an error back propagation artificial neural network (ANN) [25]. The ANN was trained to predict droplet deposition based on environment temperature, humidity, flight speed and altitude, wind speed, prescription value, nozzle pitch, and propeller pitch. The system, which is a combination of ANN (stable and reliable model with a prediction error of less than 20%) and multi-sensor for collecting real-time information about the spraying process, was successfully used for variable spray operation under different conditions. The ANN predictor model useful for spraying process optimization in precision agriculture was presented by Azizpanah et al. [26]. They developed accurate models for predicting the volumetric median diameter and drift phenomenon. The accuracy of the models described by the coefficient of determination (R2) was higher than 90%. Yang et al. presented an approximate mathematical model of droplet drift for multirotor plant protection unmanned aerial vehicles [27]. In this model, a radial basis neural network was combined with computational fluid dynamics to better understand the influence of droplet size and windward airflow on the movement of droplets. In the work of Zhai et al. a precision farming system based on a combination of genetic algorithm and particle swarm optimization algorithm was proposed [28]. This system was validated through simulations of precise pesticide spraying. In these simulations, unmanned aerial vehicles were used as agents and were expected to complete the mission of precise pesticide spraying cooperatively. The aim of the mission was to optimize benefits and costs.
Many researchers have emphasized that the quality and effectiveness of the spraying procedure depends on the uniformity of the spray liquid fall, the coverage of the sprayed objects [29,30], and the application of the spray liquid [31]. Both the degree of coverage and the application of utility liquid can be used to assess changes in spraying technique, verify selected parameters of the sprayer, and assess the work of nozzles, depending on technical and technological factors [32,33]. Analysis of existing research results indicates that there is a relationship between the degree of coverage and biological effectiveness. According to some scientists, 30% covering of plants with liquid provides satisfactory efficacy (for most plant protection products). The assessment of the quality of sprayers and nozzles based on the coverage of sprayed objects is the fastest and simplest method [34]. The values of the degree of coverage are obtained after computer image analysis of the probes, which are most often water-sensitive papers [6,35,36].
However, the research does not show clearly whether this value applies to the average degree of coverage, calculated taking into account all components of the sprayed plants and in relation to systemic or contact pesticides.
According to the authors, the indicators presented above can serve as basic parameters for comparing the spraying equipment with various types of nozzles. Additional information useful in the assessment of the spraying procedure can be provided to the sprayer user by indicators proposed by the authors—average coverage of sprayed objects and coverage unevenness coefficient.
Therefore, the purpose of this research was to determine the impact of the type and size of the nozzles, liquid pressure, spray angle, and driving speed on the average degree of coverage and coverage unevenness coefficient, using various single and dual nozzles.

2. Materials and Methods

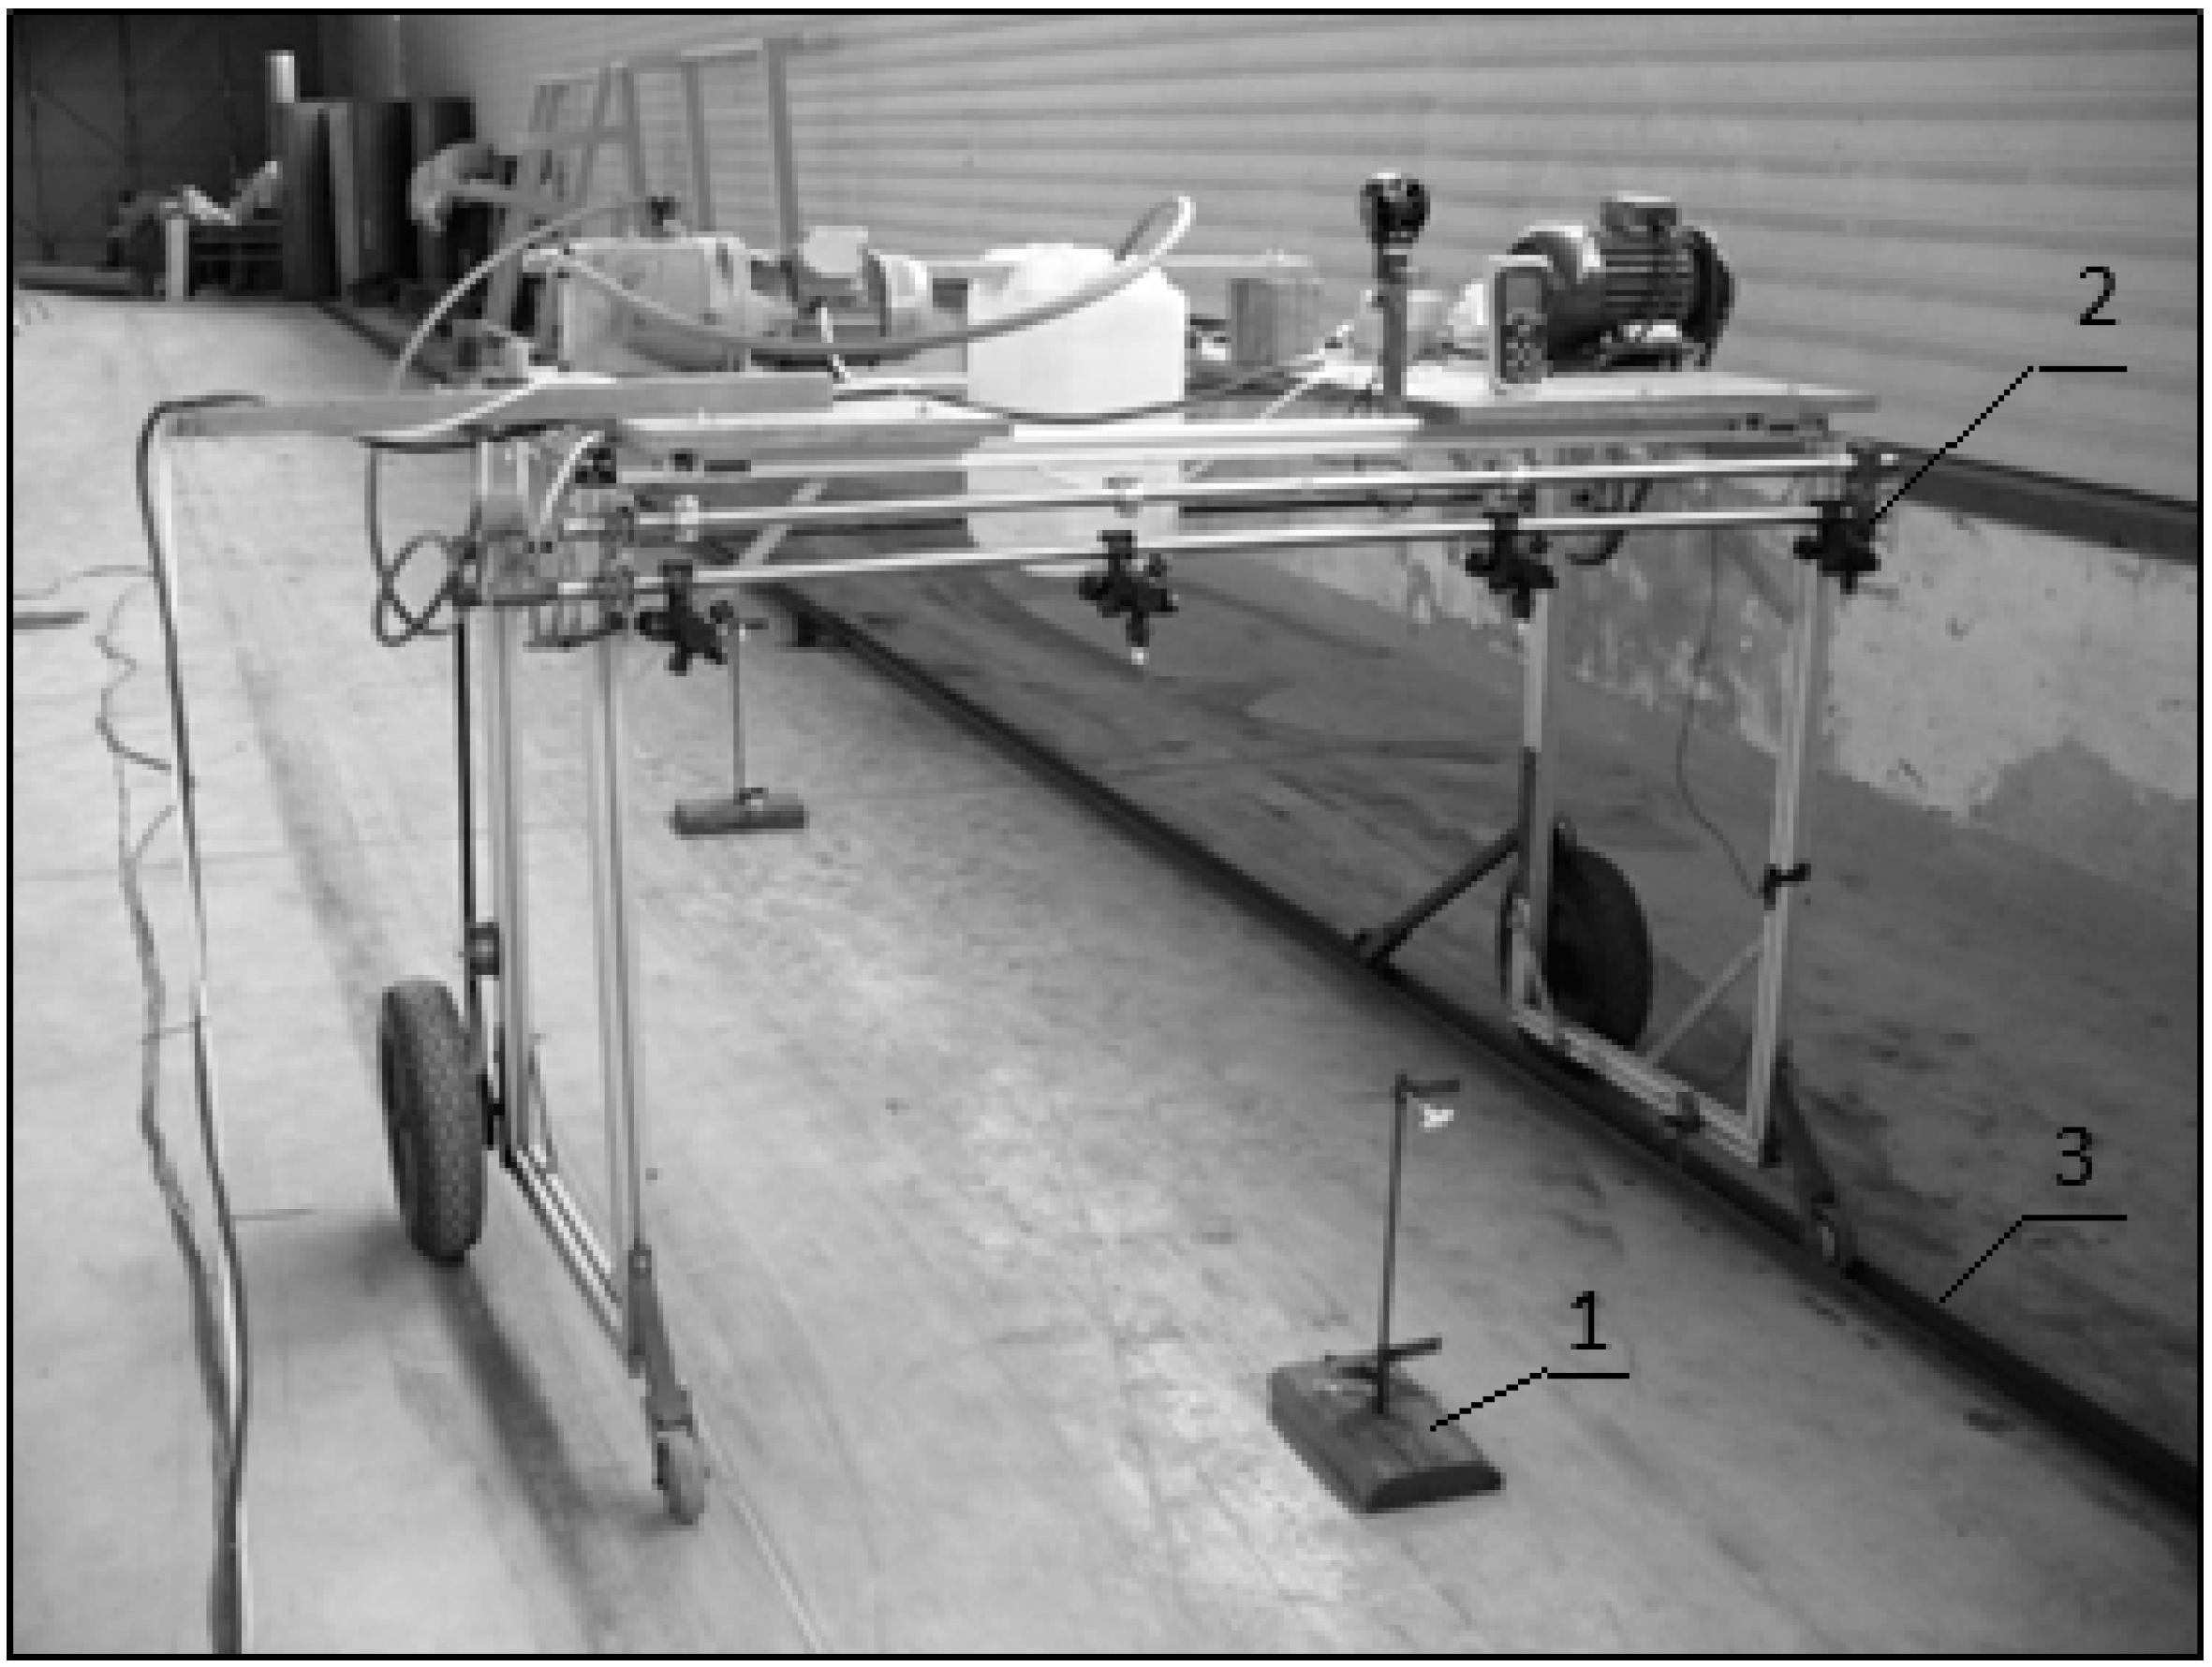
2.1. Experimental Set-Up

The following parameters of nozzles’ work were used for the research:
  • Pressure: 200, 300, and 400 kPa,
  • Height of boom: 0.5 m,
  • Spray angle, perpendicular to the ground: angled forward +20°, +10°, and 0° and backward −10°, and −20°
  • Driving speed: 1.1, 2.2, and 3.3 m·s−1,
  • Dose of liquid: 200 L·ha−1 (200 kPa), 240 L·ha−1 (300 kPa), 275 L·ha−1 (400 kPa))
Four types of nozzles were selected for testing: standard and air-induction single flat fan and anti-drift and air-induction dual flat fan. Standard nozzles are used in favorable weather conditions. A pre-orifice was applied to the anti-drift nozzle; thus, droplets would be larger and less prone to drift when compared with the standard nozzles. The largest, air-filled droplets were produced by the air-induction nozzles through the use of a Venturi air aspirator while reducing drift.
For each combination, the type of nozzle, and the pressure of the spray liquid, the droplet size was measured by laser diffraction method (Table 1). The Malvern Spraytech spray particle size analyzer was used for determining the droplet size distribution.
The tests were carried out under laboratory conditions. The test stand consisted of a device functioning as a self-propelled field sprayer and of artificial plants positioned along the machine’s route (Figure 1).
Three artificial plants as three replicates were placed under a spray boom. Water sensitive papers were attached to artificial plants to form specific surfaces: the upper horizontal level surface, the bottom horizontal level surface, the vertical transverse leaving surface, and the vertical transverse approach surface. The scheme of the test stand was presented in our previous publication [37].
The degree of coverage was obtained based on a computer image analysis in Photoshop CC 2019 software. Water-sensitive papers change color from yellow to dark blue after contact with water, making it possible to analyze them. The dimensions of the water-sensitive papers are 26 mm × 76 mm, and three fragments with an area of 100 mm2 were randomly selected for analysis. The degree of coverage was determined as the ratio of the surface covered with the liquid to the surface of the sampler.
P s p = A p c A p · 100   [ % ] ,
where: Psp—degree of coverage (%), Apc—surface covered with liquid (pixels), Ap—sampler surface (pixels)
The average degree of coverage was calculated as follows
χ P s p = P s p g + P s p n + P s p o n   [ % ] ,
where χPsp—average degree of coverage; Pspg—average degree of coverage of the upper horizontal level surface (%); Pspn—average degree of coverage of the vertical transverse approach surface (%); Pspo—average degree of coverage of the vertical transverse leaving surface (%); n—number of tests.
During the experiments, the bottom horizontal surface was not covered by liquid in any of the tests. Therefore, this surface was not taken into account in further analysis.
The coverage unevenness coefficient was calculated based on Equation (3) according to the formula [38]
η = 1 n 1 * i = 1 n ( P sp i χ P sp ) 2 χ P sp   [ ]
where η—coverage unevenness coefficient (−); Psp—degree of coverage of particular objects; χPsp—average degree of coverage of all objects; n—number of tests.

2.2. Neural Network Models

Artificial neural networks are a very popular tool from artificial intelligence methods used for mathematical modeling, classification, clustering, and other tasks. ANNs are particularly useful when multidimensional, nonlinear relationships must be analyzed. ANNs are composed of very simple units called artificial neurons. Each neuron produces its output signal based on a vector of input signals, a vector of synaptic weights, and its activation function. The most popular are nonlinear activation functions such as sigmoid and hyperbolic tangent functions. In this research, a multilayer perceptron (MLP) as a neural network was used. MLP is a feedforward artificial neural network and consists of at least three layers: an input layer, one or more hidden layers, and an output layer. MLP networks are usually trained by an error backpropagation algorithm, which uses small incremental changes in connection weights in each iteration. After the training process (usually several thousand training cycles), the vector of connections weights changes from initial, random values to minimize the error between actually calculated and target output vector. The MLP with one hidden layer was used for this neural model’s development. Four separate neural models were built, and for each model, the input signals were as follows: droplet size, driving speed, and spray angle. Two models were developed for single nozzles (with an average degree of coverage and coverage unevenness coefficient as an output signal). Analogous models were developed for the dual nozzles. To find the best MLP configuration for each model, 2000 ANNs were trained. The number of neurons in the hidden layer was changed from 10 to 40, different activation functions were used, and the matrix of initial synaptic weights was randomly generated. The experimental data were first normalized, and then the 270 data set was divided randomly into training, test, and validation sets at a 70:15:15 ratio. The accuracy of neural models was evaluated based on the coefficient of correlation (R), and the root mean squared error (RMSE), which are given by the following Equations (4) and (5)
R = ( Y m e a s Y ¯ m e a s ) ( Y p r e d Y ¯ p r e d ) ( Y m e a s Y ¯ m e a s ) 2 ( Y p r e d Y ¯ p r e d ) 2 ,
R M S E = 1 n i = 1 n ( Y p r e d Y m e a s ) 2 ,
where: Ypred—the absolute predicted value; Y ¯ p r e d —the average predicted value; Ymeas—the absolute measured (experimental) value; Y ¯ m e a s —the average measured value.
The accuracy of models is particularly important in the case of validation data set. One of the phenomena that can occur during the training process is overfitting. It occurs when the model is of great accuracy for the training data set (very best fit to the training data), but the accuracy for the validation data set is low. As a result, a neural network would not be able to generalize well to new data and is unsuitable for real-life applications.
Based on the best neural models, a sensitivity analysis was performed to indicate the contribution of the independent input variables in the models. For the simulations, the software Statistica v. 10 was used.

2.3. Optimization

The aim of the optimization process was to maximize the average degree of coverage and minimize the coverage unevenness coefficient at the same time. As an optimization method, a genetic algorithm (GA) implemented in the Excel 2013 Solver tool was chosen. The Excel Solver has been successfully applied for optimization procedures in prior literature. It was used by Barati in the estimation of nonlinear Muskingum routing parameters [39] and by Bhattacharjya for solving a groundwater flow inverse problem (estimation the unknown pumping rates of an aquifer, and estimation the aquifer transmissivity) [40]. The genetic algorithm is a search heuristic strongly inspired by nature, namely Charles Darwin’s theory of natural evolution. GA works based on a population of individuals—potential problem solutions. Every individual is a vector of parameters known as genes. A set of genes is called a chromosome, which is an encoded form of a solution. Genes can be coded in various forms: as binary numbers, as real numbers, or as text. In each algorithm iteration, the tree operations: selection, crossover, and mutation are performed on individuals. The general rule of the algorithm is to assess each individual based on an objective function that represents the solution quality and to find the individual having the best objective function. This individual is considered as an optimal and, after decoding, is interpreted as a solution. In this work, the objective function was constructed as follows:
y = χ P s p + ( 2 η ) ,
The objective function is the sum of two terms, the degree of coverage, which must be maximized, and the expression ( 2 η ) , which is related to the coverage unevenness coefficient, and maximization of this expression means coverage unevenness coefficient minimization. The values of χ P s p and η were calculated based on neural models of the best accuracy. The aim of the optimization process was to find values of droplet size, driving speed, and spray angle, which maximizes the objective function. The optimization was performed separately for single and dual nozzles. Parameters of the algorithm were set as follows: population size—100; mutation rate—0.075; convergence—0.0001; random seed—0; and maximum time without improvement—30.

3. Results and Discussion

The test results are shown in Figure 2, Figure 3, Figure 4, Figure 5, Figure 6 and Figure 7. Average coverage for various nozzles and spraying parameters is presented in Figure 2, Figure 3 and Figure 4. An extremely important value of the presented results of the experiments is to emphasize the differences in both the values of the degree of coverage and the unevenness index.
Taking into account the average coverage values, it should be stated that the liquid pressure influences this parameter. Moreover, higher values of the average coverage were recorded for single standard and dual anti-drift nozzles.
Only a few studies have presented the on average degree of coverage results in the aspect of field crops. Average coverage studies were conducted by Qin et al. in the cultivation of cotton [41]. The authors of this study concluded that three factors, horizontal boom height, hang boom sprayer, and nozzles angle, were influenced by the average degree of coverage. Dereń et al. presented research results of the average total degree of coverage. This was based on experiments that found that higher values were obtained for dual flat fan nozzles [42]. In another study, the type of nozzles as well as the speed of sprayer and pressure of liquid influenced on the degree of coverage [43,44].
The results of the coverage unevenness coefficients are shown in Figure 5, Figure 6 and Figure 7. The lowest values of this parameter, and thus the highest uniformity, are characteristic for dual air induction nozzles, regardless of the spraying conditions.
Analysis of the average coverage and uniformity of coverage were carried out, among others by Cai et al. in horticulture with the use of a fan sprayer equipped with a laser scanning system [45].
Based on the analysis of the experiments carried out by Musiu et al., it was found that reducing the liquid dose deteriorated the liquid coverage of plants but at the same time improved the homogeneity of distribution [33].
The four neural models were developed and then used for sensitivity analysis and the optimization process. The MLP structure and accuracy parameters for the best models obtained are presented in Table 2. The low values of residual mean square error (RMSE) error and high values of coefficient of correlation (R > 0.9) for the train, test, and validation data sets prove the high accuracy of all neural models.
Additionally, high values of R for the validation data set suggest that no overfitting effect occurred during the training process, and that models could be used in real-life applications.
Some mathematical models of the spraying process have been proposed in the literature. Baetens and coauthors proposed a 3D computational fluid dynamics model and a 2D diffusion-advection model for drift prediction [46,47]. The RTDrift model of spray drift was developed by Lebeau et al. [48]. These models included more input parameters than our model and took into account environmental parameters; however, their accuracy was lower. Li and coauthors proposed a prediction model of droplet coverage depending on droplet size, application distance, air delivery speed, and target leaf surface. The prediction accuracies of the model were 87.5%, 80%, and 100% for the three states of uniform, accumulation, and loss [31]. Slightly lower accuracies of neural models were obtained in our previous work, where the coverage of the three leaf surfaces was predicted based on droplet size, spray angle, and driving speed [49].
Based on the models presented in Table 2, a sensitivity analysis was performed to determine the parameters influencing the most and average degree of coverage and a coverage unevenness coefficient for single and dual nozzles. The results are presented in Figure 8 and Figure 9. In the case of both parameters, the average degree of coverage and the coverage unevenness coefficient, the most influencing parameter is droplet size, which depends on nozzle type and pressure. The influence of driving speed and nozzle angular position is significantly lower. These results are in agreement with those presented for the coverage of the sprayed surfaces where the vertical transverse approach surface, the vertical transverse leaving surface, and the upper level surface were analyzed separately [49].
The analysis of experimental data shows that in the case of single nozzles, the highest value of an average degree of coverage was observed for small droplet size (182.4 μm—produced by a single standard flat-fan nozzle with a pressure of 400 kPa), low driving speed (1.1 m∙s−1), and nozzle angular position of −20°. On the other hand, the lowest value of the coverage unevenness coefficient was produced by medium droplet size (400 μm—obtained from a single air-induction flat-fan nozzle with a pressure of 300 kPa), high driving speed (3.3 m/s−1), and nozzle angular position of 20°. Taking into account the average degree of coverage, a well known fact that the application of higher pressure results in a higher degree of coverage could be confirmed. At the same time, it can be concluded that standard nozzles have greater coverage unevenness compared to air induction nozzles. This is related to the range of coverage of individual horizontal and vertical surfaces. During the spraying process, there was significantly lower coverage on vertical surfaces and much higher coverage on horizontal surfaces obtained with single standard flat fan nozzles in comparison to single air induction flat fan nozzles. Therefore, greater uniformity of coverage was obtained when using single air induction flat fan nozzles.
The configuration of optimum parameters described above makes simultaneous optimization of the two indicators of spray process quality fairly difficult. As a result of the optimization carried out with the use of a genetic algorithm combined with neural models, the following optimum parameters of the spraying process were calculated: droplet size of 300 μm, driving speed of 1.1 m∙s−1, and nozzle angular position of −20°. For these parameters, the average degree of coverage equaled 35.54% (the range of experimental data was from 11.66% to 37.08%), and the coverage unevenness coefficient equaled 0.85 (the range of experimental data was from 0.80% to 1.25%). It can be stated that the spraying process parameters calculated in the optimization process give an average degree of coverage close to the maximum value and the coverage unevenness coefficient close to the minimum value.
In the case of dual nozzles, based on experimental data, it can be stated that the highest value of an average degree of coverage was observed for small droplet size (248.9 μm—produced by the dual anti-drift flat-fan nozzle with a pressure of 400 kPa), medium driving speed (2.2 m/s−1), and nozzle angular position of −20°. The lowest value for the coverage unevenness coefficient was produced by a large droplet size (542.8 μm—obtained from the dual air-induction flat fan nozzle with a pressure of 200 kPa), low driving speed (1.1 m/s−1), and nozzle angular position of −20°. When using dual flat fan nozzles, similar relationships were observed as in the case of using single flat fan nozzles. Based on the optimization process, the following optimum parameters of the spraying process could be proposed: droplet size of 352 μm, driving speed of 1.6 m/s−1, and nozzle angular position of −20°. For these parameters, the average degree of coverage equaled 28.32% (the range of experimental data was from 13.81% to 35.31%), and the coverage unevenness coefficient equals 0.71 (the range of experimental data is from 0.63 to 1.06). It can be stated that for single nozzles, the spraying process parameters produced by optimization gave an average degree of coverage and coverage unevenness coefficient closer to optimum values than in the case of dual nozzles. The optimum spraying parameters obtained in this work generally correspond to these proposed in our previous work, where the coverage of three sprayed surfaces (the vertical transverse approach surface, the vertical transverse leaving surface, and the upper level surface) was optimized [49].

4. Conclusions

The findings provide a practical basis for the selection of appropriate nozzle parameters to ensure the highest uniformity with the best average liquid coverage. The main results of this study are as follows:
The highest value for an average degree of coverage was observed when applied with a single standard flat fan nozzle with a pressure of 400 kPa and a dual anti-drift flat fan nozzle with a pressure of 400 kPa.
The air induction flat fan nozzles were characterized by greater uniformity of coverage.
Based on the optimization results (maximization of coverage and minimization of unevenness), the two combinations of spraying conditions can be proposed. The first is single air induction nozzles using a pressure above 400 kPa, driving speed of 1.1 m/s−1 and spray angle, perpendicular to the ground of −20°. The second is dual air induction nozzles at pressure above 400 kPa, driving speed of 1.6 m∙s−1 and spray angle, perpendicular to the ground of −20°.

Author Contributions

Conceptualization, B.C. and K.P.; methodology, B.C. and K.P.; software, B.C. and K.P.; validation, K.P.; formal analysis, B.C. and K.P.; investigation, B.C.; data curation, B.C. and K.P.; writing—original draft preparation, B.C. and K.P.; writing—review and editing, B.C. and K.P. All authors have read and agreed to the published version of the manuscript.

Funding

This research received no external funding.

Institutional Review Board Statement

Not applicable.

Informed Consent Statement

Not applicable.

Data Availability Statement

Not applicable.

Acknowledgments

The author would like to thank Antoni Szewczyk from the Institute of Agricultural Engineering, Wroclaw University of Environmental and Life Sciences, for his help in improving the methodological aspects of this research.

Conflicts of Interest

The authors declare no conflict of interest.

References

  1. Bourodimos, G.; Koutsiaras, M.; Psiroukis, V.; Balafoutis, A.; Fountas, S. Development and Field Evaluation of a Spray Drift Risk Assessment Tool for Vineyard Spraying Application. Agriculture 2019, 9, 181. [Google Scholar] [CrossRef] [Green Version]
  2. Ki-Hyun, K.; Ehsanul, K.; Shamin, J. Exposure to pesticides and the associated human health effects. Sci. Total Environ. 2016, 575, 252–535. [Google Scholar] [CrossRef]
  3. Fargnoli, M.; Lombardi, M.; Puri, D.; Casorri, L.; Masciarelli, E.; Mandić-Rajčević, S.; Colosio, C. The Safe Use of Pesticides: A Risk Assessment Procedure for the Enhancement of Occupational Health and Safety (OHS) Management. Int. J. Environ. Res. Public Health 2019, 16, 310. [Google Scholar] [CrossRef] [Green Version]
  4. Wilmart, O.; Legrève, A.; Scippo, M.L.; Reybroeck, W.; Urbain, B.; de Graaf, D.C.; Steurbaut, W.; Delahaut, P.; Gustin, P.; Kim Nguyen, B.; et al. Residues in Beeswax: A Health Risk for the Consumer of Honey and Beeswax? J. Agric. Food Chem. 2016, 64, 8425–8434. [Google Scholar] [CrossRef] [PubMed]
  5. Machado, B.B.; Spadon, G.; Arruda, M.S.; Goncalves, W.N.; Carvalho, A.C.P.L.F.; Rodrigues, J.F., Jr. A smartphone application to measure the quality of pest control spraying machines via image analysis. Assoc. Comput. Mach. 2018, 956–963. [Google Scholar] [CrossRef] [Green Version]
  6. Nansen, C.; Ferguson, J.C.; Moore, J.; Groves, L.; Emery, R.; Garel, N.; Hewitt, A. Optimizing Pesticide Spray Coverage Using a Novel Web and smartphone Tool, SnapCard. Agron. Sustain. Dev. 2015, 35, 1075–1085. [Google Scholar] [CrossRef]
  7. Li, W.; Xu, B.; Du, Y.; Mao, E.; Zhu, Z.; Li, Z. Auxiliary navigation system based on Baidu Map JavaScript API for high clearance sprayers. In Proceedings of the 2019 IEEE International Conference on Unmanned Systems and Artificial Intelligence (ICUSAI), Xi’an, China, 22–24 November 2019; pp. 160–165. [Google Scholar] [CrossRef]
  8. Szwedziak, K.; Niedbała, G.; Grzywacz, Ż.; Winiarski, P.; Doležal, P. The Use of Air Induction Nozzles for Application of Fertilizing Preparations Containing Beneficial Microorganisms. Agriculture 2020, 10, 303. [Google Scholar] [CrossRef]
  9. Berger, C.; Laurent, F. Trunk injection of plant protection products to protect trees from pests and diseases. Crop Prot. 2019, 124, 104831. [Google Scholar] [CrossRef]
  10. Samseemoung, G.; Soni, P.; Suwan, P. Development of a Variable Rate Chemical Sprayer for Monitoring Diseases and Pests Infestation in Coconut Plantations. Agriculture 2017, 7, 89. [Google Scholar] [CrossRef] [Green Version]
  11. Warneke, B.; Zhu, H.; Pscheidt, J.; Nackley, L. Canopy spray application technology in specialty crops: A slowly evolving landscape. Pest. Manag. Sci. 2020. [Google Scholar] [CrossRef] [PubMed]
  12. Otto, S.; Loddo, D.; Baldoin, C.; Zanin, G. Spray drift reduction techniques for vineyards in fragmented landscapes. J. Environ. Manag. 2015, 162, 290–298. [Google Scholar] [CrossRef]
  13. Butler Ellis, M.C.; van de Zande, J.C.; van den Berg, F.; Kennedy, M.C.; O’Sullivan, C.M.; Jacobs, C.M.; Fragkoulis, G.; Spanoghe, P.; Gerritsen-Ebben, R.; Frewer, L.J.; et al. The BROWSE model for predicting exposures of residents and bystanders to agricultural use of plant protection products: An overview. Biosyst. Eng. 2017, 154, 92–104. [Google Scholar] [CrossRef] [Green Version]
  14. Butler Ellis, M.C.; van den Berg, F.; van de Zande, J.C.; Kennedy, M.C.; Charistou, A.N.; Arapaki, N.S.; Butler, A.H.; Machera, K.A.; Jacobs, C.M. The BROWSE model for predicting exposures of residents and bystanders to agricultural use of pesticides: Comparison with experimental data and other exposure models. Biosyst. Eng. 2017, 154, 122–136. [Google Scholar] [CrossRef]
  15. Kennedy, M.C.; Butler Ellis, M.C. Probabilistic modelling for Bystander and Resident exposure to pesticides using the Browse software. Biosyst. Eng. 2017, 154, 105–121. [Google Scholar] [CrossRef]
  16. Tsaboula, A.; Papadakis, E.-N.; Vryzas, Z.; Kotopoulou, A.; Kintzikoglou, K.; Papadopoulou-Mourkidou, E. Environmental and human risk hierarchy of pesticides: A prioritization method, based on monitoring, hazard assessment and environmental fate. Environ. Int. 2016, 91, 78–93. [Google Scholar] [CrossRef] [PubMed]
  17. Baldoin, C.; Friso, D. Assessment of the contribute of spray thickeners to the agro-chemical drift reduction using a mathematical model and a wind tunnel. Appl. Math. Sci. 2015, 9, 5603–5614. [Google Scholar] [CrossRef]
  18. Friso, D.; Baldoin, C. Mathematical modeling and experimental assessment of agrochemical drift using a wind tunnel. Appl. Math. Sci. 2015, 9, 5451–5463. [Google Scholar] [CrossRef]
  19. Friso, D.; Baldoin, C.; Pezzi, F. Mathematical modeling of the dynamics of air jet crossing the canopy of tree crops during pesticide application. Appl. Math. Sci. 2015, 9, 1281–1296. [Google Scholar] [CrossRef]
  20. Griesang, F.; Decaro, R.; dos Santos, C.; Santos, E.; de Lima Roque, N.; da Costa Ferreira, M. How Much Do Adjuvant and Nozzles Models Reduce the Spraying Drift? Drift in Agricultural Spraying. Am. J. Plant. Sci. 2017, 8, 2785–2794. [Google Scholar] [CrossRef] [Green Version]
  21. Duga, A.T.; Delele, M.A.; Ruysen, K.; Dekeyser, D.; Nuyttens, D.; Bylemans, D.; Nicolai, B.M.; Verboven, P. Development and validation of a 3D CFD model of drift and its application to air-assisted orchard sprayers. Biosyst. Eng. 2017, 154, 62–75. [Google Scholar] [CrossRef]
  22. Salcedo, R.; Vallet, A.; Granell, R.; Garcera, C.; Molto, E.; Chueca, P. Eulerian-lagrangian model of the behaviour of droplets produced by an air-assisted sprayer in a citrus orchard. Biosyst. Eng. 2017, 154, 76–91. [Google Scholar] [CrossRef]
  23. Gregorio, E.; Rocadenbosch, F.; Sanz, R.; Rosell-Polo, J. Eye-safe lidar system for pesticide spray drift measurement. Sensors 2015, 15, 3650–3670. [Google Scholar] [CrossRef] [PubMed] [Green Version]
  24. Gregorio, E.; Torrent, X.; Planas, S.; Rosell-Polo, J. Assessment of spray drift potential reduction for hollow-cone nozzles: Part 2. LiDAR technique. Sci. Total Environ. 2019, 687, 967–977. [Google Scholar] [CrossRef]
  25. Wen, S.; Zhang, Q.; Yin, X.; Lan, Y.; Zhang, J.; Ge, Y. Design of Plant Protection UAV Variable Spray System Based on Neural Networks. Sensors 2019, 19, 1112. [Google Scholar] [CrossRef] [Green Version]
  26. Azizpanah, A.; Rajabipour, A.; Alimardani, R.; Kheiralipour, K.; Mohammadi, V. Precision spray modeling using image processing and artificial neural network. Agric. Eng. Int. CIGR J. 2015, 17, 65–74. [Google Scholar]
  27. Yang, F.; Xue, X.; Cai, C.; Sun, Z.; Zhou, Q. Numerical Simulation and Analysis on Spray Drift Movement of Multirotor Plant Protection Unmanned Aerial Vehicle. Energies 2018, 11, 2399. [Google Scholar] [CrossRef] [Green Version]
  28. Zhai, Z.; Martínez Ortega, J.-F.; Lucas Martínez, N.; Rodríguez-Molina, J.A. Mission Planning Approach for Precision Farming Systems Based on Multi-Objective Optimization. Sensors 2018, 18, 1795. [Google Scholar] [CrossRef] [PubMed] [Green Version]
  29. Malneršič, A.; Dular, M.; Širok, B.; Oberti, R.; Hočevar, M. Close-range air-assisted precision spot-spraying for robotic applications: Aerodynamics and spray coverage analysis. Biosyst. Eng. 2016, 146, 216–226. [Google Scholar] [CrossRef]
  30. Marian, O.; Muntean, M.; Drocaş, I.; Ranta, O.; Molnar, A.; Catunescu, G.; Bărbieru, V. Assessment Method of Coverage Degree for Pneumatic Sprayers Used in Orchards. Agric. Agric. Sci. Procedia 2016, 10, 47–54. [Google Scholar] [CrossRef] [Green Version]
  31. Li, J.; Cui, H.; Ma, Y.; Xun, L.; Li, Z.; Yang, Z.; Lu, H. Orchard Spray Study: A prediction model of droplet deposition states on leaf surfaces. Agronomy 2020, 10, 747. [Google Scholar] [CrossRef]
  32. Liao, J.; Hewitt, A.J.; Wang, P.; Luo, X.W.; Zang, Y.; Zhou, Z.Y.; Lan, Y.; O’Donnell, C. Development of droplet characteristics prediction models for air induction nozzles based on wind tunnel tests. Int. J. Agric. Biol. Eng. 2019, 12, 1–6. [Google Scholar] [CrossRef]
  33. Musiu, E.; Lijun, Q.L.; Wu, Y. Spray deposition and distribution on the targets and losses to the ground as affected by application volume rate, airflow rate and target position. Crop. Prot. 2019, 116, 170–180. [Google Scholar] [CrossRef]
  34. Legleiter, T.R.; Johnson, W.G. Herbicide coverage in narrow row soybean as influenced by spray nozzle design and carrier volume. Crop. Prot. 2016, 83, 1–8. [Google Scholar] [CrossRef]
  35. Özlüoymak, Ö.B.; Bolat, A. Development and assessment of a novel imaging software for optimizing the spray parameters on water-sensitive papers. Comput. Electron. Agric. 2020, 168, 105104. [Google Scholar] [CrossRef]
  36. Lipiński, A.J.; Lipiński, S. Binarizing water sensitive papers—How to assess the coverage area properly? Crop. Prot. 2020, 127, 104949. [Google Scholar] [CrossRef]
  37. Dereń, K.; Cieniawska, B.; Szewczyk, A.; Sekutowski, T.; Zbytek, Z. Average liquid coverage depending on the type of the nozzle, spraying parameters and characteristics of the sprayed objects. J. Res. Appl. Agric. Eng. 2017, 62, 22–26. [Google Scholar]
  38. ISO 5682-3, Equipment for Crop Protection—Spraying Equipment—Part 3: Test Methods for Volume/Hectare Adjustment Systems of Agricultural Hydraulic Pressure Sprayers; ISO: Geneva, Switzerland, 1997.
  39. Barati, R. Application of excel solver for parameter estimation of the nonlinear Muskingum models. KSCE J. Civ. Eng. 2013, 17, 1139–1148. [Google Scholar] [CrossRef]
  40. Bhattacharjya, R.K. Solving groundwater flow inverse problem using spreadsheet solver. J. Hydrol. Eng. 2011, 16, 472–477. [Google Scholar] [CrossRef]
  41. Qin, W.C.; Xue, X.Y.; Cui, L.F.; Zhou, Q.; Xu, Z.F.; Chang, F.L. Optimization and test for spraying parameters of cotton defoliant sprayer. Int. J. Agric. Biol. Eng. 2016, 9, 63–72. [Google Scholar] [CrossRef]
  42. Dereń, K.; Szewczyk, A.; Sekutowski, T.R. The effect of the type of preparation with the content of nano-copper and copper on the coverage of winter rape plants. J. Agric. Eng. 2018, 63, 51–55. [Google Scholar]
  43. Drocas, I.; Marian, O.; Ranta, O.; Molnar, A.; Muntean, M.; Cătunescu, G. Study on determining the degree of coverage when performing phytosanitary treatments using water sensitive paper. Lucr. Ştiinţifice Agron. 2014, 57, 159–163. [Google Scholar]
  44. Bolat, A.; Özlüoymak, Ö. Evaluation of performances of different types of spray nozzles in site-specific pesticide spraying. Semin. Ciências Agrárias. 2020, 41, 1199–1212. [Google Scholar] [CrossRef]
  45. Cai, J.C.; Wang, X.; Gao, Y.Y.; Yang, S.; Zhao, C.J. Design and performance evaluation of a variable-rate orchard sprayer based on a laser-scanning sensor. Int. J. Agric. Biol. Eng. 2019, 12, 51–57. [Google Scholar] [CrossRef]
  46. Baetens, K.; Ho, Q.T.; Nuyttens, D.; De Schampheleire, M.; Melese Endalew, A.; Hertog, M.; Nicolaï, B.; Ramon, H.; Verboven, P. A validated 2-D diffusion- advection model for prediction of drift from ground boom sprayers. Atmos. Environ. 2009, 43, 1674–1682. [Google Scholar] [CrossRef]
  47. Baetens, K.; Nuyttens, D.; Verboven, P.; De Schampheleire, M.; Nicolaï, B.; Ramon, H. Predicting drift from field spraying by means of a 3D computational fluid dynamics model. Comput. Electron. Agric. 2007, 56, 161–173. [Google Scholar] [CrossRef]
  48. Lebeau, F.; Verstraete, A.; Stainier, C.; Destain, M.-F. RTDrift: A real time model for estimating spray drift from ground applications. Comput. Electron. Agric. 2011, 77, 161–174. [Google Scholar] [CrossRef]
  49. Cieniawska, B.; Pentoś, K.; Łuczycka, D. Neural modeling and optimization of the coverage of the sprayed surface. Bull. Pol. Acad. Sci. Tech. Sci. 2020, 68, 601–608. [Google Scholar] [CrossRef]
Figure 1. Experimental set-up: 1—artificial plant, 2—spray boom, 3—metal track guide.
Agriculture 11 00151 g001
Figure 2. Average degree of coverage for selected nozzles at 1.1 m·s−1 driving speed.
Agriculture 11 00151 g002
Figure 3. Average degree of coverage for selected nozzles at 2.2 m·s−1 driving speed.
Agriculture 11 00151 g003
Figure 4. Average degree of coverage for selected nozzles at 3.3 m·s−1 driving speed.
Agriculture 11 00151 g004
Figure 5. Coverage unevenness coefficient for selected nozzles at 1.1 m·s−1 driving speed.
Agriculture 11 00151 g005
Figure 6. Coverage unevenness coefficient for selected nozzles at 2.2 m·s−1 driving speed.
Agriculture 11 00151 g006
Figure 7. Coverage unevenness coefficient for selected nozzles at 3.3 m·s−1 driving speed.
Agriculture 11 00151 g007
Figure 8. The relative importance of the input variables of the MLP model on the average degree of coverage.
Agriculture 11 00151 g008
Figure 9. The relative importance of the input variables of the MLP model on the coverage unevenness coefficient.
Agriculture 11 00151 g009
Table 1. The droplet size for each combination of the type of nozzle and the pressure.
Type of NozzleNozzle ManufacturerPressure (kPa)Flow Rate (l·min−1)Droplet Size—VMD (μm)
single standard flat-fan—AXI 11002Albuz2000.65212
single standard flat-fan—AXI 11002Albuz3000.79193
single standard flat-fan—AXI 11002Albuz4000.91182
single air-induction flat-fan—AVI 11002Albuz2000.65554
single air-induction flat-fan—AVI 11002Albuz3000.79440
single air-induction flat-fan—AVI 11002Albuz4000.91382
dual anti-drift flat-fan—DGTJ 60 11002TeeJet2000.65299
dual anti-drift flat-fan—DGTJ 60 11002TeeJet3000.79264
dual anti-drift flat-fan—DGTJ 60 11002TeeJet4000.91249
dual air-induction flat-fan—AVI TWIN 11002Albuz2000.65543
dual air-induction flat-fan—AVI TWIN 11002Albuz3000.79436
dual air-induction flat-fan—AVI TWIN 11002Albuz4000.91384
VMD: volume median diameter.
Table 2. Error metrics of best model performances.
MLP StructureTrainTestValidation
RRMSERRMSERRMSE
Single nozzles, average degree of coverage as an output parameter
3-15-10.9610.00200.9680.00220.9680.0019
Single nozzles, coverage uniformity coefficient as an output parameter
3-36-10.9680.00150.9670.00190.9330.0041
Dual nozzles, average degree of coverage as an output parameter
3-17-10.9590.00240.9700.00210.9760.0022
Dual nozzles, coverage uniformity coefficient as an output parameter
3-11-10.9790.00160.9680.00270.9920.0007
MLP: multilayer perceptron; RMSE: Residual mean square error.
Publisher’s Note: MDPI stays neutral with regard to jurisdictional claims in published maps and institutional affiliations.

