Article

IL-6 Does Not Influence the Expression of SLC41A1 and Other Mg-Homeostatic Factors

1
Biomedical Centre Martin, Jessenius Faculty of Medicine in Martin, Comenius University Bratislava, 03601 Martin, Slovakia
2
Department of Pharmacology, Jessenius Faculty of Medicine in Martin, Comenius University Bratislava, 03601 Martin, Slovakia
*
Author to whom correspondence should be addressed.
Int. J. Mol. Sci. 2024, 25(24), 13274; https://doi.org/10.3390/ijms252413274
Submission received: 31 October 2024 / Revised: 30 November 2024 / Accepted: 6 December 2024 / Published: 11 December 2024
(This article belongs to the Section Molecular Biology)

Abstract

:
Together with chronic inflammation, disturbed magnesium homeostasis is a factor accompanying chronic disease which thus contributes to a reduced quality of human life. In this study, our objective was to examine the possible IL-6-mediated chronic inflammation-dependent regulation of nine magnesiotropic genes encoding for constituents of magnesium homeostasis of the cell. We used three cell lines (HepG2, U-266, and PANC-1), all characterized by high expression of the IL6R gene and the presence of a membrane form of IL-6R capable of responding to human IL-6. Despite the confirmed activation of the IL-6R/JAK/STAT3 pathway after hIL-6 treatment, we observed no biologically relevant changes in the transcription intensity of the studied magnesiotropic genes. This, however, does not exclude the possibility that IL-6 can affect magnesium homeostasis at levels other than through modified transcription.

Graphical Abstract

1. Introduction

Disturbed magnesium (Mg) homeostasis in cells and at the level of the entire body is recognized as an important factor contributing to the onset of various diseases, many of which are accompanied by chronic inflammation. Systemic hypomagnesemia and cellular Mg insufficiency is correlated with pathological conditions such as diabetes mellitus type 2 (DMT2), hypertension, or obesity [1,2].
Approximately 50% of Americans obtain insufficient Mg in their regular diet, despite a wealth of research supporting the mineral’s importance for human health [3,4]. A serum [Mg] of less than 0.85 mmol/L, which is regarded to reflect a systemic subclinical Mg shortage [5], may cause or exacerbate chronic inflammation when combined with other risk factors [1,2]. A diet low in Mg and hypomagnesemia are inversely correlated with elevated serum levels of C-reactive protein (CRP), which serves as an early marker of the inflammatory process in the body [6]. CRP is a routinely used marker of the acute phase of the inflammatory process, for example in infectious diseases, but its elevated concentration in the circulation is also associated with chronic diseases such as DMT2, cardiovascular disease, or rheumatoid arthritis [7,8]. On the other hand, Mg supplementation leads to the suppression of markers correlated with the inflammatory process [9,10,11,12,13].
CRP is secreted into the bloodstream by the liver, where it is synthesized by hepatocytes under the control of interleukin-6 (IL-6) [14]. IL-6 is a cytokine whose concentration in the circulation is also significantly elevated during inflammation [15,16]. However, IL-6 is considered to possess both pro-inflammatory and anti-inflammatory effects. Its anti-inflammatory activity is associated with the classic signaling pathway, which requires the membrane form of both parts of the IL-6 receptor (IL-6R) subunits, namely IL-6Rα (encoded by IL6R) and 130 kDa glycoprotein (gp130) (encoded by IL6ST) [17]. On the other hand, IL-6 exhibits pro-inflammatory properties in the presence of a soluble form of the α-subunit, specifically sIL-6R, which in complex with IL-6 can bind directly with gp130 in the absence of the IL-6Rα membrane form. This mechanism of activation is known as the trans-signaling pathway [17].
The binding of IL-6 to the membrane (IL-6R) or soluble (sIL-6R) α-subunit triggers the homodimerization of gp130 molecules. This event leads to the activation of Janus kinase (JAK), which subsequently phosphorylates the signal transducer and activator of transcription 3 (STAT3) at position Y705 [18]. After STAT3 phosphorylation and dimerization, the STAT3 homodimer enters the nucleus, where it acts as a transcription factor [18].
The activated gp130 receptor also initiates the MAPK and PI3K pathways [19]. In addition to the phosphorylation of Y705, the S727 site undergoes phosphorylation by PKC kinase activity (upon IL-6 stimulation [20]), JNK1 [21], or ERK [22]. This serine residue phosphorylation might be required for the full transcription activity of STAT3 [23] and is subsequently associated with the potentiation of STAT3 inactivation [24,25]. Phosphorylation at S727 stabilizes STAT3′s interaction with the transcriptional coactivator CBP/p300 [26], enabling further modifications. Namely its acetylation at the K685 site by CBP/p300 histone acetyltransferase activity triggered by the PI3K/Akt pathway. K685 acetylation further increases STAT3 stability [27].
The pool of intracellular free ionized Mg (Mg2+) is regulated by the entry of Mg2+, its extrusion, and/or its mobilization of intracellular Mg2+ stores (Figure 1). The main pathway of cellular Mg2+ uptake is through a ubiquitously expressed divalent cation chanzyme, namely transient receptor potential melastatin type 7 (TRPM7) [28]. The TRPM7 homologue, TRPM6, is relatively well studied and is similar to TRPM7 in that it also possesses both the ion channel and protein kinase activities [29]. However, because TRPM6 plays a crucial function in controlling the body’s Mg homeostasis by taking part in the absorption of Mg2+ in the intestine and its resorption in the kidney, it is mostly expressed in the epithelial cells of the colon and kidney [30,31]. The regulated extrusion of Mg2+ occurs primarily through the plasma membrane Na+/Mg2+ exchanger solute carrier family 41 member 1 (SLC41A1) [32,33], which is encoded by the gene located at the PARK16 locus, a locus associated with susceptibility to neurodegenerative Parkinson’s disease [34]. Its homologue SLC41A3 is a mitochondrial Na+-dependent Mg2+ efflux system [35].
Despite several studies [9,12,42] having established an association between Mg status and IL6 expression, the regulation of Mg homeostasis by IL-6 has, to our knowledge, not yet been sufficiently demonstrated. Given that both the classic signaling and the trans-signaling triggered by IL-6 ultimately result in the activation of the STAT3 transcription factor, we decided to study the putative effect of the IL-6/JAK/STAT3 pathway on the expression of target magnesiotropic genes (Table 1) in cell lines that possess the full membrane IL-6R. For our experiments, we chose three cell lines that are characterized by their high expression of the IL6R gene and the presence of a membrane form of IL-6R capable of responding to IL-6 application by triggering classic signaling, namely the HepG2 hepatocellular carcinoma cell line [43], the myeloma cell line U-266 [44], and the pancreatic carcinoma ductal origin PANC-1 cell line [45].

2. Results

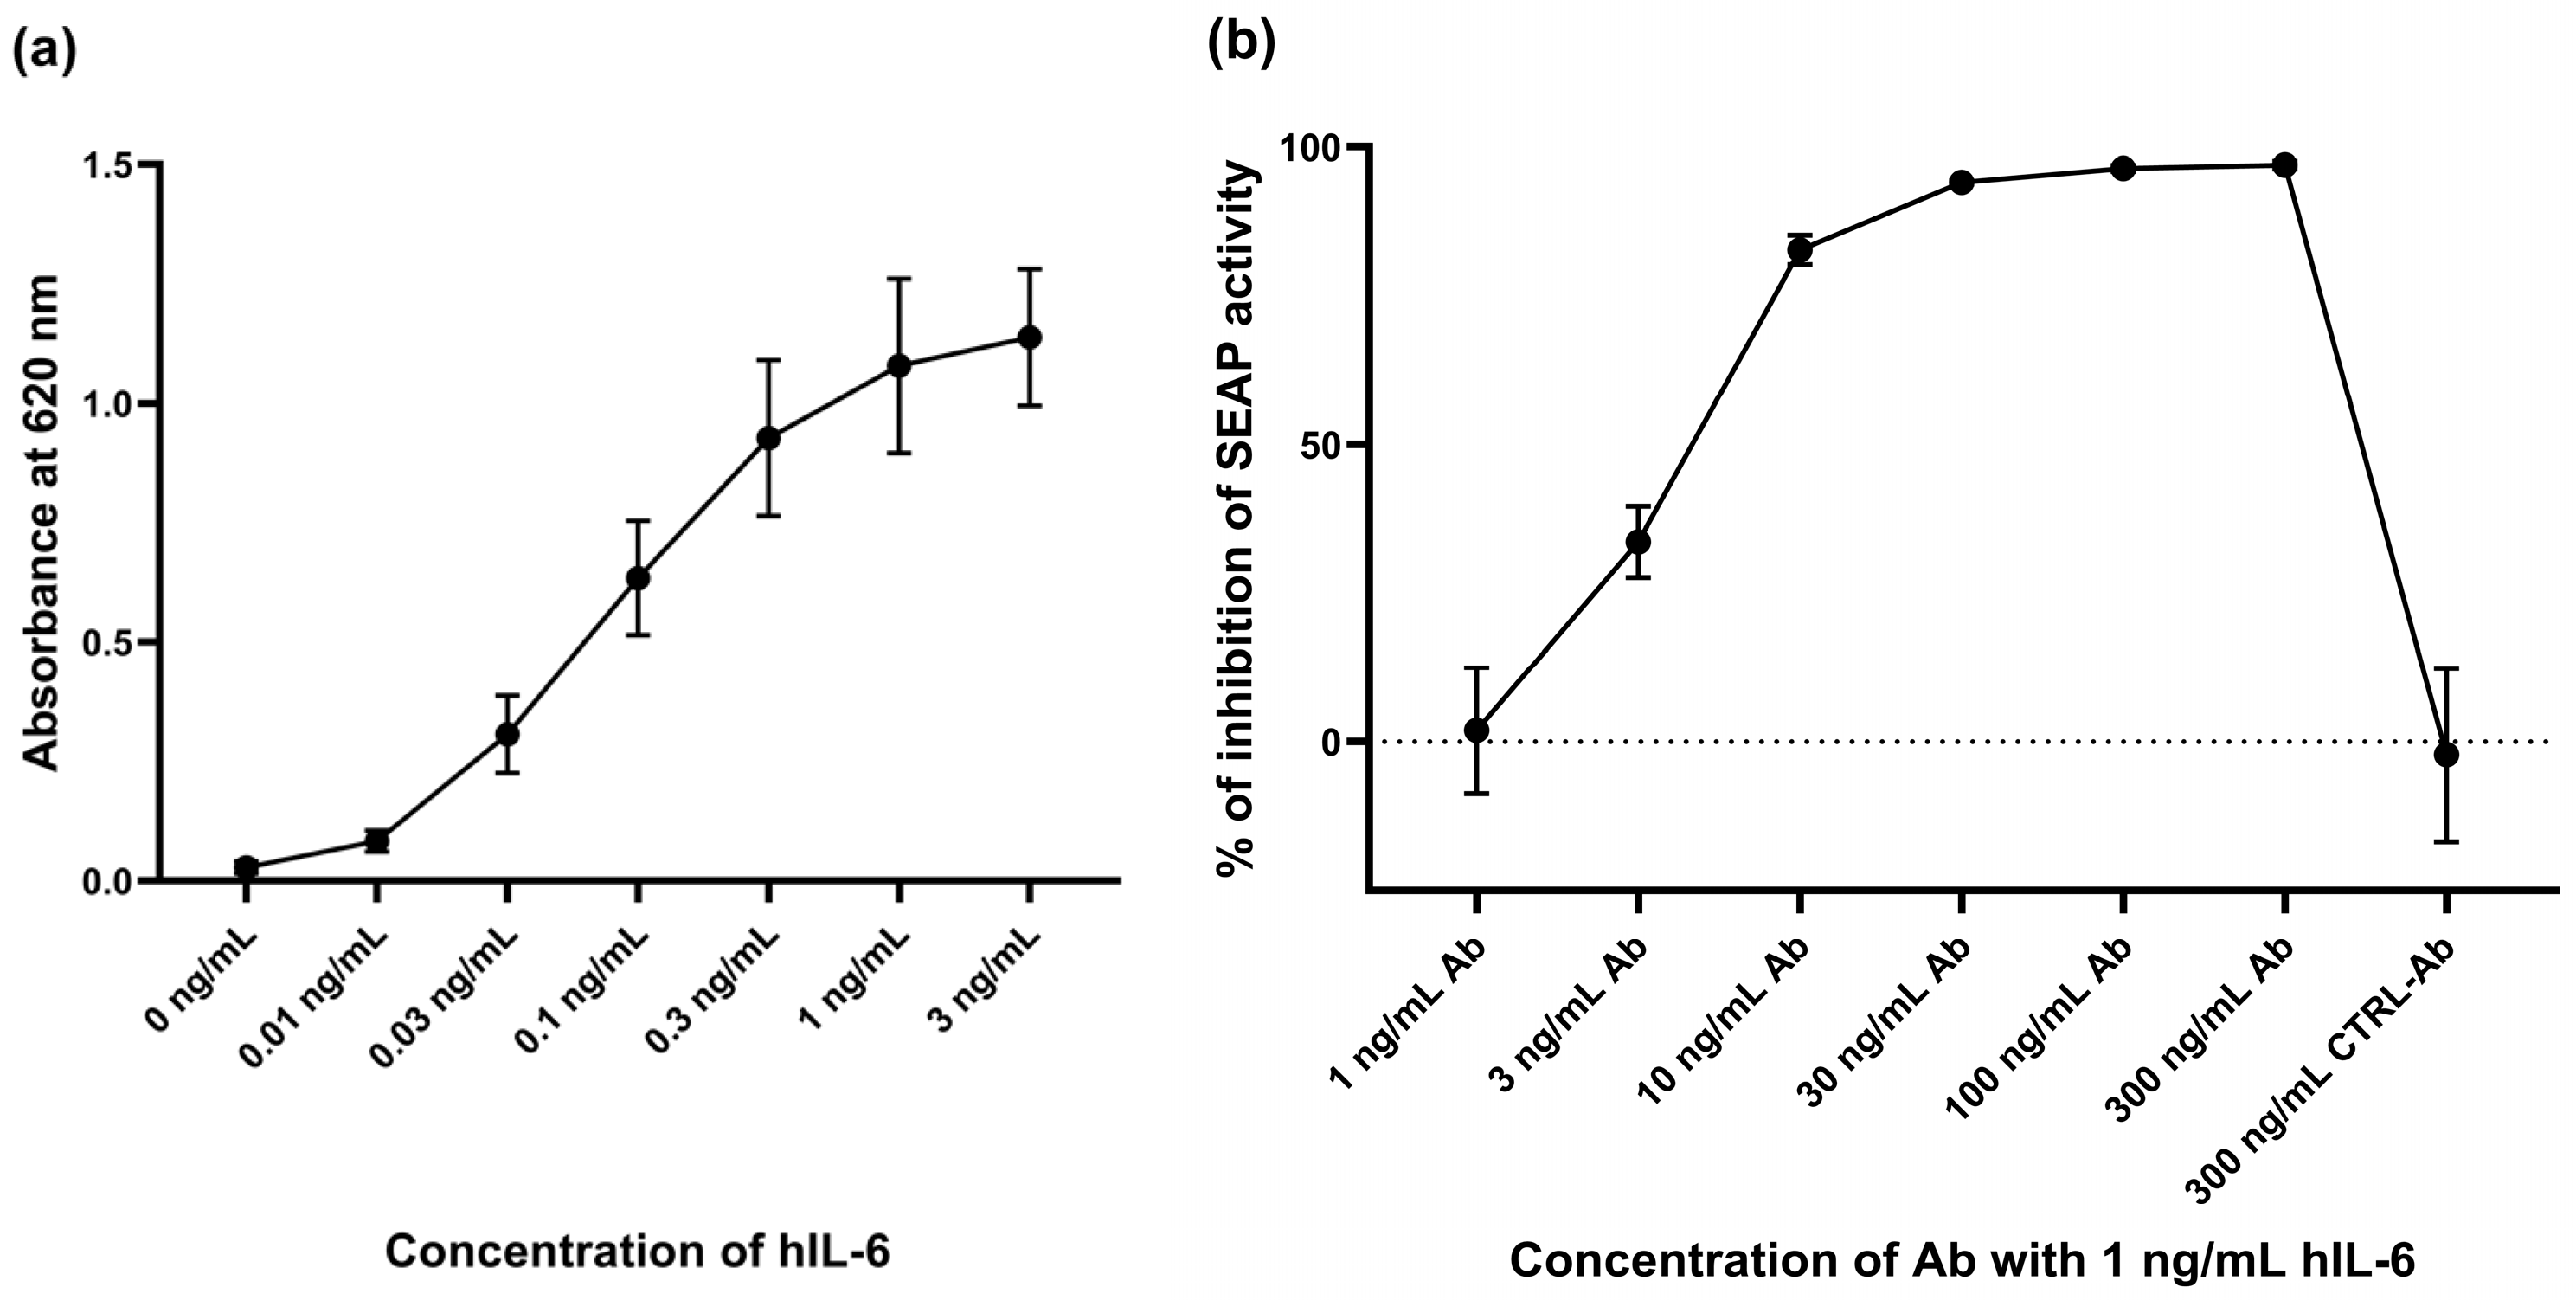
2.1. Response of HEK-Blue™ IL-6 Cell Line to hIL-6

The HEK-Blue™ IL-6 reporter cell line was prepared by the stable transfection of human embryonic kidney cells HEK293 with IL6R and STAT3 genes. Furthermore, the HEK-Blue™ IL-6 cell line was modified by transfection with a gene encoding STAT3-inducible secreted embryonic alkaline phosphatase (SEAP). Therefore, we could monitor the activity of the signaling pathway triggered by the application of hIL-6 by using a specific colorimetric assay.
At first, we quantified the IL-6 response of the reporter cell line by using a colorimetric assay determining the activity of SEAP secreted in culture medium by human-(h)-IL-6-stimulated cells at 24 h after hIL-6 application (Figure 2a). Subsequently, we verified the specificity of the induced response by adding a monoclonal anti-hIL-6-IgG antibody (Figure 2b).
The maximum response to IL-6 stimulation occurred at hIL-6 concentrations of ≥1 ng/mL (Figure 2a). In view of this result and of the relevant literature [14,46,47,48], we decided to use hIL-6 at a concentration of 1 ng/mL, 50 ng/mL, or 100 ng/mL, in the following experiments.

2.2. Activation of the IL-6/JAK/STAT3 Signaling Pathway in Three Responsive Cell Lines

The activation of the IL-6/JAK/STAT3 signaling pathway was monitored at the level of post-translational modifications of STAT3. The phosphorylation of STAT3 at Y705 by JAK leads to STAT3 dimerization and its translocation to the nucleus, where it acts as a transcription factor [18]. Furthermore, STAT3 can be phosphorylated at S727 by the activity of other kinases [22]. This modification stabilizes the complex of STAT3 with the transcriptional coactivator p300 [26]. The acetylation of STAT3 at K685 occurs in the nucleus and ensures the stability of the dimer [27]. We have monitored the phosphorylation of Y705 and S727 and the acetylation of K685 with specific antibodies by Western blotting (Figure 3a).
Although the phosphorylation of Y705 is the only post-translational modification of STAT3 that appears to be stimulated by a 3-h or 6-h treatment of the HEK-Blue™ IL-6 cell line by hIL-6, we decided to use the bioactive molecule Stattic (Tocris Bioscience, Bristol, UK), which inhibits STAT3 activation, dimerization, and nuclear localization [49]. Cells pretreated with Stattic (10 µmol/L for 1 h) and subsequently treated with hIL-6 (100 ng/mL for 1 h) showed a response to the presence of hIL-6 by the phosphorylation of Y705, independently of the phosphorylation of S727. Y705 phosphorylation was not detectable after the exposure of cells to the Stattic inhibitor. The acetylation of K685 was also affected (Figure 3b).
Since the presence of the complete membrane form of the IL-6 receptor is essential for triggering the classic IL-6/JAK/STAT3 signaling pathway, we used cell lines characterized by the high expression of the IL6R gene and the presence of a membrane form of IL-6R capable of responding to soluble IL-6. To verify the ability of HepG2, U-266, and PANC-1 cell lines to respond to the induction of hIL-6 by triggering the IL-6/JAK/STAT3 pathway, cells were exposed to 50 ng/mL hIL-6 for 30 min and 3 h. Western blot analysis of the total STAT3 protein, STAT3 Y705, and STAT3 S727-phosphorylated proteins was performed. The result confirmed that the presence of hIL-6 induces STAT3 phosphorylation at Y705 and, in the case of the HepG2 and U-266 cell lines, even the phosphorylation of S727 (Figure 4).

2.3. Putative Changes in the Expression of Magnesiotropic Genes Triggered by hIL-6

After verification of the hIL-6-sensitivity of the three cell lines, they were used for the analysis of possible changes in the expression of magnesiotropic genes after 1 or 24 h of treatment with 1 or 50 ng/mL hIL-6, directly addressing the hypothesis of the study that IL-6 treatment can influence the transcription of magnesiotropic genes. The RT-qPCR analysis of the expression of SLC41A1, SLC41A2, SLC41A3, TRPM7, MAGT1, NIPA1, N33, or CNNM2 revealed any biologically relevant changes in transcription rate after normalization to the expression of three reference genes: ACTB, GAPDH, and YWHAZ (Figure 5, Supplementary Figure S1 and Table S1). A mathematical evaluation of the data obtained was conducted to determine whether any trends toward biological relevance could be observed. Although several statistically significant differences were observed in the expression of the examined magnesiotropic genes under the given conditions (Supplementary Tables S1 and S2), we do not regard these changes as biologically relevant. TRPM6 transcription in all three cell lines studied was below the detection limit of our method. The N33 gene had to be omitted from the analysis in PANC-1 cell line because of its weak expression. These findings suggest that IL-6 does not exert a direct regulatory effect on the transcription of magnesiotropic genes in the cell lines studied within the time frame and concentrations examined.

3. Discussion

Many studies have shown a correlation between increased IL-6 concentration and a lower Mg level [50,51,52]. A reduced cellular Mg2+ intake is also well documented as leading to an increase in the synthesis of IL-6 and to its release [12,53]. For example, a higher concentration of Mg2+ in the culture medium leads to the suppression of an increased expression of IL6 by vascular smooth muscle cells under pro-inflammatory conditions; similarly, higher doses of Mg suppress the increase of pro-inflammatory IL-6 in the plasma of an animal model of chronic kidney disease [9]. Likewise, long-term dietary Mg deficiency in such animal models leads to an elevated plasma [IL-6] [42]. The TRPM7-kinase-deficient animal model, in addition to other pro-inflammatory parameters, is characterized by increased IL6 expression accompanied by reduced intracellular [Mg2+] [53]. Neonatal monocytes affected by MgSO4 treatment decrease their production of IL-6 under constitutive and Toll-like receptor(TLR)-stimulated conditions by reducing nuclear factor kappa B (NF-κB) activation [12]. This reduction of NF-κB activity might be a consequence of the Mg2+-mediated inhibition of L-type calcium channels, thus preventing inflammation [54].
In contrast to the known effect of altered Mg homeostasis on IL-6 production, the influence of IL-6 on the expression of magnesiotropic genes (and the function of the corresponding proteins) remains elusive. Theoretically, IL-6 could affect Mg homeostasis at various levels, from intestinal absorption and renal excretion, through intracellular transport, to storage accumulation. Here, we have examined the influence of IL-6 via its specific JAK/STAT3 signaling pathway on the expression of various magnesiotropic genes.
Although the regulation of Mg homeostasis by IL-6 demands a thorough study, a solid body of evidence has shown the effect of IL-6 supplementation on the cellular or whole-body homeostasis of divalent cations other than Mg2+ [47,55,56]. For instance, a short-term application of IL-6 leads to an increase in intracellular [Ca2+] in rat carotid body glomus cells [55] and a reduction in reticular storage [57]. In addition to the cellular regulation of Ca homeostasis, IL-6 also affects Ca handling at the level of the entire organism. IL-6 increases the expression of the gene for the calcium-sensing receptor (CaSR), a protein that monitors and regulates Ca levels. The effect of IL-6 on gene expression regulation is even more pronounced in the case of combination with tumor necrosis factor (TNFα) [47]. However, IL-6 might also reduce gene expression, as in the case of ATPase Sarcoplasmic/Endoplasmic Reticulum Ca2+ Transporting 2 (SERCA2) [58] and Calcium Voltage-Gated Channel Subunit Alpha1 C (Cacna1c) [59]. Furthermore, the chronic exposure of cells to IL-6 significantly affects intracellular Ca homeostasis and changes the cellular response to external environmental stimuli [60]. The assumption can thus be made that the long-term administration of IL-6 affects the expression of genes responsible for the Ca2+ balance in cells and for Ca2+ signaling.
A typical manifestation of the inflammatory process that accompanies the acute phase response is hypoferremia and hypozincemia [61,62]. The reduced concentration of zinc in the bloodstream might result from its accumulation in the liver. This is likely due to the increased expression of the gene encoding the Zn2+ transporter Zip14 in hepatocytes in the presence of IL-6 [63]. In addition to ZIP14, an increase in the expression of genes for other Zn2+ transporters, namely ZnT7 and ZIP7, has also been observed after the administration of IL-6 [64]. Furthermore, SLC39A10 expression has been shown to be regulated by JAK/STAT signaling in the presence of IL-7 [65]. IL-6 trans-signaling also triggers the accumulation of Fe2+ ions and ferrotoxicity in neurons, possibly leading to neurodegeneration [56].
Nevertheless, no magnesiotropic gene regulated by IL-6 is known. However, evidence exists that IL-6 can modulate intracellular [Mg2+]. Liu et al. have demonstrated the inhibitory effect of IL-6 on TRPM7 inward currents through both the classic and the trans-signaling cascades. The regulation of TRPM7 activity is [IL-6]-dependent and can be reversed by the inhibition of STAT3 activation [46]. However, because of the acute effect of the IL-6 application on TRPM7, we can exclude the possibility that STAT3 acts as a transcription factor regulating the expression of TRPM7. Notwithstanding, the empirical evidence suggests that the non-transcriptional activities of STAT3 may influence TRPM7 function [66].
A possible pleiotropic influence of IL-6 (other than at the level of transcription) on Mg homeostasis and the activity of Mg2+ transport mechanisms has been related to the ability of IL-6 to influence indirectly the distribution of Mg2+ in the cell.
The concept based on experimental evidence obtained by the research group of Abid [67] depicts the role of IL-6 signaling in mitochondrial physiology in skeletal muscle. In this model, extracellular IL-6 activates the canonical IL-6 receptor, increasing STAT3 phosphorylation at Y705 while reducing phosphorylation at S727. This destabilizes mitochondrial complex I and enhances reactive oxygen species (ROS) production. Acutely, this is demonstrated by increased mitochondrial respiration, increased mitochondrial fusion, mitochondrial biogenesis, and the further Y705 phosphorylation of STAT3 [67]. Chronic exposure to IL-6 might lead to a decompensated state in which ROS production is increased further but with impaired respiratory capacity and reduced signals for mitochondrial biogenesis [67]. Furthermore, the effect of the increased ROS production on the decrease of mitochondrial membrane potential, Ψm (MMP), is known [68]. Hypothetically, IL-6 might, through this complex cascade of events, inhibit the superconductive mitochondrial Mg2+ channel MRS2-(mitochondrial RNA splicing 2)-dependent Mg2+ influx into the mitochondrial matrix [69,70]. This could prevent the replenishment of mitochondrial Mg2+ pools and lead to further worsening of energy homeostasis, disrupting cellular Mg2+ balance, and altering the transcription of magnesiotropic genes [39]. Although this hypothesis has yet to be experimentally verified, a plethora of indirect evidence suggests its feasibility and potential to clarify the mechanism by which IL-6-mediated chronic inflammation influences cellular Mg homeostasis and perhaps transcription activities of genes.
The limitations of this experimental study include monitoring the expression of only a limited number of confirmed or putative magnesiotropic genes. Even within this restricted panel of nine genes, we observed differences in transcription levels between the three cell lines used (HepG2, U-266, and PANC-1). Therefore, it is clear that the transcriptional levels of these genes are cell-specific and thus, changes in the expression of these genes due to IL-6 may significantly depend on the cell type used. Furthermore, other factors, such as cytokine concentration, duration of exposure, or the use of IL-6 in combination with other inflammatory cytokines, can also have an impact.

4. Materials and Methods

4.1. Cell Cultures

In our experiments, we used four different human cell lines: IL-6 reporter line HEK-Blue™ IL-6 Cells (Invitrogen, Carlsbad, CA, USA), hepatoblastoma HepG2, multiple myeloma U-266, and pancreas carcinoma PANC-1 (all three DSMZ, Braunschweig, Germany), cultured at 37 °C in a humidified atmosphere of 5% CO2 and maintained in the culture media as recommended by the supplier and supplemented with 10% heat-inactivated fetal bovine serum and 1% Pen-Strep (HEK-Blue™ IL-6 Cells-DMEM 4.5 g/L glucose, HEK-Blue™ Selection (InvivoGen, San Diego, CA, USA), Normocin™ (InvivoGen, USA); HepG2-DMEM 1 g/L glucose; U-266-RPMI 1640, 1 mmol/L sodium pyruvate, 4.5 g/L glucose; PANC-1-DMEM 4.5 g/L glucose). Only cells below the 20th passage were used for experiments. Gene expression was analyzed after treatment of the cells, seeded 24 h earlier, with recombinant hIL-6 at 1, 50, or 100 ng/mL under the previously described conditions.

4.2. IL-6 Response Colorimetric Assay

To determine the effective concentration of hIL-6, we used the standard assay described in the protocol of the supplier of the HEK-Blue™ IL-6 Cells: 5 × 10⁵ cells per well were seeded in a 96-well plate and directly treated with hIL-6 at a concentration ranging from 0.01 to 3 ng/mL. We determined the activity of SEAP in the culture medium by using a QUANTI-BlueTM solution (Invitrogen, Carlsbad, CA, USA) with the subsequent evaluation of colorimetric change being measured by using the SYNERGY H4 Microplate Reader spectrophotometer (BioTek, Winooski, VT, USA). Anti-hIL-6-IgG antibody mabg-hil6-3 (Invitrogen, Carlsbad, CA, USA) and a control mouse monoclonal antibody (Invitrogen, USA) were used to determine the specificity of the reaction.

4.3. Western Blot Analysis

Cells treated with 50 or 100 ng/mL for a specific time and the corresponding untreated controls were washed to remove the culture medium with Dulbecco′s Phosphate Buffered Saline without Ca2+ and Mg2+ (Sigma-Aldrich, St. Louis, MO, USA). All cells were then lysed in a lysis solution consisting of 1% CHAPS, 150 mmol/L NaCl, 15 mmol/L Tris (pH = 7.6) with HALT™ protease inhibitor cocktail (Thermo Scientific, Waltham, MA, USA) and phosphatase inhibitors (200 µmol/L Na3VO4 and 50 mmol/L NaF). After lysis at 4 °C for 20 min with constant rotation, the insoluble cell debris was removed after centrifugation at 16,000× g and 4 °C for 25 min. The proteins were precipitated in acetone. Protein samples were separated on 8% SDS-polyacrylamide gels under reducing conditions at a constant current of 15 mA per gel and subsequently transferred to 0.2 µm nitrocellulose membranes by semi-dry transfer at a constant voltage of 25 V within 50 min. Membranes were incubated overnight at 4 °C with the appropriate primary antibody for a particular form of STAT3. Antibodies against total STAT3 sc-8019 (1:500), phosphorylated Y705 sc-81523 (1:500), phosphorylated S727 sc-71792 (1:500) (all Santa Cruz Biotechnology, USA), or acetylated K685 PA5-17429 (1:1000) (Invitrogen, Carlsbad, CA, USA) were used, followed by a 1-h incubation with either anti-mouse (1:10,000) or anti-rabbit (1:20,000) horseradish peroxidase-conjugated secondary antibody (both Sigma-Aldrich, Louisville, KY, USA). After incubation with the Clarity-Western ECL substrate solution (Bio-Rad, Hercules, CA, USA), the signal was detected using the Molecular Imager Gel Doc XRS+ (Bio-Rad, Hercules, CA, USA).

4.4. RT-qPCR and Data Analysis

The expression of nine putative STAT3-responsive genes affecting Mg homeostasis was analyzed in HepG2, U-266, and PANC-1 cell lines. Cells in Petri dishes treated with hIL-6 were lysed directly after the removal of the culture medium, and total RNA was isolated using the RNeasy® Mini Kit (Qiagen, Hilde, Germany). The quantity and purity of RNA were determined spectrophotometrically. Total RNA (1 μg) was used as a template for cDNA synthesis with the iScript™ gDNA Clear cDNA Synthesis Kit (Bio-Rad, Hercules, CA, USA) according to the manufacturer’s protocol. Subsequently, cDNA synthesized from 25 ng RNA was used as a template for a single qPCR reaction. The 10-µL reaction mixture, also containing PowerTrackTM SYBRTM Green Master Mix reagents (Applied Biosystems, Foster City, CA, USA) and 600 ng of each appropriate oligonucleotide for a specific gene (Table 2), was run in three technical replicates and analyzed on a ViiA7 instrument (Applied Biosystems, Foster City, CA, USA) in fast mode (Table 3), followed by melt curve analysis. We evaluated the change in the expression of genes of interest by using the efficiency-adjusted N0 method [71]. The raw fluorescence data from ViiA7 were imported into LinRegPCR v.2021.2 software [72,73]. The calculated average N0 of the gene of interest for each condition was normalized to the geometric mean N0 of three reference genes: ACTB, GAPDH, and YWHAZ. After normalization to control conditions without IL-6 treatment, we obtained the fold change values in three biological replicates, which were subsequently subjected to statistical analysis. Graphs were created using Prism 8 (GraphPad, San Diego, CA, USA). Data adhere to MIQE standards [74].

4.5. Data Analysis

Data were explored and analyzed in R version 4.4.0 (24 April 2024) [75] with the aid of the libraries (Supplementary Table S3) for data analysis. The data on fold change (FC) were summarized by mean, standard deviation (sd), the minimal value (min), lower quartile (Q1), median, and upper quartile (Q3), and the maximal value (max) for time and treatment and for each gene. Boxplot, density plot, and quantile-quantile plot were used to explore the distribution of FC across treatment, time, and gene. Outliers (n = 4) were identified using the Hampel filter and excluded from the subsequent analyses. A three-way ANOVA with non-constant variance was fitted to the data by the linear regression model by using the Generalized Least Squares method. From the full model (expression~gene*treatment*time), a submodel of the form (using the Wilkinson Rogers notation): expression~gene*treatment + time was selected based on the significance in ANOVA table. The selected model was subjected to the standard diagnostics by using residuals. Goodness-of-fit was quantified by the Adjusted R2. The model was used to obtain the estimated marginal means and to perform post hoc pairwise comparisons. p values were adjusted using the Benjamini-Hochberg correction.

5. Conclusions

Our work demonstrates that, in the tested cellular systems (HepG2, U-266, PANC-1), IL-6, the core cytokine of inflammation, does not regulate the expression of the tested magnesiotropic genes at the transcriptional level and, therefore, does not influence cellular Mg homeostasis through the regulation of the transcription of its major constituents (Mg2+ transporters and homeostatic factors). While the study did not find a significant influence of IL-6 on magnesiotropic gene transcription under the tested conditions, these findings do not exclude that the relationship may depend on additional factors such as specific cellular contexts or signaling pathways not addressed in this study. We should emphasize that the molecular and functional characteristics of the majority of the magnesiotropic genes are rather poor, and that perhaps other genes’ encoding factors playing a role in Mg homeostasis have yet to be discovered. Therefore, this work strictly reflects our current knowledge on magnesiotropic genes. Moreover, as previously mentioned, IL-6 might alter the function of Mg homeostatic factors at levels other than transcriptional level. Additionally, further detailed research on the precise role of the currently identified or putative magnesiotropic factors is necessary. It is also important to search for new factors and their regulation to better understand the maintenance of Mg homeostasis under both physiological and pathological conditions.

Supplementary Materials

The following supporting information can be downloaded at: https://www.mdpi.com/article/10.3390/ijms252413274/s1, Figure S1. Fold change of eight analyzed magnesiotropic genes normalized to the expression rate of three reference genes (ACTB, GAPDH, YWHAZ). Table S1. Changes in the expression levels of the eight magnesiotropic genes in three cell lines; Table S2. Post hoc pairwise comparisons with Benjamini-Hochberg adjustment of p values. Table S3. Libraries used for data analysis.

Author Contributions

Conceptualization, M.K.; methodology, M.K., M.B., M.C. and E.G.; software, M.G.; validation M.B. and M.C.; formal analysis, M.B., M.G. and M.C.; investigation, M.B., M.C. and E.G.; resources, M.K.; data curation M.B., M.G. and M.C.; writing—original draft preparation, M.B. and M.K.; writing—review and editing, M.K. and M.C.; visualization, M.B.; supervision, M.K.; project administration, M.K. and M.B.; funding acquisition, M.K. All authors have read and agreed to the published version of the manuscript.

Funding

This research was funded by the Slovak Research and Development Agency grant APVV-19–0222, and the Ministry of Education, Research, Development, and Youth of the Slovak Republic grant VEGA 1/0371/21, both to MK.

Institutional Review Board Statement

Not applicable.

Informed Consent Statement

Not applicable.

Data Availability Statement

Data are available upon reasonable request from the first author and the corresponding author.

Acknowledgments

We would like to express our gratitude to Theresa Jones for her assistance with the language editing of the manuscript. All figures were created in BioRender.

Conflicts of Interest

The authors declare no conflicts of interest.

References

  1. Shahi, A.; Aslani, S.; Ataollahi, M.; Mahmoudi, M. The Role of Magnesium in Different Inflammatory Diseases. Inflammopharmacology 2019, 27, 649–661. [Google Scholar] [CrossRef] [PubMed]
  2. Piuri, G.; Zocchi, M.; Della Porta, M.; Ficara, V.; Manoni, M.; Zuccotti, G.V.; Pinotti, L.; Maier, J.A.; Cazzola, R. Magnesium in Obesity, Metabolic Syndrome, and Type 2 Diabetes. Nutrients 2021, 13, 320. [Google Scholar] [CrossRef] [PubMed]
  3. Olza, J.; Aranceta-Bartrina, J.; González-Gross, M.; Ortega, R.M.; Serra-Majem, L.; Varela-Moreiras, G.; Gil, Á. Reported Dietary Intake, Disparity between the Reported Consumption and the Level Needed for Adequacy and Food Sources of Calcium, Phosphorus, Magnesium and Vitamin D in the Spanish Population: Findings from the ANIBES Study. Nutrients 2017, 9, 168. [Google Scholar] [CrossRef] [PubMed]
  4. Rosanoff, A.; Weaver, C.M.; Rude, R.K. Suboptimal Magnesium Status in the United States: Are the Health Consequences Underestimated? Nutr. Rev. 2012, 70, 153–164. [Google Scholar] [CrossRef]
  5. Rosanoff, A.; West, C.; Elin, R.J.; Micke, O.; Baniasadi, S.; Barbagallo, M.; Campbell, E.; Cheng, F.-C.; Costello, R.B.; Gamboa-Gomez, C.; et al. Recommendation on an Updated Standardization of Serum Magnesium Reference Ranges. Eur. J. Nutr. 2022, 61, 3697–3706. [Google Scholar] [CrossRef]
  6. Nielsen, F.H. Effects of Magnesium Depletion on Inflammation in Chronic Disease. Curr. Opin. Clin. Nutr. Metab. Care 2014, 17, 525–530. [Google Scholar] [CrossRef]
  7. Sproston, N.R.; Ashworth, J.J. Role of C-Reactive Protein at Sites of Inflammation and Infection. Front. Immunol. 2018, 9, 754. [Google Scholar] [CrossRef]
  8. Lainampetch, J.; Panprathip, P.; Phosat, C.; Chumpathat, N.; Prangthip, P.; Soonthornworasiri, N.; Puduang, S.; Wechjakwen, N.; Kwanbunjan, K. Association of Tumor Necrosis Factor Alpha, Interleukin 6, and C-Reactive Protein with the Risk of Developing Type 2 Diabetes: A Retrospective Cohort Study of Rural Thais. J. Diabetes Res. 2019, 2019, 9051929. [Google Scholar] [CrossRef]
  9. López-Baltanás, R.; Encarnación Rodríguez-Ortiz, M.; Canalejo, A.; Díaz-Tocados, J.M.; Herencia, C.; Leiva-Cepas, F.; Torres-Peña, J.D.; Ortíz-Morales, A.; Muñoz-Castañeda, J.R.; Rodríguez, M.; et al. Magnesium Supplementation Reduces Inflammation in Rats with Induced Chronic Kidney Disease. Eur. J. Clin. Investig. 2021, 51, e13561. [Google Scholar] [CrossRef]
  10. Mazidi, M.; Rezaie, P.; Banach, M. Effect of Magnesium Supplements on Serum C-Reactive Protein: A Systematic Review and Meta-Analysis. Arch. Med. Sci. 2018, 14, 707–716. [Google Scholar] [CrossRef]
  11. Dmitrašinović, G.; Pešić, V.; Stanić, D.; Plećaš-Solarović, B.; Dajak, M.; Ignjatović, S. ACTH, Cortisol and IL-6 Levels in Athletes Following Magnesium Supplementation. J. Med. Biochem. 2016, 35, 375–384. [Google Scholar] [CrossRef] [PubMed]
  12. Sugimoto, J.; Romani, A.M.; Valentin-Torres, A.M.; Luciano, A.A.; Ramirez Kitchen, C.M.; Funderburg, N.; Mesiano, S.; Bernstein, H.B. Magnesium Decreases Inflammatory Cytokine Production: A Novel Innate Immunomodulatory Mechanism. J. Immunol. 2012, 188, 6338–6346. [Google Scholar] [CrossRef] [PubMed]
  13. Gao, F.; Ding, B.; Zhou, L.; Gao, X.; Guo, H.; Xu, H. Magnesium Sulfate Provides Neuroprotection in Lipopolysaccharide-Activated Primary Microglia by Inhibiting NF-κB Pathway. J. Surg. Res. 2013, 184, 944–950. [Google Scholar] [CrossRef] [PubMed]
  14. Ngwa, D.N.; Pathak, A.; Agrawal, A. IL-6 Regulates Induction of C-Reactive Protein Gene Expression by Activating STAT3 Isoforms. Mol. Immunol. 2022, 146, 50–56. [Google Scholar] [CrossRef] [PubMed]
  15. Wei, S.-T.; Sun, Y.-H.; Zong, S.-H.; Xiang, Y.-B. Serum Levels of IL-6 and TNF-α May Correlate with Activity and Severity of Rheumatoid Arthritis. Med. Sci. Monit. 2015, 21, 4030–4038. [Google Scholar] [CrossRef]
  16. Qin, X.-Y.; Zhang, S.-P.; Cao, C.; Loh, Y.P.; Cheng, Y. Aberrations in Peripheral Inflammatory Cytokine Levels in Parkinson Disease: A Systematic Review and Meta-Analysis. JAMA Neurol. 2016, 73, 1316–1324. [Google Scholar] [CrossRef]
  17. Rose-John, S. Interleukin-6 Signalling in Health and Disease. F1000Research 2020, 9, 1013. [Google Scholar] [CrossRef]
  18. Tesoriere, A.; Dinarello, A.; Argenton, F. The Roles of Post-Translational Modifications in STAT3 Biological Activities and Functions. Biomedicines 2021, 9, 956. [Google Scholar] [CrossRef]
  19. Fahmi, A.; Smart, N.; Punn, A.; Jabr, R.; Marber, M.; Heads, R. P42/P44-MAPK and PI3K Are Sufficient for IL-6 Family Cytokines/Gp130 to Signal to Hypertrophy and Survival in Cardiomyocytes in the Absence of JAK/STAT Activation. Cell. Signal. 2013, 25, 898–909. [Google Scholar] [CrossRef]
  20. Jain, N.; Zhang, T.; Kee, W.H.; Li, W.; Cao, X. Protein Kinase C δ Associates with and Phosphorylates Stat3 in an Interleukin-6-Dependent Manner. J. Biol. Chem. 1999, 274, 24392–24400. [Google Scholar] [CrossRef]
  21. Liu, J.; Chen, B.; Lu, Y.; Guan, Y.; Chen, F. JNK-Dependent Stat3 Phosphorylation Contributes to Akt Activation in Response to Arsenic Exposure. Toxicol. Sci. 2012, 129, 363–371. [Google Scholar] [CrossRef] [PubMed]
  22. Gough, D.J.; Koetz, L.; Levy, D.E. The MEK-ERK Pathway Is Necessary for Serine Phosphorylation of Mitochondrial STAT3 and Ras-Mediated Transformation. PLoS ONE 2013, 8, e83395. [Google Scholar] [CrossRef]
  23. Wen, Z.; Zhong, Z.; Darnell, J.E. Maximal Activation of Transcription by Statl and Stat3 Requires Both Tyrosine and Serine Phosphorylation. Cell 1995, 82, 241–250. [Google Scholar] [CrossRef] [PubMed]
  24. Yang, J.; Kunimoto, H.; Katayama, B.; Zhao, H.; Shiromizu, T.; Wang, L.; Ozawa, T.; Tomonaga, T.; Tsuruta, D.; Nakajima, K. Phospho-Ser727 Triggers a Multistep Inactivation of STAT3 by Rapid Dissociation of pY705–SH2 through C-Terminal Tail Modulation. Int. Immunol. 2019, 32, 73–88. [Google Scholar] [CrossRef] [PubMed]
  25. Wakahara, R.; Kunimoto, H.; Tanino, K.; Kojima, H.; Inoue, A.; Shintaku, H.; Nakajima, K. Phospho-Ser727 of STAT3 Regulates STAT3 Activity by Enhancing Dephosphorylation of Phospho-Tyr705 Largely through TC45. Genes Cells 2012, 17, 132–145. [Google Scholar] [CrossRef]
  26. Paulson, M.; Pisharody, S.; Pan, L.; Levy, D.E.; Guadagno, S.; Mui, A.L. Stat Protein Transactivation Domains Recruit P300/CBP through Widely Divergent Sequences. J. Biol. Chem. 1999, 274, 25343–25349. [Google Scholar] [CrossRef]
  27. Ohbayashi, N.; Ikeda, O.; Taira, N.; Yamamoto, Y.; Muromoto, R.; Sekine, Y.; Sugiyama, K.; Honjoh, T.; Matsuda, T. LIF- and IL-6-Induced Acetylation of STAT3 at Lys-685 through PI3K/Akt Activation. Biol. Pharm. Bull. 2007, 30, 1860–1864. [Google Scholar] [CrossRef]
  28. de Baaij, J.H.F.; Hoenderop, J.G.J.; Bindels, R.J.M. Magnesium in Man: Implications for Health and Disease. Physiol. Rev. 2015, 95, 1–46. [Google Scholar] [CrossRef]
  29. Zhang, Z.; Yu, H.; Huang, J.; Faouzi, M.; Schmitz, C.; Penner, R.; Fleig, A. The TRPM6 Kinase Domain Determines the Mg·ATP Sensitivity of TRPM7/M6 Heteromeric Ion Channels. J. Biol. Chem. 2014, 289, 5217–5227. [Google Scholar] [CrossRef]
  30. Luongo, F.; Pietropaolo, G.; Gautier, M.; Dhennin-Duthille, I.; Ouadid-Ahidouch, H.; Wolf, F.I.; Trapani, V. TRPM6 Is Essential for Magnesium Uptake and Epithelial Cell Function in the Colon. Nutrients 2018, 10, 784. [Google Scholar] [CrossRef]
  31. Schlingmann, K.P.; Weber, S.; Peters, M.; Niemann Nejsum, L.; Vitzthum, H.; Klingel, K.; Kratz, M.; Haddad, E.; Ristoff, E.; Dinour, D.; et al. Hypomagnesemia with Secondary Hypocalcemia Is Caused by Mutations in TRPM6, a New Member of the TRPM Gene Family. Nat. Genet. 2002, 31, 166–170. [Google Scholar] [CrossRef] [PubMed]
  32. Kolisek, M.; Launay, P.; Beck, A.; Sponder, G.; Serafini, N.; Brenkus, M.; Froschauer, E.M.; Martens, H.; Fleig, A.; Schweigel, M. SLC41A1 Is a Novel Mammalian Mg2+ Carrier. J. Biol. Chem. 2008, 283, 16235–16247. [Google Scholar] [CrossRef] [PubMed]
  33. Arjona, F.J.; Latta, F.; Mohammed, S.G.; Thomassen, M.; van Wijk, E.; Bindels, R.J.M.; Hoenderop, J.G.J.; de Baaij, J.H.F. SLC41A1 Is Essential for Magnesium Homeostasis in Vivo. Pflugers Arch.—Eur. J. Physiol. 2019, 471, 845–860. [Google Scholar] [CrossRef] [PubMed]
  34. Satake, W.; Nakabayashi, Y.; Mizuta, I.; Hirota, Y.; Ito, C.; Kubo, M.; Kawaguchi, T.; Tsunoda, T.; Watanabe, M.; Takeda, A.; et al. Genome-Wide Association Study Identifies Common Variants at Four Loci as Genetic Risk Factors for Parkinson’s Disease. Nat. Genet. 2009, 41, 1303–1307. [Google Scholar] [CrossRef] [PubMed]
  35. Mastrototaro, L.; Smorodchenko, A.; Aschenbach, J.R.; Kolisek, M.; Sponder, G. Solute Carrier 41A3 Encodes for a Mitochondrial Mg2+ Efflux System. Sci. Rep. 2016, 6, 27999. [Google Scholar] [CrossRef]
  36. Nie, M.; Bal, M.S.; Liu, J.; Yang, Z.; Rivera, C.; Wu, X.-R.; Hoenderop, J.G.J.; Bindels, R.J.M.; Marciano, D.K.; Wolf, M.T.F. Uromodulin Regulates Renal Magnesium Homeostasis through the Ion Channel Transient Receptor Potential Melastatin 6 (TRPM6). J. Biol. Chem. 2018, 293, 16488–16502. [Google Scholar] [CrossRef]
  37. Matsuda-Lennikov, M.; Biancalana, M.; Zou, J.; Ravell, J.C.; Zheng, L.; Kanellopoulou, C.; Jiang, P.; Notarangelo, G.; Jing, H.; Masutani, E.; et al. Magnesium Transporter 1 (MAGT1) Deficiency Causes Selective Defects in N-Linked Glycosylation and Expression of Immune-Response Genes. J. Biol. Chem. 2019, 294, 13638–13656. [Google Scholar] [CrossRef]
  38. Ding, H.; Li, Y.; Fang, M.; Chen, J.; Liu, L.; Lu, Z.; Hou, J.; Luo, M. Epigenetic Activation of the TUSC3 Gene as a Potential Therapy for XMEN Disease. J. Allergy Clin. Immunol. 2023, 151, 1622–1633.e10. [Google Scholar] [CrossRef]
  39. Kolisek, M.; Sponder, G.; Pilchova, I.; Cibulka, M.; Tatarkova, Z.; Werner, T.; Racay, P. Magnesium Extravaganza: A Critical Compendium of Current Research into Cellular Mg2+ Transporters Other than TRPM6/7. In Reviews of Physiology, Biochemistry and Pharmacology 176; de Tombe, P., Gudermann, T., Jahn, R., Lill, R., Eds.; Reviews of Physiology, Biochemistry and Pharmacology; Springer International Publishing: Cham, Switzerland, 2018; Volume 176, pp. 65–105. ISBN 978-3-030-14026-7. [Google Scholar]
  40. Zhang, H.; Wu, Y.; Jiang, Y. CNNM2-Related Disorders: Phenotype and Its Severity Were Associated with the Mode of Inheritance. Front. Pediatr. 2021, 9, 699568. [Google Scholar] [CrossRef]
  41. Nemoto, T.; Tagashira, H.; Kita, T.; Kita, S.; Iwamoto, T. Functional Characteristics and Therapeutic Potential of SLC41 Transporters. J. Pharmacol. Sci. 2023, 151, 88–92. [Google Scholar] [CrossRef]
  42. Blache, D.; Devaux, S.; Joubert, O.; Loreau, N.; Schneider, M.; Durand, P.; Prost, M.; Gaume, V.; Adrian, M.; Laurant, P.; et al. Long-Term Moderate Magnesium-Deficient Diet Shows Relationships between Blood Pressure, Inflammation and Oxidant Stress Defense in Aging Rats. Free Radic. Biol. Med. 2006, 41, 277–284. [Google Scholar] [CrossRef] [PubMed]
  43. Cao, W.; Zhang, Y.; Li, A.; Yu, P.; Song, L.; Liang, J.; Cao, N.; Gao, J.; Xu, R.; Ma, Y.; et al. Curcumin Reverses Hepatic Epithelial Mesenchymal Transition Induced by Trichloroethylene by Inhibiting IL-6R/STAT3. Toxicol. Mech. Methods 2021, 31, 589–599. [Google Scholar] [CrossRef] [PubMed]
  44. Kovacs, E.; Link, S.; Toffol-Schmidt, U. Cytostatic and Cytocidal Effects of Mistletoe (Viscum Album L.) Quercus Extract Iscador. Arzneimittelforschung 2006, 56, 467–473. [Google Scholar] [CrossRef] [PubMed]
  45. Block, K.M.; Hanke, N.T.; Maine, E.A.; Baker, A.F. IL-6 Stimulates STAT3 and Pim-1 Kinase in Pancreatic Cancer Cell Lines. Pancreas 2012, 41, 773–781. [Google Scholar] [CrossRef]
  46. Liu, A.; Zhao, F.; Wang, J.; Zhao, Y.; Luo, Z.; Gao, Y.; Shi, J. Regulation of TRPM7 Function by IL-6 through the JAK2-STAT3 Signaling Pathway. PLoS ONE 2016, 11, e0152120. [Google Scholar] [CrossRef]
  47. Fetahu, I.S.; Hummel, D.M.; Manhardt, T.; Aggarwal, A.; Baumgartner-Parzer, S.; Kállay, E. Regulation of the Calcium-Sensing Receptor Expression by 1,25-Dihydroxyvitamin D3, Interleukin-6, and Tumor Necrosis Factor Alpha in Colon Cancer Cells. J. Steroid Biochem. Mol. Biol. 2014, 144, 228–231. [Google Scholar] [CrossRef]
  48. Brocke-Heidrich, K.; Kretzschmar, A.K.; Pfeifer, G.; Henze, C.; Löffler, D.; Koczan, D.; Thiesen, H.-J.; Burger, R.; Gramatzki, M.; Horn, F. Interleukin-6–Dependent Gene Expression Profiles in Multiple Myeloma INA-6 Cells Reveal a Bcl-2 Family–Independent Survival Pathway Closely Associated with Stat3 Activation. Blood 2004, 103, 242–251. [Google Scholar] [CrossRef]
  49. Schust, J.; Sperl, B.; Hollis, A.; Mayer, T.U.; Berg, T. Stattic: A Small-Molecule Inhibitor of STAT3 Activation and Dimerization. Chem. Biol. 2006, 13, 1235–1242. [Google Scholar] [CrossRef]
  50. de Oliveira, A.R.S.; Cruz, K.J.C.; Severo, J.S.; Morais, J.B.S.; de Freitas, T.E.C.; Araújo, R.S.; Marreiro, D.D.N. Hypomagnesemia and Its Relation with Chronic Low-Grade Inflammation in Obesity. Rev. Assoc. Med. Bras. 2017, 63, 156–163. [Google Scholar] [CrossRef]
  51. Nielsen, F.H. Magnesium Deficiency and Increased Inflammation: Current Perspectives. J. Inflamm. Res. 2018, 11, 25–34. [Google Scholar] [CrossRef]
  52. Arancibia-Hernández, Y.L.; Hernández-Cruzk, E.Y.; Pedraza-Chaverri, J. Magnesium (Mg2+) Deficiency, Not Well-Recognized Non-Infectious Pandemic: Origin and Consequence of Chronic Inflammatory and Oxidative Stress-Associated Diseases. Cell. Physiol. Biochem. 2022, 57, 1–23. [Google Scholar] [CrossRef]
  53. Rios, F.J.; Zou, Z.-G.; Harvey, A.P.; Harvey, K.Y.; Nosalski, R.; Anyfanti, P.; Camargo, L.L.; Lacchini, S.; Ryazanov, A.G.; Ryazanova, L.; et al. Chanzyme TRPM7 Protects against Cardiovascular Inflammation and Fibrosis. Cardiovasc. Res. 2020, 116, 721–735. [Google Scholar] [CrossRef] [PubMed]
  54. Lin, C.Y.; Tsai, P.S.; Hung, Y.C.; Huang, C.J. L-Type Calcium Channels Are Involved in Mediating the Anti-Inflammatory Effects of Magnesium Sulphate. Br. J. Anaesth. 2010, 104, 44–51. [Google Scholar] [CrossRef] [PubMed]
  55. Fan, J.; Zhang, B.; Shu, H.-F.; Zhang, X.-Y.; Wang, X.; Kuang, F.; Liu, L.; Peng, Z.-W.; Wu, R.; Zhou, Z.; et al. Interleukin-6 Increases Intracellular Ca2+ Concentration and Induces Catecholamine Secretion in Rat Carotid Body Glomus Cells. J. Neurosci. Res. 2009, 87, 2757–2762. [Google Scholar] [CrossRef] [PubMed]
  56. Sterling, J.K.; Kam, T.-I.; Guttha, S.; Park, H.; Baumann, B.; Mehrabani-Tabari, A.A.; Schultz, H.; Anderson, B.; Alnemri, A.; Chou, S.-C.; et al. Interleukin-6 Triggers Toxic Neuronal Iron Sequestration in Response to Pathological α-Synuclein. Cell Rep. 2022, 38, 110358. [Google Scholar] [CrossRef]
  57. Zuo, S.; Li, L.; Jiang, L.; Jiang, C.; Li, X.; Li, S.; Wen, S.; Bai, R.; Du, X.; Dong, J.; et al. Pravastatin Alleviates Intracellular Calcium Dysregulation Induced by Interleukin-6 via the Mitochondrial ROS Pathway in Adult Ventricular Myocytes. J. Pharmacol. Sci. 2020, 143, 141–147. [Google Scholar] [CrossRef]
  58. Wu, C.-K.; Lee, J.-K.; Chiang, F.-T.; Yang, C.-H.; Huang, S.-W.; Hwang, J.-J.; Lin, J.-L.; Tseng, C.-D.; Chen, J.-J.; Tsai, C.-T. Plasma Levels of Tumor Necrosis Factor-α and Interleukin-6 Are Associated with Diastolic Heart Failure through Downregulation of Sarcoplasmic Reticulum Ca2+ ATPase. Crit. Care Med. 2011, 39, 984–992. [Google Scholar] [CrossRef]
  59. Ma, S.-H.; Li, B.; Huang, H.-W.; Peng, Y.-P.; Qiu, Y.-H. Interleukin-6 Inhibits L-Type Calcium Channel Activity of Cultured Cerebellar Granule Neurons. J. Physiol. Sci. 2012, 62, 385–392. [Google Scholar] [CrossRef]
  60. Gruol, D.; Nelson, T. Purkinje Neuron Physiology Is Altered by the Inflammatory Factor Interleukin-6. Cerebellum 2005, 4, 198–205. [Google Scholar] [CrossRef]
  61. Ganz, T.; Nemeth, E. Hypoferremia of Inflammation: Innate Host Defense against Infections. Blood Cells Mol. Dis. 2024, 104, 102777. [Google Scholar] [CrossRef]
  62. Fromonot, J.; Gette, M.; Ben Lassoued, A.; Guéant, J.-L.; Guéant-Rodriguez, R.-M.; Guieu, R. Hypozincemia in the Early Stage of COVID-19 Is Associated with an Increased Risk of Severe COVID-19. Clin. Nutr. 2022, 41, 3115–3119. [Google Scholar] [CrossRef] [PubMed]
  63. Liuzzi, J.P.; Lichten, L.A.; Rivera, S.; Blanchard, R.K.; Aydemir, T.B.; Knutson, M.D.; Ganz, T.; Cousins, R.J. Interleukin-6 Regulates the Zinc Transporter Zip14 in Liver and Contributes to the Hypozincemia of the Acute-Phase Response. Proc. Natl. Acad. Sci. USA 2005, 102, 6843–6848. [Google Scholar] [CrossRef] [PubMed]
  64. Ruz, M.; Andrews-Guzmán, M.; Arredondo-Olguín, M. Modulation of Zinc Transporter Expressions by Additional Zinc in C2C12 Cells Cultured in a High Glucose Environment and in the Presence of Insulin or Interleukin-6. Biol. Trace Elem. Res. 2023, 201, 3428–3437. [Google Scholar] [CrossRef] [PubMed]
  65. Miyai, T.; Hojyo, S.; Ikawa, T.; Kawamura, M.; Irié, T.; Ogura, H.; Hijikata, A.; Bin, B.-H.; Yasuda, T.; Kitamura, H.; et al. Zinc Transporter SLC39A10/ZIP10 Facilitates Antiapoptotic Signaling during Early B-Cell Development. Proc. Natl. Acad. Sci. USA 2014, 111, 11780–11785. [Google Scholar] [CrossRef] [PubMed]
  66. Hillmer, E.J.; Zhang, H.; Li, H.S.; Watowich, S.S. STAT3 Signaling in Immunity. Cytokine Growth Factor Rev. 2016, 31, 1–15. [Google Scholar] [CrossRef]
  67. Abid, H.; Ryan, Z.C.; Delmotte, P.; Sieck, G.C.; Lanza, I.R. Extramyocellular Interleukin-6 Influences Skeletal Muscle Mitochondrial Physiology through Canonical JAK/STAT Signaling Pathways. FASEB J. 2020, 34, 14458–14472. [Google Scholar] [CrossRef]
  68. Fujita, K.; Shindo, Y.; Katsuta, Y.; Goto, M.; Hotta, K.; Oka, K. Intracellular Mg2+ Protects Mitochondria from Oxidative Stress in Human Keratinocytes. Commun. Biol. 2023, 6, 868. [Google Scholar] [CrossRef]
  69. Kolisek, M.; Zsurka, G.; Samaj, J.; Weghuber, J.; Schweyen, R.J.; Schweigel, M. Mrs2p Is an Essential Component of the Major Electrophoretic Mg2+ Influx System in Mitochondria. EMBO J. 2003, 22, 1235–1244. [Google Scholar] [CrossRef]
  70. Schindl, R.; Weghuber, J.; Romanin, C.; Schweyen, R.J. Mrs2p Forms a High Conductance Mg2+ Selective Channel in Mitochondria. Biophys. J. 2007, 93, 3872–3883. [Google Scholar] [CrossRef]
  71. Rosa, T.L.S.A.; Leal-Calvo, T.; Tavares, I.F.; Mendes, M.A.; Dias, A.A.; Piauy, M.H.D.S.; Barboza, M.F.D.S.; Kapuscinski, M.; Costa, F.D.M.R.; Marques, M.A.M.; et al. Whole Blood Transcriptomics Reveals the Enrichment of Neutrophil Activation Pathways during Erythema Nodosum Leprosum Reaction. Front. Immunol. 2024, 15, 1366125. [Google Scholar] [CrossRef]
  72. Ruijter, J.M.; Ramakers, C.; Hoogaars, W.M.H.; Karlen, Y.; Bakker, O.; Van Den Hoff, M.J.B.; Moorman, A.F.M. Amplification Efficiency: Linking Baseline and Bias in the Analysis of Quantitative PCR Data. Nucleic Acids Res. 2009, 37, e45. [Google Scholar] [CrossRef] [PubMed]
  73. Ramakers, C.; Ruijter, J.M.; Deprez, R.H.L.; Moorman, A.F.M. Assumption-Free Analysis of Quantitative Real-Time Polymerase Chain Reaction (PCR) Data. Neurosci. Lett. 2003, 339, 62–66. [Google Scholar] [CrossRef] [PubMed]
  74. Bustin, S.A.; Benes, V.; Garson, J.A.; Hellemans, J.; Huggett, J.; Kubista, M.; Mueller, R.; Nolan, T.; Pfaffl, M.W.; Shipley, G.L.; et al. The MIQE Guidelines: Minimum Information for Publication of Quantitative Real-Time PCR Experiments. Clin. Chem. 2009, 55, 611–622. [Google Scholar] [CrossRef] [PubMed]
  75. R: The R Project for Statistical Computing. Available online: https://www.r-project.org/ (accessed on 7 October 2024).
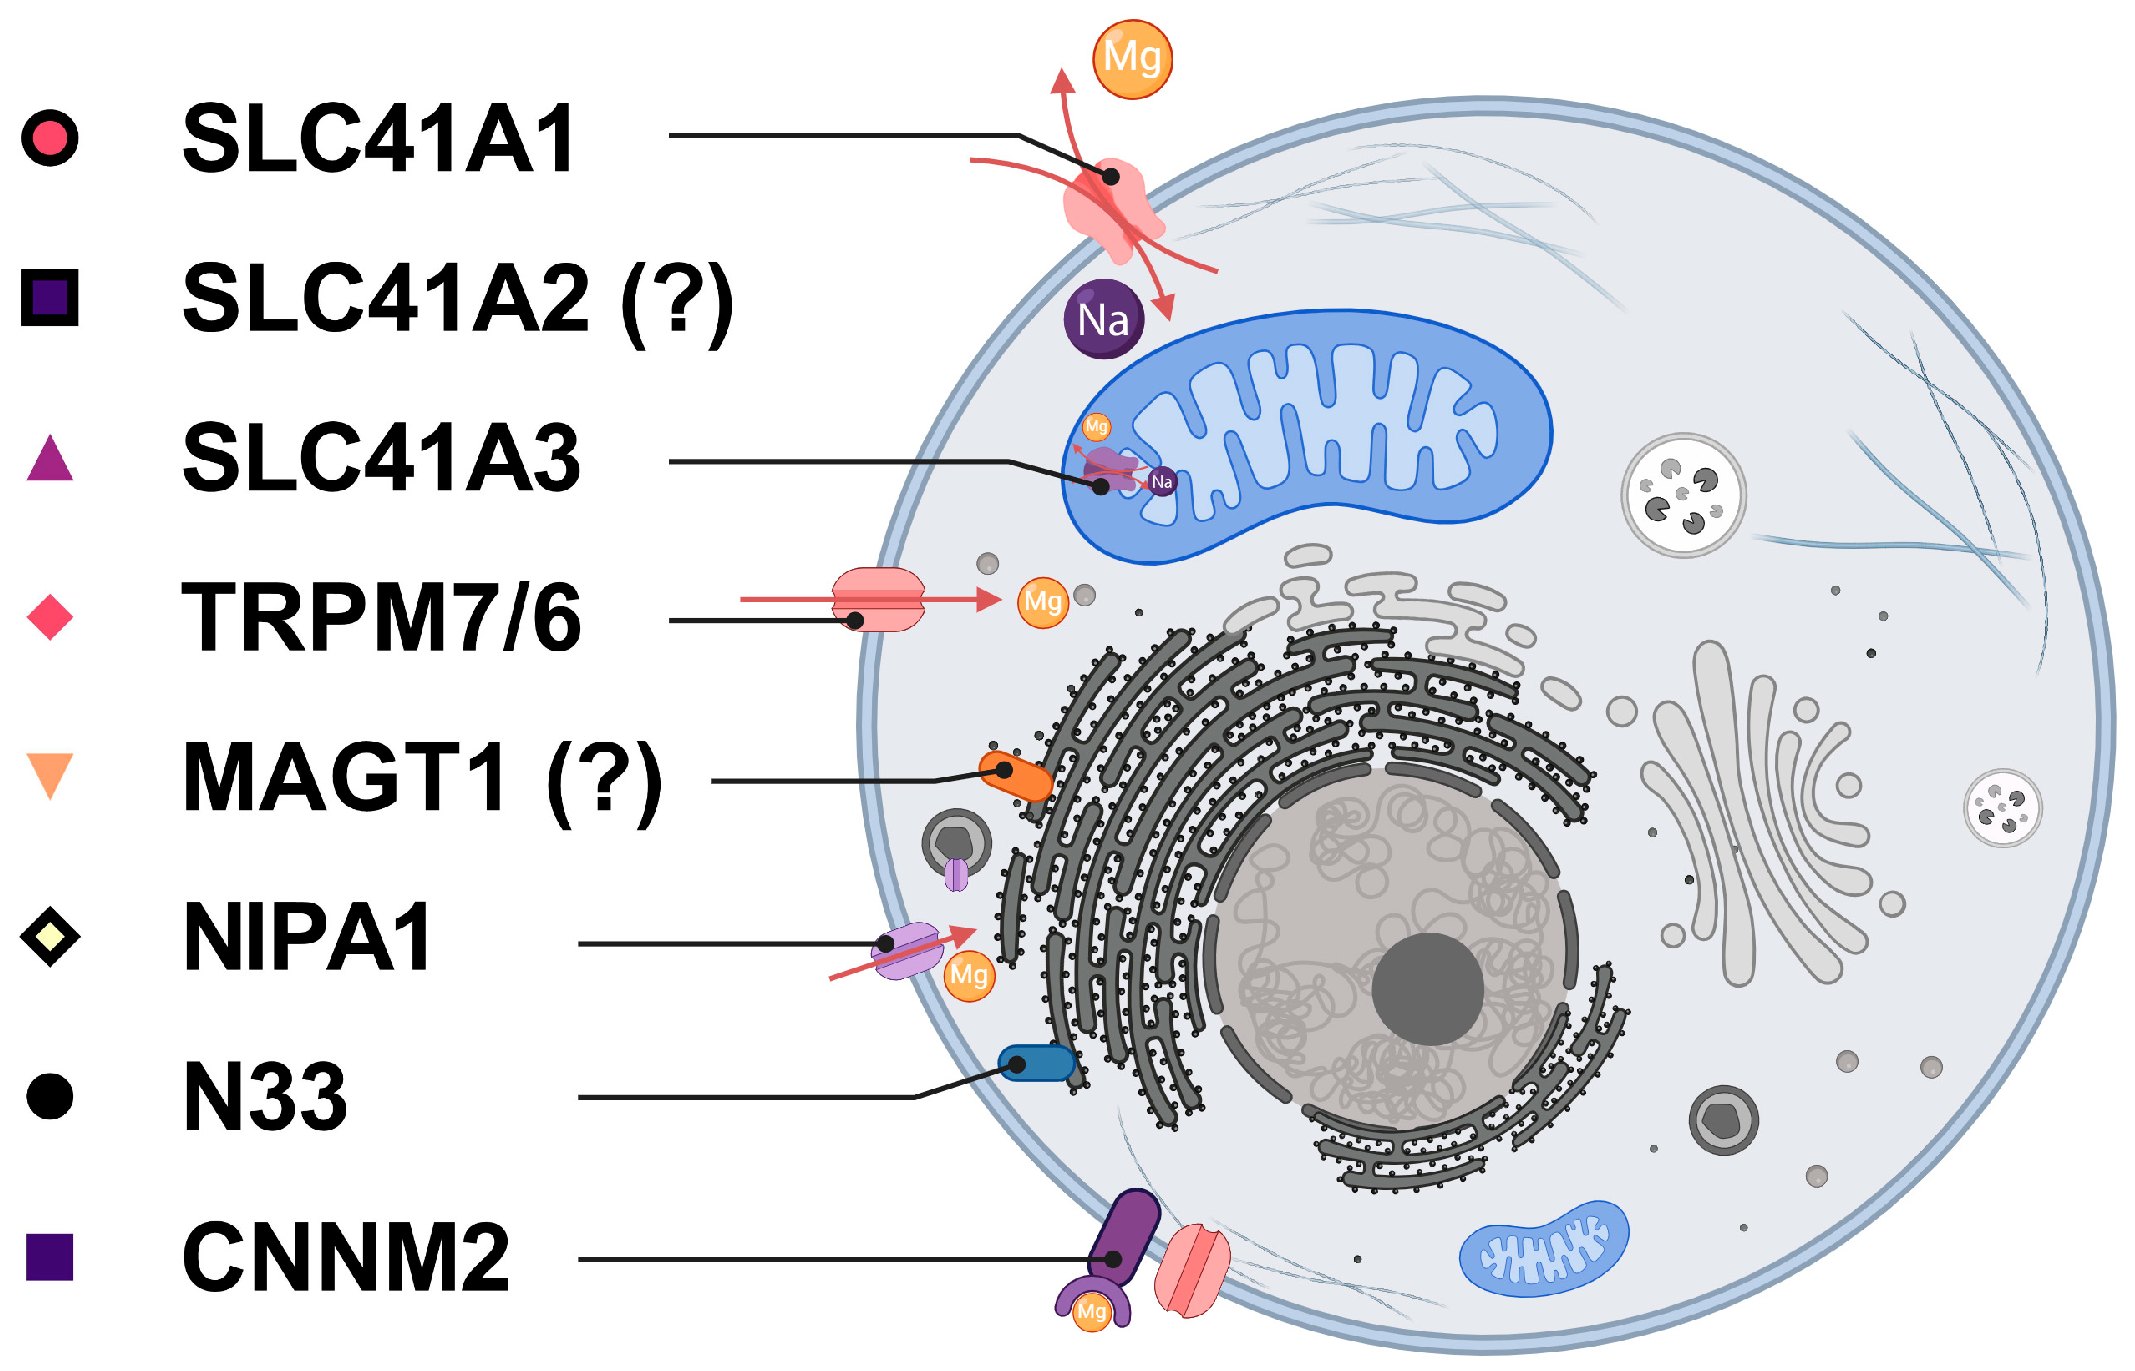
Figure 1. Current understanding of the cellular localization of Mg2+-transport proteins and other Mg-homeostatic factors in the eukaryotic cell. Na+/Mg2+ exchanger SLC41A1 facilitates the export of Mg2+ from the cell in exchange for Na+ [32,33]. SLC41A3 mediates this exchange on the inner mitochondrial membrane [35]. TRPM6/7 are channels that facilitate the entry of multiple divalent cations through the plasma membrane of the cell [28,30,36]. MAGT1 and N33 are part of the N-glycosylation machinery of the cell and likely contribute to Mg homeostasis indirectly [37,38]. NIPA1 facilitates the transport of Mg2+ across the plasma membrane [39]. CNNM2 regulates Mg-homeostasis more through the regulation of other Mg-homeostatic factors rather than directly facilitating its transport [40]. The function and precise cellular localization of SLC41A2 have not yet been fully elucidated, despite its high homology to SLC41A1 and SLC41A3 [41].
Ijms 25 13274 g001
Figure 2. The hIL-6-specific response was quantified by a colorimetric assay by using the STAT3-inducible expression of SEAP and SEAP secretion into the culture medium by cells treated with various concentrations of hIL-6. (a) The maximum reaction to the application hIL-6 was achieved by adding hIL-6 at a concentration of 1 ng/mL (or above). (b) The specificity of this reaction was tested by applying a specific monoclonal anti-hIL-6-IgG antibody (Ab) at various concentrations. Anti-hIL-6-IgG antibody at a concentration of 30 ng/mL was sufficient to inhibit the signaling pathway activation, and more than 90% of the SEAP activity was suppressed. A control mouse monoclonal antibody (CTRL-Ab) was used to check antibody specificity. Values shown with standard deviation are averages of three independent experiments.
Ijms 25 13274 g002
Figure 3. Immunodetection of post-translational modifications of the STAT3 protein triggered by the application of hIL-6 to the HEK-Blue™ IL-6 cell line. (a) Cells were treated with 1 or 100 ng/mL of hIL-6 for 3 or 6 h. (b) After 1 h of pretreatment with 10 µmol/L Stattic, 100 ng/mL hIL-6 was added to the culture medium, and the cells were incubated for another hour. The application of a Stattic inhibitor suppressed the IL-6-induced phosphorylation of Y705 and the subsequent acetylation of K685 of the STAT3 molecule.
Ijms 25 13274 g003
Figure 4. Treatment of HEK-Blue™ IL-6, HepG2, U-266, and PANC-1 cell lines with 50 ng/mL hIL-6 for 30 min or 3 h triggered STAT3 phosphorylation at Y705. In the case of HepG2 and U-266, S727 was also phosphorylated after IL-6 administration, mostly after a shorter incubation with hIL-6. Furthermore, we observed stable STAT3 phosphorylation at S727 in HEK BlueTM IL-6 and PANC-1 cell lines, which was also present under control conditions.
Ijms 25 13274 g004
Figure 5. Relative expression ratios of eight analyzed magnesiotropic genes normalized to the expression rate of three reference genes (ACTB, GAPDH, YWHAZ). Cells were treated with hIL-6 at a concentration of 1 or 50 ng/mL for 1 or 24 h. Experiments were carried out with three cell lines, namely HepG2 (a), U-266 (b), and PANC-1 (c), in three independent replicates. The means, excluding outliers, are presented together with the standard deviation.
Ijms 25 13274 g005
Table 1. List of magnesiotropic factors.
Protein NameProtein RoleReferences
SLC41A1Na+/Mg2+ exchanger, regulated extrusion through plasma membrane.[32,33]
SLC41A2Mg2+ transporter, presumed localization in the plasma or organelle membrane.[41]
SLC41A3Na+/Mg2+ exchanger, release of Mg2+ from mitochondria.[35]
TRPM6Mg2+ uptake through the plasma membrane, epithelial cells of the kidney, and colon.[30,36]
TRPM7Mg2+ uptake through the plasma membrane, ubiquitously expressed.[28]
MAGT1 & N33Mg-homeostatic factors, integral parts of the protein N-glycosylation complex.[37,38]
NIPA1The Mg2+ transporter, with its highest abundance in brain tissue, may be important for the maintenance of the nervous system.[39]
CNNM2Mg-homeostatic factor, the pathogenic form of CNNM2 is associated with hypomagnesemia and epilepsy.[40]
Table 2. List of oligonucleotides.
GeneForward Primer SequenceReverse Primer Sequence
SLC41A1GATTCTCCTGTACATCGCAGACCCCCTATGAGCCAGAGAACA
SLC41A2TGGTTATAAGTAGCATTGGGGGCCTTCCTGCTAGCCTGAATGGCCA
SLC41A3CACAAAGATAGTCGGTATCTGACGGACCATGGCCAGGATGATT
TRPM6GGATCTCTCTGCCCTGACTGTTCTCTCCAGCGATCTCCAT
TRPM7TGGGAAGGCTGAATATGAGGTCGCTGTCATCCATTGTCAT
MAGT1GGGATTGCTTTTGGCTGTTATATGGGCATATGGTGGTCCT
NIPA1AACAACCCGTCCAGTCAGAGGTAGTAGATGGCCCCGAACA
N33ATGGAATGGAGTTCCAGACGTCATTAGCTTGCCTGCACAC
CNNM2TGCAGGTGATCTTCATTTCGGCAGTGAGCACAGCAGGTAG
ACTBAACGGCTCCGGCATGTGCAAGCACATAGGAATCCTTCTGACC
GAPDHCTTTGGTATCGTGGAAGGACTAGAGGCAGGGATGATGTTC
YWHAZCTGTAACTGAGCAAGGAGCTGATACTTGAGACGACCCTCCA
Table 3. Fast cycling conditions.
StepTemperatureTime
Polymerase activation95 °C2 min
40×Denaturation95 °C5 s
Annealing & polymerization58 °C30 s
Melt curve58–95 °C1.99 °C/s; 15 s
95–60 °C1.77 °C/s; 1 min
60–95 °C0.075 °C/s; 15 s
Disclaimer/Publisher’s Note: The statements, opinions and data contained in all publications are solely those of the individual author(s) and contributor(s) and not of MDPI and/or the editor(s). MDPI and/or the editor(s) disclaim responsibility for any injury to people or property resulting from any ideas, methods, instructions or products referred to in the content.

