Article

Design and System Evaluation of Mixed Waste Plastic Gasification Process Based on Integrated Gasification Combined Cycle System

Institute of Process Systems Engineering, School of Chemistry, Chemical Engineering and Life Science, Wuhan University of Technology, Wuhan 430070, China
*
Author to whom correspondence should be addressed.
Processes 2022, 10(3), 499; https://doi.org/10.3390/pr10030499
Submission received: 24 December 2021 / Revised: 12 January 2022 / Accepted: 18 January 2022 / Published: 2 March 2022
(This article belongs to the Topic Sustainable Energy Technology)

Abstract

:
Plastic products are widely used due to their superior performance, but there are still limitations in the current methods and technologies for recycling and processing of waste plastics, resulting in a huge wasting of resources and environmental pollution. The element composition of waste plastics determines its great gasification potential. In this paper, three different waste plastic gasification processes are designed in a process simulator based on the conventional Integrated Gasification Combined Cycle (IGCC) system to achieve waste conversion and utilization as well as carbon capture. Design 1 is based on the cryogenic air separation (CAS) process to obtain oxygen, which is sent to the gasifier together with steam and pretreated waste plastics. The synthesis gas is purified and synthesized into methanol, and the residual gas is passed to the gas turbine and steam turbine to achieve multiple production of heat, electricity, and methanol. Design 2 uses a Vacuum Pressure Swing Adsorption (VPSA) process to produce oxygen, which reduces the energy consumption by 56.3% compared to Design 1. Design 3 adds a calcium-looping (CaL) reaction coupled with a steam conversion reaction to produce high-purity hydrogen as a product, while capturing the generated CO2 to improve the conversion rate of the reaction.

1. Introduction

With the growing demands for plastic products, 6.3 billion tons of plastic waste is generated globally, but less than 10% is recycled. Plastics are polymer compounds formed by the polymerization of monomers through addition or condensation reactions. Plastics have a stable chemical structure which makes them highly resistant to corrosion and challenging for microbial degradation. In 2019, the number of plastic products in China had reached 8.184 × 10⁷ tons, ranking first globally in terms of production and consumption [1]. According to statistics, as of 2015, the world has produced about 8.3 billion tons of plastic products and discarded about 6.3 billion tons, with only 9% being recycled [2] There are 12.7 million tons of plastic waste that enter the ocean from land every year, causing economic losses to marine ecosystems as high as 13 billion U.S. dollars [3].
The destination of waste plastics can be divided into four routes: physical recycling, chemical and thermal treatment, landfill disposal, and environmental dispersion. Physical recycling refers to the preparation of recycled plastic products by washing, crushing, melting, and reprocessing waste plastics, which can only be applied for recycling wasted thermoplastic of a single material. Chemical and thermal treatment can be divided into depolymerization methods (glycolysis, hydrolysis, solvolysis and hydrolysis), partial oxidation, thermal cracking (thermal cracking, catalytic cracking, and hydrocracking) as well as energy recovering in incineration. This method breaks the molecular structure of the polymer to obtain plastic monomers or chemical fuels [4]. According to statistics, 36% of the annual waste plastics are buried or discarded randomly, 30% are recycled, and only 14% are incinerated to generate electricity in order to recover thermal energy [5]. Many researchers have tried to use pyrolysis or gasification to convert waste plastics into higher-value liquid fuels or gas for their resource utilization in recent years. However, the traditional incineration methods can cause toxic gases such as hydrogen chloride, dioxins, and polycyclic aromatic hydrocarbon from small amounts of chlorine, sulfur, and arsenic present in plastics, causing secondary air pollution. Gasification is one of the most promising methods for solid waste. This method can convert almost any organic raw material by partial oxidation into a mixture of gases containing CO2, CO, H2, CH4, and other light hydrocarbons with almost zero emissions of toxic elements and harmful gases [6].
Ahmed [7] et al. studied the synthesis gas production, hydrogen production, apparent thermal efficiency, and synthesis gas quality of polystyrene (PS) at 700, 800, and 900 °C, while developing a kinetic model for hydrogen production. Wu [8] et al. studied the catalytic hydrogen production capacity of waste plastics and concluded that the highest amount of H2 was obtained when the equivalence ratio was 0.1. Dang [9] et al. explored the effects of gasifier temperature and steam-to-feed mass ratio in the production of synthesis gas from the gasification of polyethylene (PE) and polypropylene (PP). They concluded that the gasification temperature was 900 °C, while the optimum mass ratio was 1.5 for the maximum syngas flow rate. Santagata [10] et al. researched gasification of plastic waste as feedstock to produce low-density polyethylene (LDPE). Together with process simulation in Aspen Plus, they provided a valuable solution to the global problem of uncontrolled plastic waste management. Ansari [11] et al. examined the effects of solar in gasification heat load on the IGCC net thermal efficiency and the solar to electrical efficiency. The peak net energy efficiency considers the share of solar and biomass to generate power. Siyue [12] et al. simulated the IGCC in Aspen Plus. They find that when carbon capture and storage (CCS) is not considered, all IGCC systems are superior to coal and biomass direct-fired systems in terms of sustainability. After CCS is integrated, the sustainability of the biomass based IGCC system is still higher than that of biomass direct-fired systems. Campbell [13] et al. added plastic waste to a coal-fired Texaco IGCC power station and successfully improved system efficiency.
With the increasing global demands for energy, the greenhouse effect from fossil fuel combustion is becoming more and more serious. Hydrogen is one of the best alternatives to fossil fuels due to its high energy density and non-pollution. A complete waste plastic gasification to hydrogen and CO2 capture system should contain a main reactor and a regenerative reactor. The Water-Gas Shift Reaction (WGSR) and carbonation reaction are integrated in the main reactor. The regeneration reactor regenerates the CaO by calcination and obtains the high-purity CO2 for storage.
The Integrated Gasification Combined Cycle (IGCC) combines clean coal gasification technology with an efficient gas-steam combined cycle power generation system. It has the advantages of high power-generation efficiency, low pollutant emissions, and low carbon dioxide capture costs. It is currently internationally proven and is the most promising clean and efficient coal power technology that can be industrialized.
In this study, three waste plastic gasification processes are designed based on IGCC systems that combine coal gasification technology with an efficient combined cycle. Aspen Plus, a software, is widely used in process simulation from Aspen Tech incorporated, which has a relatively complete database of properties and unit operation modules. We combined Aspen Plus V11.0 and process flow to design three different processes. Through the toolbox of Aspen Plus, we conducted sensitivity analysis on key operating variables in each section to obtain the optimal operating conditions. Finally, the characteristics and advantages of the three designs are obtained by comparing and analyzing the total efficiency, net efficiency, carbon capture rate (CCR) and cold gas efficiency (CGE) of the system. This provides certain guiding significance for realistic production.

2. Process Design

2.1. Pretreatment Process

The direct combustion or gasification of plastic waste containing fluorine, chlorine and bromine can cause significant harm to the environment. Pretreatment generally includes four stages: collection, primary crushing, sorting, and preprocessing. Sorting is one of the key processes to be designed for subsequent treatment. The plastic raw materials obtained from the scrap yard are mainly plastic bottles, waste trimmings, plastic films, waste pipes, and packaging materials. This comes with other impurities such as metal, sediment, silica gel, glass, labels, residual liquids, light materials, wood chips and paper scraps. The main components of wastes obtained by separation are polypropylene (PP), polyethylene (PE), polystyrene (PS), Acrylonitrile Butadiene Styrene (ABS), polyethylene terephthalate (PET) and polyvinyl chloride (PVC). The combustion process of PVC produces harmful gases such as hydrogen chloride, hydrogen cyanide and NOX, which cause acid rain and corrosion. In order to improve the value of gasification products and recovery rate while reducing environmental pollution, it is crucial to design an effective separation process to eliminate PVC.
The sorting process generally separates different types of plastics based on differences in shape, density, size, color, chemical composition, light transmission, and other characteristics of the waste plastics. Different methods have different ranges of use, separation efficiency, accuracy, and industrial applications. Researchers have been trying to provide inexpensive and reliable methods for separating waste plastics. Commonly used methods include wind separation, magnetic density separation, electrostatic separation, froth flotation, electrostatic, near-infrared spectrum, and X-ray methods.
Froth roam flotation and density separation are well-established techniques used in the mining industry to separate plastics with large density differences from metals and gravel. Both plasma surface modification (physical modulation) and addition of wetting agents (chemical modulation) can further enable flotation separation of a wide range of mixed plastics with different systems. However, the treatment of the liquid phase may cause environmental pollution. The common densities range of different types of plastics [14] are shown in Table 1.
The electrostatic separation method allows the separation of plastics with overlapping density ranges and similar typical densities. It is characterized by the simplicity of the process and the absence of contamination generation. However, it is difficult to control the polarity of the charged plastics, where one of the plastic particles will be positively or negatively charged during friction. This phenomenon will affect the purity of the separated plastic. In addition, charge decay electrostatic separation is used to remove PVC from waste plastics. Relevant experiments on the charge decay properties of ABS, PP and PVC show that long decay times favor the removal of PVC from ABS or PP. As the decay time increases, the removal rate of PVC can be significantly increased [15].
Wind sorting exposes the waste plastics to the airflow, after which the plastics are separated due to differences in particle size, shape, density, etc. This is suitable for separating materials with large density differences. The principle of the optical sorting method is to use different kinds of plastics with different spectral properties, through different optical media to scan the polymer and the material so that the type of waste can be identified quickly and accurately.
In this paper, we designed a sorting technology scheme based on wind sorting, color sorting as well as near-infrared spectrum sorting and supplemented by manual sorting and electromagnetic sorting for the recycled waste. Our recycled waste was sourced from ten different scrap collection points in Wuhan, China. We designed a separation process for the collected raw materials and screened out mixed plastic waste (MPW) that can be vaporized. A process was designed to recover valuable plastics from the recycled waste, except for the PVC.
The pretreatment system process is shown in Figure 1.
Where the recycled wastes are passed through a primary crusher to control the particle size of the feedstock to a certain range for subsequent processing. Then, the raw material is divided into light fraction (PE, PP, PS, waste paper, etc.) and heavy scrap (metal, sludge, PET, PVC, etc.) by the wind sorting process. In this system, vibration, blowing, or suction mechanisms are applied to obtain four different products after air classification, and film-like plastics can also be separated from the waste using a suction mechanism. The heavy waste is further recovered by magnetic separation to recover the metal waste inside, and flotation to recover the remaining heavy plastic inside. The PS is carried away by water flow, then the PVC sinks and is collected in the chamber. The PET and PVC are distinguished by near-infrared, where the PET is remixed with lighter raw materials into agitation and water washing, which converts the hydrophobic particles into hydrophilic ones by high-speed agitation [16]. The fine particles attached to the plastic fragments are effectively detached during the mixing phase. Soil, glass, dust, and sticky materials are washed out of the material. The gasifiable fraction is fed to a dewatering unit and crushed to a suitable particle size to enter the gasifier. Through this process, we obtained a gasifiable feedstock-MPW from the recycled waste. Industrial analysis and elemental analysis of MPW are listed in the gasification processes.

2.2. Mixed Plastic Waste Gasification Process

The gasification of plastic waste has many advantages over direct incineration and other technologies. By controlling the composition of the oxidant and the reaction temperature, it not only reduces the production of harmful gases, but also provides syngas as a product. From a life-cycle perspective, plastics originate from petrochemical processes, and their elemental composition is overwhelmingly carbon and hydrogen. Relevant studies have shown that MPW have high energy density, low melting point, minimal moisture and ash content, and a higher heating value (HHV) of 42 MJ/kg. Composition comparison [17] is shown in Table 2.
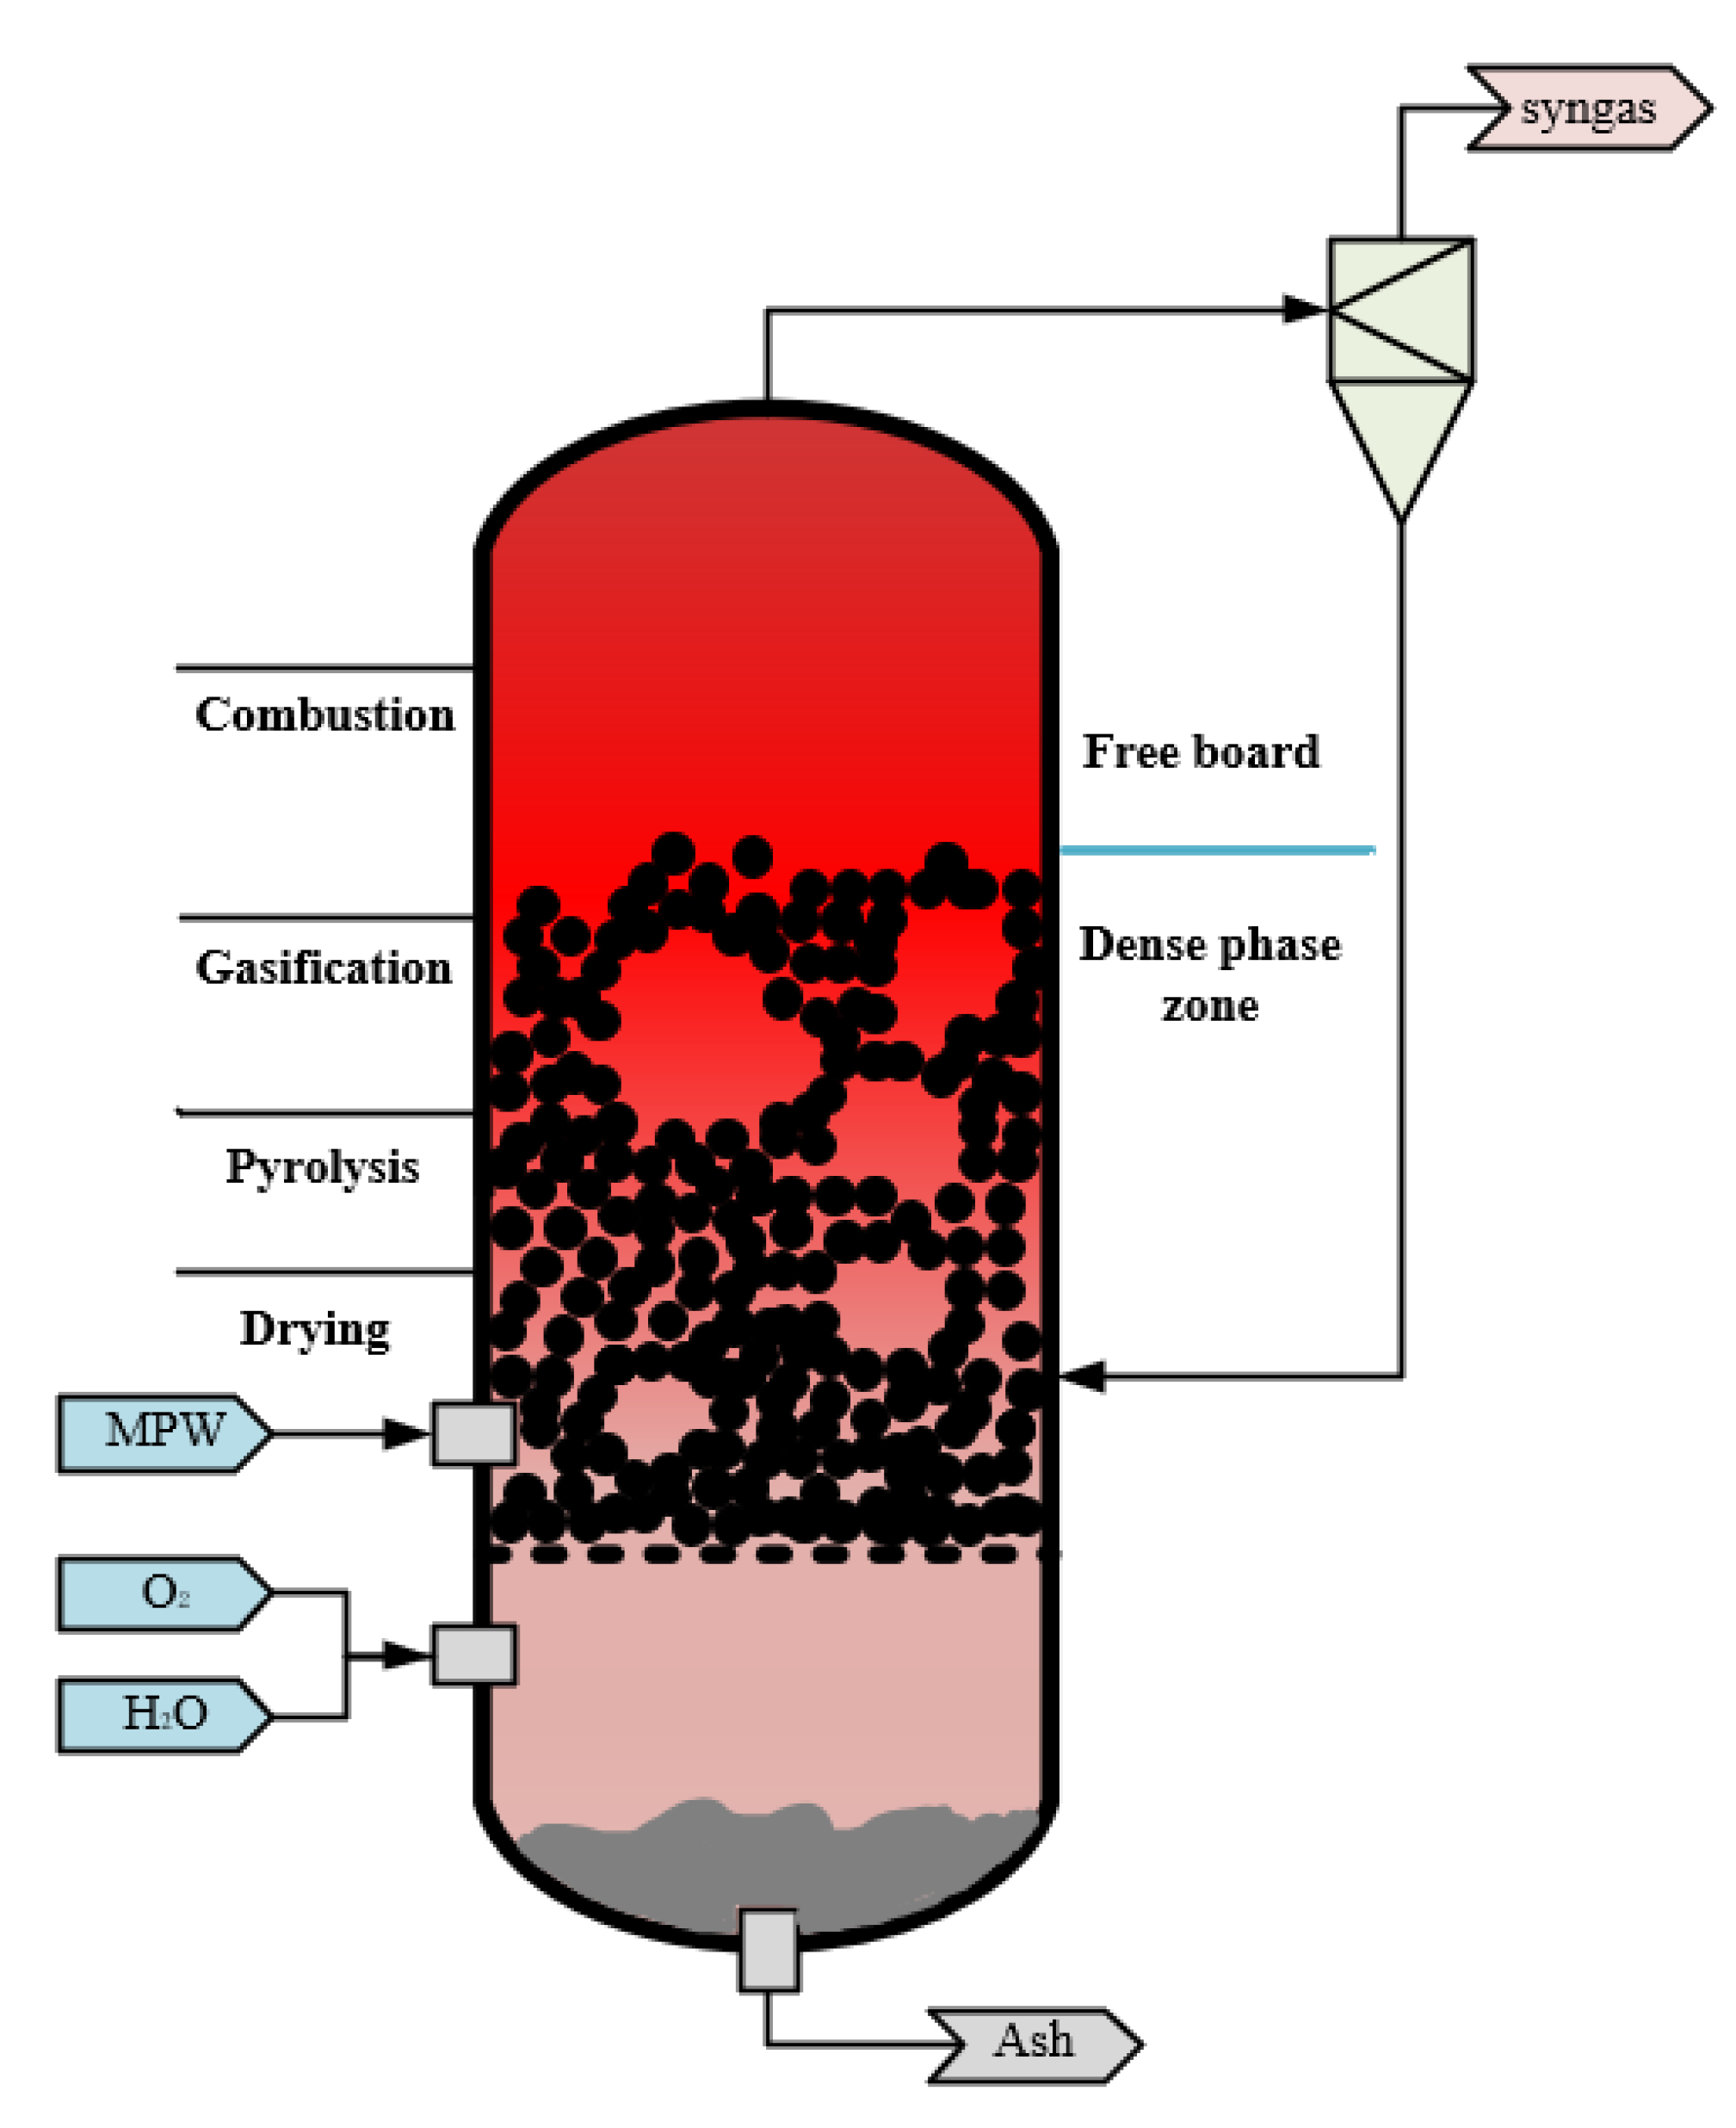
The MPW gasification process involves a series of complicated reactions that can be distributed into four steps: drying, pyrolysis, combustion, and gasification.
  • Drying: The moisture content of the waste plastic is kept below 10% by a pretreatment process. The plastic is fed into the dense phase zone instantly, where no chemical reaction takes place, and the absorbed heat is used for the phase change process of the water. This is a very fast process due to the low moisture content of the plastic.
  • Pyrolysis: A complex heat-absorbing chemical reaction occurs in this process. Volatiles and solid or carbonized residues are formed, which are influenced by process conditions such as heating rate and temperature. The raw material composition and particle size determine the distribution of the product.
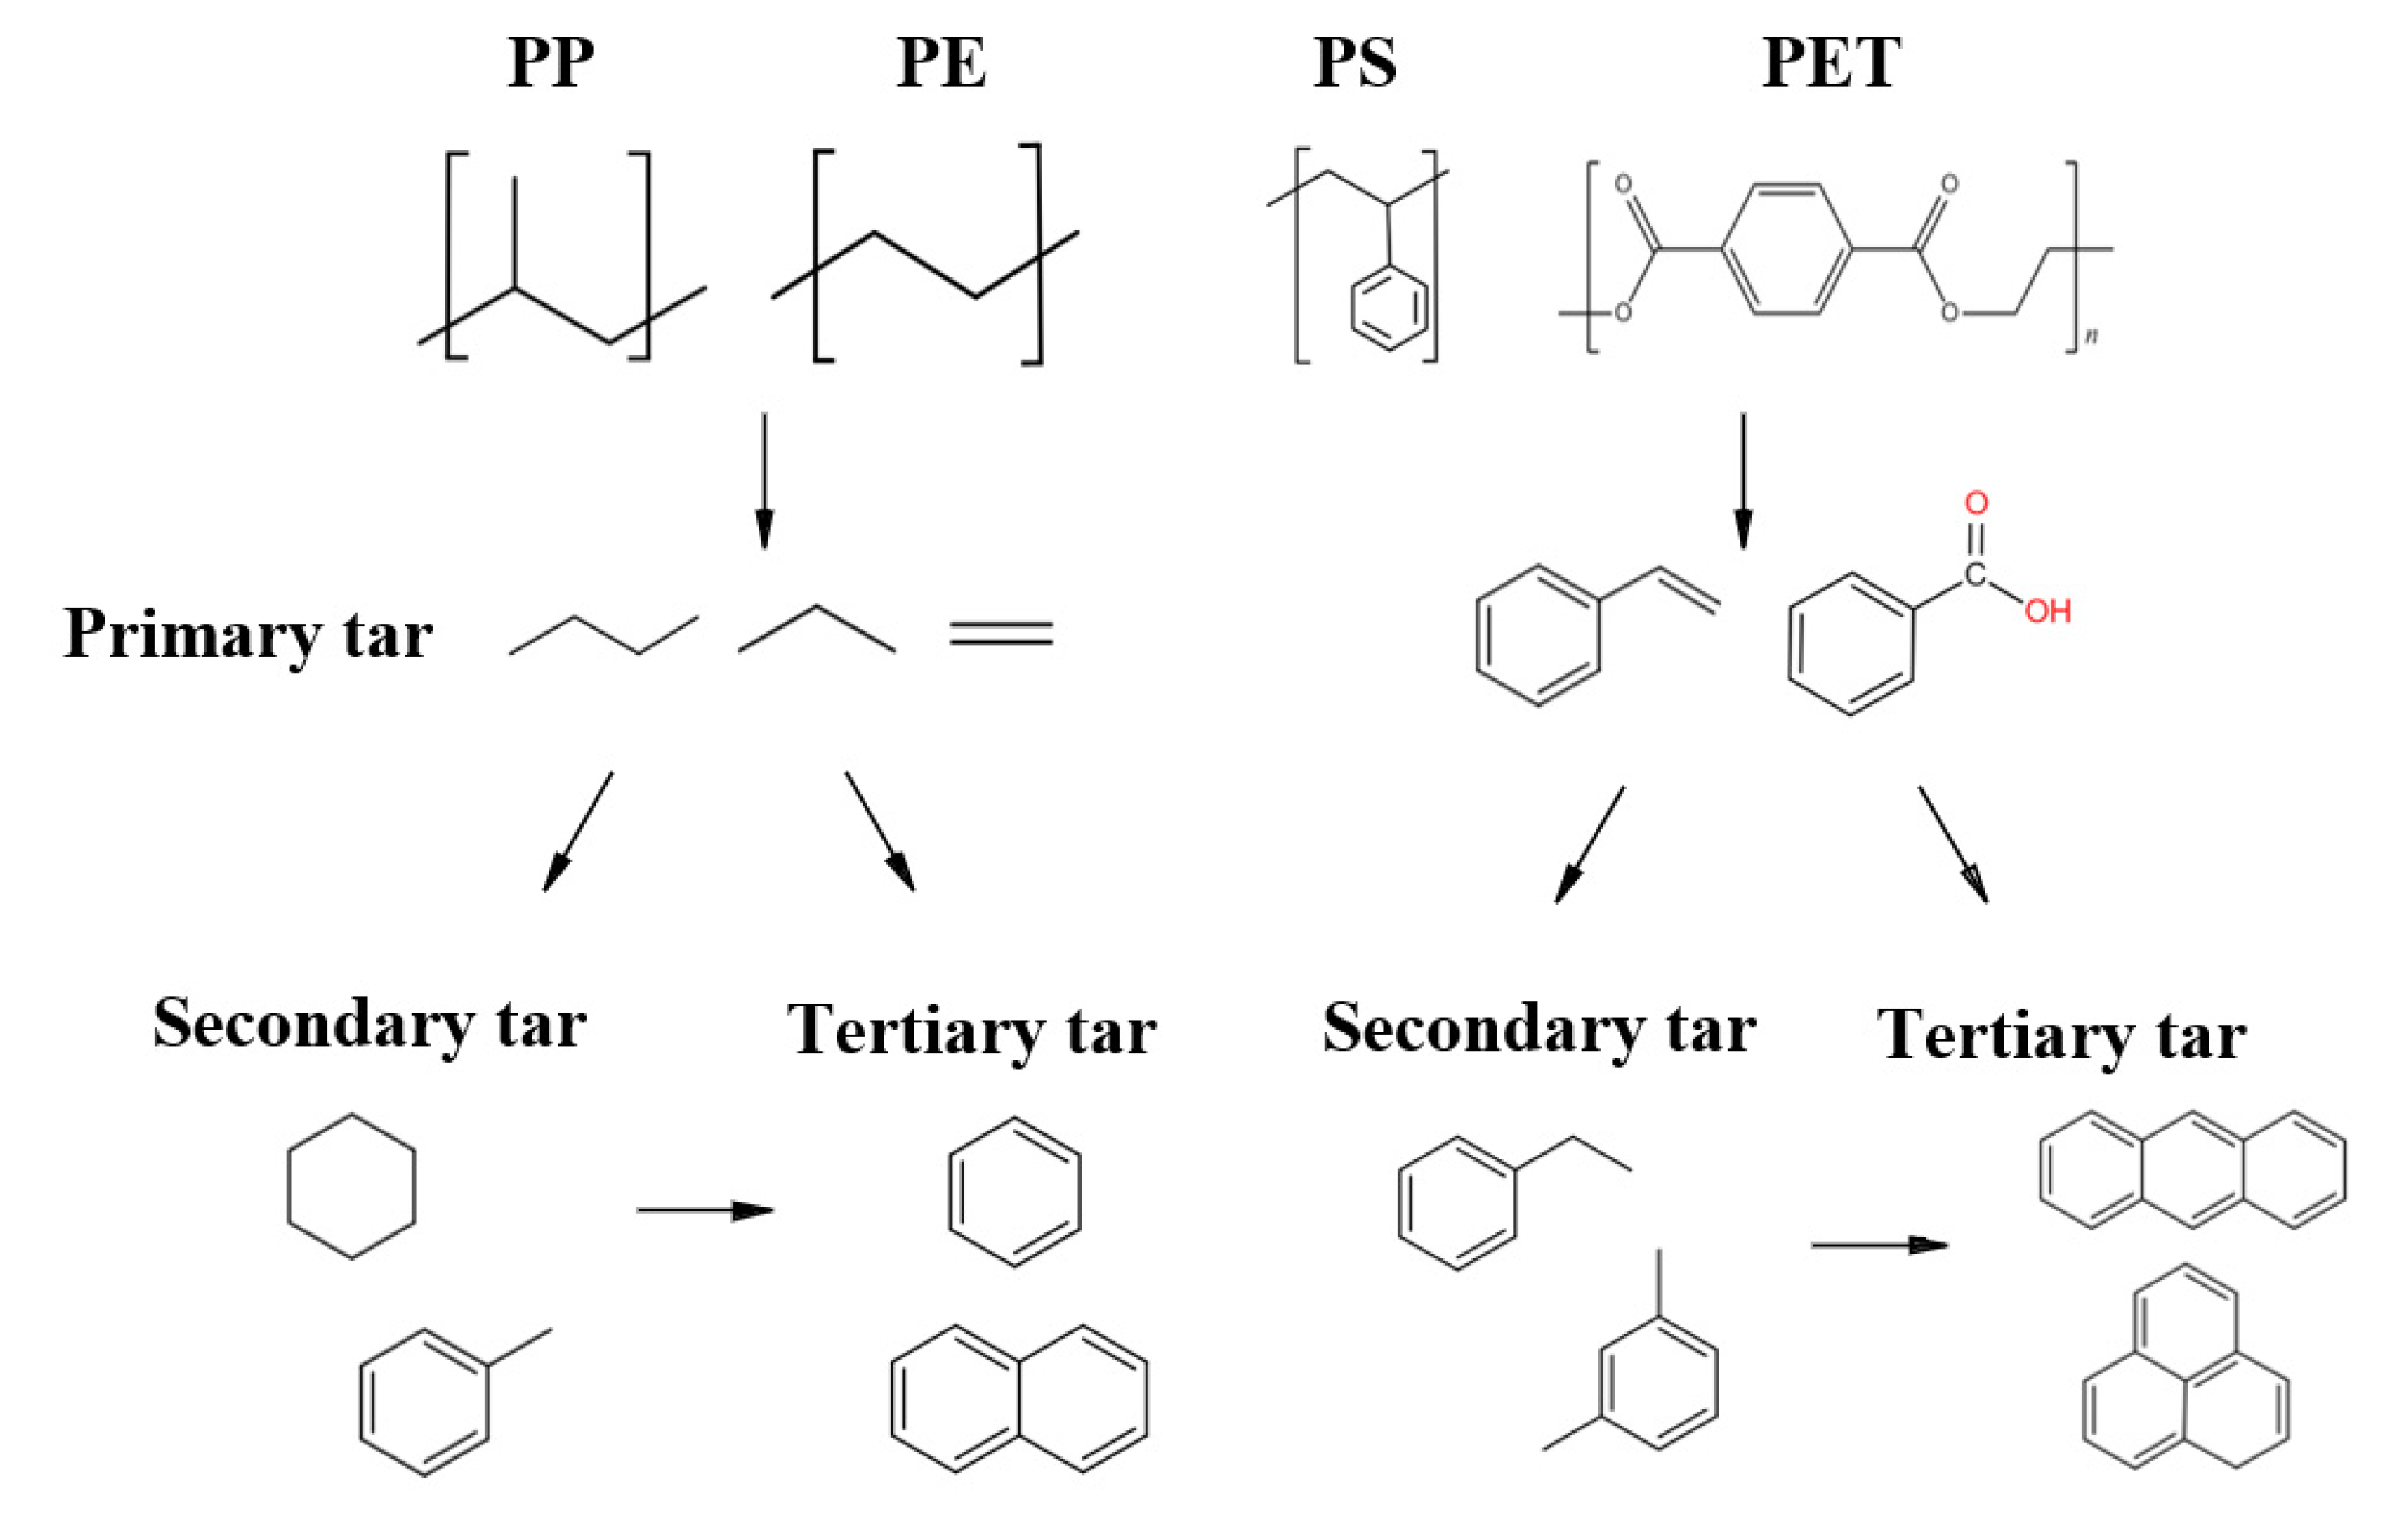
In addition, pyrolysis causes the melted plastic particles to tend to stick together and form clumps. In the case of MPW, the formation of tar depends on the nature of the polymer, as shown in Figure 2. Primary aromatic tar formation occurs only in the degradation of polymers, such as PS and PET, which already contain aromatic rings in their structure. For PP and PE, the volatiles and primary tar are composed of alkanes and olefins of different chain lengths. Components of primary tar usually have unstable properties and evolve into more stable structures, resulting in secondary and tertiary tars [18].
3.
Combustion: At elevated temperatures and in the presence of oxygen, the oxidizer reacts with the raw material in a non-homogeneous manner, producing carbon monoxide and steam. The oxidation depends on the chemical composition of the feedstock, the nature of the oxidant used and the operating conditions. This step is mainly heat release, and the energy released provides the heat required for the process.
4.
Gasification: The steam promotes two reactions at high oxygen-free temperatures: semi-coke and tar gasification, which produces large amounts of H2.
Plastic has a low thermal conductivity that causes adhesion in the gasifier. At the same time, the high volatile content of plastic leads to the easy production of tar. Therefore, a suitable gasifier design for plastics processing must consider the following. First, it should have the ability to provide a high heat transfer rate to promote the depolymerization of MPW. Second, it should have good control of the operating conditions to avoid stickiness. Finally, a suitable residence time distribution to facilitate tar cracking should be considered [19].
Bubbling fluidized bed (BFB) reactors are widely used in the gasification of solid waste. The main advantages of a bubble fluidized bed reactor are high heat and mass transfer rate, good gas–solid contact, and easy control of temperature, solids mixing mode and flexibility [19]. In this gasifier, the gas flows upward are stirring the material into a stirred emulsion of suspended particles and bubbles. Typical bed materials used in such gasifiers are sand, olivine, limestone, dolomite, or alumina.
Sancho [20] et al. conducted an air gasification with PP. It was found that dolomite was more efficient than olivine in removing tar when the same amount of additive (30%) was used on the gasifier. However, dolomite produces lots of particles that block the gas cleaning unit, so olivine is preferentially used as a gasifier bed material.
The main reactions in the gasifier are considered to be three parts: plastic pyrolysis, volatile combustion, and Water-Gas Shift Reaction. The BFB has good heat transfer conditions in the dense phase zone, and the fuel can be pyrolyzed rapidly at high temperatures. The MPW contacts with oxygen and steam at the bottom of the high temperature bed and burns rapidly to provide the heat required for pyrolysis and gasification. The gas produced by pyrolysis undergoes secondary reactions in the dilute phase zone to complete the tar cracking and carbon reduction reactions. The pyrolysis and combustion reactions are mainly concentrated in the dense-phase region, while the gas reduction reactions are mainly in the dilute phase region.
According to the process, the following assumptions were made for the establishment of this model [21].
  • The gasification process is in steady state. The temperature, pressure, import and export stream of the fluidized bed reactor are kept constant.
  • The ash in the feedstock is divided into inert components, which do not participate in the reaction of the gasification process.
  • The MPW are instantaneously and completely mixed in the gasifier, and the products’ gas composition are considered as H2, CO, CO2, NO, NO2, H2S, H2O, CH4, N2, NH3, SO2, COS. Solids are considered as ash and a small amount of unburned carbon.
The temperature of the gasifier is set at 1050 °C and pressure is 0.2 MPa. The oxidizer is oxygen mixed with steam. Solid slagging is applied, and daily processing capacity of a single furnace is 50 tons. The schematic is shown in Figure 3.
The reactions in the gasifier are so complex that only a few major chemical reactions are considered here:
C + O2 → CO2
2C + O2 → 2CO
C + H2O → CO + H2
CO + H2O → CO2 + H2
C + CO2 → 2CO
C + 2H2 → CH4
CH4 + H2O → CO + 3H2
CH4 + 2H2O → CO2 + 4H2

2.3. Syngas Purification

In the process of generating syngas from MPW, the sulfur and nitrogen elements contained in MPW will make the SOX and NOX emissions which will contribute to acid rain and photochemical smog if they are emitted into the atmosphere. Selective catalytic reduction (SCR) technology has the advantages of simple structure, high denitrification efficiency, reliable operation, and easy maintenance.
The main reaction equations are:
4NO + 4NH3 + O2 → 4N2 + 6H2O
6NO + 4NH3 → 5N2 + 6H2O
6NO2 + 8NH3 → 7N2 + 12H2O

2.4. Oxygen Production

Currently, cryogenic air separation (CAS) is used in a large scale in industry with high purity and output. However, the disadvantages are complex process, more equipment, high system capacity requirements, long start-up time, high maintenance costs and power consumption. The power consumption of oxygen production is about 0.5–0.8 kW/Nm3. Vacuum Pressure Swing Adsorption (VPSA) technology has the advantages of low energy consumption [22], high product purity, low production volume, simple process flow, low pretreatment requirements, easy and reliable operation, and high automation level. In this paper, the MPW feedstock determines that lower quantity oxygen is enough [23]. VPSA is well adapted to the process requirements.
VPSA relies on the preferential adsorption of the adsorbent at different pressures to achieve gas separation. VPSA has the advantage of better energy consumption and investment and operating costs compared to CAS, but oxygen purity is slightly reduced (80–95 mol%). The minimum oxygen production consumption [24] is about 0.289 kw/Nm3 O2.
The process uses different adsorbents to achieve high-pressure adsorption and low-pressure desorption. The main adsorbents used in industry are activated alumina and molecular sieve adsorbents. Activated alumina (Al2O3) is a solid with a strong affinity for water and CO2 from the air. Zeolite molecular sieve adsorbent is a crystalline meta-silica aluminate containing alkaline earth elements, which has a strong adsorption selectivity for N2.
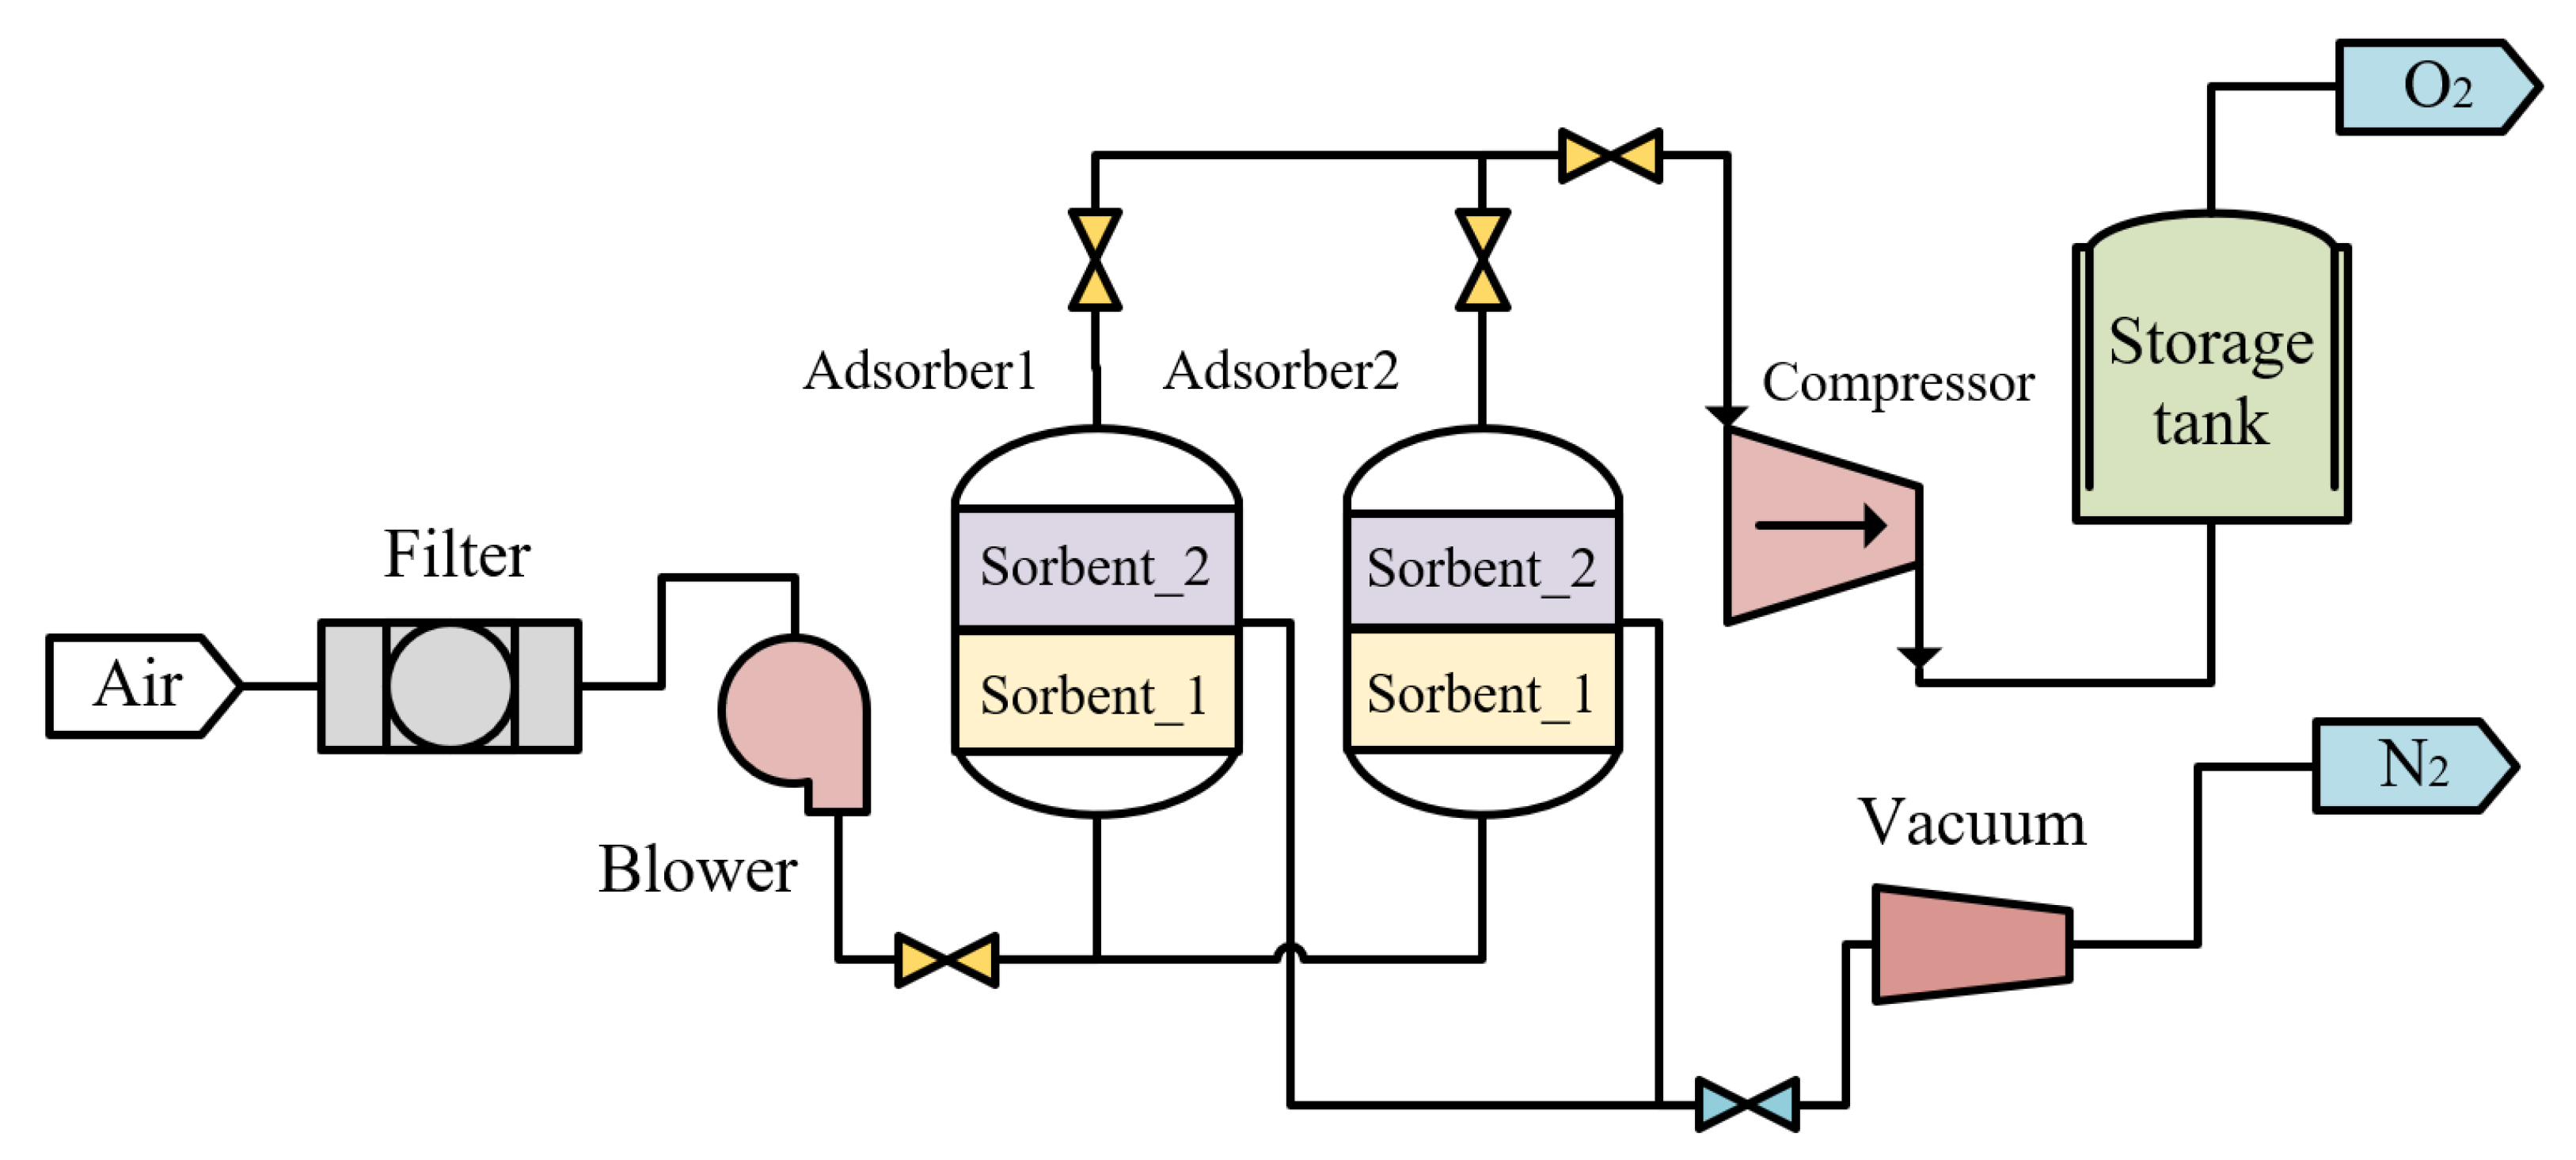
The original VPSA process was proposed by Skarstrom [25]. As shown in Figure 4, the process consists of adsorption, reverse discharge, purgation, and pressure boosting in a sequential cycle. The lower part of the adsorber is filled with activated alumina and the upper part with zeolite molecular sieve. The pressurized air is passed through the adsorption tower with different adsorbents to get oxygen in the storage tank. Then, the oxygen valve is closed and the reverse discharge valve is opened. The adsorbed impurity (such as nitrogen and steam, carbon dioxide, etc.) are pumped out by the vacuum pump. After subsequent flushing of the adsorption tower, the reverse discharge valve is closed to re-adsorb oxygen for production.

2.5. Calcium-Looping Process

Chemical looping combustion is a chemical conversion and energy utilization technology that aims to achieve efficient resource utilization and low consumption separation. Not only does it avoid the shortcomings of conventional technology, but it also enables low energy consumption for CO2 capture and pollutant removal. It is a process intensification technology that couples the separation of combustion reactions into two steps to obtain electricity and synthesize hydrogen and other chemicals directly or indirectly. The waste adsorbent produced in the reaction cycle can be utilized as raw material for cement plants. The concentration of CO2 in the tail gas of the treated absorption is low, which can mitigate the greenhouse effect. The main reaction equipment for the reaction of calcium-based adsorbents with flue gases is a fluidized bed. The reaction has the characteristics of strong solid mixing, sufficient gas–solid phase contact and high heat transfer coefficient.
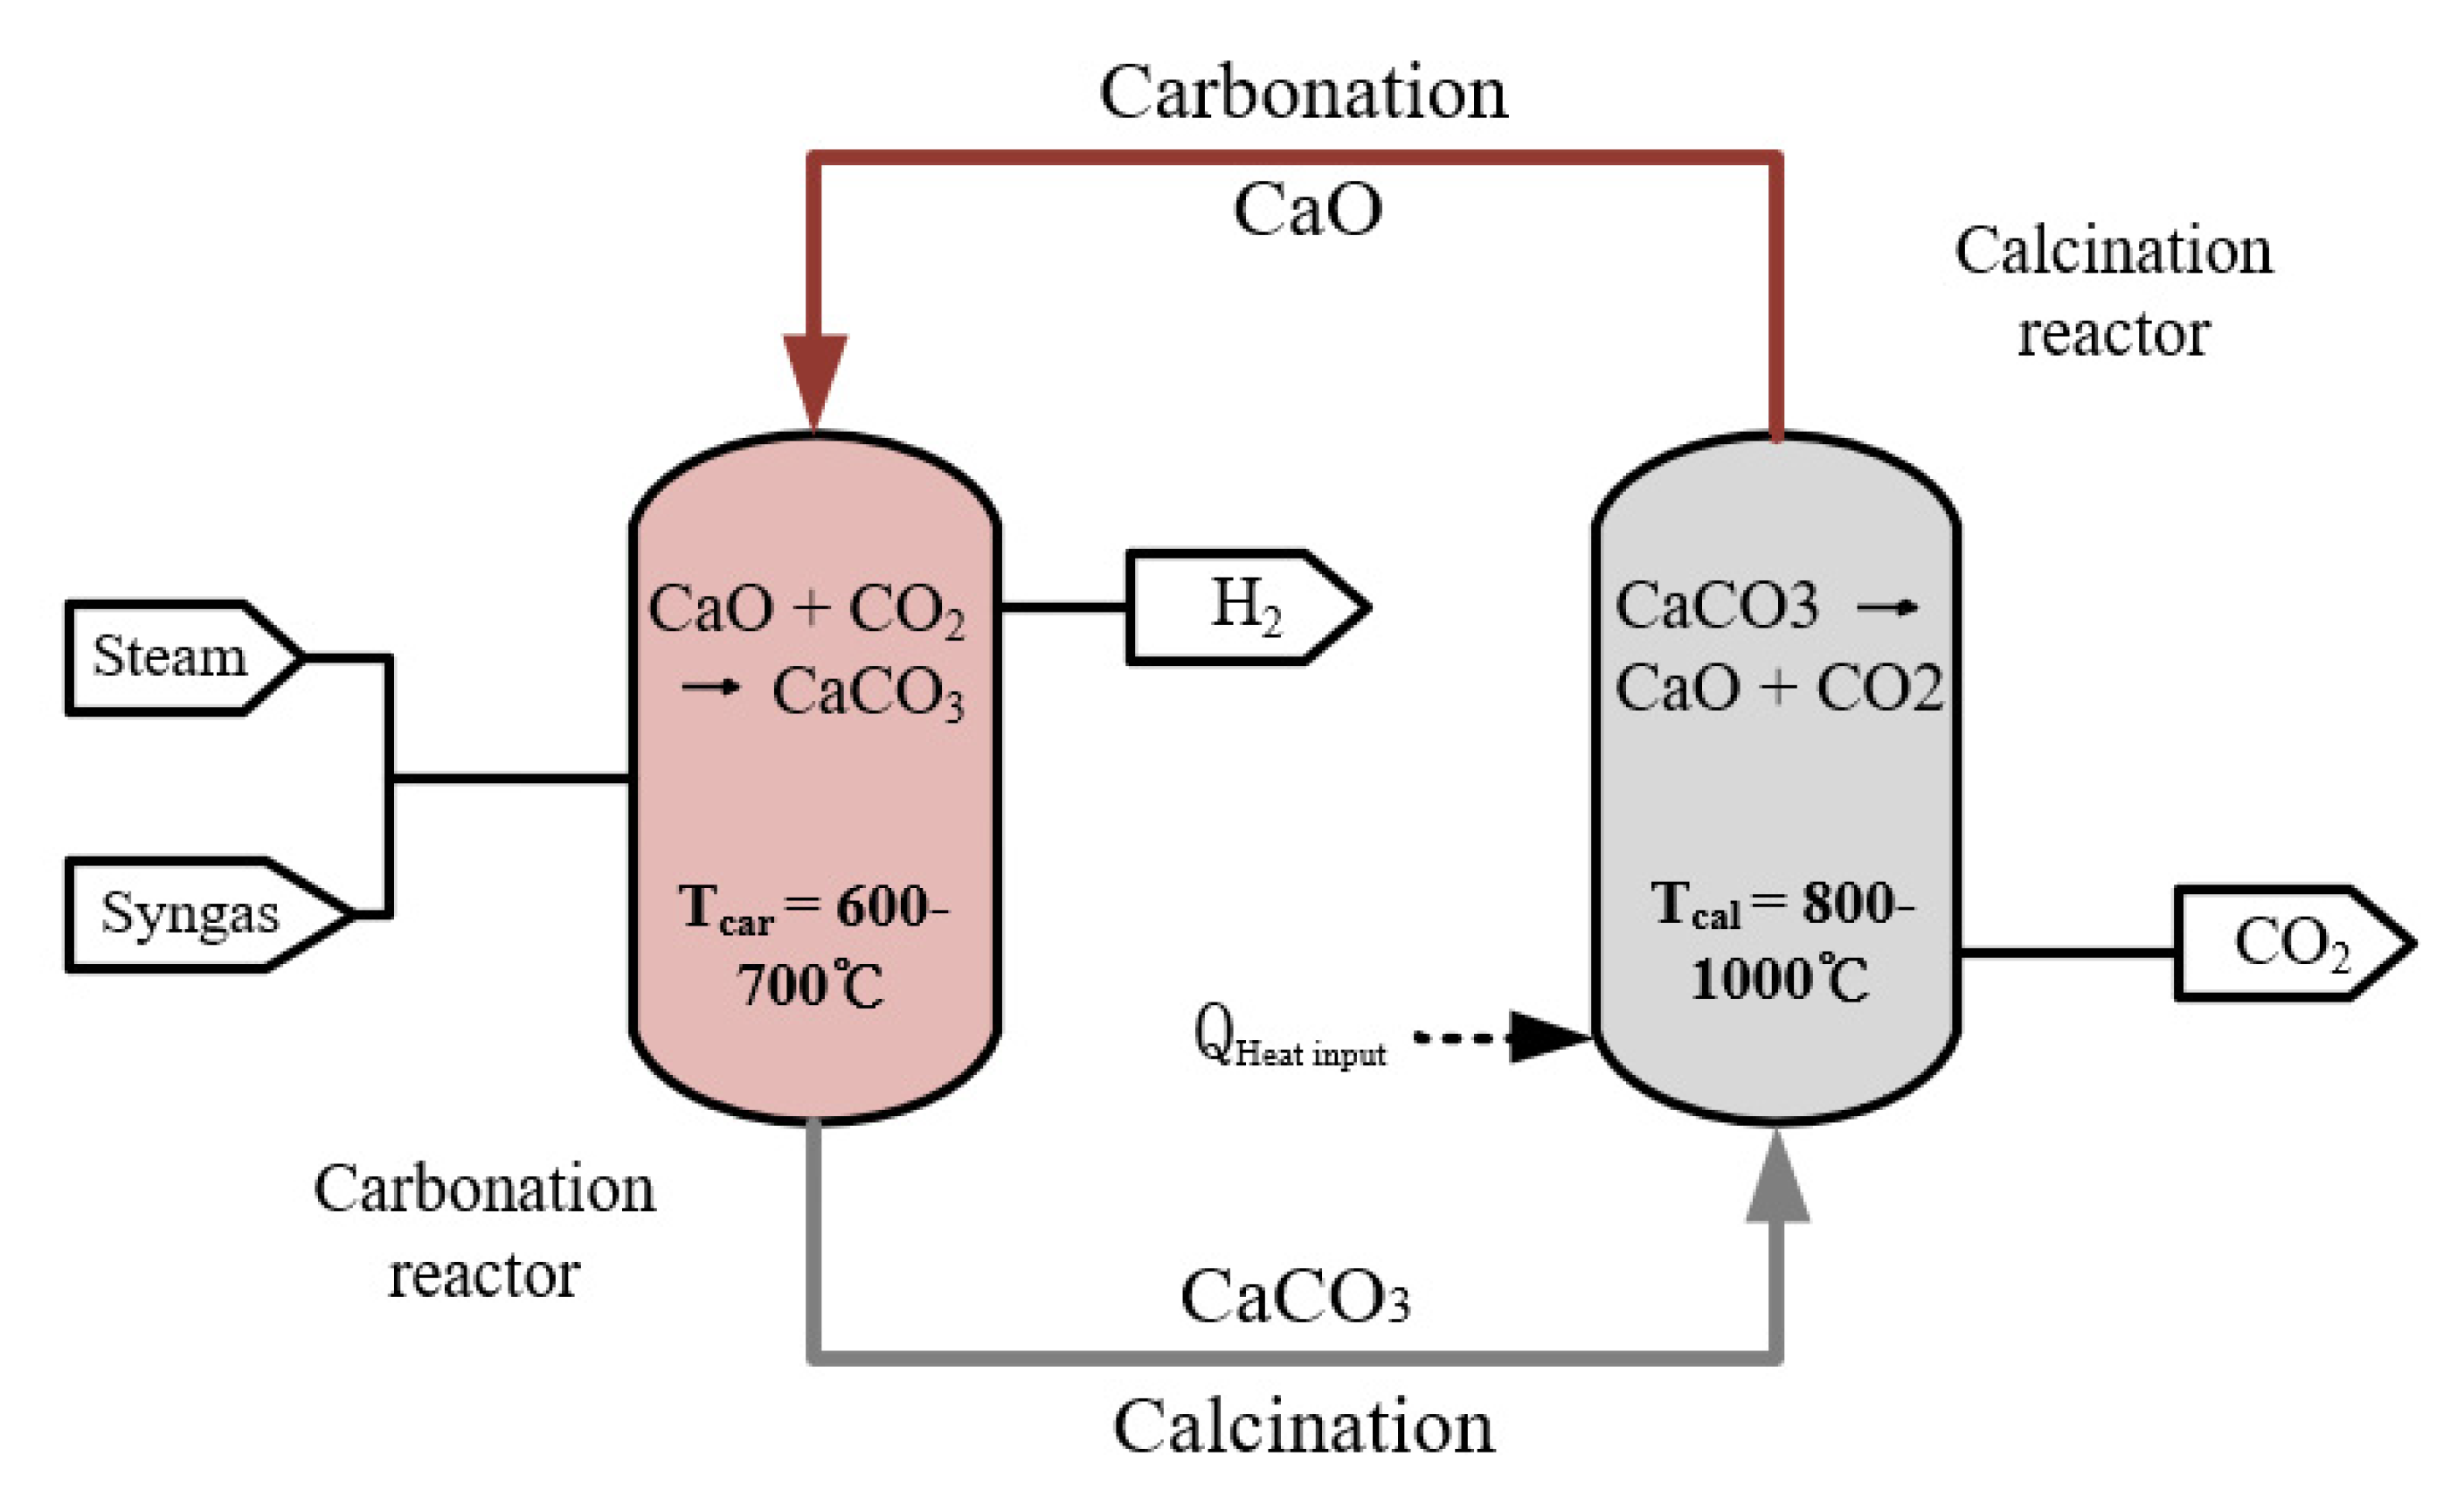
The calcium-looping (CaL) is a process regarding the reversible calcination reaction of carbonates. Natural calcium carbonate (CaCO3) is the raw material of the adsorbent, which can produce the porous active ingredient CaO after calcination. The high specific surface area CaO and CO2-rich syngas enter the carbonation reactor for gas–solid exothermic reaction [26] at 600–700 °C. The waste heat from the carbonation reactor can be used to generate high quality steam for the steam turbine and the H2-rich syngas is heat exchanged with a waste heat boiler. The carbonate reactor produces H2-rich syngas after absorption of CO2, which reduces the cost of purification. The generated CaCO3 mixed solid enters the calciner and decomposes to obtain high-purity CO2 and CaO. Calcium oxide enters the carbonation reactor for circulation and CO2 is compressed and trapped in the storage tank. The calcination reaction occurs at 800–1000 °C in a heat absorption reaction, in which the heat is supplied by combustion of the residual gas after separation of H2. However, it will reduce the cold gas efficiency (CGE) because part of the gas is used for combustion.
The main reactions of the carbonation reactor are as follows:
CaO + CO2 → CaCO3
H2O + CO → CO2 + H2
CH4 + 2H2O → CO2 + 4H2
The main reactions in the calcination reactor:
CaCO3 → CaO + CO2
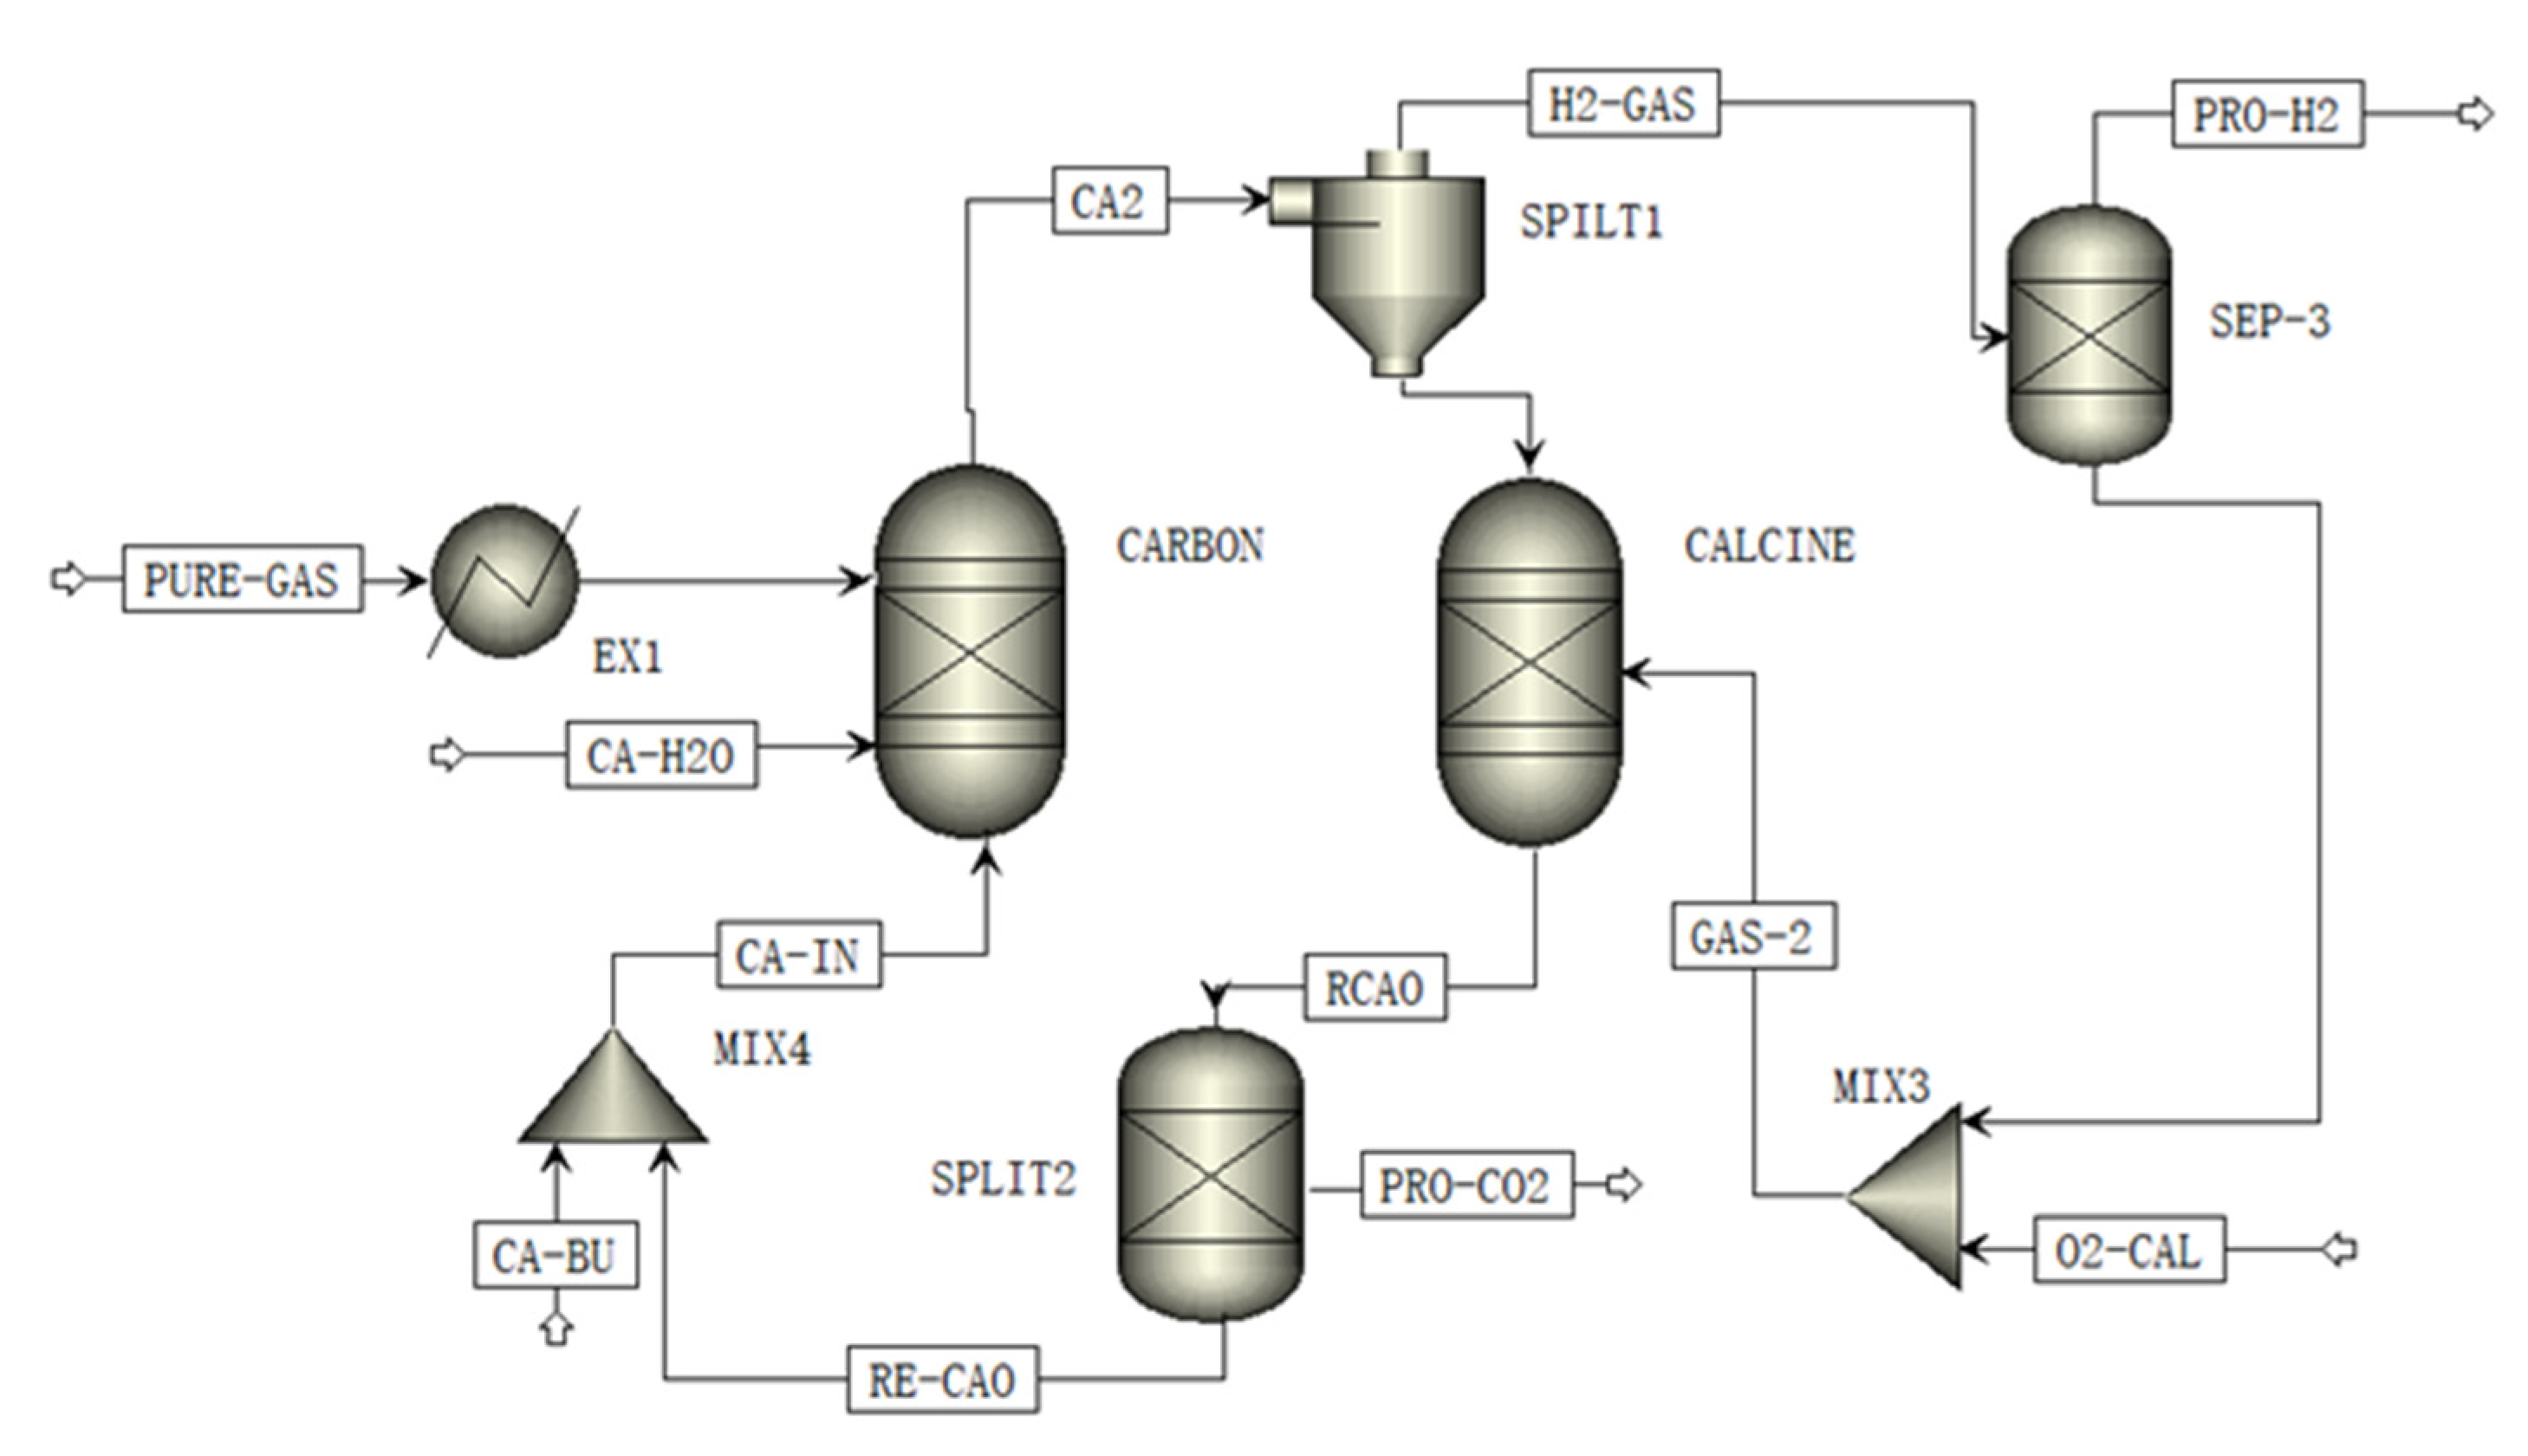
Figure 5 explains the process. The purity of the CO2 can reach 99% in the system. The operating temperature of the carbonation reactor is 630 °C and the temperature of the calciner is 950 °C. We set the supplemental limestone flow rate to 0.04 times of carbon dioxide discharge. The CO2 recirculation ratio is 0.6 where the release rate is 0.04 and the gas–solid separation efficiency is assumed to be 1 [27].

3. Process Simulation

Aspen Plus integrates simulation, optimization, sensitivity analysis and economic evaluation. It has relatively complete unit operation modules such as reactors, separation units, solids operation units, etc. It also provides extremely rich physical data. We can use the whole device material balance and heat balance calculation to get the physical properties of each flow in the system, heat load curve of heat exchange equipment, vapor–liquid phase load of each layer of the tower plate, thermodynamic properties and transfer properties. It has features such as design specifications and sensitivity analysis, which provide powerful help for process analysis and optimization. The physical property method used globally is PR-BM

3.1. Gasification Process

The mathematical model of BFB is generally an equilibrium model or a kinetic model. The modelling is generally considered in terms of thermodynamic equilibrium and chemical equilibrium [28]. The equilibrium model assumes that all chemical reactions of the gasification process reach equilibrium, and then solves the mass and energy balance equations of the gasification process to obtain the gas composition and equilibrium temperature. In this study, the thermodynamic equilibrium model of the gasifier was developed by the Gibbs free energy minimization method.
According to the gasification process of waste plastics in the bubbling fluidized bed, the gasifier is simulated by material drying, plastic pyrolysis, fuel combustion, and syngas reforming. The simulated gasification process is shown in Figure 6.
The simulation of the gasification unit consists of 11 modules, 15 stream and 4 energy streams. Four reactors are used to simulate drying, pyrolysis, combustion, and gasification. First, the DRYING simulates the drying process of waste plastics instantly entering the fluidized bed. The dried material is further pyrolyzed and the generated steam is used for subsequent reactions. Secondly, the PYROLYS simulates the cracking reaction of waste plastics in the dense-phase region, which breaks down and converts waste plastics into single-element molecules. At the same time, the non-conventional components are changed into conventional components. Thirdly, the COMBU represents the combustion of partial coke and tar in oxygen. Finally, the GASIFIER simulates the gasification process of waste plastics in the free board, where chemical reaction equilibrium and phase equilibrium are reached in the reactor based on Gibbs free energy minimum [29].
We established a mechanism model of waste plastic gasification in bubbling fluidized bed by Aspen. In order to verify the validity and generality of the model, we used the reaction temperature, pressure and feedstock composition of the waste plastic gasification experiments in the literature as the input conditions of this model. Then, the simulation results of the model are compared with the experimental results of the literature by comparing the syngas results of the gasification model and MPW gasification experiments [30,31,32] under the same conditions. The comparison results are shown in Table 3. By comparing the main composition of syngas, it is known that the established gasification model is accurate.
In addition, the cold gas efficiency (CGE) that is the ratio of the syngas’ energy to the energy of complete combustion of the dry MPW is often used to evaluate the performance of gasifiers. In this study, the key operating variables of the gasification process are steam quantity, oxygen quantity, gasification temperature and pressure. We define the gasification oxygen consumption (GOC), the gasification steam consumption (GSC), the gasifier temperature and operating pressure to evaluate the gasification model. GOC is defined as the ratio of the actual to the ideal oxygen feed ratio, as shown in Equation (16). GSC is defined as the ratio of steam consumption and MPW feed, as shown in Equation (17).
G O C = F O 2 F M P W r e a l i t y F O 2 F M P W i d e a l
G S C = F H 2 O , G A S F M P W
According to the study [33], the ideal oxygen to material ratio is calculated by the formula:
F O 2 F M P W i d e a l = 1 0.98 × 1.866 × [ C ] + 5.55 × [ H ] + 0.7 × [ S ] 0.7 × [ O ] × 100 %
where F O 2 represents the oxygen feed to the gasifier and F M P W represents the feed of MPW. F H 2 O , G A S represents the steam feed to the gasification section.
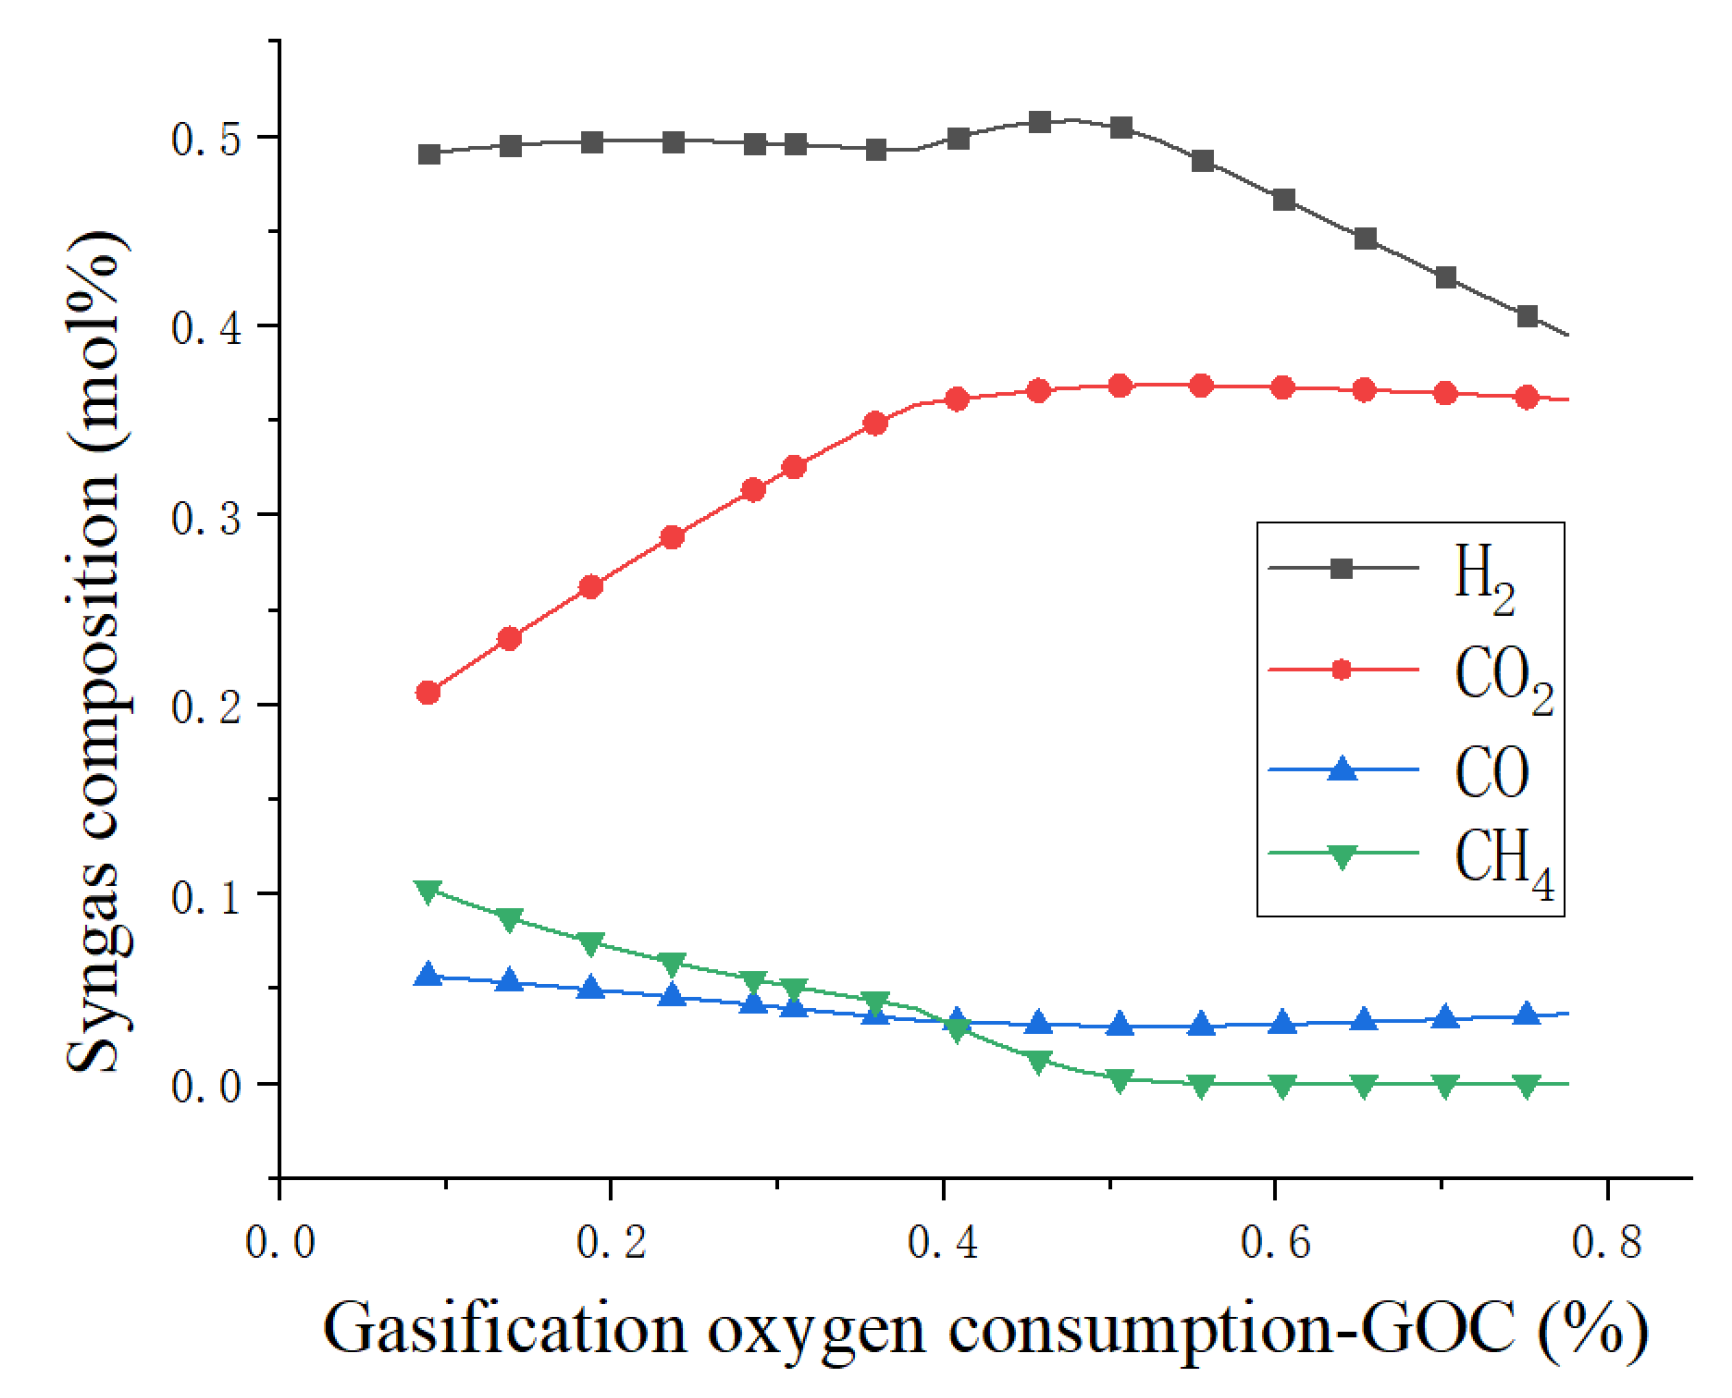
First, we analyzed the relationship between oxygen dosage and syngas outlet composition. We simply fixed the steam quantity to be half of the MPW feed so that GSC is 0.5. Figure 7 shows that the composition of hydrogen increases and then decreases as the amount of oxygen increases. At the same time, CO2 gradually increases due to the complete combustion of MPW. In order to make the maximum amount of effective gas components (H2 and CO), we take GOC as 0.21.
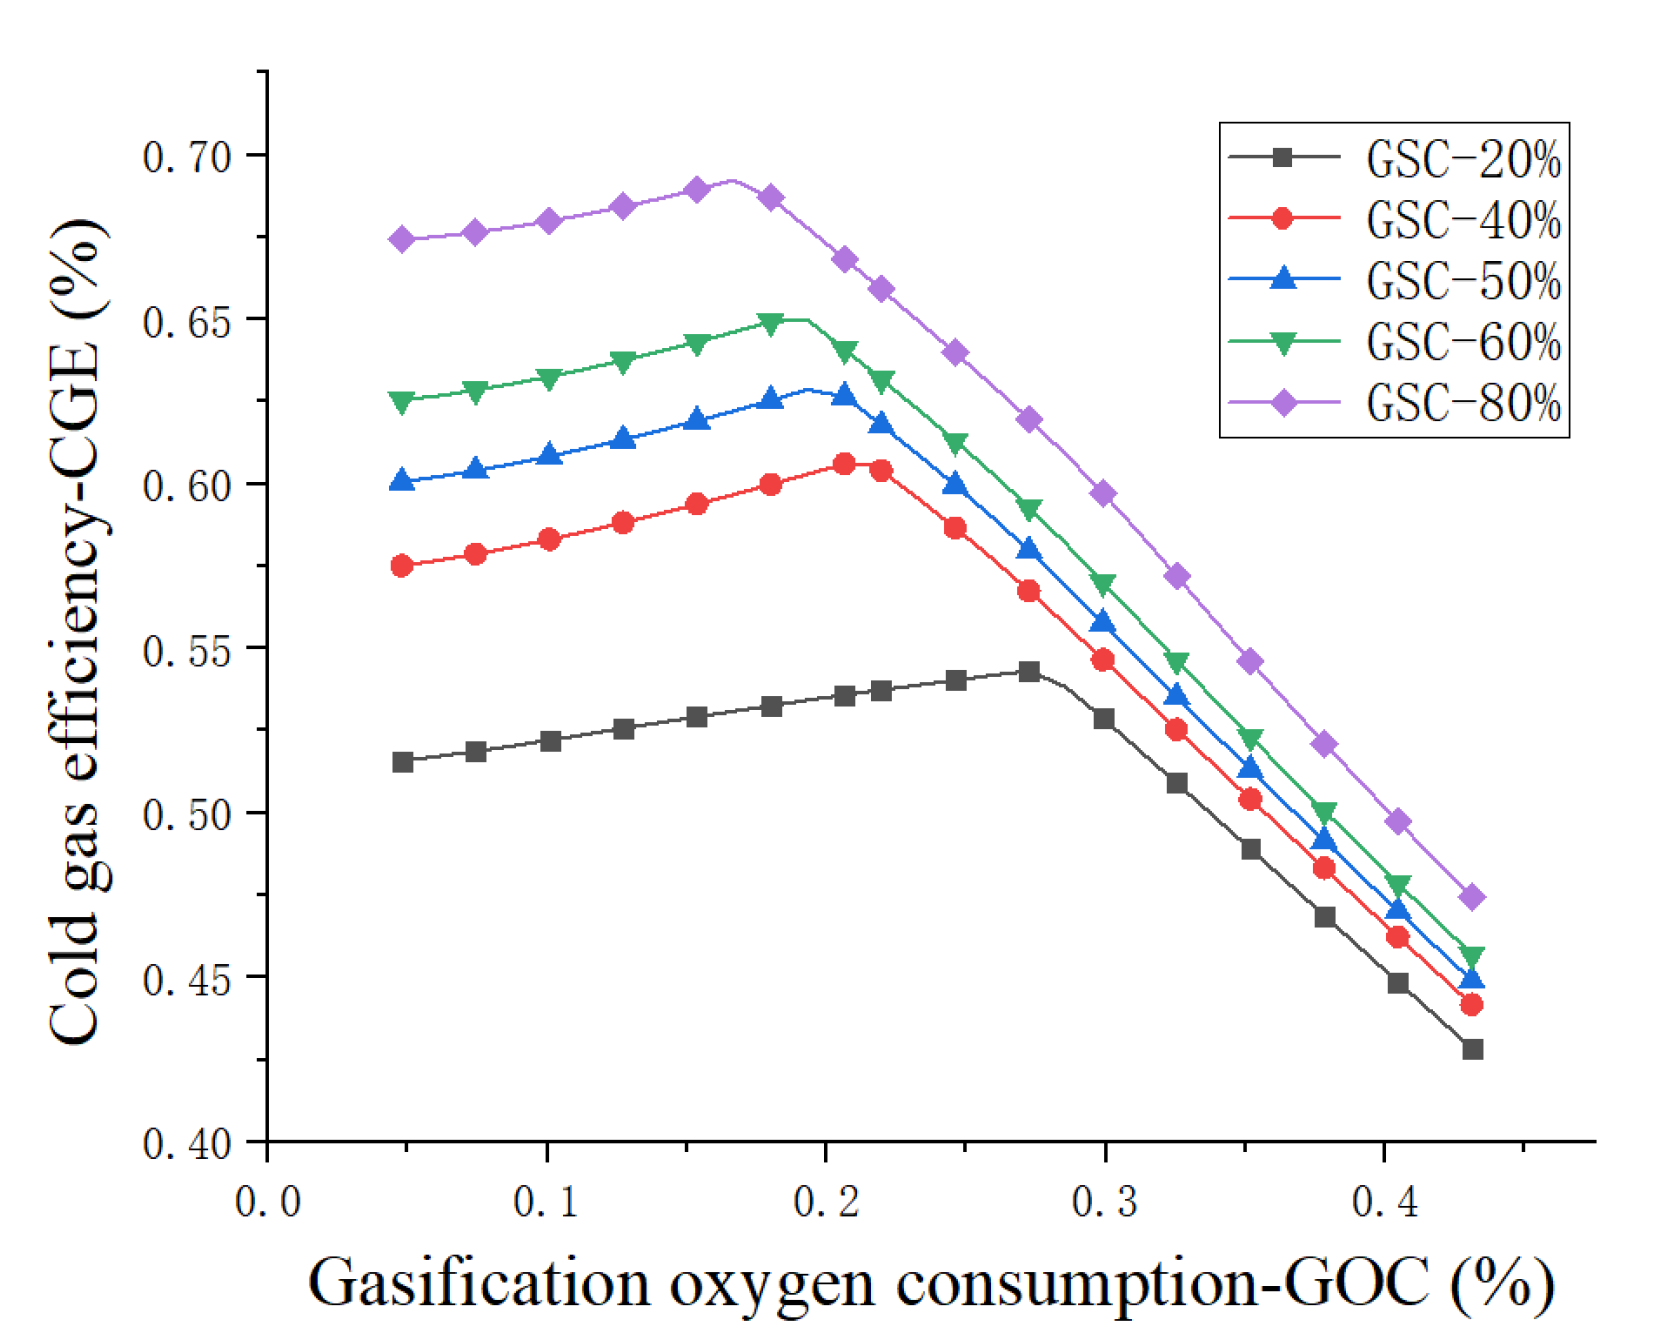
In order to observe the effect of steam dosage and oxygen dosage on the CGE, Figure 8 shows the effect of oxygen dosage on CGE at different steam dosage. At different steam dosage, the growth of oxygen quantity causes the CGE to first increase and then decrease sharply due to the excess oxygen that results in complete combustion of MPW. From the graph, it seems that the increase of steam dosage is beneficial to the improvement of cold gas efficiency.
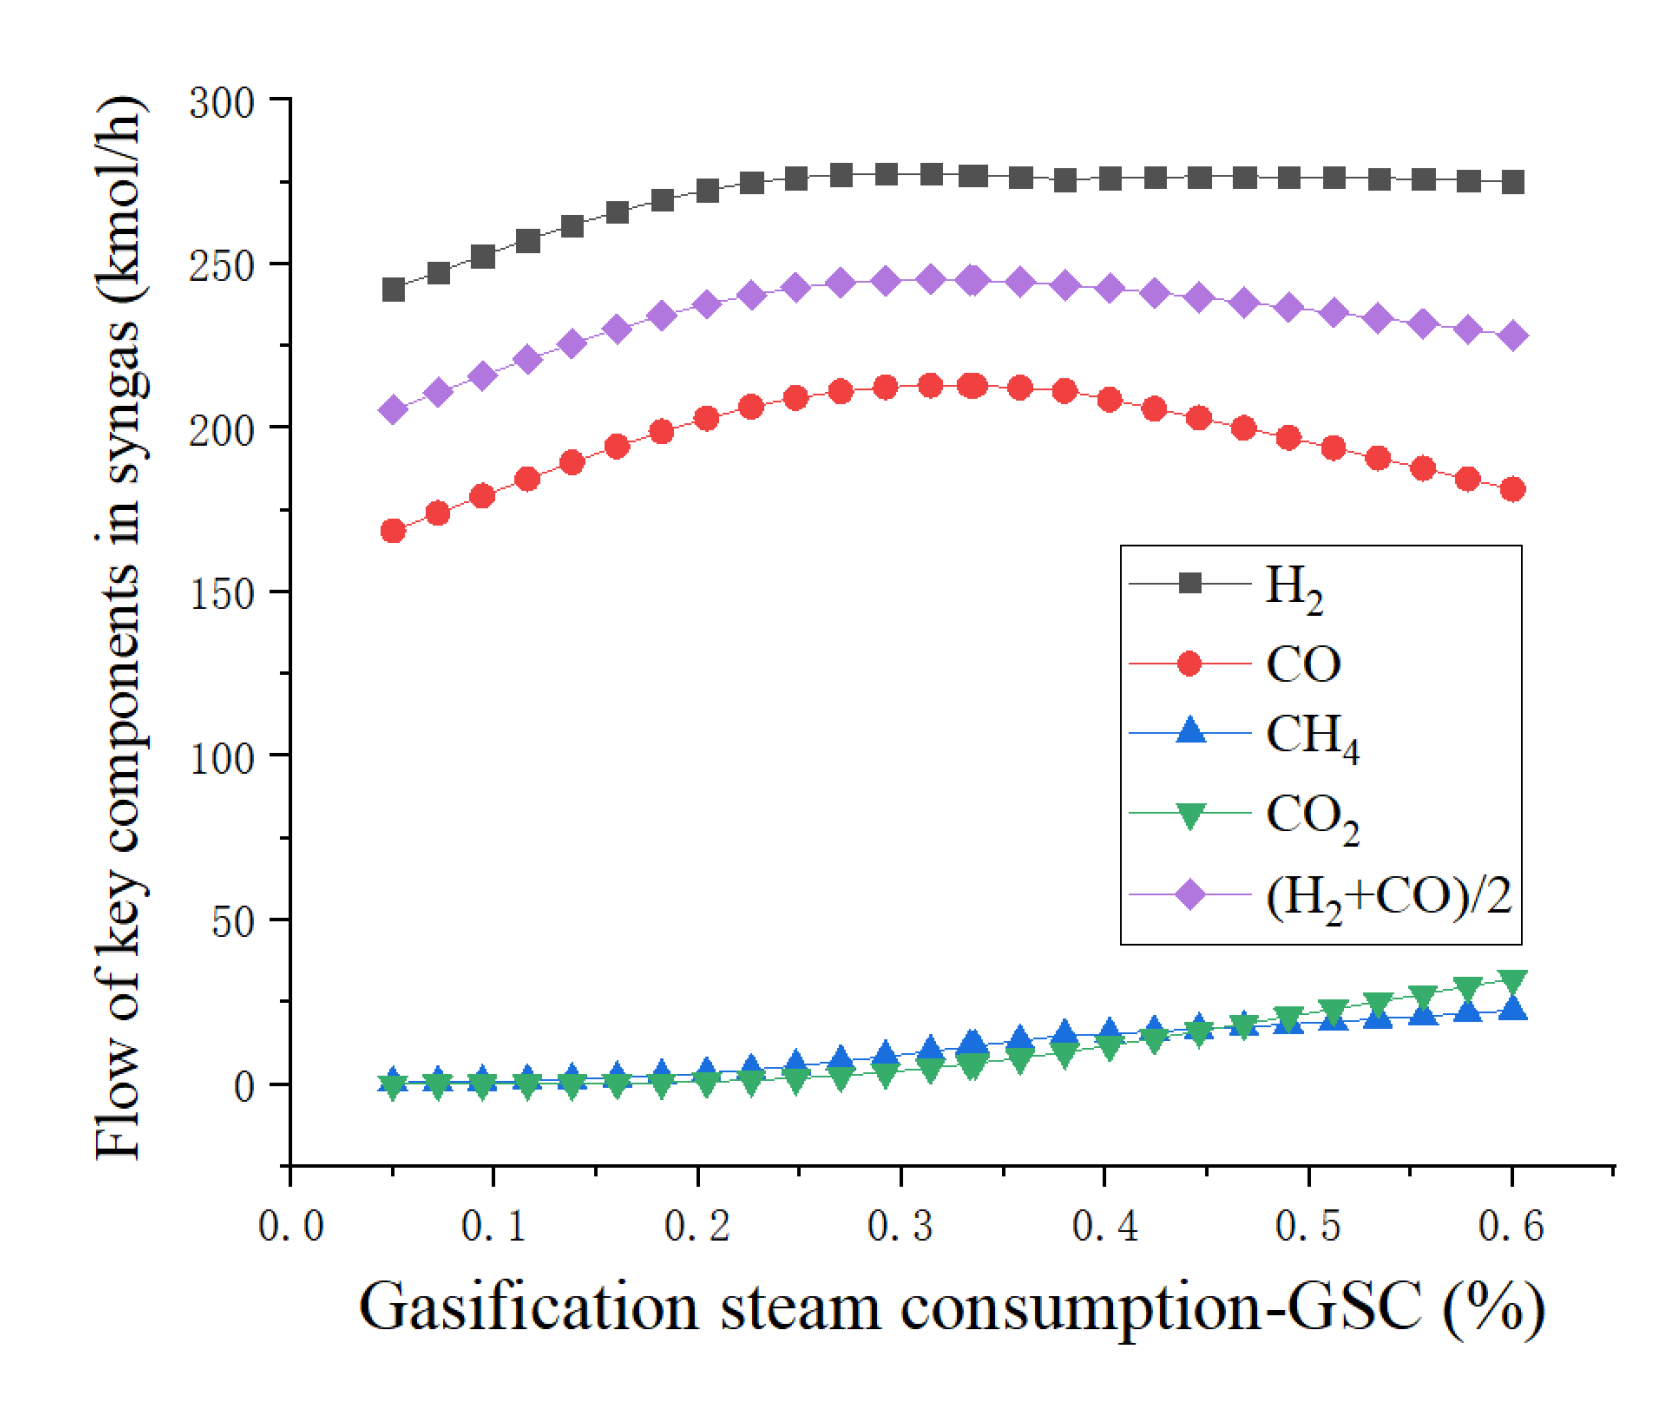
Once the GOC is determined to be 0.21, we proceed to determine the gasification steam consumption. From the previous process we know that the increase of steam amount can improve the efficiency of cold gas. However, too much water consumption is not good for the environment and decreases the gasification temperature which greatly increases the energy consumption of the gasification process. After comprehensive consideration, we decided to set the GSC at 0.31, especially considering the effect of steam usage on the flow of active ingredient in the syngas in Figure 9. In this design, the raw material composition of MPW is shown in Table 4.

3.2. Vacuum Pressure Swing Adsorption Process

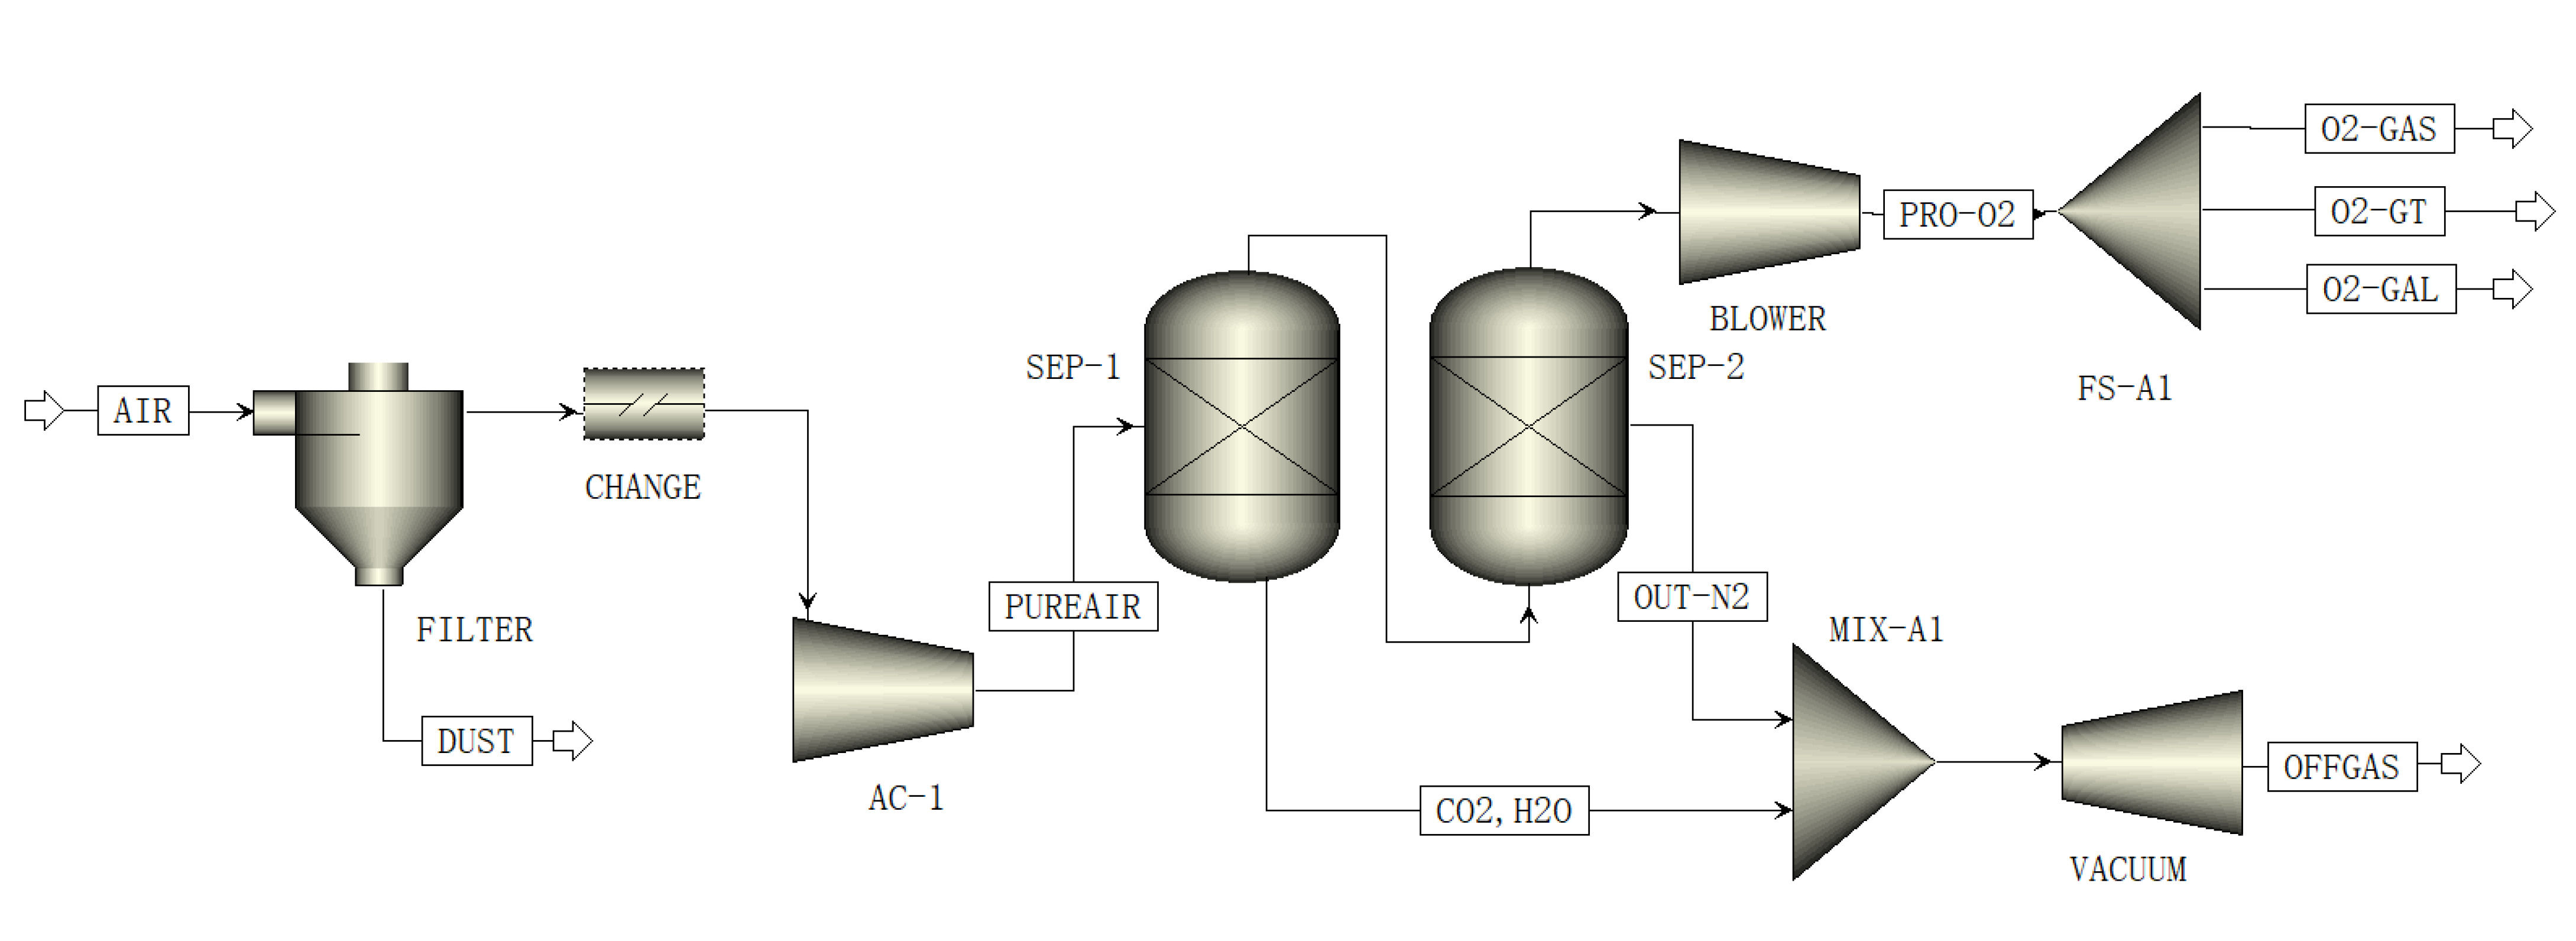
The process of VPSA is shown in Figure 10. The AIR flow represents an air feed with 21 mol% oxygen, 78 mol% nitrogen, 0.94 mol% moisture and rare gases, 0.03 mol% CO2, and 0.03 mol% dust (dust is assumed to be a mixture of tiny particles of CaCO3, SiO2, and Fe2O3). First, the AIR enters the FILTER to remove the dust. Then, PUREAIR enters the adsorption column SEP-1, which is filled with activated alumina, and adsorbs water, carbon dioxide, and a small amount of other gas components. Then, it enters the SEP-2 filled with zeolite molecular sieve, which adsorbs the nitrogen. The oxygen purity of PRO-O2 was obtained as 80.11%, the oxygen recovery rate was 65.61%, and the cost of oxygen production was 0.313 Kw/Nm3 O2. The O2-GAS goes to the gasifier, the O2-CAL to the calcium cycle, and the O2-GT to the gas turbine. The whole process is intermittent. After the adsorption is completed, the VACUUM is opened to extract the gas from the adsorbent. The OFFGAS is the desorbed moisture, nitrogen, and carbon dioxide [24].

3.3. Calcium-Looping Processes

The purified syngas PURE-GAS enters the carbonation reactor CARBON, and CaO absorbs CO2 in the syngas while reacting with the WGSR, which can supply energy to the WGSR due to the heat released from the carbonation reaction, enhancing the conversion of methane. After generating the solid phase CaCO3, it greatly improves the CO conversion rate. The related unit operation simulation schematic [34] is shown in Figure 11.
The selected modules and operating conditions for each unit operation are given by Table 5.
The key operating variables of the carbonation reactor in CaL process are the calcium oxide feed, the steam feed, and the reaction temperature. Our analysis defined several variables by sensitivity. CaO consumption in the calcium-looping (CAC) is defined as the amount of calcium oxide over the MPW feed. In addition, steam consumption in the calcium-looping (CSC) is the main influence on the composition of the export gas, which is defined as the ratio of the steam feed to the MPW feed. Incidentally, the temperature of the carbonation reactor (Tcarbo) and the temperature of the calcination reactor (Tcalci) are also key variables.
C A C = F C a O F M P W
C S C = F C A H 2 O F M P W
From Figure 12 and Figure 13, we can draw the following points. From Figure 12a and Figure 13a, we explored the effect of CaO dosage on the exit composition of the hydrogen-rich syngas, which led us to find that the gas no longer varies after CAC of 2.5. It shows CaO flow is 200 kmol/h. In the same way, we derived from Figure 12b and Figure 13b that the CSC is 0.86, which means that the steam flow rate in the CaL process is 215 kmol/h. Finally, we considered the reaction rate and the calcium carbonate decomposition temperature, as well as the exit gas phase composition. We determined the reaction temperature of the carbonate reactor to be 650 °C.

4. Analysis of Simulation Results

4.1. Sensitivity Analysis

In order to evaluate the effectiveness of the system [35,36], some evaluation indicators such as gas consumption as well as carbon capture rate are shown below:
1.
Total system efficiency— η T o t a l :
η T o t a l = P T o t a l F M P W × L H V × 100 %
P T o t a l = j = 1 m i = 1 n ( W G T , j + W S T , i )
P T o t a l : The sum of the work output of the gas turbine and boiler in the process (kW). F M P W : Total feed of MPW in the process (kg/s). LHV: Low heat value of MPW (kJ/kg). W G T , j : The power of one gas turbine in the process (kW). W S T , i : The power of one steam turbine in the process (kW); m and n represent the number of gas and steam turbines in the process.
2.
System net efficiency— η n e t :
η n e t = P n e t F M P W × L H V × 100 %
P n e t = P T o t a l k = 1 t W I O E
P n e t : The net work obtained by subtracting the work consumed by its own system from the total power output of the process (kW). t: Total number of devices in the process that require power input. For example, reactors, gasifiers, reboilers, condensers, compressors, etc. W I O E : The input power of operating equipment in the whole process (kW).
3.
Carbon capture rate—CCR:
C C R = X C O 2 × F P R O C O 2 × M C ω M P W , C × F M P W × 100 %
ω M P W , C : Mass fraction of carbon in feed MPW (wt%). X C O 2 : Mass fraction of carbon dioxide in carbon dioxide products (%). F P R O C O 2 : The flow of carbon dioxide products (kg/s); MC: Relative atomic mass of carbon.
4.
Cold gas efficiency—CGE:
C G E = F S y n g a s × X H 2 + F S y n g a s × X C H 4 + F S y n g a s + X C O F M P W × L H V × 100 %
F S y n g a s : The flow rate of crude synthesis gas from the gasifier (kg/s). X H 2 , X C H 4 , X C O : Represents the mass fraction of H2, CH4, CO in the crude syngas (wt%).

4.2. Process Design

We designed three different chemical processes by studying the gasification process of MPW. By coupling different processes and gasification processes, we then came up with three designs combined with different unit. We use the different evaluation metrics given above to evaluate the advantages and disadvantages between the different processes. First, we introduce our Design 1.
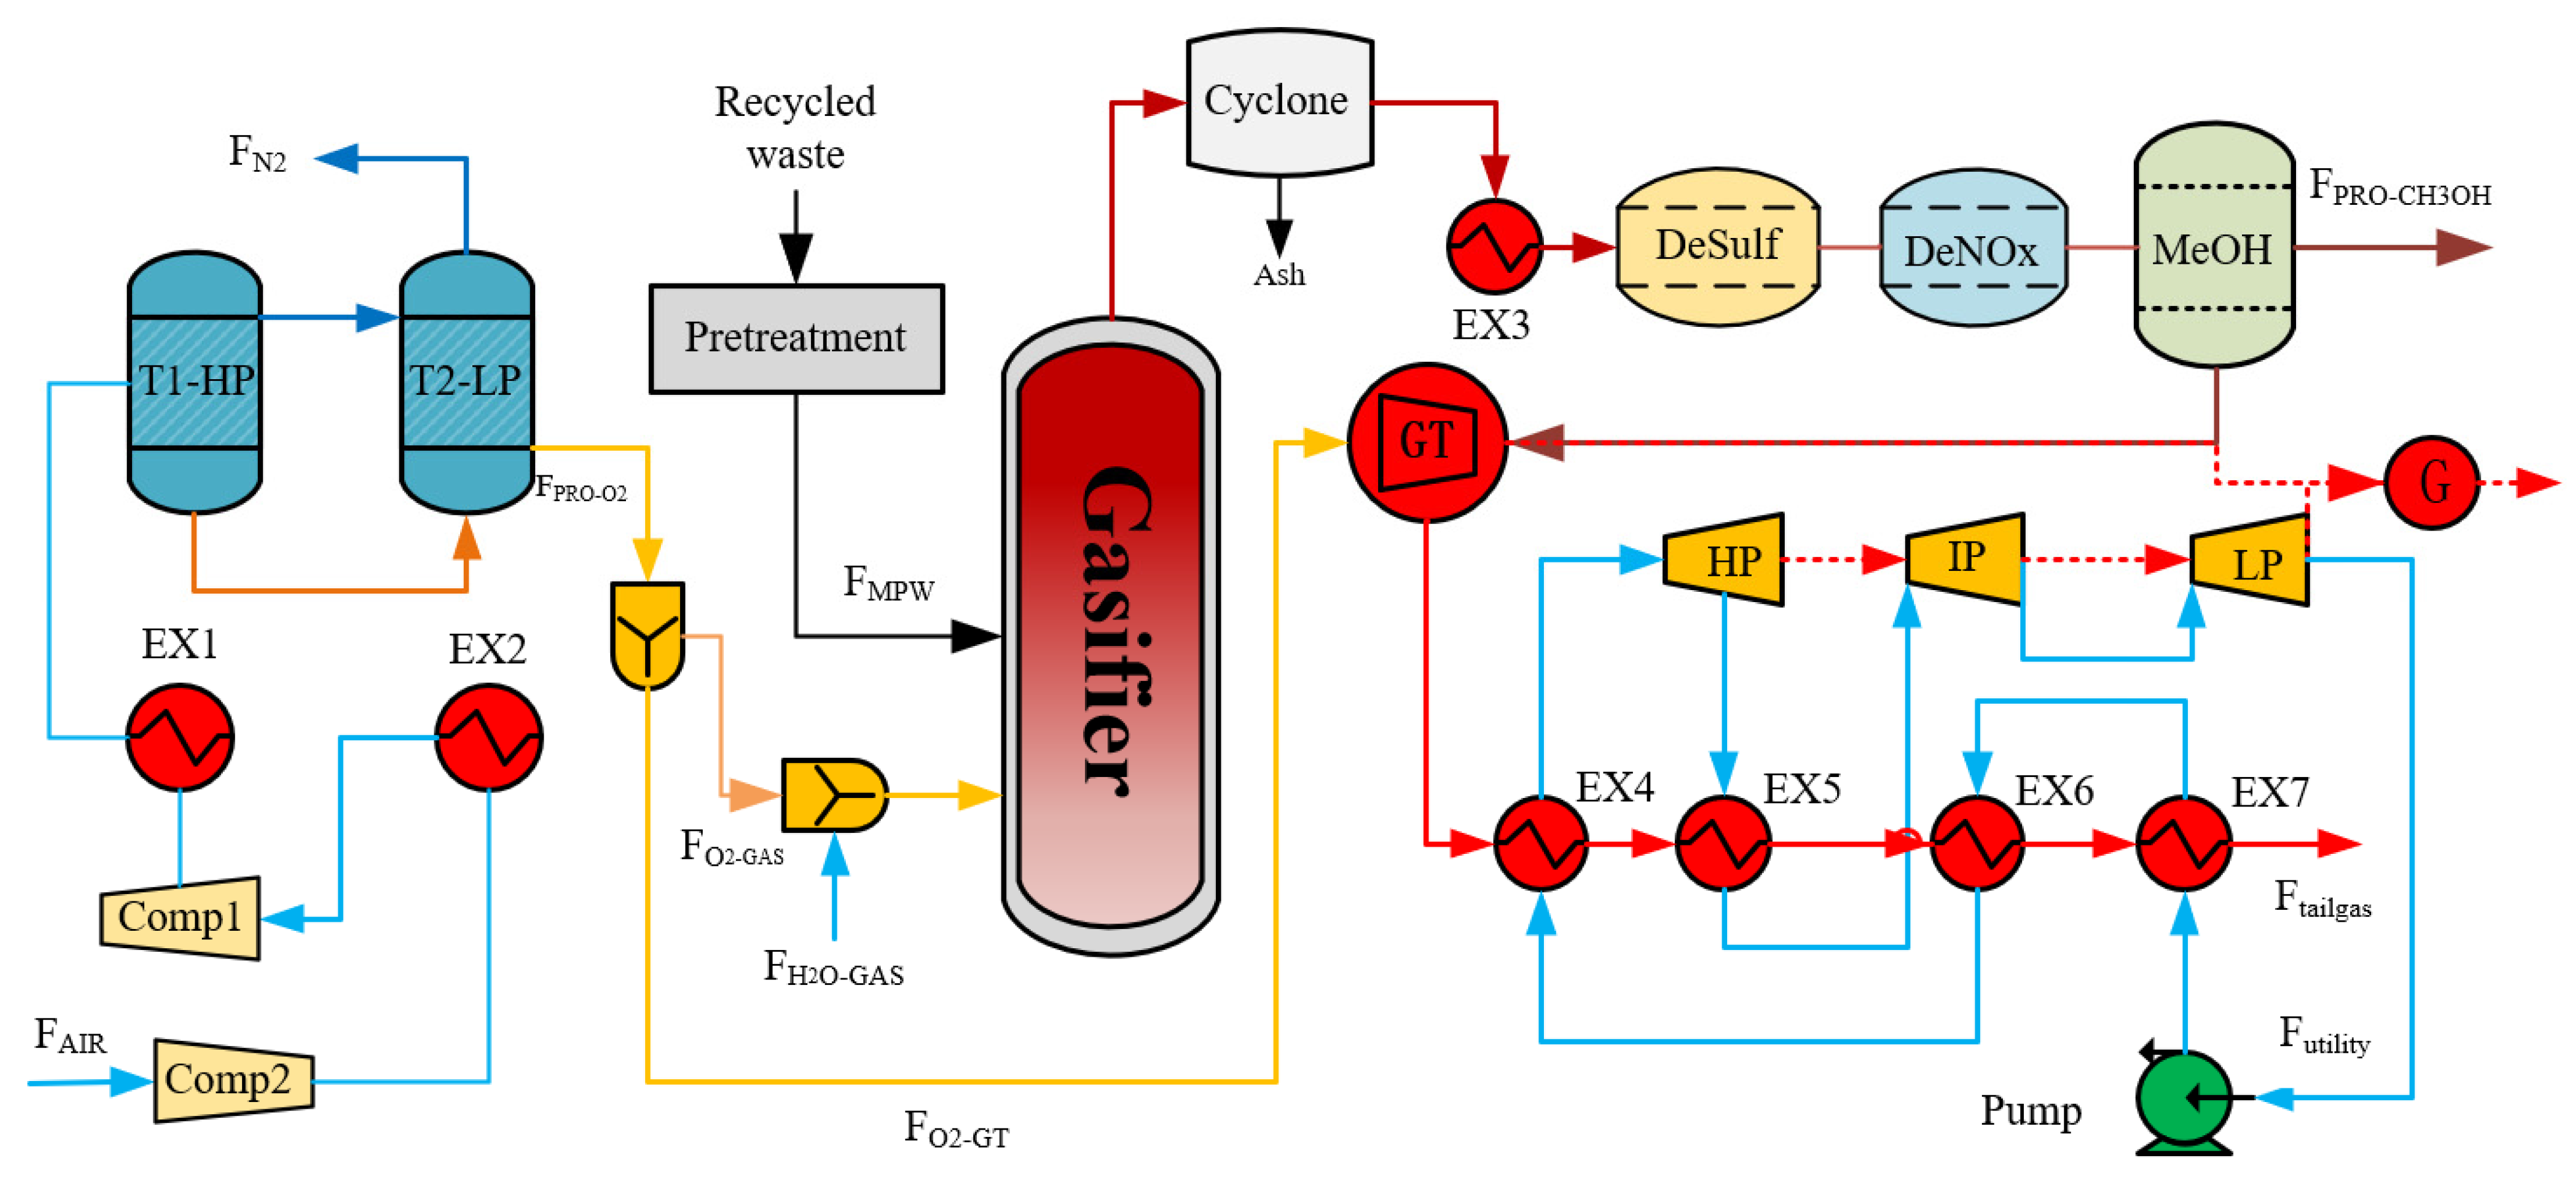
As shown in Figure 14, Design 1 is a conventional IGCC system based on the gasification of waste plastics. Recycled waste plastics are sorted and pretreated into qualified gasifiable raw materials FMPW. The oxidant used is a mixture of FO2-GAS and FH2O-GAS. Oxygen is produced using CAS in Design 1. FAIR undergoes multi-stage compression and heat exchange to cryogenics after the distillation process produced oxygen and nitrogen. The oxidizer and MPW enter the gasifier together to produce syngas and ash. Here, the crude-syngas we obtain is first desulfurized and denitrified into pure-syngas. The clean syngas is first sent to the methanol synthesis unit to produce a methanol product at a suitable temperature and pressure. The residual gas is sent to a gas turbine for power generation, and then the exhaust gas is sent to a steam turbine to recover heat again. In this design, the oxygen production is based on the conventional CAS production, which is distinguished from the later design.
As shown in Figure 15, the traditional CAS oxygen generation process was replaced with a lower investment and operating cost approach in Design 2. The energy consumption of VPSA oxygen production was reduced from 0.541 kW/m3 O2 to 0.313 kW/m3 O2. The air is pressurized and passed through a dust collector to remove the fine particles. Then, it is passed into the adsorption tower to adsorb N2, CO2 and H2O. This process can only obtain O2 with a molar purity of 80.11%. However, this concentration can match the condition. The oxygen valve is closed, and the vacuum pump extracts to release the adsorbed nitrogen, carbon dioxide and water. Finally, after the air flushes the adsorbent, the desorption valve is closed for the next cycle. The gasification and purification units remain unchanged from Design 1. The pure syngas is sent to the methanol synthesis section to produce methanol, with the remaining unreacted syngas. The unreacted syngas is passed to a gas turbine for combustion and power generation, and the steam turbine recovers heat. Design 2 significantly reduces the energy consumption for oxygen production and increases the net system efficiency.
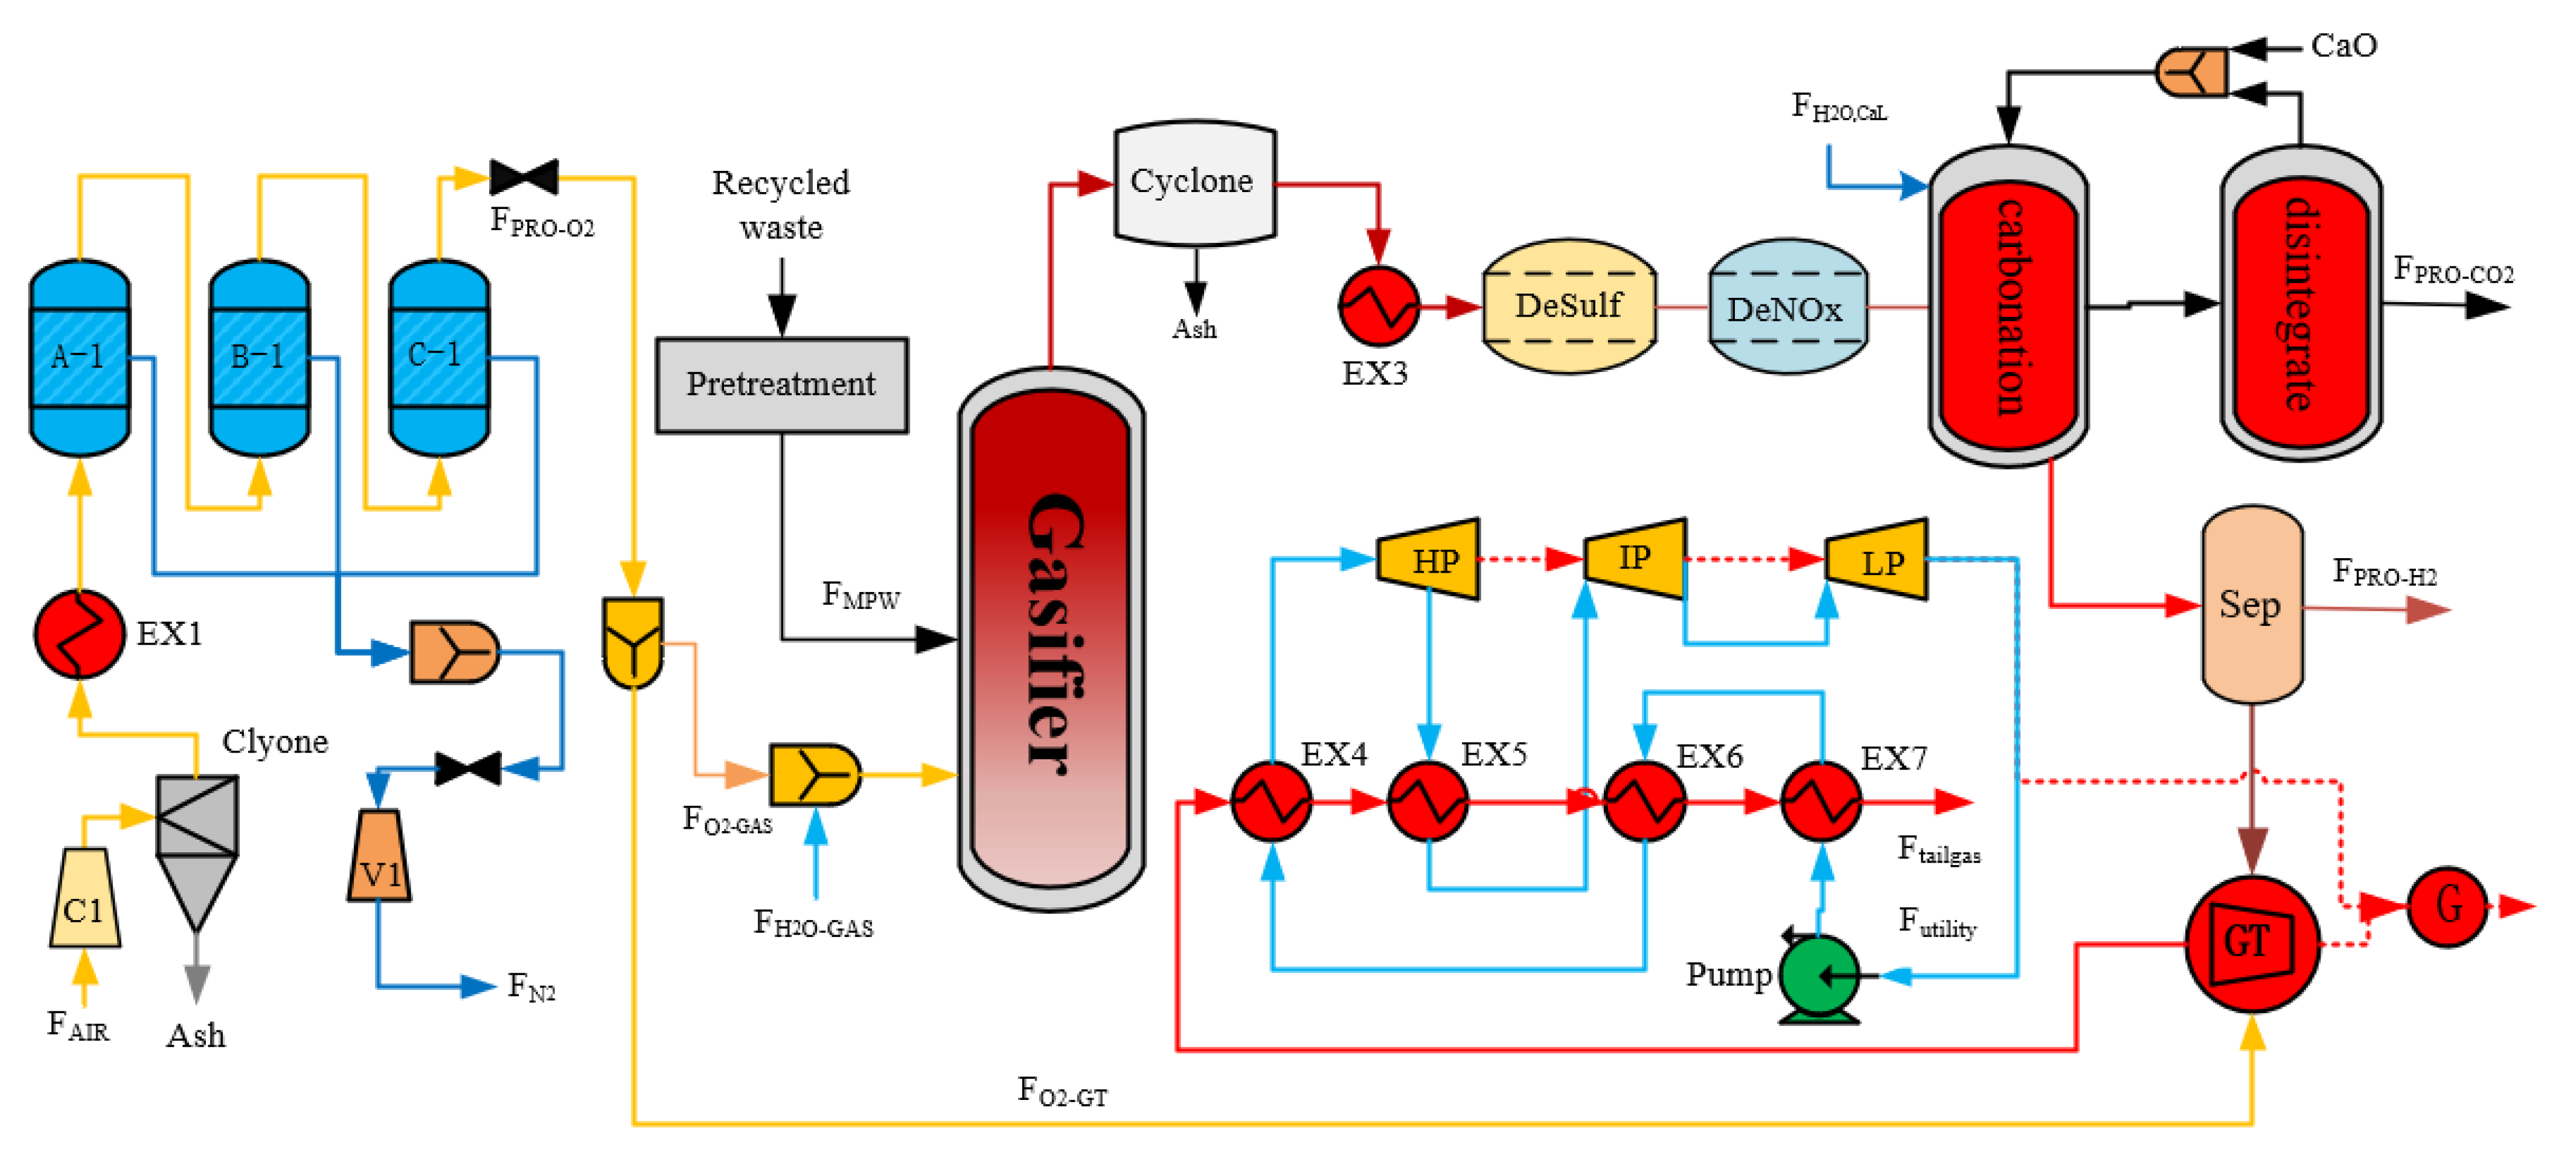
As shown in Figure 16, Design 3 is a gasification system based on VPSA and CaL. In Design 1 and 2, we used methanol and electricity as the main output products, where carbon dioxide is fixed by synthesizing methanol. However, we convert the syngas to hydrogen-rich gas through a CaL process in Design 3. The porous calcium oxide absorbs the CO2 generated by the WGSR, which not only promotes the conversion rate of the reaction, but also captures high-purity CO2 at low consumption. The obtained calcium carbonate is calcined in the calcination reactor to obtain calcium oxide and high-purity CO2. Then, the calcium oxide enters the carbonation reactor to circulate the reaction. High-purity carbon dioxide is used directly as a product with a purity of up to 99.99%. After the hydrogen-rich gas is separated from the high-purity hydrogen, the residual gas is sent to the gas turbine and the calciner reactor for combustion and energy supply. The outlet temperatures of the carbonizer and calciner are 650 °C and 920 °C, respectively.

4.3. Results and Discussion

According to the calculations in Table 6 and Table 7, the three designs use the same feedstock feed rate. The CAS is used in Design 1 for oxygen production, which produces oxygen with a purity of 96.03%. A mixture of oxygen and steam is used as the oxidizer and sent to the fluidized bed gasifier together with MPW. From Table 6, we can conclude that the oxygen feed purity of Design 1 is greater than Designs 2 and 3. This difference leads to the fact that the total flow of syngas exiting the gasifier is the largest and the composition of hydrogen is the largest. The syngas achieves multiple production of methanol, heat, and electricity.
The VPSA used in Design 2 reduces the energy consumption by half, but the reduced oxygen purity leads to lower outlet gas temperatures and a reduction in the combustible fraction of the syngas. From Table 7, we can figure out that the total power of Design 1 is slightly larger than that of Design 2 at 2.18 MW, but the net power is smaller. Meanwhile, the purer oxygen makes the CGE of Design 1 to 17.16% higher than Design 2.
Design 3 adds the CaL process to Design 2. The CaL process in Design 3 promotes the conversion rate of the Water-Gas Shift Reaction, so it has the highest CGE, at 50.53%. It also means that less combustible gas is used for the gas turbine, which results in the least total work and net work. With the CaL process, we calcined to obtain CO2 with a purity of 99.99%, as well as a large amount of high-quality hydrogen. This design also has a high carbon capture rate of 84.43%.

5. Conclusions

In the research of this article, we proposed to design three gasification processes for the mixed plastic waste in the recycled solid waste. This process successfully converted MPW into heat, electricity, and organic products, and it also achieved CO2 capture.
  • Design 1 is a traditional IGCC-based power generation system that uses cryogenic air separation to produce oxygen. After replacing CAS by VPSA, the energy consumption of the oxygen production part was reduced by 42.14%. The net power of the system also increased by 15.99%. Therefore, VPSA provides a new oxygen production method for MPW recycling.
  • Design 3 adds the CaL process, which improves the conversion rate of the WGSR. The most prominent advantage of the addition of the CaL process is that it made outstanding contributions to carbon emission reduction. The carbon capture rate of Design 3 reached 84.43%, and the CGE reached 50.53%. The whole system realizes the conversion of solid waste into valuable products, which is in line with the idea of energy saving and emission reduction.

Author Contributions

Methodology, H.X.; software, H.X.; validation, H.X.; formal analysis, B.S.; investigation, H.X.; resources, H.X.; writing—original draft preparation, H.X.; writing—review and editing, H.X.; project administration, B.S. All authors have read and agreed to the published version of the manuscript.

Funding

This research was funded by National Natural Science Foundation of China, founding number 21878238.

Institutional Review Board Statement

The study was conducted according to the guidelines of the Declaration of Wuhan, and approved by the Institutional Review Board of National Natural Science Foundation of China (protocol code 21878238 and date of approval).

Informed Consent Statement

Informed consent was obtained from all subjects involved in the study.

Data Availability Statement

The data that support the findings of this study are available from the corresponding author upon reasonable request.

Acknowledgments

Thanks are given for the support provided by the National Natural Science Foundation of China.

Conflicts of Interest

The authors declare no conflict of interest.

Nomenclature

IGCCIntegrated Gasification Combined Cycle
CASCryogenic air separation
VPSAVacuum Pressure Swing Adsorption
CaLCalcium-looping
LDPELow-density polyethylene
HDPEHigh-density polyethylene
PVCPolyvinyl chloride
PPPolypropylene
PSPolystyrene
ABSAcrylonitrile Butadiene Styrene
PETPolyethylene terephthalate
WGSRWater-Gas Shift Reactio
CCRCarbon capture rate
CGECold gas efficiency
MPWMixed plastic wastes
HHVHigher heating value
LHVLower heating value
BFBBubbling fluidized bed
SCRSelective catalytic reduction
GTGas turbine
STSteam turbine
CCSCarbon capture and storage
GOC (%)Gasification oxygen consumption
GSC (%)Gasification steam consumption
CAC (%)CaO consumption in the calcium-looping
CSC (%)Steam consumption in the calcium-looping
η T o t a l (%)Total system efficiency
P T o t a l (kW)System total work
η n e t (%)Net system efficiency
P n e t (kW)System net work
F M P W (kg/s)The feed of gasification raw materials-MPW
WGT (kW)Work of gas turbines
WST (kW)Work of steam turbines
WIOE (kW)Input power of operating equipment

References

  1. China Plastics Processing Industry Association. 2019 Review and 2020 Prospect on Chinese Plastics Processing Industry; China Plastics Processing Industry Association: Beijing, China, 2020. [Google Scholar]
  2. Geyer, R.; Jambeck, J.R.; Law, K.L. Production, use, and fate of all plastics ever made. Sci. Adv. 2017, 3, e1700782. [Google Scholar] [CrossRef] [PubMed] [Green Version]
  3. Jambeck, J.R.; Geyer, R.; Wilcox, C.; Siegler, T.R.; Perryman, M.; Andrady, A.; Narayan, R.; Law, K.L. Plastic waste inputs from land into the ocean. Science 2015, 347, 768–771. [Google Scholar] [CrossRef]
  4. Khan, M.Z.H.; Sultana, M.; Al-Mamun, M.R.; Hasan, M.R. Pyrolytic waste plastic oil and its diesel blend: Fuel characterization. J. Environ. Public Health 2016, 2016, 7869080. [Google Scholar] [CrossRef] [PubMed] [Green Version]
  5. Wang, Q.; Qu, J.P.; Shi, B.; Chen, N.; Nie, M.; Yang, S. Prevention and Control of Waste Plastics Pollution. China Eng. Sci. 2021, 23, 160–166. [Google Scholar]
  6. Heidenreich, S.; Foscolo, P.U. New concepts in biomass gasification. Prog. Energy Combust. 2015, 46, 72–95. [Google Scholar] [CrossRef]
  7. Ahmed, I.I.; Gupta, A.K. Hydrogen production from polystyrene pyrolysis and gasification: Characteristics and kinetics. Int. J. Hydrog. Energy 2009, 34, 6253–6264. [Google Scholar] [CrossRef]
  8. Wu, S.L.; Kuo, J.H.; Wey, M.Y. Highly abrasion and coking-resistance core-shell catalyst for hydrogen-rich syngas production from waste plastics in a two-staged fluidized bed reactor. Appl. Catal. A Gen. 2021, 612, 117989. [Google Scholar] [CrossRef]
  9. Dang, S.; Pornnapat, R.; Amornchai, A.; Yaneeporn, P. Gasification of plastic waste for synthesis gas production. Energy Rep. 2020, 6, 202–207. [Google Scholar]
  10. Santagata, C.; Aquaniello, G.; Salladini, A. Production of low-density poly-ethylene (LDPE) from chemical recycling of plastic waste: Process analysis. J. Clean Prod. 2020, 253, 119837. [Google Scholar] [CrossRef]
  11. Ansari, S.H.; Ahmed, A.; Razzaq, A.; Hildebrandt, D.; Liu, X.; Park, Y.-K. Incorporation of solar-thermal energy into a gasification process to co-produce bio-fertilizer and power. Environ. Pollut. 2020, 266, 115103. [Google Scholar] [CrossRef]
  12. Siyue, R.; Feng, X.; Yufei, W. Emergy evaluation of the integrated gasification combined cycle power generation systems with a carbon capture system. Renew. Sustain. Energ Rev. 2021, 147, 111208. [Google Scholar]
  13. Campbell, P.E.; Evans, R.H.; McMullan, J.T.; Williams, B.C. The potential for adding plastic waste fuel at a coal gasification power plant. Waste Manag. Res. 2001, 19, 526–532. [Google Scholar] [CrossRef] [PubMed]
  14. Gent Malcolm, R.; Menendez, M.; Toraño, J.; Susana, T. Optimization of the recovery of plastics for recycling by density media separation cyclones. Resour. Conserv. Recycl. 2010, 55, 472–482. [Google Scholar] [CrossRef]
  15. Jia, L.; Gao, K.; Zhenming, X. Charge-decay electrostatic separation for removing Polyvinyl chloride from mixed plastic wastes. J. Clean. Prod. 2017, 157, 148–154. [Google Scholar]
  16. Choi, W.-Z.; Yoo, J.-M.; Cho, B.-G. Separation of Individual Plastics from Mixed Plastic Waste by Gravity Separation Processes. Geosystem. Eng. 2006, 9, 65–72. [Google Scholar] [CrossRef]
  17. Liao, X.; Singh, S.; Yang, H.; Wu, C.; Zhang, S. A thermogravimetric assessment of the tri-combustion process for coal, biomass and polyethylene. Fuel 2021, 287, 119–355. [Google Scholar]
  18. Gartzen, L.; Maite, A.; Maider, A.; Alvarez, J.; Bilbao, J.; Olazar, M. Recent advances in the gasification of waste plastics. A critical overview. Renew. Sustain. Energy Rev. 2018, 82, 576–596. [Google Scholar]
  19. Ciuffi, B.; Chiaramonti, D.; Rizzo, A.M.; Frediani, M.; Rosi, L. A Critical Review of SCWG in the Context of Available Gasification Technologies for Plastic Waste. Appl. Sci. 2020, 10, 6307. [Google Scholar] [CrossRef]
  20. Sancho, J.A.; Aznar, M.P.; Toledo, J.M. Catalytic Air Gasification of Plastic Waste (Polypropylene) in Fluidized Bed. Part I: Use of in-Gasifier Bed Additives. Ind. Eng. Chem. Res 2008, 47, 1005–1010. [Google Scholar]
  21. Wu, W.; Zheng, L.; Shi, B.; Kuo, P.-C. Energy and exergy analysis of MSW-based IGCC power/polygeneration systems. Energy Convers. Manag. 2021, 238, 114119. [Google Scholar] [CrossRef]
  22. Hao, P.; Shi, Y.; Li, S.; Liang, S. Oxygen sorption/desorption kinetics of SrCo0.8Fe0.2O3-delta perovskite adsorbent for high temperature air separation. Adsorption 2018, 24, 65–71. [Google Scholar] [CrossRef]
  23. Qadir, S.; Li, D.; Gu, Y.; Yuan, Z.; Zhao, Y.; Wang, S.; Wang, S. Experimental and numerical investigations on the separation performance of [Cu(INA)(2)] adsorbent for CH4 recovery by VPSA from oxygen-bearing coal mine methane. Chem. Eng. J. 2021, 408, 127238. [Google Scholar] [CrossRef]
  24. Zhaoyang, D. Simulation and Optimization of Industrial-Scale Variable Pressure Adsorption Oxygen Generation Process; Tianjin University: Tianjin, China, 2018. (In Chinese) [Google Scholar]
  25. Skarstrom, C.W. Method and Apparatus for Fractionating Gaseous Mixtures by Adsorption; Skarstrom C W: USA, 1960; Available online: https://www.freepatentsonline.com/2944627.pdf (accessed on 23 December 2021).
  26. Sun, H.; Parlett, C.M.; Isaacs, M.A.; Liu, X.; Adwek, G.; Wang, J.; Shen, B.; Huang, J.; Wu, C. Development of Ca/KIT-6 adsorbents for high temperature CO2 capture. Fuel 2019, 235, 1070–1076. [Google Scholar] [CrossRef] [Green Version]
  27. Mengmeng, Z. Optimization of High-Temperature Flue Gas Calcium-Based CO2 Capture Process for Coal-Fired Power Plants; Qingdao University of Science and Technology: Qingdao, China, 2020. (In Chinese) [Google Scholar]
  28. Wilk, V.; Hofbauer, H. Conversion of mixed plastic wastes in a dual fluidized bed steam gasifier. Fuel 2013, 107, 787–799. [Google Scholar] [CrossRef]
  29. Chang, H.; Feng, X.; Khim Hoong, C. Process modeling and thermodynamic analysis of Lurgi fixed-bed coal gasifier in an SNG plant. Appl. Energy 2013, 111. [Google Scholar]
  30. Agon, N.; Hrabovský, M.; Chumak, O.; Hlina, M.; Kopecky, V.; Maslani, A.; Bosmans, A.; Helsen, L.; Skoblija, S.; Van Oost, G.; et al. Plasma gasification of refuse derived fuel in a single-stage system using different gasifying agents. Waste Manag. 2016, 47, 246–255. [Google Scholar] [CrossRef]
  31. Isam, J.; Idowu, A.; Sherien, E. Gasification feasibility of polyethylene, polypropylene, polystyrene waste and their mixture: Experimental studies and modeling. Sustain. Energy Technol. 2020, 39, 100684. [Google Scholar]
  32. Wu, C.; Williams, P.T. Hydrogen production by steam gasification of polypropylene with various nickel catalysts. Appl. Catal. B 2009, 87, 152–161. [Google Scholar] [CrossRef]
  33. Zhu, L.; Zhang, L.; Fan, J.M.; Jiang, P.; Li, L. MSW to synthetic natural gas: System modeling and thermodynamics assessment. Waste Manag. 2016, 48, 257–264. [Google Scholar] [CrossRef]
  34. Tengfei, F. Thermodynamic Analysis and Experimental Study of CaSO4 Oxygen Carrier Applied to CaO Regeneration Process; Institute of Engineering Thermophysics, Graduate School of Chinese Academy of Sciences: Beijing, China, 2013. [Google Scholar]
  35. Wu, W.; Wen, F.; Chen, J.-R.; Kuo, P.-C.; Shi, B. Comparisons of a class of IGCC polygeneration/power plants using calcium/chemical looping combinations. J. Taiwan Inst. Chem. E 2019, 96, 193–204. [Google Scholar] [CrossRef]
  36. Shi, B.; Xu, W.; Wu, E. Novel design of integrated gasification combined cycle (IGCC) power plants with CO2 capture. J. Clean. Prod. 2018, 195, 176–186. [Google Scholar] [CrossRef]
Figure 1. Pretreatment process diagram for recycled waste to MPW.
Processes 10 00499 g001
Figure 2. Tar formation and evolution pathways in different plastic gasification processes.
Processes 10 00499 g002
Figure 3. Schematic diagram of bubbling fluidized bed gasifier.
Processes 10 00499 g003
Figure 4. The flow chart of Vacuum Pressure Swing Adsorption process.
Processes 10 00499 g004
Figure 5. The flow chart of calcium-looping process. QHeat input: the heat is provided by the combustion of the remaining combustible gas after the membrane separation of the hydrogen-rich syngas.
Processes 10 00499 g005
Figure 6. Flow chart of the gasification process module-BFB in Aspen simulation. PYROLYS: pyrolysis; MIX-1, MIX-2, MIX-3: Flow Unit Mixer; SEP1, SEP2: separator; DRY-H2O: moisture baked in the drying process; GAS1: gas phase spillage from pyrolysis process; COMBU: char combustion; Q-LOSS: heat lost from the gasifier; Q3: heat provided by pyrolysis to the drying process.
Processes 10 00499 g006
Figure 7. The relationship between the quantity of gasification oxygen consumption and the main composition of syngas.
Processes 10 00499 g007
Figure 8. Relationship between gasification oxygen quantity (GOC) and cold gas efficiency (CGE) under different gasification steam dosage (GSC).
Processes 10 00499 g008
Figure 9. Relationship between gasification steam consumption and product flow rate in syngas.
Processes 10 00499 g009
Figure 10. Vacuum Pressure Swing Adsorption oxygen production process. CHANGE: change the attribute of the flow for subsequent simulations; AC-1: compressor; PUREAIR: air after impurity removal; SEP-1, SEP-2: absorption tower; OUT-N2: nitrogen released; CO2,H2O: steam and carbon dioxide released. MIX-A1: mixer; OFFGAS: impurities put in reverse; O2-GAS: oxygen consumption during gasification; O2-GT: gas turbine oxygen consumption; O2-GAL: oxygen required for combustion of gas in a calcination reactor.
Processes 10 00499 g010
Figure 11. Calcium-looping process simulation. EX1: heat exchanger; CARBON: carbonation reactor; CALCINE: calcination reactor; SPLITI, SPLIT2, SEP-3: separator; MIX3, MIX4: mixer; PURE-GAS: synthesis gas after impurity removal; CA-H2O: the amount of water vapor in the carbonic acid reactor; H2-GAS: hydrogen-rich syngas; PRO-H2: hydrogen gas products; O2-CAL: oxygen used in calcination reactors; PRO-CO2: carbon dioxide product; CA-BU: supplemental calcium oxide; RE-CAO: circulating calcium oxide.
Processes 10 00499 g011
Figure 12. (a) Effect of CaO feed on the composition of hydrogen-rich syngas. (b) Effect of Steam feed on the composition of hydrogen-rich syngas. (c) Effect of the carbonation reactor’ temperature on the composition of hydrogen-rich syngas.
Processes 10 00499 g012
Figure 13. (a) Effect of calcium oxide dosage on carbon capture rate and cold gas efficiency. (b) Effect of steam dosage on carbon capture rate and cold gas efficiency. (c) Effect of the carbonate reactor temperature on the export of calcium carbonate and carbon dioxide.
Processes 10 00499 g013
Figure 14. Design 1: IGCC-based mixed waste plastic gasification multi-cogeneration process. EX1, EX2, EX3, EX4, EX5, EX6, EX7: heat exchanger; T1-HP: high pressure distillation tower; T2-LP: low pressure rectification tower; Fi: flows; HP/IP/LP: high-, intermedium- and low-pressure compressors; DeSulf: desulfurization reactor; DeNOX: denitrification reactor; MeOH: methanol reactor; G: total work; GT: gas turbine.
Processes 10 00499 g014
Figure 15. Design 2: IGCC-based VPSA oxygen generation for mixed waste plastic gasification multi-generation process. EX1, EX2, EX3, EX4, EX5, EX6, EX7: heat exchanger; A-1, B-1, C-1: absorption tower; Fi: flows; HP/IP/LP: high-, intermedium- and low-pressure compressors; DeSulf: desulfurization reactor; DeNOX: denitrification reactor; MeOH: methanol reactor; GT: gas turbine; G: total work.
Processes 10 00499 g015
Figure 16. Design 3: IGCC-based coupled calcium-based chemical cycle mixed waste plastic gasification process. EX1, EX2, EX3, EX4, EX5, EX6, EX7: heat exchanger; A-1, B-1, C-1: absorption tower; Fi: flows; HP/IP/LP: high-, intermedium- and low-pressure compressors; DeSulf: desulfurization reactor; DeNOX: denitrification reactor; GT: gas turbine; G: total work.
Processes 10 00499 g016
Table 1. The density of the types of plastics commonly found in daily life.
No.CategoryDensity Range (g/cm3)Typical (g/cm3)
1HDPE0.94–0.9650.94
LDPE0.918–0.930.932
2PP0.89–0.910.9
3PS1.03–1.0771.06
4PET1.35–1.401.37
5PVC1.37–1.421.39
Table 2. Comparison of elemental analysis and elemental analysis of straw, coal and MPW.
ItemsProximate Analysis (%)Ultimate Analysis (%) (Major Element)HHVLHV
MoistureVolatilesFixed CarbonAshC%H%O%N%S%MJ/kgMJ/kg
Straw7.375.913.410.748.26.633.01.10.318.5616.0
Coal2.89.065.725.357.82.112.050.81.029.8825.5
MPW0.883.615.70.769.914.510.60042.3322.9
Table 3. Comparison of simulation results and literature experimental results for the main components of the syngas.
Mol%COH2CH4CO2
Simulation 129.457.83.19.7
Experimental 133.058.44.24.4
Simulation 232.124.10.0443.76
Experimental 234.124.4041.46
Simulation 327.163.31.97.7
Experimental 325.7643.36.4
Table 4. The feedstock properties of MPW.
Industrial Analysis (wt%)
MoistureVolatileFixed CarbonAshStacking Density (kg/m3)HHV (MJ/kg)
3.20479.24813.1487.60489536.29
Elemental analysis (wt%)
AshCHONSCl
7.60469.99610.30310.60.5580.1380.801
Table 5. The modules of Aspen Plus and operating conditions used in the processes.
Processes.Aspen Unit Module
Used in the Process
Specific Operating Conditions
GasificationDrying: RStoic
Pyrolysis: RYield
Combustion: RStoic
Gasification: RGibbs
Cyclone separator: SSPLIT
Fixed carbon conversion: 99.9%
Heat loss: 0.8% MPW lower heating value
Gasification temperature: 1064 °C;
Gasification pressure: 300 kPa
GOC: 0.38; GSC: 0.31
Vacuum Pressure Swing AdsorptionThe compressor: Compr
Flash tower: Sep
Heat exchanger: HeatX
Air composition: (N2: 78.1%; O2: 20.9%; inert gas: 0.939%; CO2: 0.031%; H2O: 0.03%; O2: 80.11%mol)
Energy consumption: 0.313 kW/Nm3 O2
Calcium-loopingCarbonation: Gibbs
Calcination: Gibbs
Carbonation reactor temperature: 650 °C
Pressure:300 kpa
Calcination reactor temperature: 920 °C
Pressure: 300 kpa
Circulating quantity of calcium oxide: 200 kmol/h
The feed rate of the water: 215 kmol/h
Cryogenic air separationHot hydrazine: MHeatX
Distillation tower: RadFrac
Compressor: Compr
High pressure tower temperature: −170 °C; Pressure: 5.8 atm
Low pressure tower temperature: −132 °C; Pressure: 1.28 atm
Primary compressor: 1.48 atm
Two-stage compressor: 6.2 atm
Gas turbine, steam turbineBurner: RGibbs
Compressor: Compr
Turbine: Compr
Heat exchanger: Heater
Isentropic efficiency: 0.90; Primary compressor: 22 bar
Secondary compressor: 50 bar; Tertiary compressor: 90 bar
Primary condenser: 95 °C; Secondary condenser: 65 °C
Tertiary condenser: 95 °C
Burner: T = 1200 °C; P = 35 atm
MeOH
synthesis unit
Reactor: REquil
Condenser: Cool
Separator: Sep
Recator: Temperature = 230 °C;
Pressure = 82 atm
Table 6. The information of key stream in the process.
FlowsUnitDesign 1Design 2Design 3
Inlet
F M P W kg/h450045004500
F A I R kg/h14,50014,60019,300
F O 2 , G A S kg/h181421352135
F O 2 , G T kg/h153619003200
O2mol%96.0380.1180.11
F H 2 O , G A S kg/h140014001400
F H 2 O , C a L kg/h\\3870
F C a O kg/h\\11,215
Outlet
F s y n g a s kmol/h526.9502502
H2mol%52.750.750.7
COmol%40.634.534.5
CO2mol%0.91.91.9
CH4mol%1.93.263.26
F C a L , g a s kmol/h\\546.6
H2mol%\\69.82
COmol%\\0.35
CO2mol%\\0. 24
CH4mol%\\5.07
H2Omol%\\20.4
F M S L , g a s kmol/h91.4114.981.89
H2mol%2.624.5858.86
COmol%72.991.02.37
CO2mol%6.1340.91.65
CH4mol%3.6014.133.86
F P R O C H 3 O H kmol/h150.7138.60\
CH 3 OH mol%99.795.86\
F P R O H 2 kmol/h\\333.55
H 2 mol%\\99.9
F P R O C O 2 kmol/h95.42105.4168.3
CO2mol%87.8562.7499.99
Table 7. Comparison of process parameters between different designs.
ConditionsUnitDesign 1Design 2Design 3
F O 2 , T o t a l Nm3/s0.4590.4620.611
F H 2 O , T o t a l kg/s0.3890.3891.46
η g r o s s %48.1240.6225.17
η n e t %22.0825.615.3
P g r o s s kW218018401140
P n e t kW10031160240
CH3OHKg/s1.341.23/
H2Kg/s//0.185
CCR%64.2766.6584.43
CGE%39.5533.7750.53
Publisher’s Note: MDPI stays neutral with regard to jurisdictional claims in published maps and institutional affiliations.