Article

Can Direct Subsidies or Tax Incentives Improve the R&D Efficiency of the Manufacturing Industry in China?

1
Department of Economics and Management, Xinzhou Teachers University, Xinzhou 034000, China
2
Faculty of Business and Communication, INTI International University, Nilai 71800, Malaysia
*
Author to whom correspondence should be addressed.
Processes 2023, 11(1), 181; https://doi.org/10.3390/pr11010181
Submission received: 15 December 2022 / Revised: 29 December 2022 / Accepted: 1 January 2023 / Published: 6 January 2023

Abstract

:
The understanding of the impact of different government support methods on R&D efficiency is of great significance for evaluating the performance of innovation policies in various countries. We selected 31 manufacturing industries in China from 2009 to 2015, used the stochastic frontier analysis (SFA) method to measure R&D efficiency, and used tobit regression method to examine the relationship between direct government subsidies and preferential tax policies and manufacturing R&D efficiency. The results reveal that the overall R&D efficiency of China’s manufacturing industry was low, but it has been steadily increasing, and the R&D efficiency of emerging industries was significantly higher than that of traditional industries. Tax incentives played a stable and significant role in promoting R&D efficiency in manufacturing. Affected by factors such as the government’s long-term preference and information asymmetry, direct subsidies had no significant impact on the current R&D efficiency of the manufacturing industry, and began to play a positive role after a two-year lag. Based on the above research findings, this paper suggests that progressive preferential tax rates can be designed according to the “base + increment” approach for tax preferential policies. At the same time, different proportions of tax cuts should be set for enterprises of different sizes and levels of innovation, and the focus should be on small and medium-sized enterprises and emerging industries. In terms of direct funding subsidies, the government should not only increase the support for basic research, but also give more preference to enterprises that receive tax incentives for research and development, so as to enhance the complementary effect of the two types of subsidy policies. The marginal contribution of this paper mainly includes three aspects: First, based on the Chinese situation, the impact of direct government subsidies and tax incentives on the R&D efficiency of the manufacturing industry is tested. Second, we present the evidence that direct government funding subsidies “crowd out” enterprise R&D funds. Thirdly, we describe the influence of enterprise scale, innovation level, ownership, and management ability on R&D efficiency of the manufacturing industry, and put forward the possible influence mechanism.

1. Introduction

Manufacturing is an important source of a country’s competitiveness. Since its reform and opening in the 1980s, China’s manufacturing industry has developed rapidly and made important contributions to its own and global economic development. In 2010, China’s manufacturing added value accounted for 19.8% of the world’s total, surpassing the United States for the first time as the world’s largest manufacturing country. In 2021, the added value of China’s manufacturing industry will account for 30% of the global total, becoming an important part of the global industrial chain. However, with the rising factor costs, the cost advantages of labor, land, and other resources are gradually disappearing, and the profits of China’s manufacturing industry are shrinking to a lower level. In addition to the constraints of environmental capacity, the traditional development model of China’s manufacturing industry is difficult to continue, and transformation and upgrading are imperative (Guo et al., 2021) [1]. Especially in the context of abnormal intervention in the global industrial chain, improving the efficiency of independent R&D has become an important choice for China, and even more so for developing countries around the world, to enhance their economic independence, autonomy, and competitiveness.
R&D refers to the systematic activities carried out by institutions, enterprises, or individuals to acquire new knowledge or substantially improve technologies, products, and services. R&D efficiency is a tool used to measure the transformation relationship between measurable R&D input and R&D output. When R&D input is the same but output is high, R&D efficiency is high [2]. For the manufacturing industry, R&D will improve the technical level of its products or services through the input of personnel, funds, etc. In the context of innovation resource constraints, improving R&D efficiency is an inevitable choice to maximize the technical level and promote the transformation and upgrading of the manufacturing industry. As R&D is a project with high risk and slow return, it has certain externalities, and the initiative of enterprise investment is insufficient [3]. In order to solve the market failure, compensate the costs caused by the R&D externalities of enterprises, and encourage enterprises to increase R&D investment, countries have generally established a relatively complete R&D support policy system [4].
Based on the existing research, there is no consistent conclusion about the relationship between government subsidies and R&D efficiency. One view is that when the government provides subsidies or tax credits for enterprises, enterprises should provide corresponding supporting inputs, leading to the increase in the whole society’s innovation inputs. As a result, government subsidies have a “leverage effect” on R&D efficiency [5]. Another view is that R&D is the market behavior of enterprises, but the government’s “long-term” investment preference makes government subsidies not conducive to short-term R&D efficiency improvement [6]. What is worse, if the policy design is unscientific, government subsidies may even induce enterprises to reduce R&D investment, thereby creating a “crowding out effect” [7]. Some scholars found that there is no consistent conclusion about the relationship between government subsidies and R&D efficiency when controlling certain variables or using different empirical samples [8,9]. China is a large manufacturing country, and the only country in the world with all the industrial categories announced by the United Nations. However, due to its low level of technology, it has been locked in the middle and low ends of the global value chain for a long time [10]. In order to solve this dilemma and encourage manufacturing enterprises to increase their R&D investment, the Chinese government has established a policy support system that covers the whole R&D cycle, focusing on R&D funding support and tax credits. Every year, a large amount of funds are invested to subsidize the R&D activities of manufacturing enterprises. According to the data of the National Bureau of Statistics of China, in 2015, the government subsidized the manufacturing industry with R&D funds of CNY 51.6 billion and tax incentives of CNY 43.7 billion, while in 2009, the two figures were CNY 20.3 billion and CNY 14.2 billion, respectively (see Figure 1). The annual average nominal growth rates reached 16.8% and 20.6%, respectively, far exceeding the average growth rate of GDP in the same period. At the same time, China’s manufacturing industry is huge. According to the classification standard of the National Bureau of Statistics of China, China’s manufacturing industry is divided into 31 industrial categories, with more than 400,000 enterprises, distributed in 31 provinces, autonomous regions, and municipalities. These industries have different attributes, some are technology-intensive, some are capital-intensive, and some are labor-intensive. Enterprises with different attributes have different responses to government R&D support [11]. In addition, development is still very uneven in different parts of China, and there are differences in the intensity of government support and policy implementation [12]. Obviously, the existing research conclusions cannot reflect the actual situation of China’s manufacturing industry. Whether government subsidies and tax incentives promote or inhibit the R&D efficiency of China’s manufacturing industry is still a very worthwhile question.
Based on the above analysis, the questions to be discussed in this paper are as follows: Does the large-scale government subsidy investment promote or inhibit the R&D efficiency of China’s manufacturing industry? What is the effect of different subsidy methods on R&D efficiency of Chinese manufacturing industry? How do these policies differ in the Chinese context compared to what has been found in academic studies? How should policies be improved to better play the positive role of government support in manufacturing R&D efficiency?
Compared with the existing research, the marginal contributions of this paper include the following: First, based on the Chinese scenario, it verifies the impact of government direct funding subsidies and tax incentives on the R&D efficiency of heterogeneous manufacturing enterprises. Second, it verifies the evidence that government direct subsidy “squeezes out” R&D funds of enterprises, and reveals that direct subsidy has no significant impact on manufacturing R&D efficiency in the current period, and it starts to play a positive role after a two-year delay. Third, based on the comparison of regression results, it is demonstrated that enterprise scale and innovation level have a stable positive impact on manufacturing R&D efficiency. Enterprise ownership and management ability only have a positive effect when enterprises are given direct government subsidies alone, and the reason is mainly related to information asymmetry between the government and enterprises. These findings can provide theoretical reference for governments to optimize R&D funding policies.
The subsequent structure of this paper is as follows: the second section is a literature review; the third section outlines the methods, variables, and data used; the fourth section presents the empirical results; the fifth section is a discussion of our findings; and the sixth section comprises our conclusions and policy recommendations.

2. Literature Review

R&D is a knowledge production activity with output uncertainty and obvious externality, which leads to private investment in R&D often being lower than the optimal level of social investment [13]. Therefore, government support is one of the important ways to reduce R&D externalities and compensate enterprises for R&D risks. From the way of government support, it can be divided into two categories: direct fund subsidy policy and tax preferential policy. According to the existing studies, most scholars believe that tax preferences are post-subsidy, which can effectively avoid the impact of information asymmetry, and therefore encourage enterprises to increase R&D investment. For example, Falk [14] estimated the relationship between the tax preference and corporate R&D expenditure in OECD countries through the systematic GMM model. The results show that tax preference had a significant and positive impact on corporate R&D spending regardless of the estimation technique used. Negassi and Sattin [15] conducted an empirical study on the data of many countries (the United States, Canada, the United Kingdom, Australia, etc.) through the method of multiple regression and found that tax preferential policies have a very important role in promoting research and development. As for direct fund subsidies, due to the information asymmetry between the government and enterprises, it is impossible to effectively formulate scientific evaluation indicators for the allocation of subsidy funds, nor can it effectively supervise whether enterprises use subsidy funds for R&D, so it does not necessarily promote the efficiency of enterprise R&D. Buravleva et al. [16] studied China’s lithium ion battery enterprises, and found that because enterprises have more patent output, it is easier for them to obtain direct funding subsidies from the government. However, after obtaining government subsidies, the enterprise’s performance did not change. Therefore, they suggested that the government should use indicators other than patent output when assessing whether to grant subsidies to a business, as companies may use this to apply for more government subsidies rather than research and development. Moreover, because enterprises have relevant measurement basis for the scale of R&D investment in a certain period, after obtaining government subsidies, enterprises will not increase the current R&D investment, resulting in the so-called “incentive effect”, and/or even induce enterprises to reduce the current R&D investment, resulting in the so-called “crowding out effect” [17,18]. However, many scholars have come to the opposite conclusion. They have found that direct government funding subsidies can stimulate private investment in R&D more than post-subsidy tax incentives. Liu et al. [19] examined the impact of two types of government R&D subsidies on innovation using the data of Chinese listed enterprises from 2010 to 2016. It was found that prior funding has a better impact on innovation performance by stimulating private R&D investment than post award. Moreover, Wu et al. [20] found that government subsidies not only help enterprises improve their R&D efficiency, but also help enterprises obtain venture capital, thus increasing the level of long-term R&D investment.
Some scholars have come to different conclusions. Some scholars believe that the both policies are effective. For example, Tang et al. [21] studied panel data of 242 cities in China, and found that government subsidies and tax preferences can promote enterprise innovation by easing enterprise financing constraints, improving employee creativity, and ensuring efficient operation of enterprises, especially government subsidies, which are more effective than tax preferences in stimulating enterprise technological innovation. Xie et al. [22] reported that government subsidies are pre-subsidies, which can help reduce the risk of R&D investment of enterprise, but the flexibility of fund use is relatively low. The tax preference is post-support, and the flexible use of funds helps to ease the financial tension of enterprises. Some scholars believe that both policies are invalid. For example, based on the analysis or 36 industrial sectors in China, Xiao & Lin [6] found that the government’s direct funding subsidies and tax preferences are not conducive to the improvement of technological innovation efficiency. Wan et al. [23], based on the analysis of the high-tech industry in 30 regions in China, found that the tax preferential policies have an obvious “crowding out effect” on the R&D efficiency. Other scholars believe that the effects of the two policies are different according to different situations. Petrin [24], based on the survey data of the European Union, OECD countries, and Taiwan, China, from 1960 to 2017, verified the impact of government support on enterprise R&D and innovation. The results generally tend to indicate that the government support and enterprise R&D expenditure are complementary, but this will differ with enterprise scale and tax system. Chang et al. [25] found that at the 10% significance level, government subsidies and tax incentives have a significant U-shaped impact on the R&D efficiency of green enterprises. Ghazinoory [26] found that only the enterprises that regularly obtain tax preferences are enterprises that really carry out effective R&D, and enterprises that occasionally apply for R&D tax preferences may be enterprises that invest in R&D for different reasons, such as reducing enterprise tax burden, rather than the ones that really carry out innovation.
From the above studies, it can be seen that, on the one hand, the existing literature presents different or even opposite conclusions based on data from different countries. On the other hand, the existing studies mostly discuss the relationship between government support and enterprise R&D input, and the fact that R&D input to R&D output is also related to factors such as the quality of factors and management ability of a country. Especially for China, a country with manufacturing as the main body but innovation policy still in their infancy, it is difficult to judge whether China’s current innovation policies are conducive to promoting the efficiency of manufacturing R&D efficiency based on existing research.

3. Methods, Variables, and Data

3.1. Methods

(1)
SFA model
At present, there are mainly two types of methods to measure R&D efficiency; one is a non-parametric method and the other is a parametric method. The non-parametric method is represented by data envelopment analysis (DEA), and the parametric method is represented by the stochastic frontier approach (SFA). DEA adopts the mathematical programming method, which does not need to establish a strict functional relationship between variables. It has advantages in measuring the efficiency of multiple inputs and multiple outputs. However, DEA also has disadvantages because it has a set boundary, and does not consider the existence of measurement errors. On the other hand, SFA adopts the econometric method to estimate the frontier production function, which relies on the randomness assumption of the data and has a more solid economic theoretical basis. Therefore, SFA has advantages in the processing of measurement errors and statistical interference, and has a stronger estimation capacity than DEA method [27]; therefore, it is also widely used by scholars in the field of efficiency evaluation. For example, Diaz & Sanchez [28] used the SFA method to analyze the technical efficiency of small and medium-sized manufacturing enterprises in China; Jin & Kim [29] used the SFA method to analyze the energy efficiency of 21 emerging countries; Haider & Mishra [30] used the SFA method to estimate the energy efficiency of Indian steel companies.
According to the research of Kumbhakard et al. [31], this article uses the following production function:
Y i t = A K i t α L i t β exp ( v i t μ i t )
where Y i t represents R&D output; K i t and L i t represent R&D capital investment and R&D manpower input; i and t represent industry and time; α and β represent the output elasticity of the corresponding variable, respectively; ( ν i t μ i t ) is a compound error term; ν i t is the effect of observation error and other random factors (random disturbance effect), which is subject to distribution N ( 0 , σ v 2 ) ; u i t = u i η ( t T ) indicates the technical inefficiency effect, representing the gap between the producer’s actual output and the theoretical maximum output. The greater the degree of inefficiency, the lower the level of technical efficiency. In this expression, u i is a non-negative random variable used to measure the degree of technical inefficiency, assuming it is subject to N + ( μ , σ u 2 ) , where η is an estimated parameter that reflects the changing trend of technical inefficiency. In actual estimation, if the estimated value of η is significantly greater than zero, it indicates that the technical inefficiency decreases with time; if the estimated value of η is significantly less than zero, it indicates that the technical inefficiency increases with time. At the same time, since u i t indicates technical inefficiency, technical efficiency is defined as T E i t = exp ( u i t ) = exp ( u i + η ( t T ) ) ; the larger the value, the higher the technical efficiency.
The types of the production function usually include the constant elasticity of substitution (CES), the Cobb–Douglas (CD), and transcendental logarithmic (known as translog) production functions. Both the CES and CD production functions assume that the output elasticity is fixed and technically neutral. The transcendental logarithmic production function is more flexible in form, not only considering the substitution effect and interaction between the input factors, but also considering the impact of time changes, which can effectively avoid the deviation caused by the function of the wrong setting of the function. Therefore, this paper chooses the stochastic frontier analysis (SFA) of transcendental logarithmic production functions, which was implemented through the software Frontier 4.1.
(2)
Tobit model
Since the value of R&D efficiency of China’s manufacturing industry measured by the SFA method is continuous in the interval [0, 1], in this case, the estimation result of ordinary least squares (OLS) is biased and inconsistent. To avoid the bias caused by OLS estimation, the restricted dependent variable model, namely the tobit model, is often used for regression. The basic structure of the tobit model is as follows:
Y i t = 0 , Y i t * 0 Y i t * , 0 Y i t * 0 1 , Y i t * 0
among which,
Y i t * = β X i t + ε
where ε ~ N ( 0 , σ 2 ) ; β is the regression parameter vector; X i t is the independent variable vector; Y i t * is the dependent variable vector; Y i t is the efficiency value vector.
The purpose of this article is to study the impact of government direct subsidies and tax incentives on China’s manufacturing R&D efficiency. According to China’s relevant policies, direct subsidies are mainly provided in the form of scientific research projects or funding subsidies, and tax incentives are provided in the form of tax credits. The two are relatively independent support systems, and enterprises may benefit from both policy preferences or one policy. By combining the literature and based on Equations (2) and (3), this paper constructs the following logistic regression model according to the work of Kumbhakard et al. [31].
Model I: The effect of government prior support on China’s manufacturing R&D efficiency.
EF i t = α + β 1 L n G o v + β 2 L n P e o + β 3 L n F u n d + δ L n Z + ε
Model II: The impact of government subsequent support on China’s manufacturing R&D efficiency.
EF i t = α + β 1 L n T a x + β 2 L n P e o + β 3 L n F u n d + δ L n Z + ε
Model III: The impact of government prior support and government subsequent support on China’s manufacturing R&D efficiency.
EF i t = α + β 1 L n G o v + β 2 L n T a x + β 3 L n P e o + β 4 L n F u n d + δ L n Z + ε
Among them, in Formulas (4)–(6), Z represents the control variables, including enterprise scale (Sca), ownership (Own), innovation level (Inn), and management capacity (Manag).

3.2. Variables

(1)
SFA efficiency measurement variables
Referring to the common practice of scholars [32], the input variables were used to select the full-time equivalent of R&D personnel and R&D internal expenditures of China’s manufacturing enterprises. Since R&D is an activity focusing on knowledge production, the number of invention patent applications was selected as the output variable.
(2)
Panel Tobit model variables
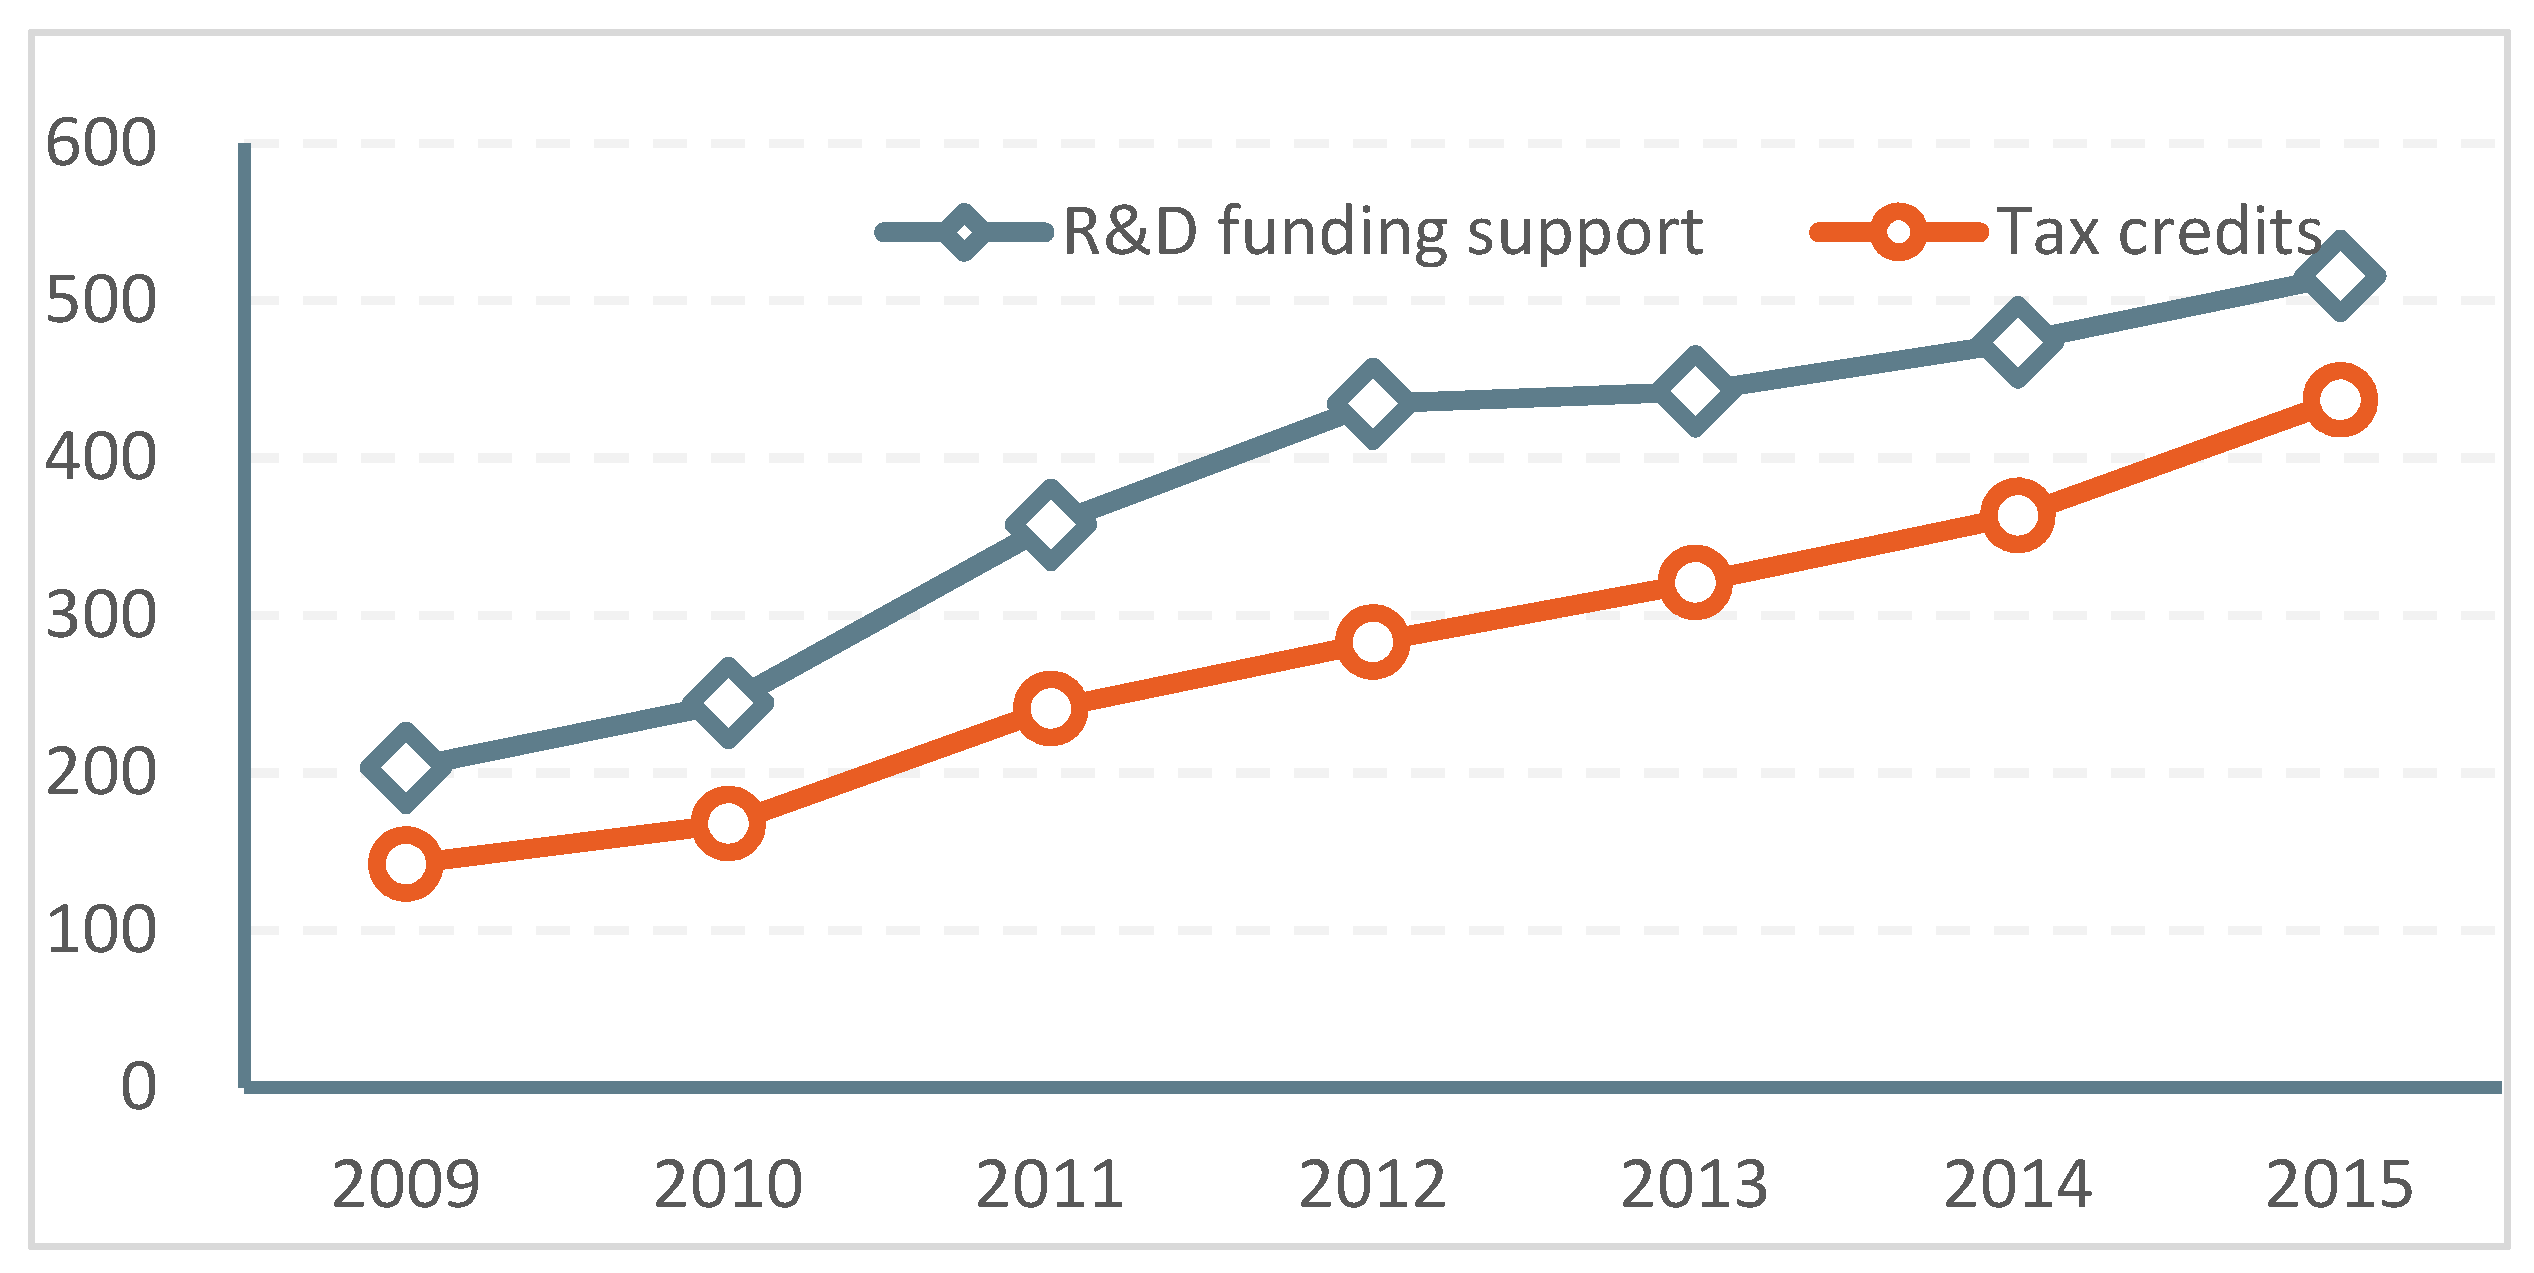
According to the research design, the explained variable is the R&D efficiency of China’s manufacturing enterprises measured by the SFA model from 2009 to 2015. The explanatory variables are the government’s R&D direct subsidies and tax incentives. The government’s direct subsidies were measured using the “Funds for Science and Technology Activities from the Government in R&D Expenses” in the China Science and Technology Statistical Yearbook. According to China’s tax policy, enterprises can make pre-tax deductions based on 175% of the R&D expenses invested. Therefore, the tax incentives are measured by the “R&D expenses plus deduction allowance” in the China Science and Technology Statistical Yearbook.
At the same time, in order to control the impact of other variables on the R&D efficiency of the enterprise, according to the literature review, this paper incorporates indicators, namely, enterprise ownership [33], innovation level [34], enterprise scale [35], and management capability [6], as control variables into the regression model. Among them, the indicators of enterprise ownership, enterprise scale, and enterprise management capability are constructed according to Bai [36] and Xiao & Lin [6]. Regarding the innovation level, Li & Tan [37] believe that R&D capital, human capital, social capital, and learning mechanism are the key factors that determine an enterprise’s absorbing capacities based on extensive literature research. R&D activities themselves are a combination of R&D capital, human capital, and learning mechanisms. Therefore, it is reasonable to believe that companies with R&D activities have better knowledge absorbing capabilities than those without. In order to avoid the result that the magnitude difference of similar variables is too large to affect the results, in line with the construction logic of the two indicators of “enterprise scale” and “ownership”, this article uses the ratio of “enterprises with R&D activities” in the China Science and Technology Statistical Yearbook to “number of enterprises at the end of the year” of the industry (Table 1).

3.3. Data

The variable data involved in this paper are all from the China Statistical Yearbook of Science and Technology. This statistical resource is a large reference book compiled by the National Bureau of Statistics of China to comprehensively, systematically, and continuously record the annual development of science and technology. It is one of the most authoritative data sources in China. Statistical yearbooks are generally published annually, and are used to publish comprehensive data for the previous year. The data used in this paper are for 2009 to 2015, and the corresponding data are from the Science and Technology Statistical Yearbook for 2010 to 2016. In terms of data distribution, in 2011, the Chinese government revised on the basis of the 2002 edition of the national economic industry classification standards (GB/T4754-2002). In order to maintain the same industry classification during the research period, this paper removes the “rubber products industry” and “plastic products industry” from 2009 to 2011 and the “rubber and plastic products industry” from 2012 to 2015, and merged the two categories of “automotive equipment manufacturing” and “railroad, aviation, and other transportation equipment manufacturing” from 2012 to 2015, corresponding to the “transportation equipment manufacturing industry” from 2009 to 2011. Consequently, there are 28 industry categories in total. Considering the relative stability of manufacturing operation and the status of China’s manufacturing industry in the world, the conclusions of this study are still valuable for governments around the world to improve their policies to support manufacturing R&D.

4. Results

4.1. China’s Manufacturing R&D Efficiency

Based on the industry data of China’s manufacturing industry from 2009 to 2015, Various parameters can be obtained by estimating the empirical model using the maximum likelihood method.According to Equation (1), the R&D efficiency of China’s manufacturing industry is shown in Table 2. The results show that during the study period, the overall R&D efficiency of China’s manufacturing industry has been steadily increasing, and that the average R&D efficiency has increased from 0.261 to 0.423, with an average annual increase of 8.3%. In terms of industries, the top three industries with the highest average R&D efficiency are communications, computer, and other electronic equipment manufacturing; electrical machinery and equipment manufacturing; and pharmaceutical manufacturing. The bottom three industries are tobacco manufacturing; beverage manufacturing; and leather, fur, feather (down) products manufacturing. It can be concluded that the R&D efficiency of traditional manufacturing industries based on resource processing is generally low, while the R&D efficiency of high-tech industries represented by information technology and pharmaceutical manufacturing is generally higher.

4.2. The Impact of Government Support on the R&D Efficiency of China’s Manufacturing Industry

According to the research purpose, this article uses software Stata 12.0 to carry out regression operations on Equations (4)–(6). The main results are reported as follows (see Table 3).
(1)
The impact of direct subsidies on manufacturing R&D efficiency
In Model I, the coefficient of the government’s direct subsidy variable (Gov) is positive but not significant, indicating that it has an insignificant positive effect on the R&D efficiency of China’s manufacturing industry. After a two-year lag, however, the variable (Gov (t-2)) starts to exerts a significant effect (see Model I in Table 3). This shows that the government’s direct subsidies have a greater impact on the long-term R&D efficiency of the manufacturing industry than the current period. In terms of other explanatory variables, personnel input has an insignificant positive effect, and funding input has an insignificant negative effect. As for control variables, enterprise scale, innovation level and management capabilities all have a positive impact, while the ownership structure has a negative impact on manufacturing R&D efficiency.
(2)
The impact of tax incentives on manufacturing R&D efficiency
In Model II, the coefficient of the tax incentive variable (Tax) is positive (see Model II in Table 3), indicating that it has a significant positive effect on China’s manufacturing R&D efficiency. What is different from Model I, however, is that this time, personnel input has a negative impact, while funding input has a positive impact. In terms of control variables, the enterprise scale and innovation level have a positive effect on the R&D efficiency of the manufacturing industry, while the impact of the ownership structure and management capabilities of the enterprise is not significant.
(3)
The impact of government’s direct subsidies and tax incentives on manufacturing R&D efficiency
In Model III, the government’s direct subsidy (Gov) has an insignificant positive effect, while the tax incentive variable (Tax) has a significant positive effect. In terms of other explanatory variables, personnel input has a negative effect, while funding input has a positive effect. As for control variables, the enterprise scale and innovation level play a positive role in improving manufacturing R&D efficiency, while the influence of the ownership structure and management capacities of the enterprise is not significant.

5. Discussion

The government’s direct subsidies and tax incentives are innovation policies commonly used in countries around the world. From the point of time when innovation is involved, direct subsidies are prior support policies, and tax incentives are subsequent support policies. According to the research results of this paper, since the subsequent support policy can minimize the level of information asymmetry between the government and the enterprise, it has a stable and significant promotion effect on encouraging enterprises to increase R&D investment, thus improving the R&D efficiency of enterprises, which is consistent with the conclusions of Negassi and Sattin [15], and other studies. The following three issues, however, need to be discussed with regard to prior support policies and other influencing factors:
(1) The effectiveness of the government’s direct subsidy policies. Regarding prior support policies, existing research indicates that from the perspective of maximizing social benefits, the government generally tends to support R&D projects with spillover effects and long-term value [38], and incorporates long-term preferences into the selection criteria of funded projects. Therefore, prior support policies are not conducive to promoting the current R&D efficiency of enterprises, which has been confirmed by the regression results in this paper. However, existing studies have not provided further “long-term” evidence for prior support policies, and the conclusion that the government’s direct subsidy lags behind by two years in the regression results of this article undoubtedly provides further evidence for this argument.
(2) The existence of the “crowding out effect” of government’s direct subsidies. Many authors believe that there is a “crowding out effect” in government’s direct subsidies [39], but the explanation for the possible causes has not been well illustrated yet. According to the results of this paper, when the government’s direct subsidies are given separately (Model I), the coefficients of expenditure input indicators in the explanatory variables are negative and not significant, while when only tax incentives are given (Model II), or both government’s direct subsidies and tax incentives are given (Model III), the coefficients of expenditure input indicators are all positive. This shows that there might indeed be a “crowding out effect” in direct subsidies. One possible reason is that, on the one hand, the government is far from the technological frontier and cannot effectively monitor the use of funds granted to enterprises, thus enterprises may divert R&D funds for other purposes, resulting in a “decrease” in investment in R&D funds; on the other hand, as a means of coping with market competition, companies will have reasonable R&D expenditure input expectations. After obtaining government’s subsidies, the company will transfer some of the originally planned R&D funds for other uses, thereby objectively leading to a “crowding out effect”.
(3) The influence mechanism of enterprise ownership and management ability. A previous study found that the effect of government support is affected by enterprise ownership and management capacity (Xiao & Lin, 2014), but did not further elaborate on its possible influencing mechanism. In the regression results of this paper, when the enterprise enjoys the government’s direct subsidy alone, the management ability is significantly positively correlated, while the ownership structure is significantly negatively correlated. This may be because after the enterprise’s direct subsidy, due to information asymmetry, it is difficult for the government to regulate the use of subsidy funds. At this time, enterprises with strong management ability are more likely to strictly implement the purpose of government funding. When the proportion of state-owned enterprises is higher, that is, the contribution of state-owned enterprises to R&D innovation efficiency is negative, which is consistent with the conclusion of Xiao et al. [6].

6. Conclusions and Policy Implications

This article uses the relevant data of China’s manufacturing industry from 2009 to 2015 to study the impact of government’s direct subsidies and tax incentives on R&D efficiency, and draws the following conclusions:
(1) The R&D efficiency of China’s manufacturing industry is generally on the rise, and the R&D efficiency of emerging industries is significantly higher than that of traditional industries. During the study period, despite the overall low R&D efficiency of China’s manufacturing industry, the trend has been steadily improving, with an average annual growth rate of 8.3%. In terms of industries, the gap in R&D efficiency between industries is relatively large. Emerging industries such as communication equipment manufacturing, electrical machinery manufacturing, and pharmaceutical manufacturing have significantly higher R&D efficiencies than traditional manufacturing industries such as tobacco manufacturing, food manufacturing, fur and textiles manufacturing, and petroleum processing and manufacturing. The R&D efficiency of communications equipment manufacturing industry is four times that of the tobacco manufacturing industry in China. On one hand, this shows the current imbalance in the development of China’s manufacturing industry. On the other hand, it also indirectly shows that the Chinese government’s policies to support the innovation and development of emerging industries are effective.
(2) Tax preferences can effectively promote the efficiency of R&D in China’s manufacturing industry, and direct subsidies have no significant effect on the current R&D efficiency. From the perspective of regression results, tax preferences have always played a significant role in promoting the R&D efficiency of China’s manufacturing industry, whether it is a separate tax preference given to enterprises or a combination of direct government funding subsidies. This is mainly due to the fact that the post funding method effectively eliminates the information asymmetry between the government and enterprises on the one hand, and prevents enterprises from misappropriating funds for other purposes. On the other hand, the scale of tax preferences is positively related to the scale of enterprise R&D investment. The more enterprises invest, the more tax preferences they can obtain. Therefore, the scale of tax preferences directly reflects the scale of enterprises’ R&D investment. Under the premise of a certain technological and economic paradigm, high R&D investment may bring high R&D output, and the efficiency of enterprise R&D will be improved. However, when the direct government subsidies are given to enterprise separately, although it has a promoting effect in the current period, it is not significant. When it is delayed for two years, it starts to show a significant positive role, indicating that the direct government subsidies are not conducive to the improvement of the current R&D efficiency, but will play a positive role in the long-term R&D efficiency. The main reason for this is that the direct fund subsidies belong to prior investment, and there will be a certain time delay from subsidy to R&D output. At the same time, there is also a certain relationship with the long-term preference of the government, because the government tends to subsidize those enterprises in the forefront of the industry, and these enterprises have strong uncertainty and greater risk in their development. High subsidies may not lead to high output in the current period, but may have a positive impact on later research and development production.
(3) The influence of enterprise scale, innovation level, ownership structure, and management ability on R&D efficiency is related to the form of government support. According to the regression results, no matter the support method adopted by the government, enterprise scale and innovation level have a significant positive impact on the R&D efficiency of China’s manufacturing industry. The reason for this is consistent with the existing research conclusions, that is, the larger the enterprise scale, the stronger the input capacity. The higher the level of innovation, the stronger the absorption capacity. However, the management ability was positively correlated only when the government gives direct financial fund subsidies to enterprises, and the ownership structure was significantly negatively correlated, while in the rest of the subsidy programs, the two are not significant. The reason for this is mainly related to the timing of government subsidies. Due to the information asymmetry between the government and enterprises, it is difficult to regulate the use of funds in advance subsidies. Enterprises with strong management ability are more likely to use subsidies according to the requirements of the government. The higher the proportion of state-owned enterprises, the higher the degree of technical inefficiency, which is consistent with the conclusion of Xiao et al. (2014). For ex post subsidies or ex post combined subsidies, the “information gap” between the government and the enterprise will be filled to the maximum extent, and the government subsidy funds will be mainly used for enterprise research and development, thus the two variables of management ability and ownership are not significant.
Based on the above findings, this study puts forward the following policy implications:
(1) The government should further clarify the basic research attributes of direct subsidies. At present, almost all prefecture-level and above-level governments and functional departments in China have set up various R&D funding support projects, covering a wide range of fields such as basic research, applied research, and experimental development. However, from the empirical results, government’s direct subsidies are not conducive to improving the R&D efficiency of enterprises in the current period, and even cause a “crowding out effect”. Based on this, the government should reposition the scope of its R&D funding support, and clearly define it as a basic research field with spillover effects and long-term technological progress, so that it can focus on funding for the improvement of the basic research level.
(2) The government should further optimize preferential taxation support policies for R&D. High investment in R&D funds is an important basis for obtaining high R&D efficiency. How to encourage enterprises to increase R&D investment through policies has always been a concern of the government. From the empirical results, tax incentives have a stable and significant role in promoting the R&D efficiency of China’s manufacturing industry. According to the current tax incentive policies for R&D in China, enterprises are allowed to deduct pre-tax according to 175% of the investment in R&D. Inclusive tax incentives may induce companies to inflate R&D expenses and take tax breaks, thereby weakening the incentive effect of the policy. Therefore, the current policy should be further optimized. First, the progressive preferential tax rate should be designed according to the “base + increment” method. Second, different tax reduction ratios should be set according to enterprises of different scales and innovation levels. Overall, they should be tilted towards SMEs and emerging industries, so as to maximize the incentive effect of tax incentives on corporate R&D investment. Third, the government’s direct subsidies should be tilted toward companies that receive tax incentives to obtain the complementary effect between these two.
Of course, there are still areas for improvement in this article. First, in the efficiency calculation, although the number of invention patent applications is an output indicator widely used by scholars, not all R&D of enterprises is embodied in the form of invention patents, especially in some traditional manufacturing enterprises, the R&D results of which may be represented in the form of new products. Therefore, the selection of the number of invention patent applications in this article will undoubtedly lead to the underestimation of the R&D efficiency of the manufacturing industry, which may have an impact on the regression results. Second, although macro data help to discover the effect of government’s support policies on the industry as a whole, due to the lack of micro data support, the universality of the conclusion needs to be further verified, especially for China’s large manufacturing industry.

Author Contributions

Conceptualization, X.Z. and Z.L.; methodology, Z.L.; software, Z.L.; validation, X.Z. and Z.L.; formal analysis, Z.L.; investigation, Z.L.; resources, Z.L.; data curation, Z.L.; writing—original draft preparation, Z.L.; writing—review and editing, X.Z.; visualization, Z.L.; supervision, X.Z.; project administration, X.Z.; funding acquisition, X.Z. All authors have read and agreed to the published version of the manuscript.

Funding

The authors gratefully acknowledge the financial support that this work has received from the National Natural Science Foundation of China (Grant No. 71874119), the Humanities and Social Science Foundation of Ministry of Education of China (Grant No. 17YJA630025), Program of humanities and social sciences in Shanxi universities of China (Grant No.2019W144), and the Soft Science Project of Shanxi Province, China (Grant No. 2019041005-1). We also thank the anonymous reviewers and an editor for their helpful suggestions.

Data Availability Statement

The data used to support the findings of this study are available from the corresponding author upon request.

Conflicts of Interest

The authors declare that there are no conflict of interest regarding the publication of this paper.

References

  1. Guo, L.; Long, W.; Dai, Z. Manufacturing R&D investment efficiency and financing constraints: Evidence from China. Appl. Econ. 2021, 53, 676–687. [Google Scholar]
  2. Zhu, Y.W.; Xu, K.N. An empirical study on the R&D efficiency of China’s high tech. Ind. China Ind. Econ. 2006, 11, 38–45. [Google Scholar]
  3. Liu, W.; Bai, Y. An Analysis on the influence of R&D fiscal and tax subsidies on regional innovation efficiency: Empirical evidence from China. Sustainability 2021, 13, 12707. [Google Scholar]
  4. Shao, W.; Yang, K.; Bai, X. Impact of financial subsidies on the R&D intensity of new energy vehicles: A case study of 88 listed enterprises in China. Energy Strat. Rev. 2021, 33, 100580. [Google Scholar]
  5. Jia, L.; Nam, E.; Chun, D. Impact of Chinese Government Subsidies on Enterprise Innovation: Based on a Three-Dimensional Perspective. Sustainability 2021, 13, 1288. [Google Scholar] [CrossRef]
  6. Xiao, W.; Lin, G.B. Government Support, R&D management and technological Innovation Efficiency: An Empirical analysis of China’s industrial Sectors. Manag. World 2014, 4, 71–80. [Google Scholar]
  7. Wu, Z.; Fan, X.; Zhu, B.; Xia, J.; Zhang, L.; Wang, P. Do government subsidies improve innovation investment for new energy firms: A quasi-natural experiment of China’s listed companies. Technol. Forecast. Soc. Chang. 2022, 175, 121418. [Google Scholar] [CrossRef]
  8. Garcia-Quevedo, J. Do public subsidies complement business R&D? A meta-analysis of the econometric evidence. Kyklos 2004, 57, 87–102. [Google Scholar]
  9. Dimos, C.; Pugh, G. The effectiveness of R&D subsidies: A meta-regression analysis of the evaluation literature. Res. Policy 2016, 45, 797–815. [Google Scholar]
  10. Sun, Y.; Li, L.; Shi, H.; Chong, D. The transformation and upgrade of China’s manufacturing industry in Industry 4.0 era. Behav. Sci. 2020, 37, 734–740. [Google Scholar] [CrossRef]
  11. Jefferson, G.H.; Bai, H.M.; Guan, X.J.; Yu, X.Y. R&D performance in Chinese industry. Econ. Innov. New Technol. 2006, 15, 345–366. [Google Scholar]
  12. Feng, S.; Chong, Y.; Li, G.; Zhang, S. Digital finance and innovation inequality: Evidence from green technological innovation in China. Environ. Sci. Pollut. Res. 2022, 29, 87884–87900. [Google Scholar] [CrossRef]
  13. Klímová, V.; Žítek, V.; Králová, M. How Public R&D Support Affects Research Activity of Enterprises: Evidence from the Czech Republic. J. Knowl. Econ. 2020, 11, 888–907. [Google Scholar]
  14. Falk, M. What drives business Research and Development (R&D) intensity across Organisation for Economic Co-operation and Development (OECD) countries? Appl. Econ. 2006, 38, 533–547. [Google Scholar]
  15. Negassi, S.; Sattin, J.F. Evaluation of public R&D policy: A meta-regression analysis. Technol. Investig. 2019, 10, 1–29. [Google Scholar]
  16. Buravleva, Y.; Tang, D.; Bethel, B.J. Incentivizing Innovation: The Causal Role of Government Subsidies on Lithium-Ion Battery Research and Development. Sustainability 2021, 13, 8309. [Google Scholar] [CrossRef]
  17. Bai, X.Y.; Wang, Y.Y.; Su, X. R&D subsidy or tax incentive—The impact of government intervention on enterprise innovation performance and innovation quality. Sci. Res. Manag. 2019, 6, 9–18. [Google Scholar]
  18. Kou, M.T.; Wei, J.W.; Ma, W.N. Whether the national R&D fiscal and tax policies promote the R&D activities of enterprises. Sci. Res. 2019, 37, 1394–1404. [Google Scholar]
  19. Liu, S.; Du, J.; Zhang, W.; Tian, X. Opening the box of subsidies: Which is more effective for innovation? Eurasian Bus. Rev. 2021, 11, 421–449. [Google Scholar] [CrossRef]
  20. Wu, T.; Yang, S.; Tan, J. Impacts of government R&D subsidies on venture capital and renewable energy investment—An empirical study in China. Resour. Policy 2020, 68, 101715. [Google Scholar]
  21. Tang, D.; Li, Y.; Zheng, H.; Yuan, X. Government R&D spending, fiscal instruments and corporate technological innovation. China J. Account. Res. 2022, 15, 100250. [Google Scholar]
  22. Xie, Z.; Xie, L.; Li, J. Direct subsidies or tax credits? The effects of different R&D policy tools. Int. J. Technol. Manag. 2021, 86, 25–43. [Google Scholar]
  23. Wan, Q.; Chen, J.; Yao, Z.; Yuan, L. Preferential tax policy and R&D personnel flow for technological innovation efficiency of China’s high-tech industry in an emerging economy. Technol. Forecast. Soc. Chang. 2022, 174, 121228. [Google Scholar]
  24. Petrin, T. A Literature Review on the Impact and Effectiveness of Government Support for R&D and Innovation. ISIGrowth. 2018, p. 5. Available online: http://www.isigrowth.eu/wp-content/uploads/2018/02/working_paper_2018_05.pdf (accessed on 1 October 2022).
  25. Chang, K.; Long, Y.; Yang, J.; Zhang, H.; Xue, C.; Liu, J. Effects of subsidy and tax rebate policies on green firm research and development efficiency in China. Energy 2022, 258, 124793. [Google Scholar] [CrossRef]
  26. Ghazinoory, S.; Hashemi, Z. Do tax incentives and direct funding enhance innovation input and output in high-tech firms? J. High Technol. Manag. Res. 2021, 32, 100394. [Google Scholar] [CrossRef]
  27. Kea, S.; Shahriar, S. Stochastic frontier analysis. In Encyclopedia of Tourism Management and Marketing; Edward Elgar Publishing: Cheltenham, UK, 2022; pp. 251–254. [Google Scholar]
  28. Diaz, M.A.; Sanchez, R. Firm size and productivity in Spain: A stochastic frontier analysis. Small Bus. Econ. 2008, 30, 315–323. [Google Scholar] [CrossRef]
  29. Jin, T.; Kim, J. A comparative study of energy and carbon efficiency for emerging countries using panel stochastic frontier analysis. Sci. Rep. 2019, 9, 6647. [Google Scholar] [CrossRef] [Green Version]
  30. Haider, S.; Mishra, P.P. Does innovative capability enhance the energy efficiency of Indian Iron and Steel firms? A Bayesian stochastic frontier analysis. Energy Econ. 2021, 95, 105128. [Google Scholar] [CrossRef]
  31. Kumbhakar, S.C.; Parmeter, C.F.; Zelenyuk, V. Stochastic frontier analysis: Foundations and advances I. In Handbook of Production Economics; Springer: Berlin/Heidelberg, Germany, 2020; pp. 1–40. [Google Scholar]
  32. Abdullahi, N.M.; Zhang, Q.; Shahriar, S.; Irshad, M.S.; Ado, A.B.; Huo, X. Examining the determinants and efficiency of China’s agricultural exports using a stochastic frontier gravity model. PLOS One 2022, 17, e0274187. [Google Scholar] [CrossRef]
  33. Boiko, K. R&D activity and firm performance: Mapping the field. Manag. Rev. Q. 2021, 72, 1–37. [Google Scholar]
  34. Liu, C.J.; Gao, J. “Supporting the Excellent” or “Helping the Poor”—Research on the incentive effect of R&D subsidy on innovation. Econ. Manag. 2019, 41, 57–74. [Google Scholar]
  35. Lin, B.; Luan, R. Do government subsidies promote efficiency in technological innovation of China’s photovoltaic enterprises? J. Clean. Prod. 2020, 254, 120108. [Google Scholar] [CrossRef]
  36. Bai, J.H. Is China’s government R&D funding effective? Empirical evidence from large and medium-sized industrial enterprises. Economics 2011, 10, 1375–1400. [Google Scholar]
  37. Li, Y.X.; Tan, Y.Q. The path to enhance the technological innovation capability of outsourcing enterprises under international service outsourcing-based on the perspective of spillover effect and absorptive capacity. China Ind. Econ. 2010, 12, 66–75. [Google Scholar]
  38. Corredoira, R.A.; Goldfarb, B.D.; Shi, Y. Federal funding and the rate and direction of inventive activity. Res. Policy 2018, 47, 1777–1800. [Google Scholar] [CrossRef]
  39. Yu, F.; Guo, Y.; Le-Nguyen, K.; Barnes, S.J.; Zhang, W. The impact of government subsidies and enterprises’ R&D investment: A panel data study from renewable energy in China. Energy Policy 2016, 89, 106–113. [Google Scholar]
Figure 1. R&D support from the Chinese government to the manufacturing industry from 2009 to 2015.
Processes 11 00181 g001
Table 1. Definitions and calculation methods of various variables.
TypeNameSymbolMeasure
The explained variableR&D efficiency of China’s manufacturing enterprisesEFSFA Model
The explanatory variablesGovernment’s R&D direct subsidies Gov“Funds for Science and Technology Activities from the Government in R&D Expenses” in the China Science and Technology Statistical Yearbook.
Tax incentivesTax“R&D expenses plus deduction allowance” in the China Science and Technology Statistical Yearbook.
Personnel Peo“R&D personnel” in the China Science and Technology Statistical Yearbook.
Internal expendituresFund“R&D internal expenditures” in the China Science and Technology Statistical Yearbook.
Control variablesEnterprise scale Sca“Main business income” divides “number of enterprises” in the manufacturing industry of China Science and Technology Statistical Yearbook.
Enterprise ownershipOwn“State-Owned and State-Holding Enterprises Sales Income” divides “manufacturing industry sales income” in the manufacturing industry of China Science and Technology Statistical Yearbook.
Innovation levelInn“Enterprises with R&D activities” divides “number of enterprises at the end of the year” in the China Science and Technology Statistical Yearbook.
Management capabilityManag“Science and Technology staff” minus “Scientists and Engineers” then divides “Science and Technology staff” in the China Science and Technology Statistical Yearbook.
Table 2. The R&D efficiency of China’s manufacturing from 2009 to 2015.
No.Industry2009201020112012201320142015AverageStandard Deviation
1Agricultural by products processing0.2090.2360.2640.2930.3230.3520.3820.2940.058
2Food0.2920.3210.3510.3800.4100.4400.4690.3800.059
3Beverage0.1010.1210.1420.1660.1910.2170.2440.1690.048
4Tobacco0.3660.3960.4260.4550.4830.5120.5390.4540.058
5Textile0.1530.1770.2020.2290.2570.2850.3150.2310.054
6Textile garments and hats0.1170.1380.1610.1860.2120.2390.2670.1880.050
7Leather, fur, feather products0.1090.1290.1510.1750.2010.2280.2560.1780.049
8Wood, bamboo, vine, palm, grass processing0.3220.3520.3820.4110.4410.4700.4980.4110.059
9Furniture0.2610.2890.3190.3480.3780.4080.4370.3480.059
10Paper and paper products0.1270.1490.1730.1990.2250.2530.2810.2010.052
11Prints and record media copies0.2100.2380.2660.2940.3240.3530.3830.2950.058
12Educational and sports goods0.3080.3370.3670.3970.4260.4550.4840.3960.059
13Oil and nuclear fuel processing, coking0.1110.1320.1540.1790.2040.2310.2590.1810.049
14Raw chemical materials and chemical products0.2860.3150.3450.3740.4040.4330.4630.3740.059
15Pharmaceutical0.4140.4430.4720.5000.5280.5550.5810.4990.056
16Chemical fiber0.1160.1370.1600.1840.2100.2370.2660.1870.050
17Non-metallic minerals0.3200.3500.3790.4090.4380.4670.4960.4090.059
18Ferrous metal smelting and rolling0.1150.1360.1590.1830.2090.2360.2640.1860.050
19Non-ferrous metal smelting and rolling0.1660.1910.2170.2440.2730.3020.3310.2460.055
20Metal products0.2610.2900.3190.3490.3790.4080.4380.3490.059
21General machinery0.2770.3060.3350.3650.3950.4240.4540.3650.059
22Special equipment0.3690.3990.4280.4570.4860.5140.5410.4560.058
23Transportation equipment0.1830.2090.2360.2640.2930.3220.3520.2660.056
24Electrical machinery and equipment0.4390.4680.4970.5240.5510.5770.6030.5230.054
25Communication, computer, and electrical devices0.7970.8110.8240.8370.8480.8590.8690.8350.024
26Parameter optimization and cultural, OA equipment0.4110.4400.4690.4970.5250.5520.5780.4960.056
27Handicrafts and others0.2620.2900.3200.3490.3790.4090.4380.3490.059
28Waste materials and resources recycle0.1970.2230.2510.2790.3080.3380.3680.2810.057
29Average0.2610.2860.3130.3400.3680.3960.4230.3410.054
30Max0.7970.8110.8240.8370.8480.8590.869————
31Min0.1010.1210.1420.1660.1910.2170.244————
32Medium0.2610.2900.3190.3490.3780.4080.437————
Table 3. Regression results.
TypeNameModel IModel IIModel III
The explained variable EFEFEF
The explanatory variablesLnTax 0.014 ***
(3.157)
0.014 ***
(3.131)
LnGov0.035
(0.362)
0.002
(0.338)
LnPeo0.009
(0.583)
−0.110 ***
(−7.663)
−0.112 ***
(−7.319)
LnFund−0.001
(−0.064)
0.148 ***
(10.794)
0.149 ***
(10.806)
Control variablesLnSca0.076 ***
(4.233)
−0.039 ***
(−4.320)
−0.039 ***
(−4.251)
LnOwn−0.031 ***
(−4.033)
−0.007
(−0.957)
−0.008
(−0.992)
LnInn0.120 ***
(11.253)
0.048 ***
(5.393)
0.048 ***
(5.369)
LnManag0.077 **
(2.464)
−0.042
(−1.158)
−0.044
(−1.196)
LnGov(t-2)0.009 ***
(3.052)
Constants α −0.379 **
(−2.107)
−0.340 **
(−2.240)
−0.352 **
(−2.261)
sigma_u0.123 ***
(6.905)
0.140 ***
(7.422)
0.141 ***
(7.415)
sigma_e0.014 ***
(14.661)
0.023 ***
(18.317)
0.023 ***
(18.314)
N137213721568
Z statistics are in parentheses; ** p < 0.05, *** p < 0.01.
Disclaimer/Publisher’s Note: The statements, opinions and data contained in all publications are solely those of the individual author(s) and contributor(s) and not of MDPI and/or the editor(s). MDPI and/or the editor(s) disclaim responsibility for any injury to people or property resulting from any ideas, methods, instructions or products referred to in the content.

