


Spatiotemporal Dynamics and Prediction of Habitat Quality Based on Land Use and Cover Change in Jiangsu, China
 , , ,
, , ,
Abstract
:1. Introduction
2. Materials and Methods
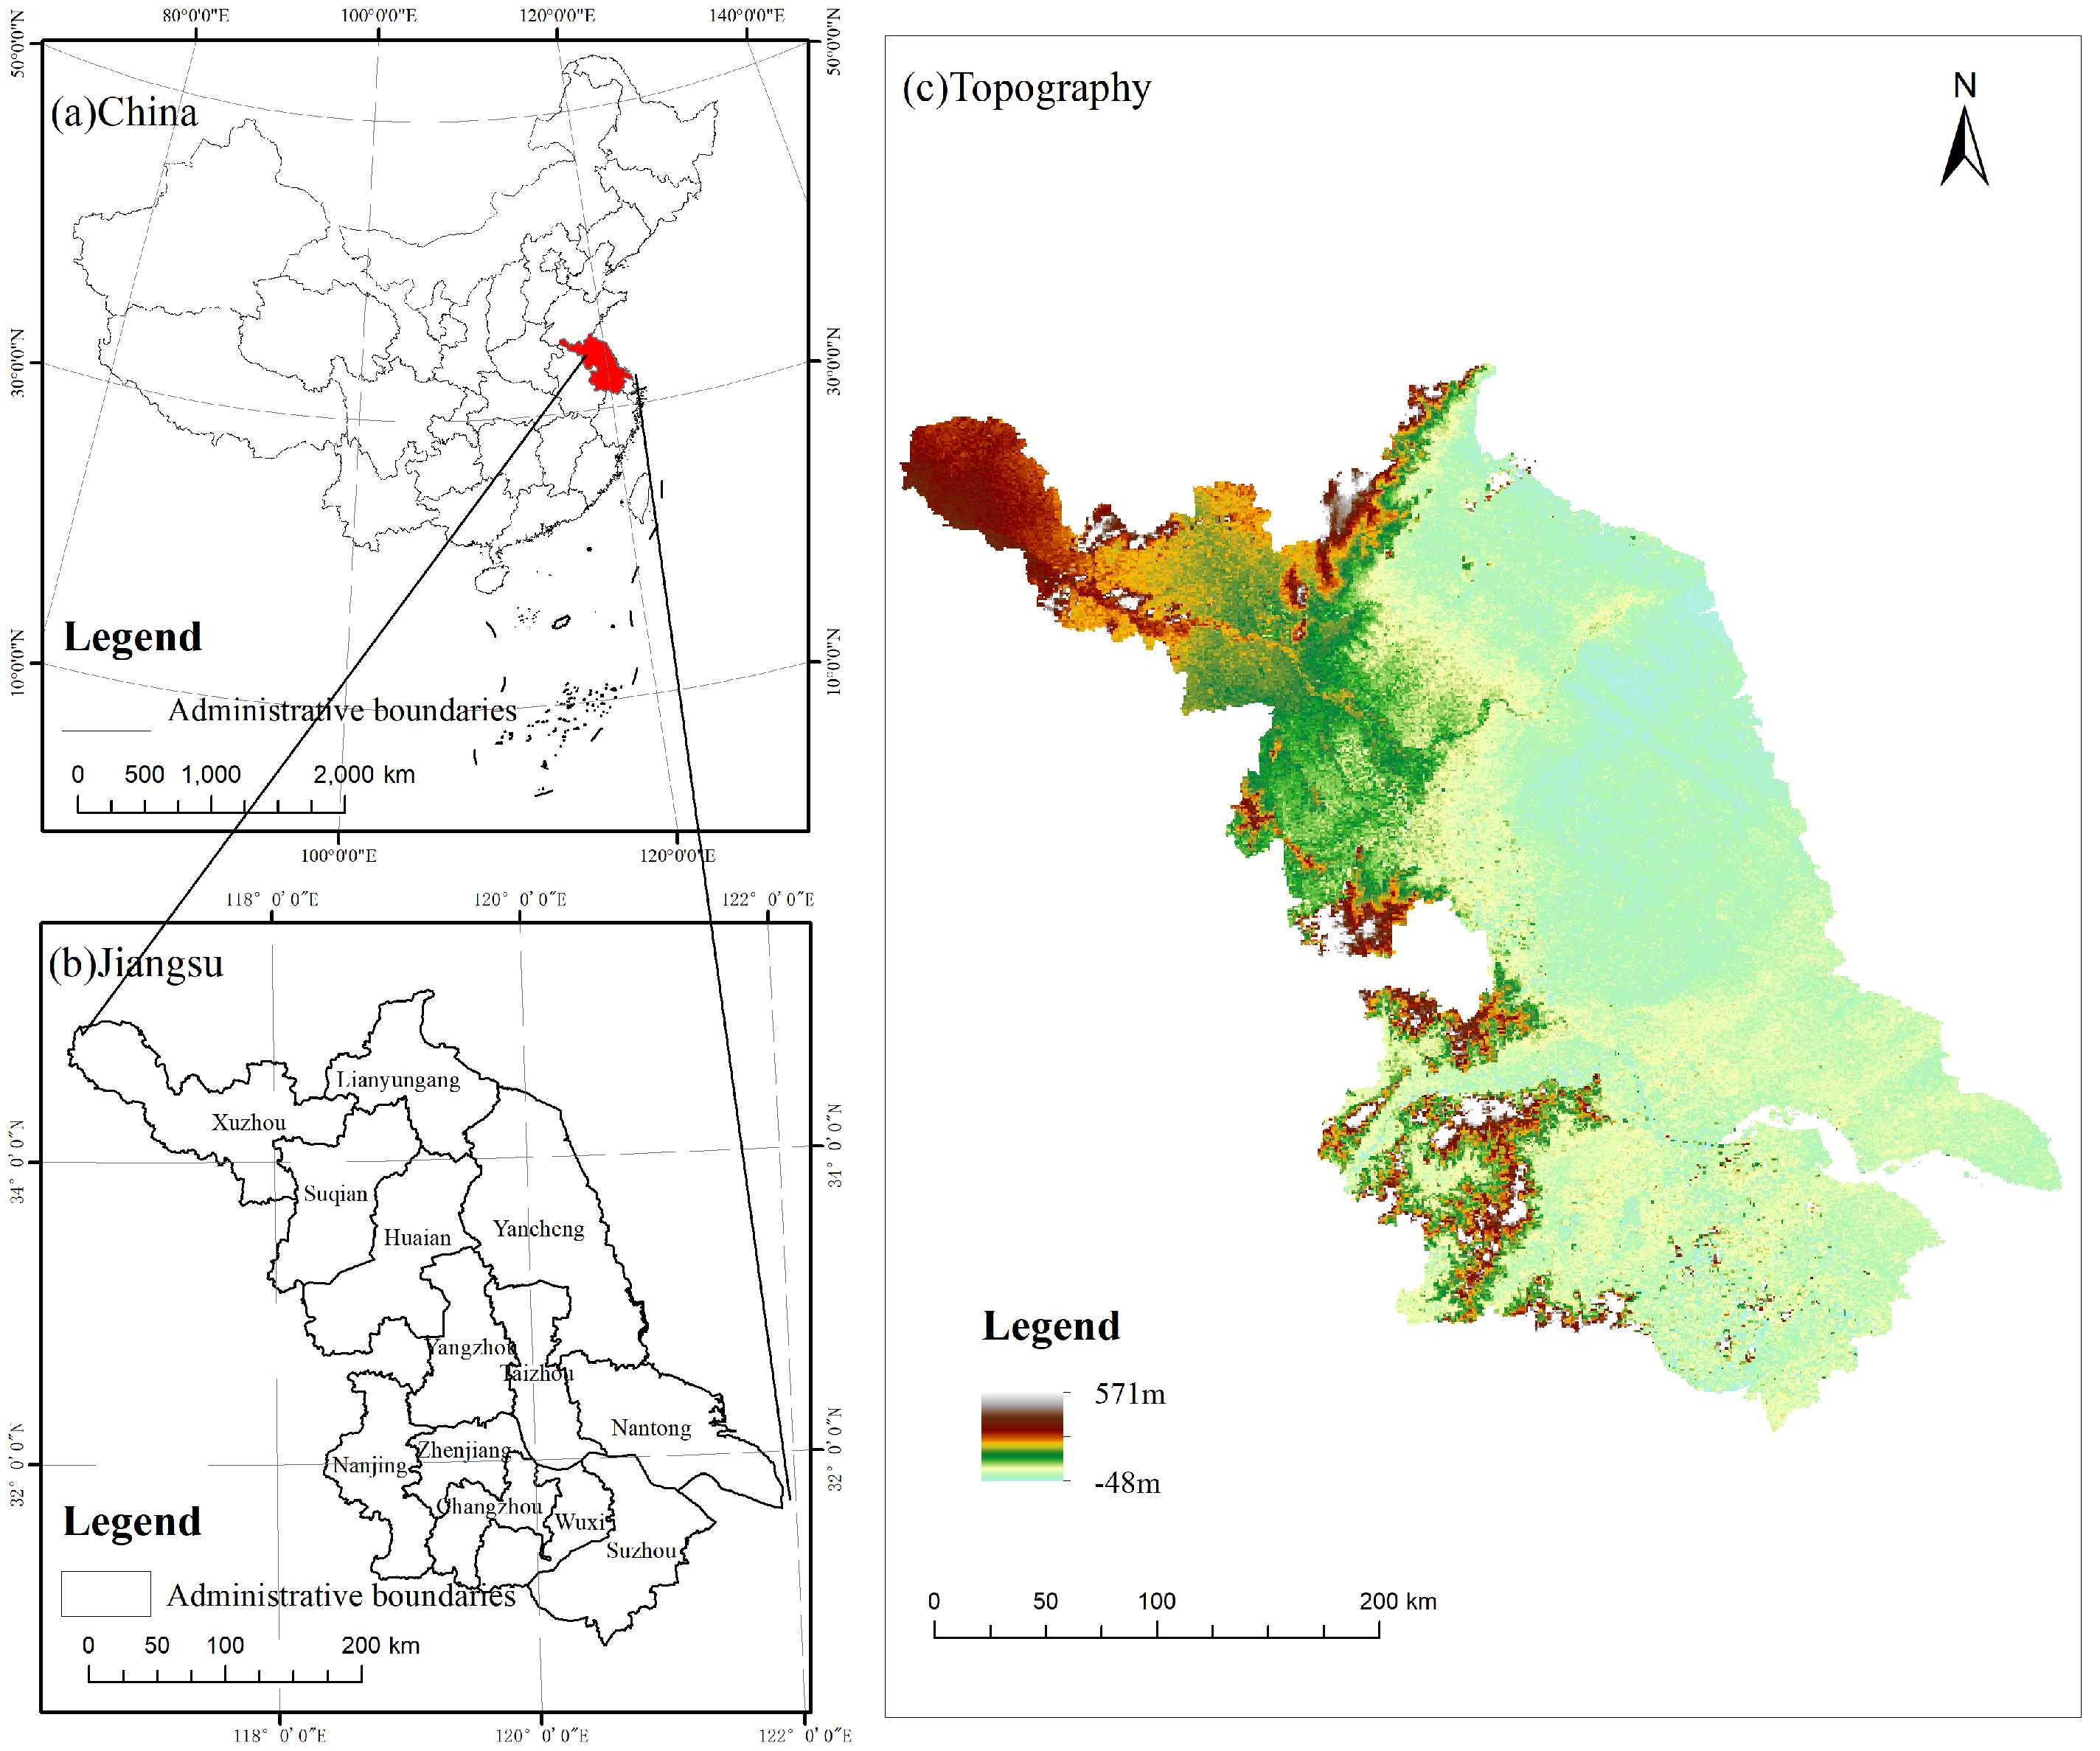
2.1. Study Area
2.2. Data
2.2.1. Land Use and Cover Change Dataset
2.2.2. Basic Data on the City
2.2.3. Natural and Socio-Economic Factors Data
2.3. Method
2.3.1. CA–Markov Model
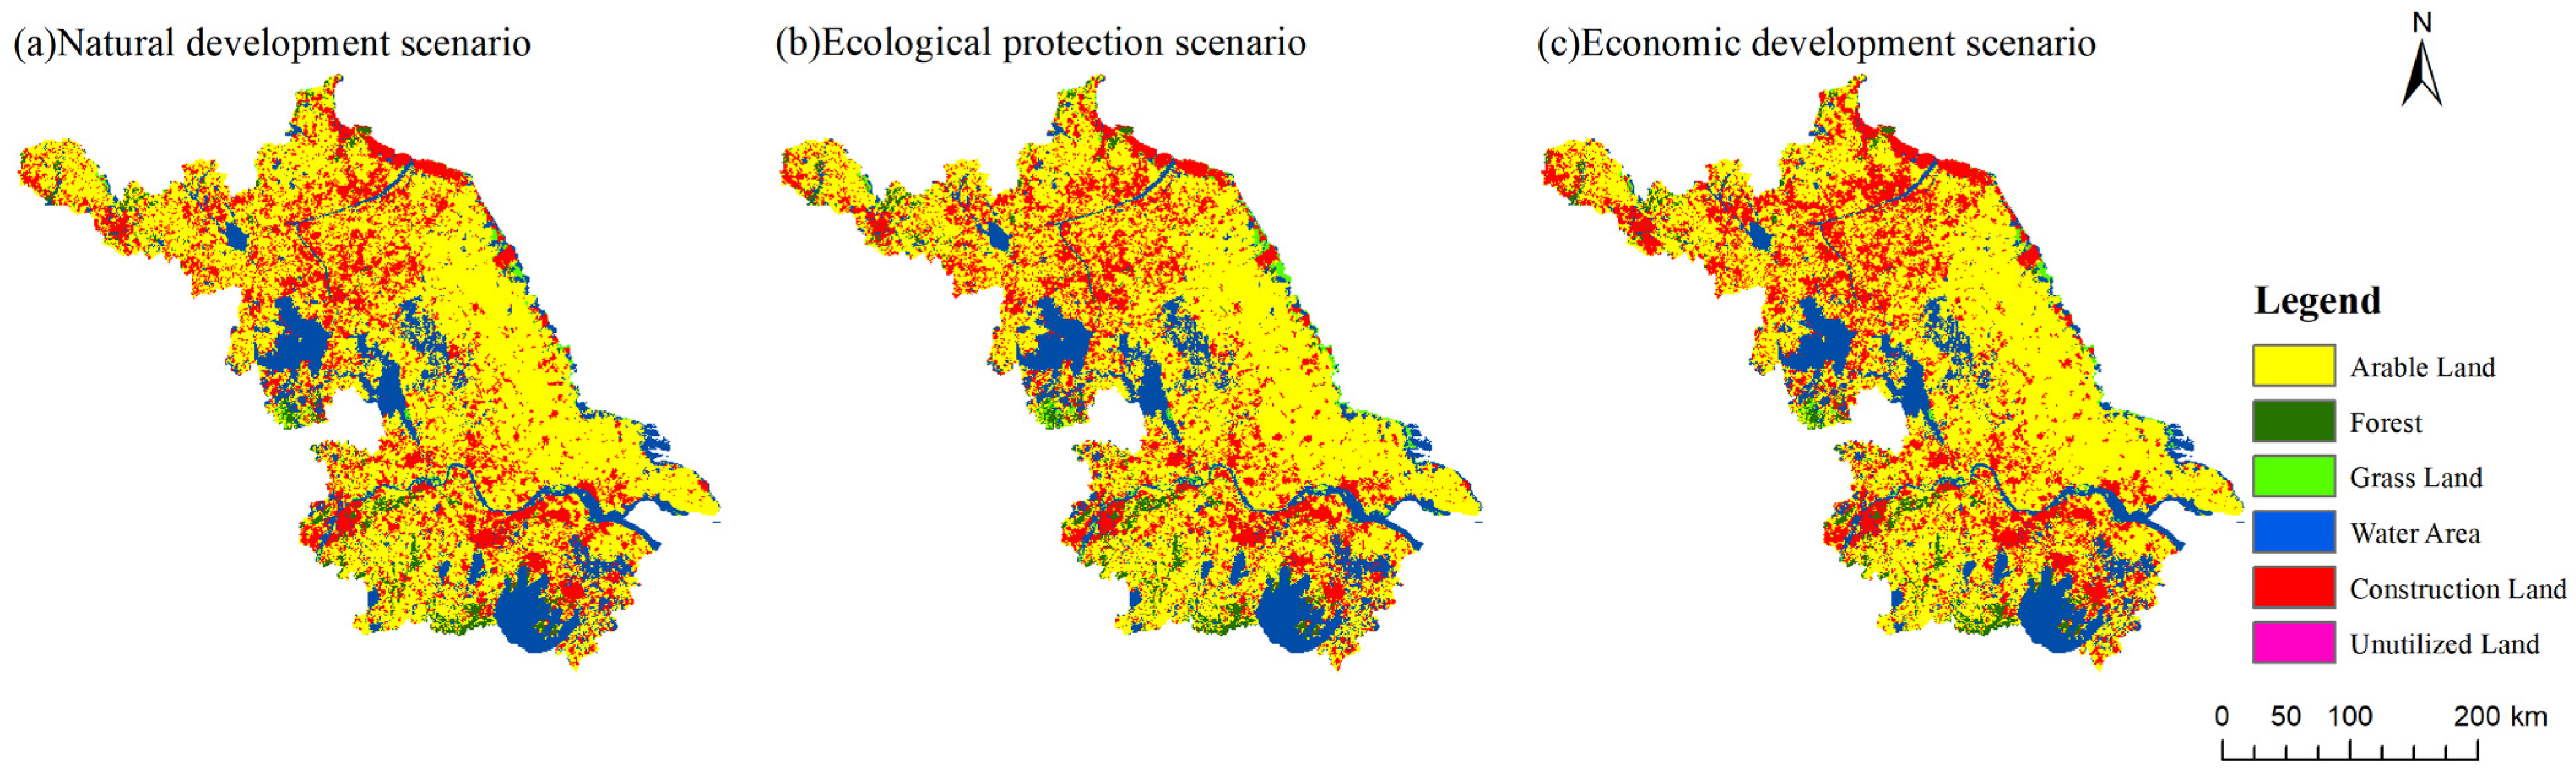
- Natural development scenario: This scenario continues the development trend of land use in Jiangsu Province before 2020, predicting the total demand area for land use types in 2030 by following natural development patterns.
- Ecological protection scenario: This scenario restricts urbanization to direct land use towards ecological protection. The “Jiangsu Province ‘14th Five-Year’ Forestry and Grassland Protection and Development Plan Outline” proposes a target of 24.1% forest coverage by 2025 and 26% by 2030 [31]. Therefore, based on the total land demand under scenario S1 in 2030, and while considering the structure of ecological, agricultural, and urban land use, the conversion probability for each type of land use is set, with a 20% decrease in the probability of arable land, forest land, and grassland becoming construction land; a 60% increase in the probability of arable land becoming forest land or grassland; a prohibition of water bodies becoming construction land; and an ecological red line area within the region as a restricted expansion area.
- Economic development scenario: Jiangsu Province has always been at the forefront of urbanization development in China, and it is expected that the possibility of various types of land use becoming construction land will increase. Based on the total demand area for each land use and cover type under the natural development scenario in 2030, the proportion of forest land, grassland, and water bodies being converted to construction land increases by 15%, 10%, and 10%, respectively, with a 60% decrease in the possibility of construction land being converted to other types, and with free transfer between the other types of land use [31,32].
2.3.2. Habitat Quality Model
2.3.3. Geographic Detector Model
2.3.4. Landscape Pattern Index Analysis
3. Results
3.1. Land Use and Cover Change Situation from 2000 to 2020
3.2. Evolution of Landscape Pattern Indices
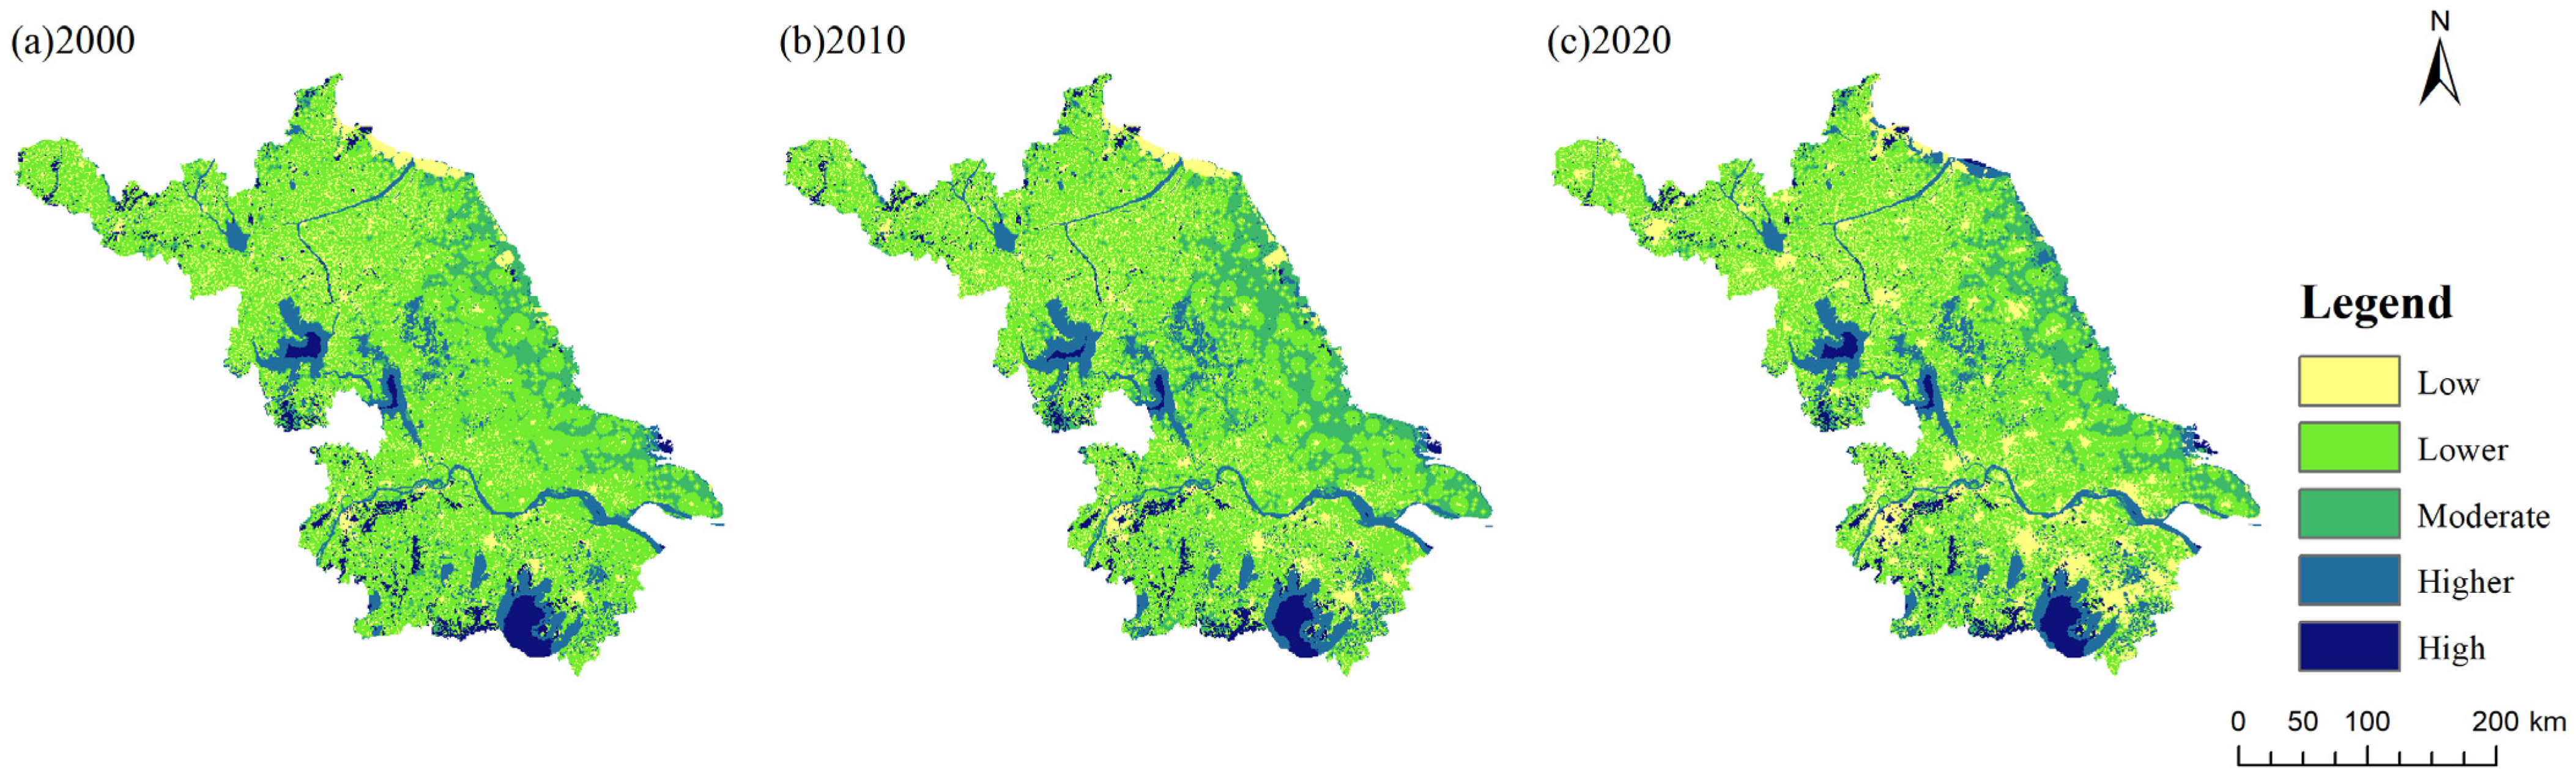
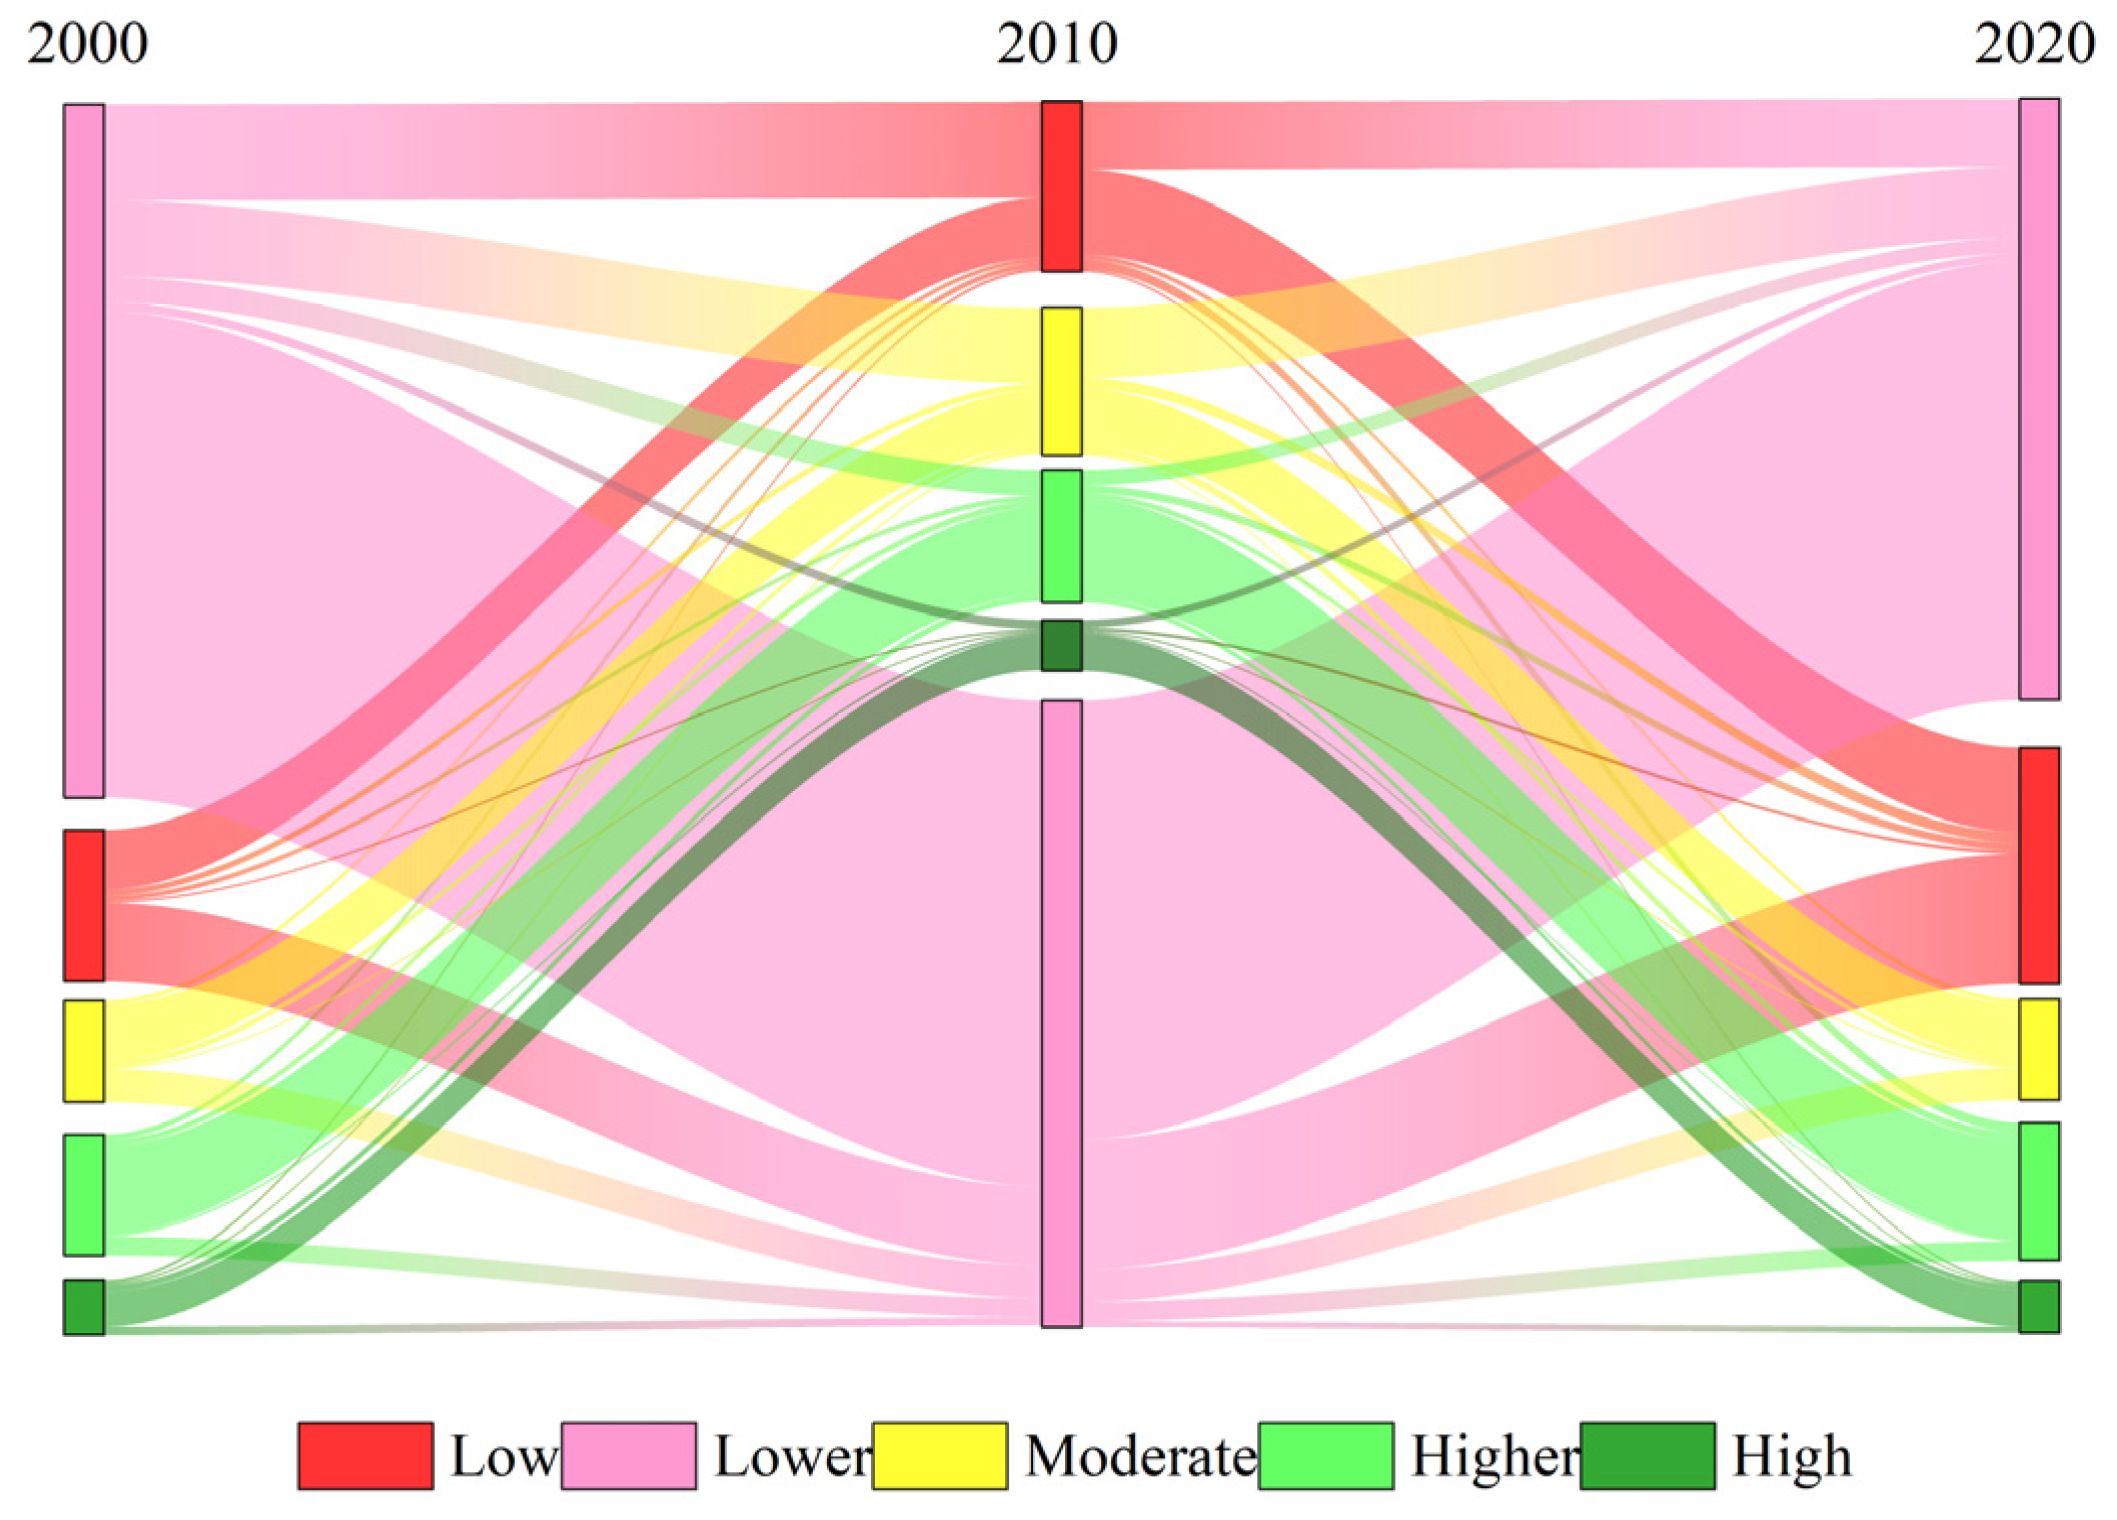
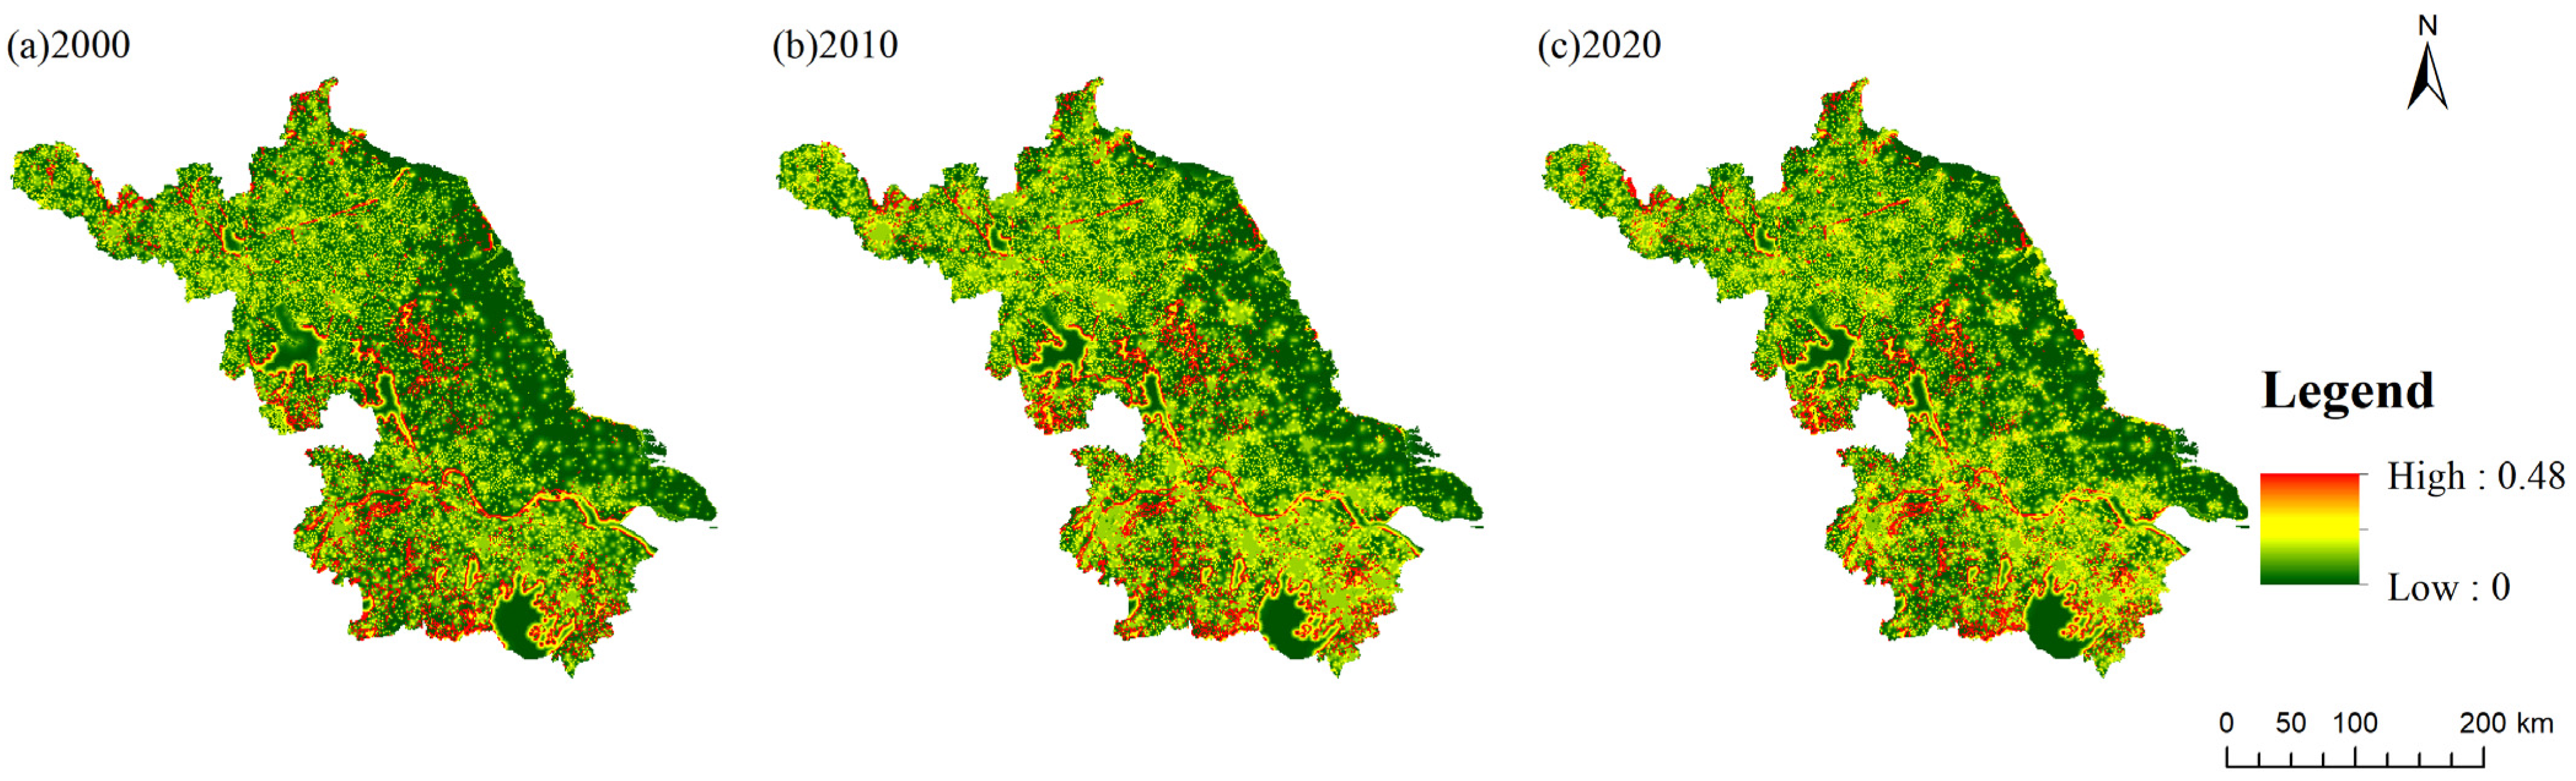
3.3. Habitat Quality Situation from 2000 to 2020
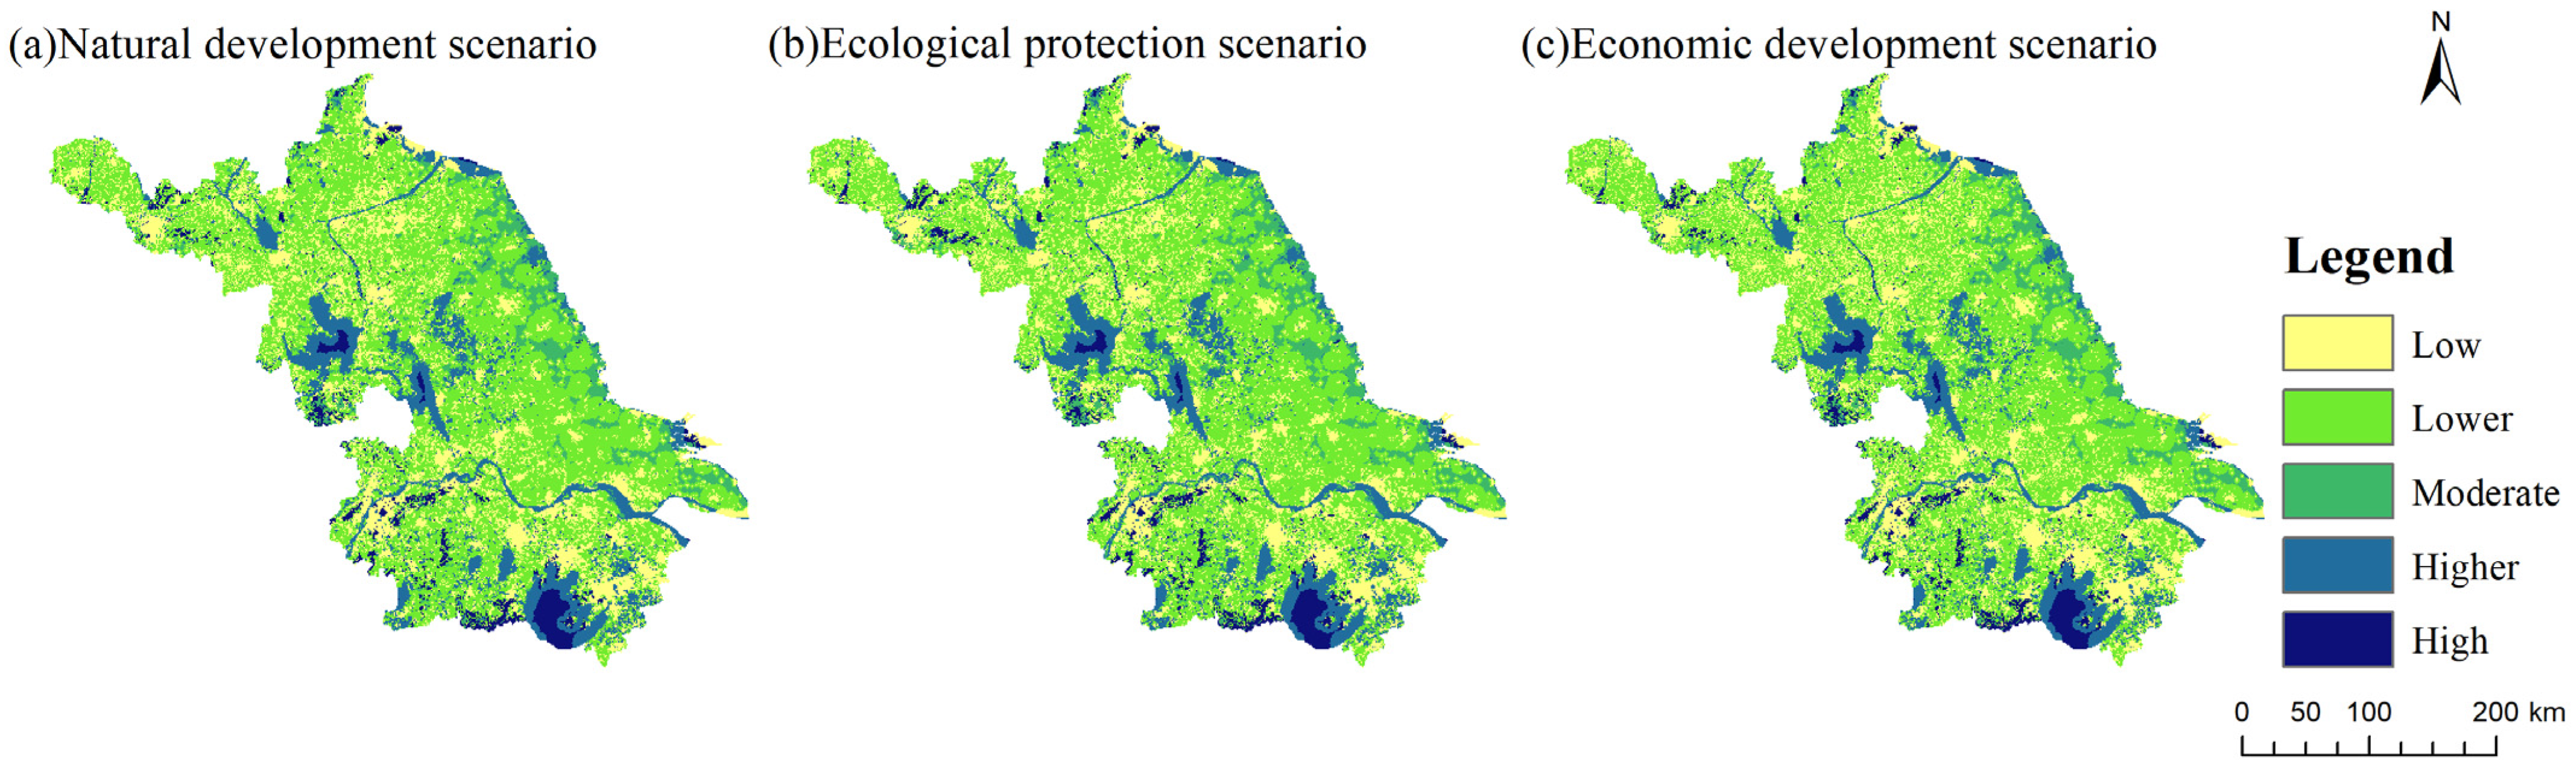
3.4. Habitat Quality Prediction in 2030 Under Three Scenarios
3.5. Influencing Factors for Habitat Quality Changes
- (1)
- Ecosystem services and factors such as slope, soil, population, and GDP: There is a significant synergistic effect between ecosystem services and these factors, indicating a spatial synergy in their influence on habitat quality. For instance, the synergistic effect between ecosystem services and slope may reflect the contribution of natural topographical variations to the enhancement of ecological service functions. Meanwhile, the synergistic effect between ecosystem services and GDP suggests the potential driving role of economic development in ecological protection and improvement.
- (2)
- The interaction of GDP with other factors: The interaction effect of GDP with other factors is generally strong, especially with slope, soil, and population distribution, with q values close to 1. This indicates that GDP plays a leading role in the improvement of habitat quality. Economic development often accompanies the construction of infrastructure and the strengthening of environmental management, which may explain the positive impact of GDP growth on habitat quality. However, this impact is not linear but rather the result of a combination of natural conditions and economic activities.
- (3)
- Interaction effects among natural factors: The interactive effects between ecosystem services and natural factors, such as aspect and topography, are also significant, particularly the nonlinear enhancing effect between ecosystem services and topography. This suggests that the influence of natural conditions on habitat quality has complex nonlinear characteristics. It may imply that the provision efficiency and scope of ecological services may be limited under different topographical conditions, especially in areas with complex or extreme terrain, where ecosystem functions may be more constrained.
- (4)
- Interaction between slope, soil, and population distribution: There is also a significant synergistic effect between factors such as slope, soil, and population distribution. These results indicate that there is a complex interplay between natural geographical conditions and social activities, both of which jointly affect the spatial pattern of habitat quality. For example, in areas with dense population, the improvement of soil quality contributes more significantly to habitat quality, reflecting the enhancing effect of the combination of population distribution and soil.
4. Discussion
4.1. Distribution and Influencing of Habitat Quality
4.2. Recommendation for Future Policy
4.3. Limitations
5. Conclusions
Author Contributions
Funding
Data Availability Statement
Acknowledgments
Conflicts of Interest
References
- Tylianakis, J.; Didham, R.; Bascompte, J.; Wardle, D. Global change and species interactions in terrestrial ecosystems. Ecol. Lett. 2008, 11, 1351–1363. [Google Scholar] [CrossRef] [PubMed]
- Li, W.; Zhang, S.; Lu, C. Exploration of China’s net CO2 emissions evolutionary pathways by 2060 in the context of carbon neutrality. Sci. Total Environ. 2022, 831, 154909. [Google Scholar] [CrossRef] [PubMed]
- Chen, B.; Chen, F.; Ciais, P.; Zhang, H.; Lü, H.; Wang, T.; Chevallier, F.; Liu, Z.; Yuan, W.; Peters, W. Challenges to Achieve Carbon Neutrality of China by 2060: Status and Perspectives. Sci. Bull. 2022, 67, 2030–2035. [Google Scholar] [CrossRef] [PubMed]
- Zhang, S.; Sun, C.; Zhang, Y.; Hu, M.; Shen, X. Exploring the Spatiotemporal Changes and Driving Forces of Ecosystem Services of Zhejiang Coasts, China, Under Sustainable Development Goals. Chin. Geogr. Sci. 2024, 34, 647–661. [Google Scholar] [CrossRef]
- Bongaarts, J. Intergovernmental panel on cimate change special report on global warming of 1.5 °C Switzerland: IPCC, 2018. Popul. Dev. Rev. 2019, 45, 251–252. [Google Scholar] [CrossRef]
- He, J.; Huang, J.; Li, C. The evaluation for the impact of land use change on habitat quality: A joint contribution of cellular automata scenario simulation and habitat quality assessment model. Ecol. Model. 2017, 366, 58–67. [Google Scholar] [CrossRef]
- Zhou, Y.; Geng, J.; Liu, X. Urban Habitat Quality Enhancement and Optimization under Ecological Network Constraints. Land 2024, 13, 1640. [Google Scholar] [CrossRef]
- Shi, G.; Jiang, N.; Yao, L. Land Use and Cover Change during the Rapid Economic Growth Period from 1990 to 2010: A Case Study of Shanghai. Sustainability 2018, 10, 426. [Google Scholar] [CrossRef]
- Jiang, H.; Peng, J.; Zhao, Y.; Xu, D.; Dong, J. Zoning for ecosystem restoration based on ecological network in mountainous region. Ecol. Indic. 2022, 142, 109138. [Google Scholar] [CrossRef]
- Faichia, C.; Tong, Z.; Zhang, J.; Liu, X.; Kazuva, E.; Ullah, K.; Al-Shaibah, B. Using RS Data-Based CA–Markov Model for Dynamic Simulation of Historical and Future LUCC in Vientiane, Laos. Sustainability 2020, 12, 8410. [Google Scholar] [CrossRef]
- Zhang, M.; Li, B.; Gao, H.; Liang, C.; Song, P.; Gu, H.; Qin, W.; Zhang, J.; Liu, D.; Jiang, F.; et al. Species diversity and vertical distribution patterns of birds on the southern slopes of the Qilian Mountains. Acta Ecol. Sin. 2024, 44, 8826–8843. [Google Scholar]
- Liang, H.; Lin, Y.; Liu, X.; Jiang, Y.; Yang, J.; Huang, R.; Wang, R.; Wang, Y. Evaluating habitat suitability of endangered plant Horsfieldia hainanensis based on the optimized MaxEnt model. J. Cent. South Univ. For. Technol. 2024, 44, 16–26. [Google Scholar]
- Zhang, S.; Lin, Y.; Chen, Q.; Zhang, J. Physical habitat assessment of the Yangtze finless porpoise in the lower Yangtze River, Nanjing to Zhenjiang Reach. Acta Ecol. Sin. 2024, 44, 8884–8896. [Google Scholar]
- An, W.; Yu, Y.; Hao, S.; Wang, Y.; Li, X.; Mai, X. Evolution and response analysis of habitat quality in more sediments and coarse sediments region of northern shaanxi based on land use change. Arid. Land Geogr. 2024, 47, 474–484. [Google Scholar]
- Yao, S.; Li, Y.; Quan, X.; Xu, J. Applying the driver-pressure-state-impact-response model to ecological restoration: A case study of comprehensive zoning and benefit assessment in Zhejiang Provices, China. Glob. Ecol. Conserv. 2024, 24, 55. [Google Scholar] [CrossRef]
- Shi, G.; Jiang, N.; Li, Y.; He, B. Analysis of the Dynamic Urban Expansion Based on Multi-Sourced Data from 1998 to 2013: A Case Study of Jiangsu Province. Sustainability 2018, 10, 3467. [Google Scholar] [CrossRef]
- Cao, X.; Sun, Y.; Wang, Y.; Wang, Y.; Cheng, X.; Zhang, W.; Zong, J.; Wang, R. Coastal Erosion and Flooding Risk Assessment Based on Grid Scale: A Case Study of Six Coastal Metropolitan Areas. Sci. Total Environ. 2024, 946, 174393. [Google Scholar] [CrossRef]
- Lu, Y.W.; Chen, S.L. Exploring the realization pathway of carbon peak and carbon neutrality in the provinces around the Yangtze River of China. J. Clean. Prod. 2024, 466, 142904. [Google Scholar] [CrossRef]
- Yao, S.; Huang, G.; Chen, Z. Evaluation of urban flood adaptability based on the InVEST model and GIS: A case study of New York City, USA. Nat. Hazards 2024, 120, 11063–11082. [Google Scholar] [CrossRef]
- Shi, G.; Wang, Y.; Zhang, J.; Xu, J.; Chen, Y.; Chen, W.; Liu, J. Spatiotemporal Pattern Analysis and Prediction of Carbon Storage Based on Land Use and Cover Change: A Case Study of Jiangsu Coastal Cities in China. Land 2024, 13, 1728. [Google Scholar] [CrossRef]
- Xu, Y.; Gao, M.; Zhang, Z. Land use change and its impact on habitat quality in the middle and lower reaches of the Yangtze River based on InVEST model. Res. Soil Water Conserv. 2024, 31, 355–364. [Google Scholar]
- Li, S.F.; Hong, Z.L.; Xue, X.P.; Zheng, X.F.; Du, S.S.; Liu, X.F. Evolution Characteristics and Multi-Scenario Prediction of Habitat Quality in Yulin City Based on PLUS and InVEST Models. Sci. Rep. 2024, 14, 11852. [Google Scholar] [CrossRef] [PubMed]
- Broquet, M.; Campos, F.S.; Cabral, P.; David, J. Habitat quality on the edge of anthropogenic pressures: Predicting the impact of land use changes in the Brazilian Upper Paraguay river Basin. J. Clean. Prod. 2024, 459, 142546. [Google Scholar] [CrossRef]
- Dai, Y. Identifying the ecological security patterns of the Three Gorges Reservoir Region, China. Environ. Sci. Pollut. Res. Int. 2022, 29, 45837–45847. [Google Scholar] [CrossRef]
- Zhang, M.; Chen, L.; Long, K. Analysis of Econometrics and Coordination between Cultivated Land Resource and Economic Development in Jiangsu Province. China Popul. Resour. Environ. 2009, 19, 82–86. [Google Scholar]
- National Bureau of Statistics of the People’s Republic of China. China Statistical Bureau. 2023. Available online: http://www.stats.gov.cn (accessed on 14 June 2024).
- Yangtze River Delta Science Data Center, National Science and Technology Infrastructure of China. National Earth System Science Data Sharing Infrastructure. 2015. Available online: www.nnu.geodata.cn (accessed on 10 May 2024).
- Guo, B.; Yu, F.; Xu, W. The Effect of Environmental Information Disclosure on Carbon Emission. Pol. J. Environ. Stud. 2023, 33, 173106. [Google Scholar] [CrossRef]
- Yi, Y.; Zhang, C.; Zhu, J.; Zhang, Y.; Sun, H.; Kang, H. Spatio-Temporal Evolution, Prediction and Optimization of LUCC Based on CA-Markov and InVEST Models: A Case Study of Mentougou District, Beijing. Int. J. Environ. Res. Public Health 2022, 19, 2432. [Google Scholar] [CrossRef]
- Xu, Q.; Zhu, A.-X.; Liu, J. Land-use change modeling with cellular automata using land natural evolution unit. Catena 2023, 224, 106998. [Google Scholar] [CrossRef]
- Hou, J.; Chen, J.; Zhang, K.; Zhou, G.; You, H.; Han, X. Temporal and Spatial Variation Characteristics of Carbon Storage in the Source Region of the Yellow River Based on InVEST and GeoSoS-FLUS Models and Its Response to Different Future Scenarios. Huan Jing Ke Xue Huanjing Kexue 2022, 43, 5253–5262. [Google Scholar]
- Tang, Z.; Ning, R.; Wang, D.; Tian, X.; Bi, X.; Ning, J.; Zhou, Z.; Luo, F. Projections of Land Use/Cover Change and Habitat Quality in the Model Area of Yellow River Delta by Coupling Land Subsidence and Sea Level Rise. Ecol. Indic. 2024, 158, 111394. [Google Scholar] [CrossRef]
- Chen, C.; Liu, J.; Bi, L. Spatial and Temporal Changes of Habitat Quality and Its Influential Factors in China Based on the InVEST Model. Forests 2023, 14, 374. [Google Scholar] [CrossRef]
- Zhao, Y.; Wu, Q.; Wei, P.; Zhao, H.; Zhang, X.; Pang, C. Explore the Mitigation Mechanism of Urban Thermal Environment by Integrating Geographic Detector and Standard Deviation Ellipse (SDE). Remote Sens. 2022, 14, 3411. [Google Scholar] [CrossRef]
- Chen, L.; Fu, B.; Xu, J.; Gong, J. Location-weighted landscape contrast index: A scale independent approach for landscape pattern evaluation based on source-sink ecological processes. Acta Ecol. Sin. 2002, 23, 2406–2413. [Google Scholar]
- Griffith, J.A.; Martinko, E.A.; Whister, J.L.; Price, K.P. Preliminary comparison of landscape pattern-normalized difference vegetation index (NDVI) relationships to central plains stream conditions. J. Env. Qual. 2002, 31, 846–859. [Google Scholar] [CrossRef]
- Croft, M.; Chow, P. Use and development of the wetland macrophyte index to detect water quality impairment in fish habitat of Great Lakes Coastal Marshes. J. Great Lakes Res. 2007, 33, 172–197. [Google Scholar] [CrossRef]
- Shi, G.; Ye, P.; Ding, L.; Quinones, A.; Li, Y.; Jiang, N. Spatio-Temporal Patterns of Land Use and Cover Change from 1990 to 2010: A Case Study of Jiangsu Province, China. Int. J. Environ. Res. Public Health 2019, 16, 907. [Google Scholar] [CrossRef]
- Chen, C.; Tao, G.; Shi, J.; Shen, M.; Zhu, Z.H. A lithium-ion battery degradation prediction model with uncertainty quantification for its predictive maintenance. IEEE Trans. Ind. Electron. 2023, 71, 3650–3659. [Google Scholar] [CrossRef]
- Wu, L.; Sun, C.; Fan, F. Estimating the Characteristic Spatiotemporal Variation in Habitat Quality Using the InVEST Model—A Case Study from Guangdong–Hong Kong–Macao Greater Bay Area. Remote Sens. 2021, 13, 1008. [Google Scholar] [CrossRef]
- Zhou, X.; Xiao, L.; Lu, X.; Sun, D. Impact of Road Transportation Development on Habitat Quality in Economically Developed Areas: A Case Study of Jiangsu Province, China. Growth Change 2020, 51, 852–871. [Google Scholar] [CrossRef]
- Chen, Y.; Chang, J.; Li, Z.; Ming, L.; Li, C. Influence of land use change on habitat quality: A case study of coal mining subsidence areas. Environ. Monit. Assess. 2024, 196, 535. [Google Scholar] [CrossRef]
- Wang, S.; Hua, G.; Yang, L. Coordinated development of economic growth and ecological efficiency in Jiangsu, China. Environ. Sci. Pollut. Res. 2020, 27, 36664–36676. [Google Scholar] [CrossRef] [PubMed]
- Liu, J.; Jin, X.B.; Xu, W.Y.; Zhou, Y.K. Evolution of cultivated land fragmentation and its driving mechanism in rural development: A case study of Jiangsu Province. J. Rural Stud. 2022, 91, 58–72. [Google Scholar] [CrossRef]
- Zhu, C.; Chen, Y.; Wan, Z.; Chen, Z.; Lin, J.; Chen, P.; Sun, W.; Yuan, H.; Zhang, Y. Cross-sensitivity analysis of land use transition and ecological service values in rare earth mining areas in southern China. Sci. Rep. 2023, 13, 22817. [Google Scholar] [CrossRef] [PubMed]
- Huang, M.; Gong, D.; Zhang, L.; Lin, H.; Chen, Y.; Zhu, D.; Xiao, C. Spatiotemporal dynamics and forecasting of ecological security pattern under the consideration of protecting habitat: A case study of the Poyang Lake ecoregion. Int. J. Digit. Earth 2024, 17, 2376277. [Google Scholar] [CrossRef]
- Zhao, Y.; Qu, Z.; Zhang, Y.; Ao, Y.; Han, L.; Kang, S.; Sun, Y. Effects of human activity intensity on habitat quality based o nighttime light remote sensing: A case study of Northern Shaanxi, China. Sci. Total Environ. 2022, 10, 851. [Google Scholar] [CrossRef]


| Development Scenario | Land Use Type | Arable Land | Forest | Grassland | Water Area | Construction Land | Unutilized Land |
|---|---|---|---|---|---|---|---|
| Natural development scenario | Arable land | 1 | 1 | 1 | 1 | 1 | 0 |
| Forest | 1 | 1 | 1 | 1 | 1 | 0 | |
| Grassland | 1 | 1 | 1 | 1 | 1 | 0 | |
| Water area | 1 | 1 | 1 | 1 | 1 | 0 | |
| Construction land | 1 | 1 | 1 | 1 | 1 | 0 | |
| Unutilized land | 1 | 1 | 1 | 1 | 1 | 0 | |
| Ecological protection scenario | Arable land | 1 | 1 | 1 | 1 | 1 | 0 |
| Forest | 0 | 1 | 1 | 0 | 0 | 0 | |
| Grassland | 0 | 1 | 1 | 0 | 0 | 0 | |
| Water area | 1 | 1 | 1 | 1 | 1 | 0 | |
| Construction land | 1 | 1 | 1 | 1 | 1 | 0 | |
| Unutilized land | 1 | 1 | 1 | 1 | 1 | 0 | |
| Economic development scenario | Arable land | 1 | 1 | 1 | 1 | 1 | 0 |
| Forest | 1 | 1 | 1 | 1 | 1 | 0 | |
| Grassland | 1 | 1 | 1 | 1 | 1 | 0 | |
| Water area | 1 | 1 | 1 | 1 | 1 | 0 | |
| Construction land | 0 | 0 | 0 | 0 | 1 | 0 | |
| Unutilized land | 1 | 1 | 1 | 1 | 1 | 0 |
| Land Use Type | Habitat Suitability | Paddy Field | Dry Farmland | Urban Land | Rural Settlements | Other Construction | Unutilized Land |
|---|---|---|---|---|---|---|---|
| Arable land | 0.4 | 0 | 0 | 0.8 | 0.7 | 0.8 | 0.4 |
| Forest | 1 | 0.6 | 0.7 | 0.8 | 0.7 | 0.8 | 0.4 |
| Grassland | 0.6 | 0.7 | 0.6 | 0.8 | 0.7 | 0.7 | 0.6 |
| Water area | 0.8 | 0.5 | 0.3 | 0.4 | 0.3 | 0.2 | 0.1 |
| Construction area | 0 | 0 | 0 | 0.6 | 0.5 | 0 | 0 |
| Unutilized land | 0.4 | 0.4 | 0 | 0 | 0.1 | 0.1 | 0.2 |
| Threat Factors | Weight | Maximum Influence Distance | Decay Type |
|---|---|---|---|
| Paddy field | 0.8 | 5 | Linear |
| Dry farmland | 0.6 | 9 | Linear |
| Urban land | 0.8 | 6 | Exponential |
| Rural settlement | 0.7 | 2 | Exponential |
| Other construction | 0.7 | 1 | Exponential |
| Unutilized land | 0.5 | 6 | Linear |
| Land Use Type | Arable Land | Forest | Grassland | Water Area | Construction Land | Unutilized Land | Sum |
|---|---|---|---|---|---|---|---|
| 2000 | 70,021 | 3382 | 1079 | 12,971 | 14,356 | 57 | 101,866 |
| 2010 | 67,319 | 3364 | 964 | 13,278 | 16,895 | 46 | 101,866 |
| 2020 | 62,422 | 3042 | 726 | 14,183 | 21,342 | 151 | 101,866 |
| Land Use Type | Arable Land | Forest | Grassland | Water Area | Construction Land | Unutilized Land | Sum |
|---|---|---|---|---|---|---|---|
| Arable land | 54,471 | 640 | 102 | 2191 | 12,582 | 35 | 70,021 |
| Forest | 771 | 2118 | 33 | 66 | 359 | 35 | 3382 |
| Grassland | 232 | 25 | 380 | 331 | 107 | 4 | 1079 |
| Water area | 1669 | 76 | 174 | 10,305 | 688 | 59 | 12,971 |
| Construction land | 5239 | 177 | 37 | 1285 | 7605 | 13 | 14,356 |
| Unutilized land | 40 | 6 | 0 | 5 | 1 | 5 | 57 |
| Sum | 62,422 | 3042 | 726 | 14,183 | 21,342 | 151 | 101,866 |
| Land Use Type | Arable Land | Forest | Grassland | Water Area | Construction Land | Unutilized Land | Sum |
|---|---|---|---|---|---|---|---|
| Arable land | 55,223 | 134 | 99 | 1516 | 5450 | 0 | 62,422 |
| Forest | 224 | 2768 | 13 | 2 | 35 | 0 | 3042 |
| Grassland | 37 | 3 | 487 | 138 | 61 | 0 | 726 |
| Water area | 970 | 9 | 6 | 13,048 | 150 | 0 | 14,183 |
| Construction land | 3562 | 23 | 4 | 82 | 17,671 | 0 | 21,342 |
| Unutilized land | 0 | 0 | 0 | 0 | 0 | 151 | 151 |
| Sum | 60,016 | 2937 | 609 | 14,786 | 23,367 | 151 | 101,866 |
| Land Use Type | Arable Land | Forest | Grassland | Water Area | Construction Land | Unutilized Land | Sum |
|---|---|---|---|---|---|---|---|
| Arable land | 55,402 | 324 | 395 | 1584 | 4717 | 0 | 62,422 |
| Forest | 0 | 2988 | 54 | 0 | 0 | 0 | 3042 |
| Grassland | 0 | 6 | 720 | 0 | 0 | 0 | 726 |
| Water area | 982 | 11 | 4 | 13,053 | 133 | 0 | 14,183 |
| Construction land | 3700 | 27 | 3 | 88 | 17,524 | 0 | 21,342 |
| Unutilized land | 0 | 0 | 0 | 0 | 0 | 151 | 151 |
| Sum | 60,084 | 3356 | 1176 | 14,725 | 22,374 | 151 | 101,866 |
| Land Use Type | Arable Land | Forest | Grassland | Water Area | Construction Land | Unutilized Land | Sum |
|---|---|---|---|---|---|---|---|
| Arable land | 57,779 | 97 | 90 | 1127 | 3329 | 0 | 62,422 |
| Forest | 233 | 2767 | 11 | 4 | 27 | 0 | 3042 |
| Grassland | 44 | 3 | 536 | 114 | 29 | 0 | 726 |
| Water area | 1004 | 4 | 6 | 13,042 | 127 | 0 | 14,183 |
| Construction land | 0 | 0 | 0 | 0 | 21,342 | 0 | 21,342 |
| Unutilized land | 0 | 0 | 0 | 0 | 0 | 151 | 151 |
| Sum | 59,060 | 2871 | 643 | 14,287 | 24,854 | 151 | 101,866 |
| Synergistic Influencing Factors | Result |
|---|---|
| Ecosystem services∩slope | Bifactorial enhancement |
| Ecosystem services∩soil | Bifactorial enhancement |
| Ecosystem services∩population | Bifactorial enhancement |
| Ecosystem services∩GDP | Bifactorial enhancement |
| Ecosystem services∩slope | Bifactorial enhancement |
| Ecosystem services∩topography | Nonlinear enhancement |
| Slope∩soil | Bifactorial enhancement |
| Slope∩population | Bifactorial enhancement |
| Slope∩GDP | Bifactorial enhancement |
| Slope∩aspect | Bifactorial enhancement |
| Slope∩topography | Bifactorial enhancement |
| Soil∩population | Nonlinear enhancement |
| Soil∩GDP | Bifactorial enhancement |
| Soil∩aspect | Bifactorial enhancement |
| Soil∩topography | Nonlinear enhancement |
| Population∩GDP | Bifactorial enhancement |
| Population∩aspect | Bifactorial enhancement |
| Population∩topography | Nonlinear enhancement |
| GDP∩aspect | Nonlinear enhancement |
| GDP∩topography | Bifactorial enhancement |
| Aspect∩topography | Bifactorial enhancement |
| Ecosystem Services | Slope | Soil | Population | GDP | Aspect | Topography | |
|---|---|---|---|---|---|---|---|
| Ecosystem services | 0.662377 | ||||||
| Slope | 0.663463 | 0.093827 | |||||
| Soil | 0.700596 | 0.097915 | 0.095353 | ||||
| Population | 0.700596 | 0.097915 | 0.097517 | 0.095353 | |||
| GDP | 0.994496 | 0.991437 | 0.994494 | 0.994494 | 0.991417 | ||
| Aspect | 0.6632 | 0.004028 | 0.098883 | 0.098883 | 0.991437 | 0.001586 | |
| Topography | 0.667008 | 0.003575 | 0.104837 | 0.104837 | 0.991437 | 0.005313 | 0.001154 |
Disclaimer/Publisher’s Note: The statements, opinions and data contained in all publications are solely those of the individual author(s) and contributor(s) and not of MDPI and/or the editor(s). MDPI and/or the editor(s) disclaim responsibility for any injury to people or property resulting from any ideas, methods, instructions or products referred to in the content. |
© 2024 by the authors. Licensee MDPI, Basel, Switzerland. This article is an open access article distributed under the terms and conditions of the Creative Commons Attribution (CC BY) license (https://creativecommons.org/licenses/by/4.0/).
Share and Cite
Shi, G.; Chen, C.; Cao, Q.; Zhang, J.; Xu, J.; Chen, Y.; Wang, Y.; Liu, J. Spatiotemporal Dynamics and Prediction of Habitat Quality Based on Land Use and Cover Change in Jiangsu, China. Remote Sens. 2024, 16, 4158. https://doi.org/10.3390/rs16224158
Shi G, Chen C, Cao Q, Zhang J, Xu J, Chen Y, Wang Y, Liu J. Spatiotemporal Dynamics and Prediction of Habitat Quality Based on Land Use and Cover Change in Jiangsu, China. Remote Sensing. 2024; 16(22):4158. https://doi.org/10.3390/rs16224158
Chicago/Turabian StyleShi, Ge, Chuang Chen, Qingci Cao, Jingran Zhang, Jinghai Xu, Yu Chen, Yutong Wang, and Jiahang Liu. 2024. "Spatiotemporal Dynamics and Prediction of Habitat Quality Based on Land Use and Cover Change in Jiangsu, China" Remote Sensing 16, no. 22: 4158. https://doi.org/10.3390/rs16224158
APA StyleShi, G., Chen, C., Cao, Q., Zhang, J., Xu, J., Chen, Y., Wang, Y., & Liu, J. (2024). Spatiotemporal Dynamics and Prediction of Habitat Quality Based on Land Use and Cover Change in Jiangsu, China. Remote Sensing, 16(22), 4158. https://doi.org/10.3390/rs16224158