1. Introduction
The ultimate goal of Water Distribution Network (WDN) management is to provide consumers with a safe, reliable, and sustainable water supply. However, the existing WDNs face problems such as supply shortages, water quality degradation, increased energy consumption, climate change, and aging facilities. A modern water supply system is required to reduce the current water problem; however, upgrading the existing WDNs is costly and time consuming. Therefore, improving the existing WDNs with smart components such as sensors, networks and an integrated operations center allows water utility companies to monitor and control the water supply in real time, which is a more cost-effective and sustainable approach [
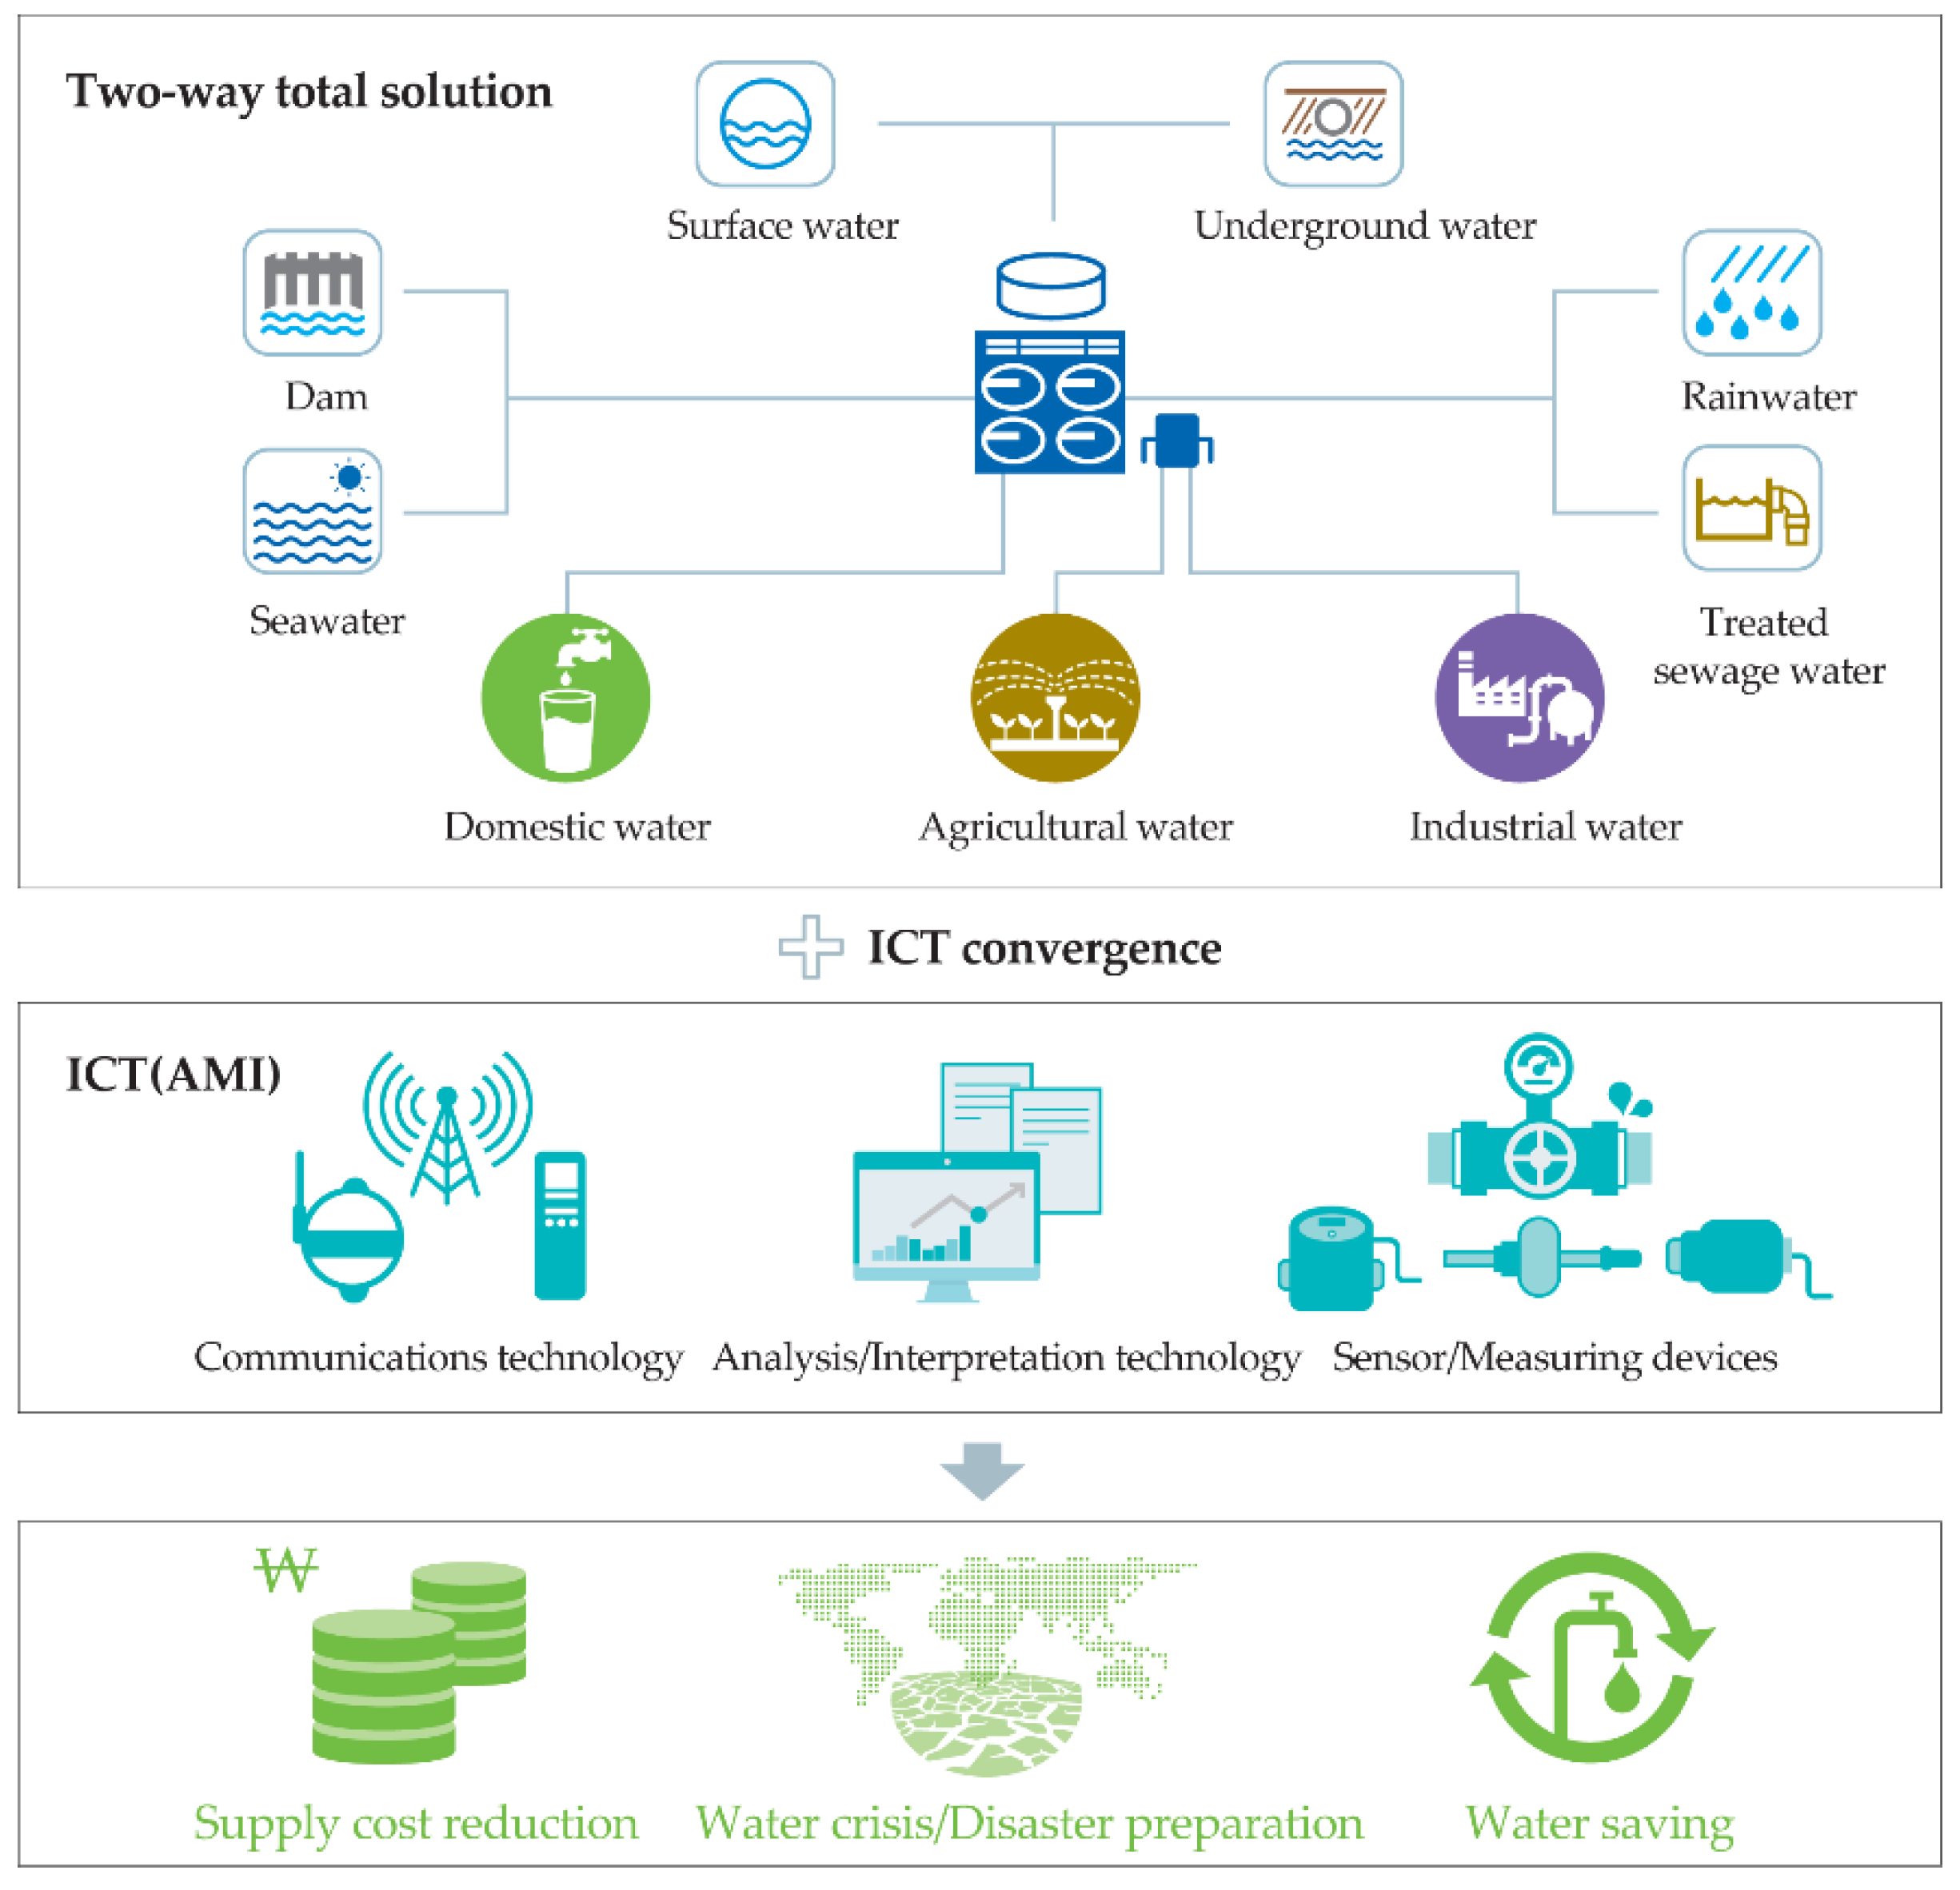
1]. A Smart Water Grid (SWG) is capable of reducing water problems without compromising water sustainability, enhancing the efficiency of WDNs through the integration of Information and Communications Technology (ICT) and a conventional water management system. In other words, with an SWG, the incorporation of ICT enables real-time monitoring, the measurement and modeling of water consumption, and reliable water management information, which can be reflected in the related decision making [
2]. In particular, an SWG resolves the problem of uncertainties in the existing human inspection method and facilitates a demand analysis through a real-time trend of water consumption, thereby supporting the understanding of water consumption characteristics of consumers [
3]. In addition, in the event of an incident (e.g., leakage or a malfunctioning meter) in the water pipeline network, an SWG improves management efficiency, reduces maintenance costs through fast responses and enables an effective pressure management of the water pipeline network. In addition, water consumption data collected in real time can be used to encourage water savings for consumers, and the deviation between real water consumption and billed usage can be improved [
4].
Despite these advantages, the reason for the low penetration rate of SWGs has been the high initial installation cost, but they are currently regaining their momentum owing to the rapid development of the low-cost, high-efficiency Internet of Things (IoT) technology [
5]. Accordingly, research on the application of an SWG has been underway worldwide. In particular, Singapore, Australia, the European Union (EU), the United States (US), and South Korea have taken the lead in implementing smart water management by incorporating SWG technology.
Singapore is a representative example of a country with a water shortage, importing 40% of water from Malaysia. Therefore, the country developed the SWG Roadmap, led by the government, to secure stable water resources and water supply, and international joint research has been carried out. In particular, since 2013, 346 sensor stations have been built and operated in Singapore by linking the WaterWiSe platform with the SCADA system of the Public Utilities Board (PUB) [
6]. WaterWiSe conducts real-time monitoring of the water quality, such as the pH, conductivity, and turbidity of the water supply and pressure to support decision-making in the management and operation of a WDN. As a result of the test-bed operation, water pressure management has been achieved through a post-event analysis of the water main.
Australia has been implementing the South East Queensland (SEQ) water grid project since 2008 to tackle the problems of extreme drought. A bulk water supply network connecting all of the 12 dams, 36 water treatment plants, three purified recycled water treatment plants, one desalination plant, 28 reservoirs, 22 pumping stations, and 600 km of pipelines were constructed to ensure the stability of the water supply [
7].
The EU carried out its ICT Solutions for Efficient Water Management (ICeWater) project and the Water Innovation through Dissemination Exploitation of Smart Technologies (WIDEST) project supported by the European Commission. These projects are aimed at improving the energy efficiency of urban WDNs through real-time water consumption monitoring and reducing water loss by developing leak detection technologies for pipelines [
8]. In particular, testbeds were built in Milano, Italy and in Timisoara, Romania, and research applying AMI network was conducted.
To supply freshwater to the western states of the US, including the Colorado River Basin and areas with water shortages from drought, a water supply plan using large rivers in the Midwest, such as the Mississippi River, which experiences severe flood damage, was established through the National Smart Water Grid (NSWG) project [
9].
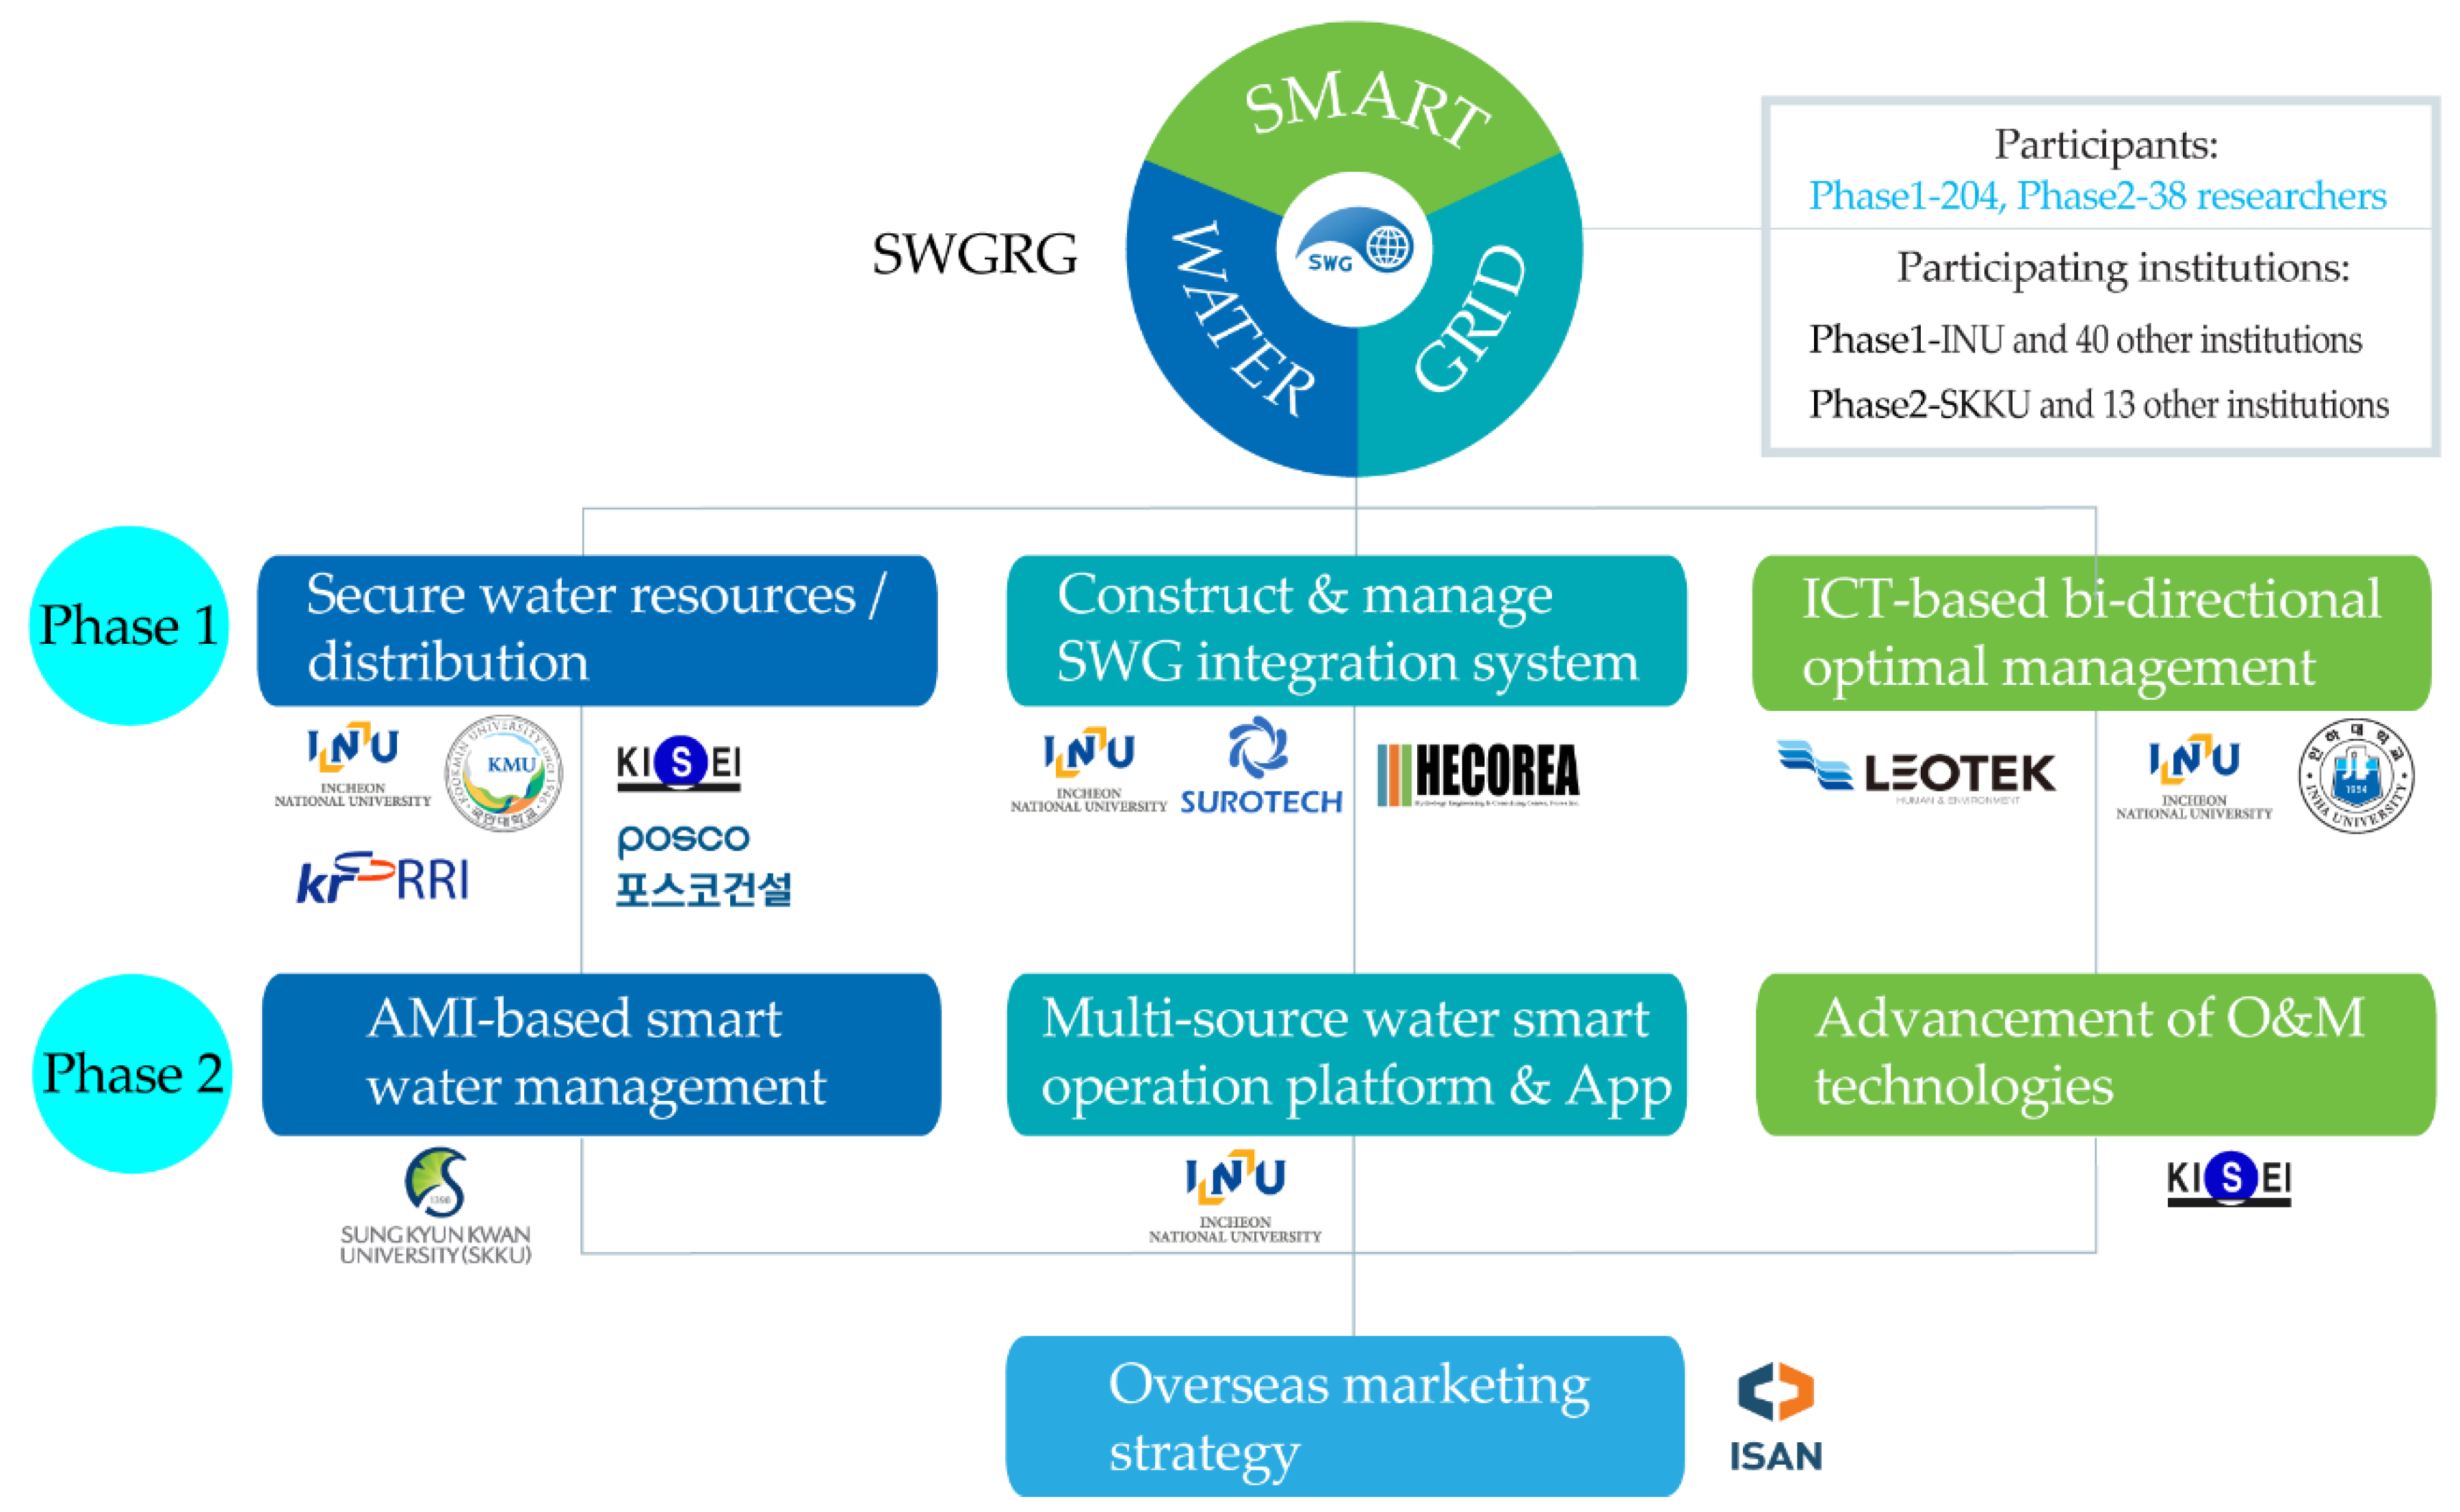
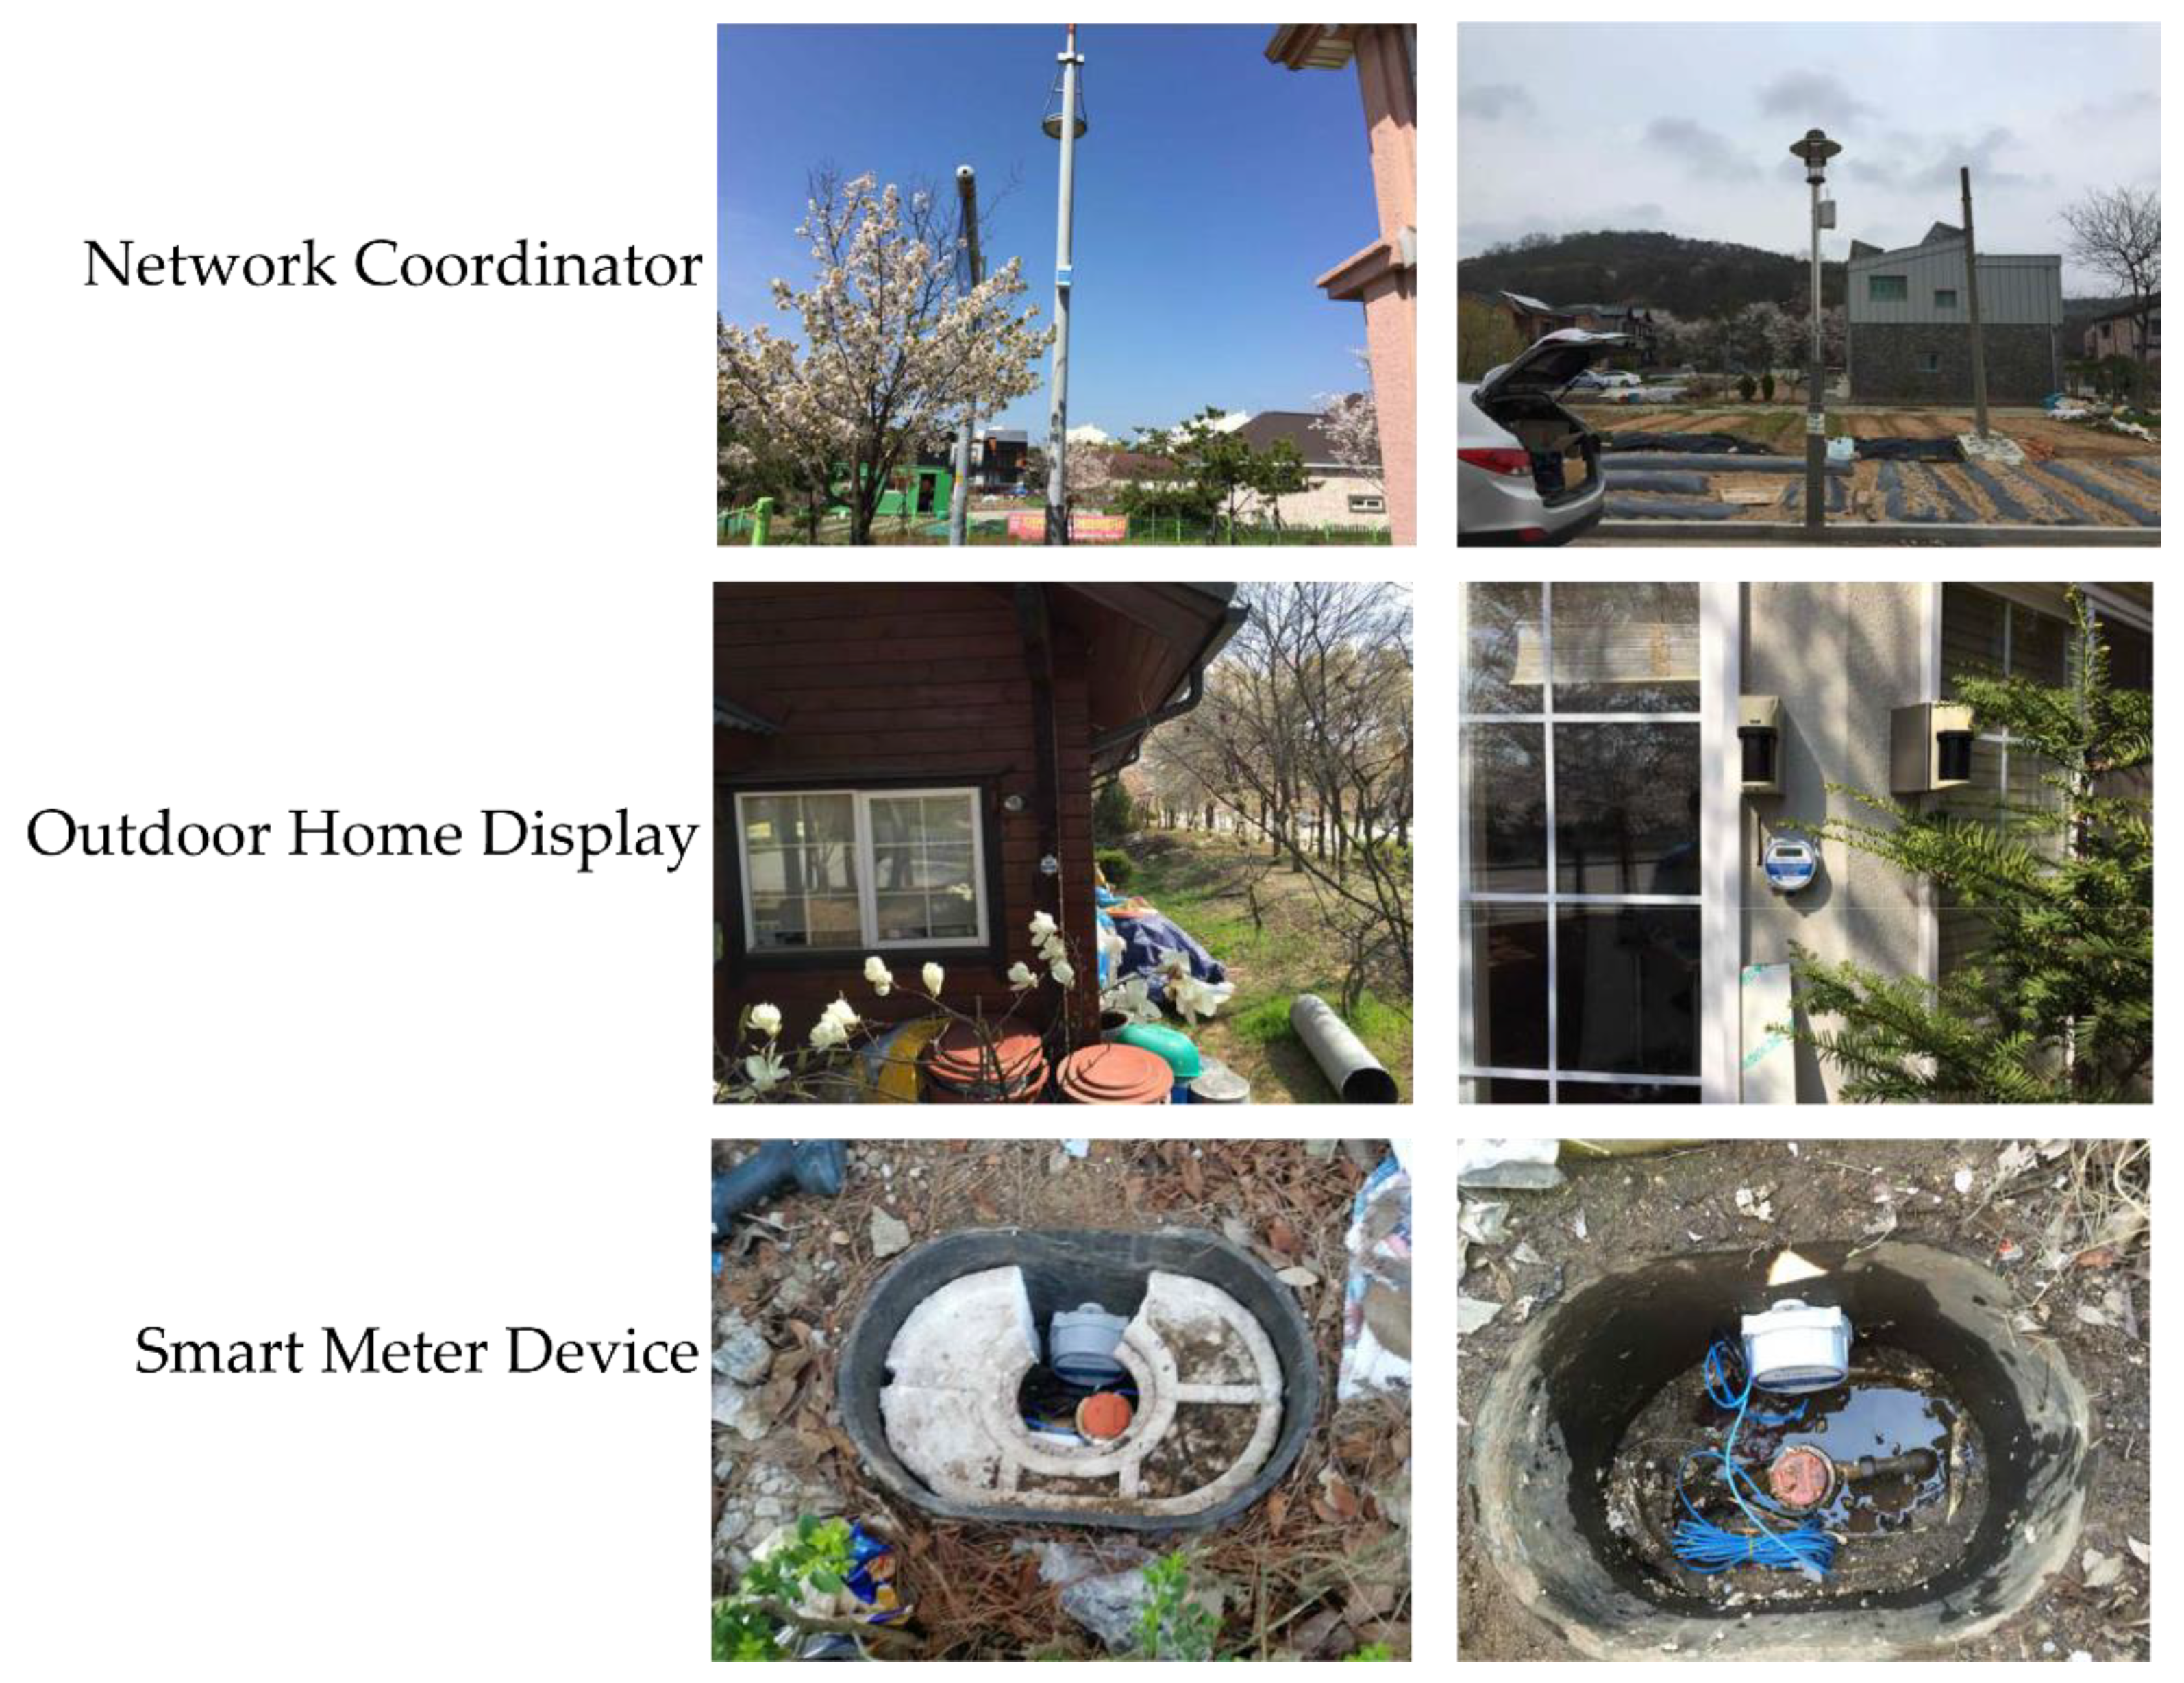
In South Korea, for the implementation of SWG technology, the country is taking pioneering steps to build a hyper-connected smart city by carrying out a local water supply modernization project and constructing and operating a water industry cluster. To this end, the Smart Water Grid Research Group (SWGRG) was launched in 2012 to build an intelligent water management system using alternative water resources with the aim of reducing water and energy consumption. With the convergence of ICT and water resource management technologies, the core technologies for an SWG with intelligent microgrids were developed and field operation and tests were conducted in a SWG living lab [
10].
As above, SWG is being actively conducted worldwide. However, there are few cases of developing detailed element technologies and operation solutions through the operation of living labs. Therefore, this study introduces the development of detailed element technologies for SWG management and an operation solution for South Korea through a field operation and tests in a living lab. We would also like to show examples of what issues there are in living lab operations.
4. Operation Solution
SWGRG has developed an operation process from AMI data to integrated operation solution development as a preliminary task for developing the field operation solution of a living lab (
Figure 10). The statistical analysis of the AMI data collected in real time provides water consumption data through an analysis of the cause of outliers in the water consumption data, receiving rate, pre-processing, usage, pipe diameter, day of the week, and region. With real-time water consumption data as input, statistical methods and Machine Learning (ML) techniques are applied to forecast future water demand. A real-time water pipeline network analysis enables proper water pressure management using Geo-graphical Information Systems (GIS) and the EPANET engine (United States Environmental Protection Agency), and an optimal operation of distributing reservoir is possible by identifying households where water supply has been stopped in case of an incident such as a leak. For decision making support, the optimal water supply for each water source must be determined according to calculations of the available quantity based on demand. Water supply management when considering the available amount of water calculated by applying GIS, and pump scheduling optimization through an analysis of the distributing reservoir supply, can provide a support in the decision making. With the design of the SWG integrated operation solution UI and connection with real-time measurement data, feedback is received through actual operation, and the problems are corrected or improved accordingly.
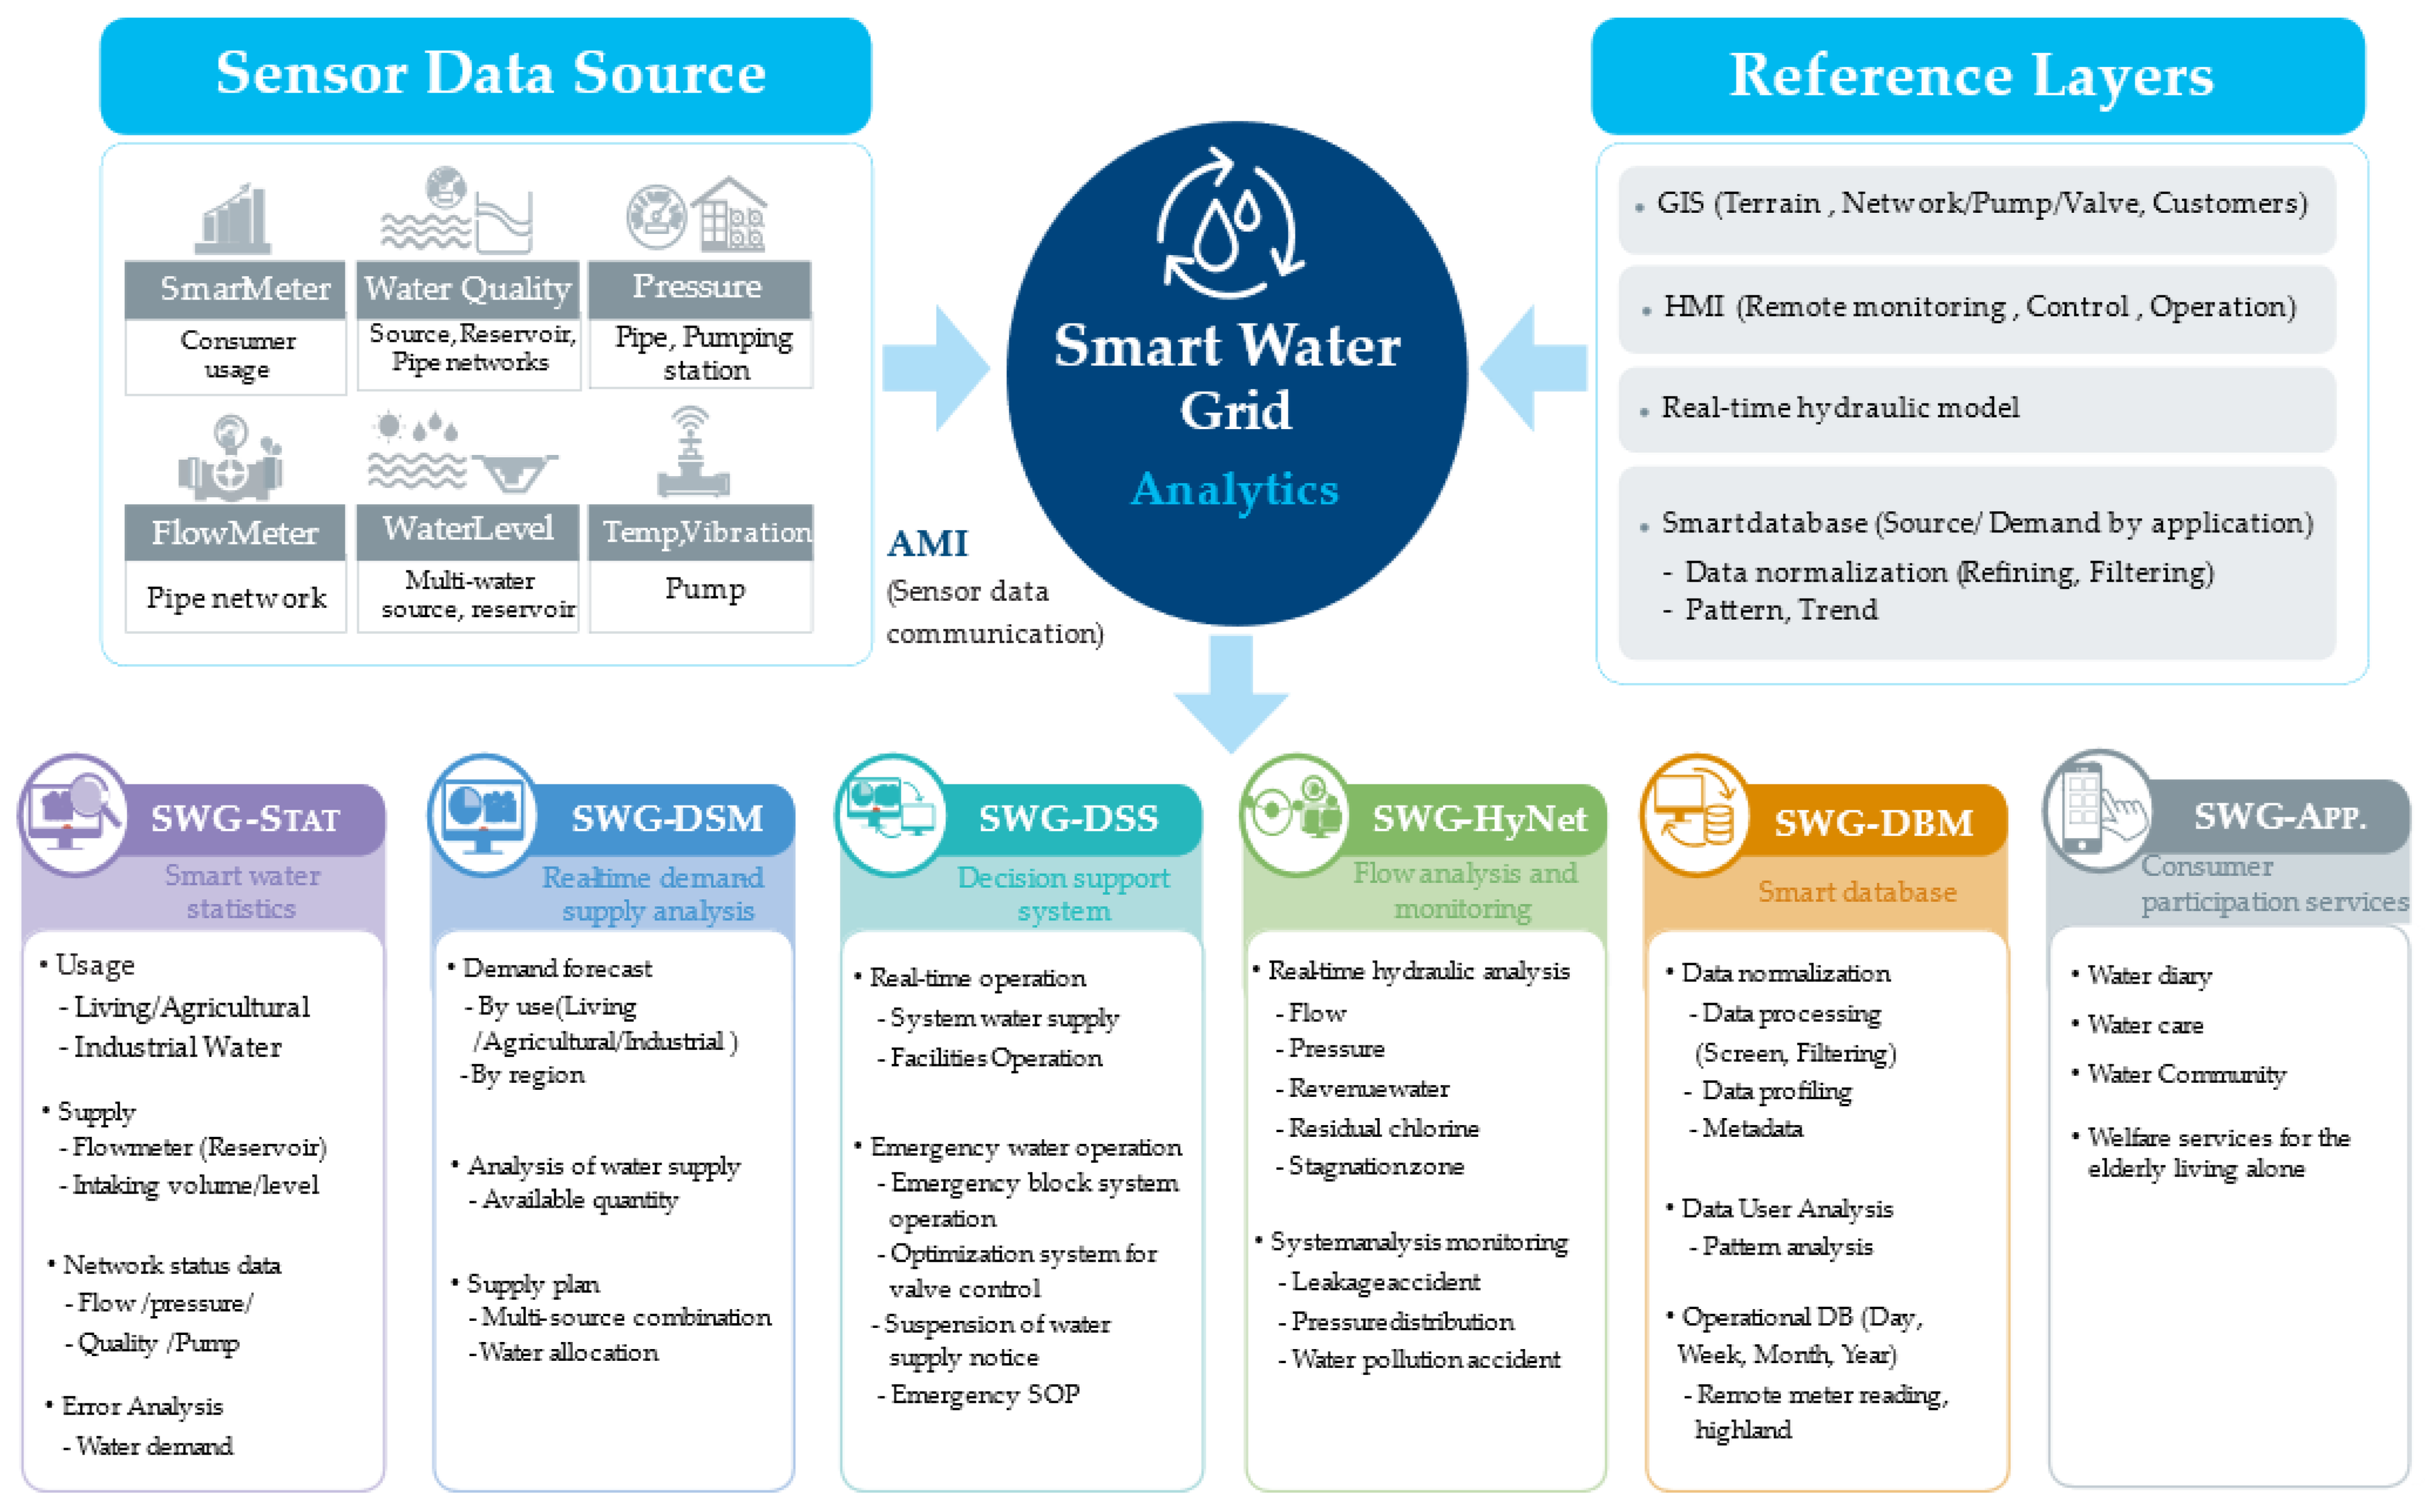
The result finally obtained from the field operation of the SWG living lab is the SWG integrated operation solution, called a Smart Water Management Integrated Solution. The solution is composed of six main functions that link the AMI sensor data and the reference layer (GIS, HMI, real-time hydraulic modeling, smart DB). The six functions for achieving proper water management are the smart water statistics information (SWG-STAT), real-time demand-supply analysis (SWG-DSM), decision support system (SWG-DSS), real-time hydraulic pipeline network analysis (SWG-HyNet), smart DB management (SWG-DBM), and water information mobile application (SWG-App.) (
Figure 11).
4.1. SWG-STAT
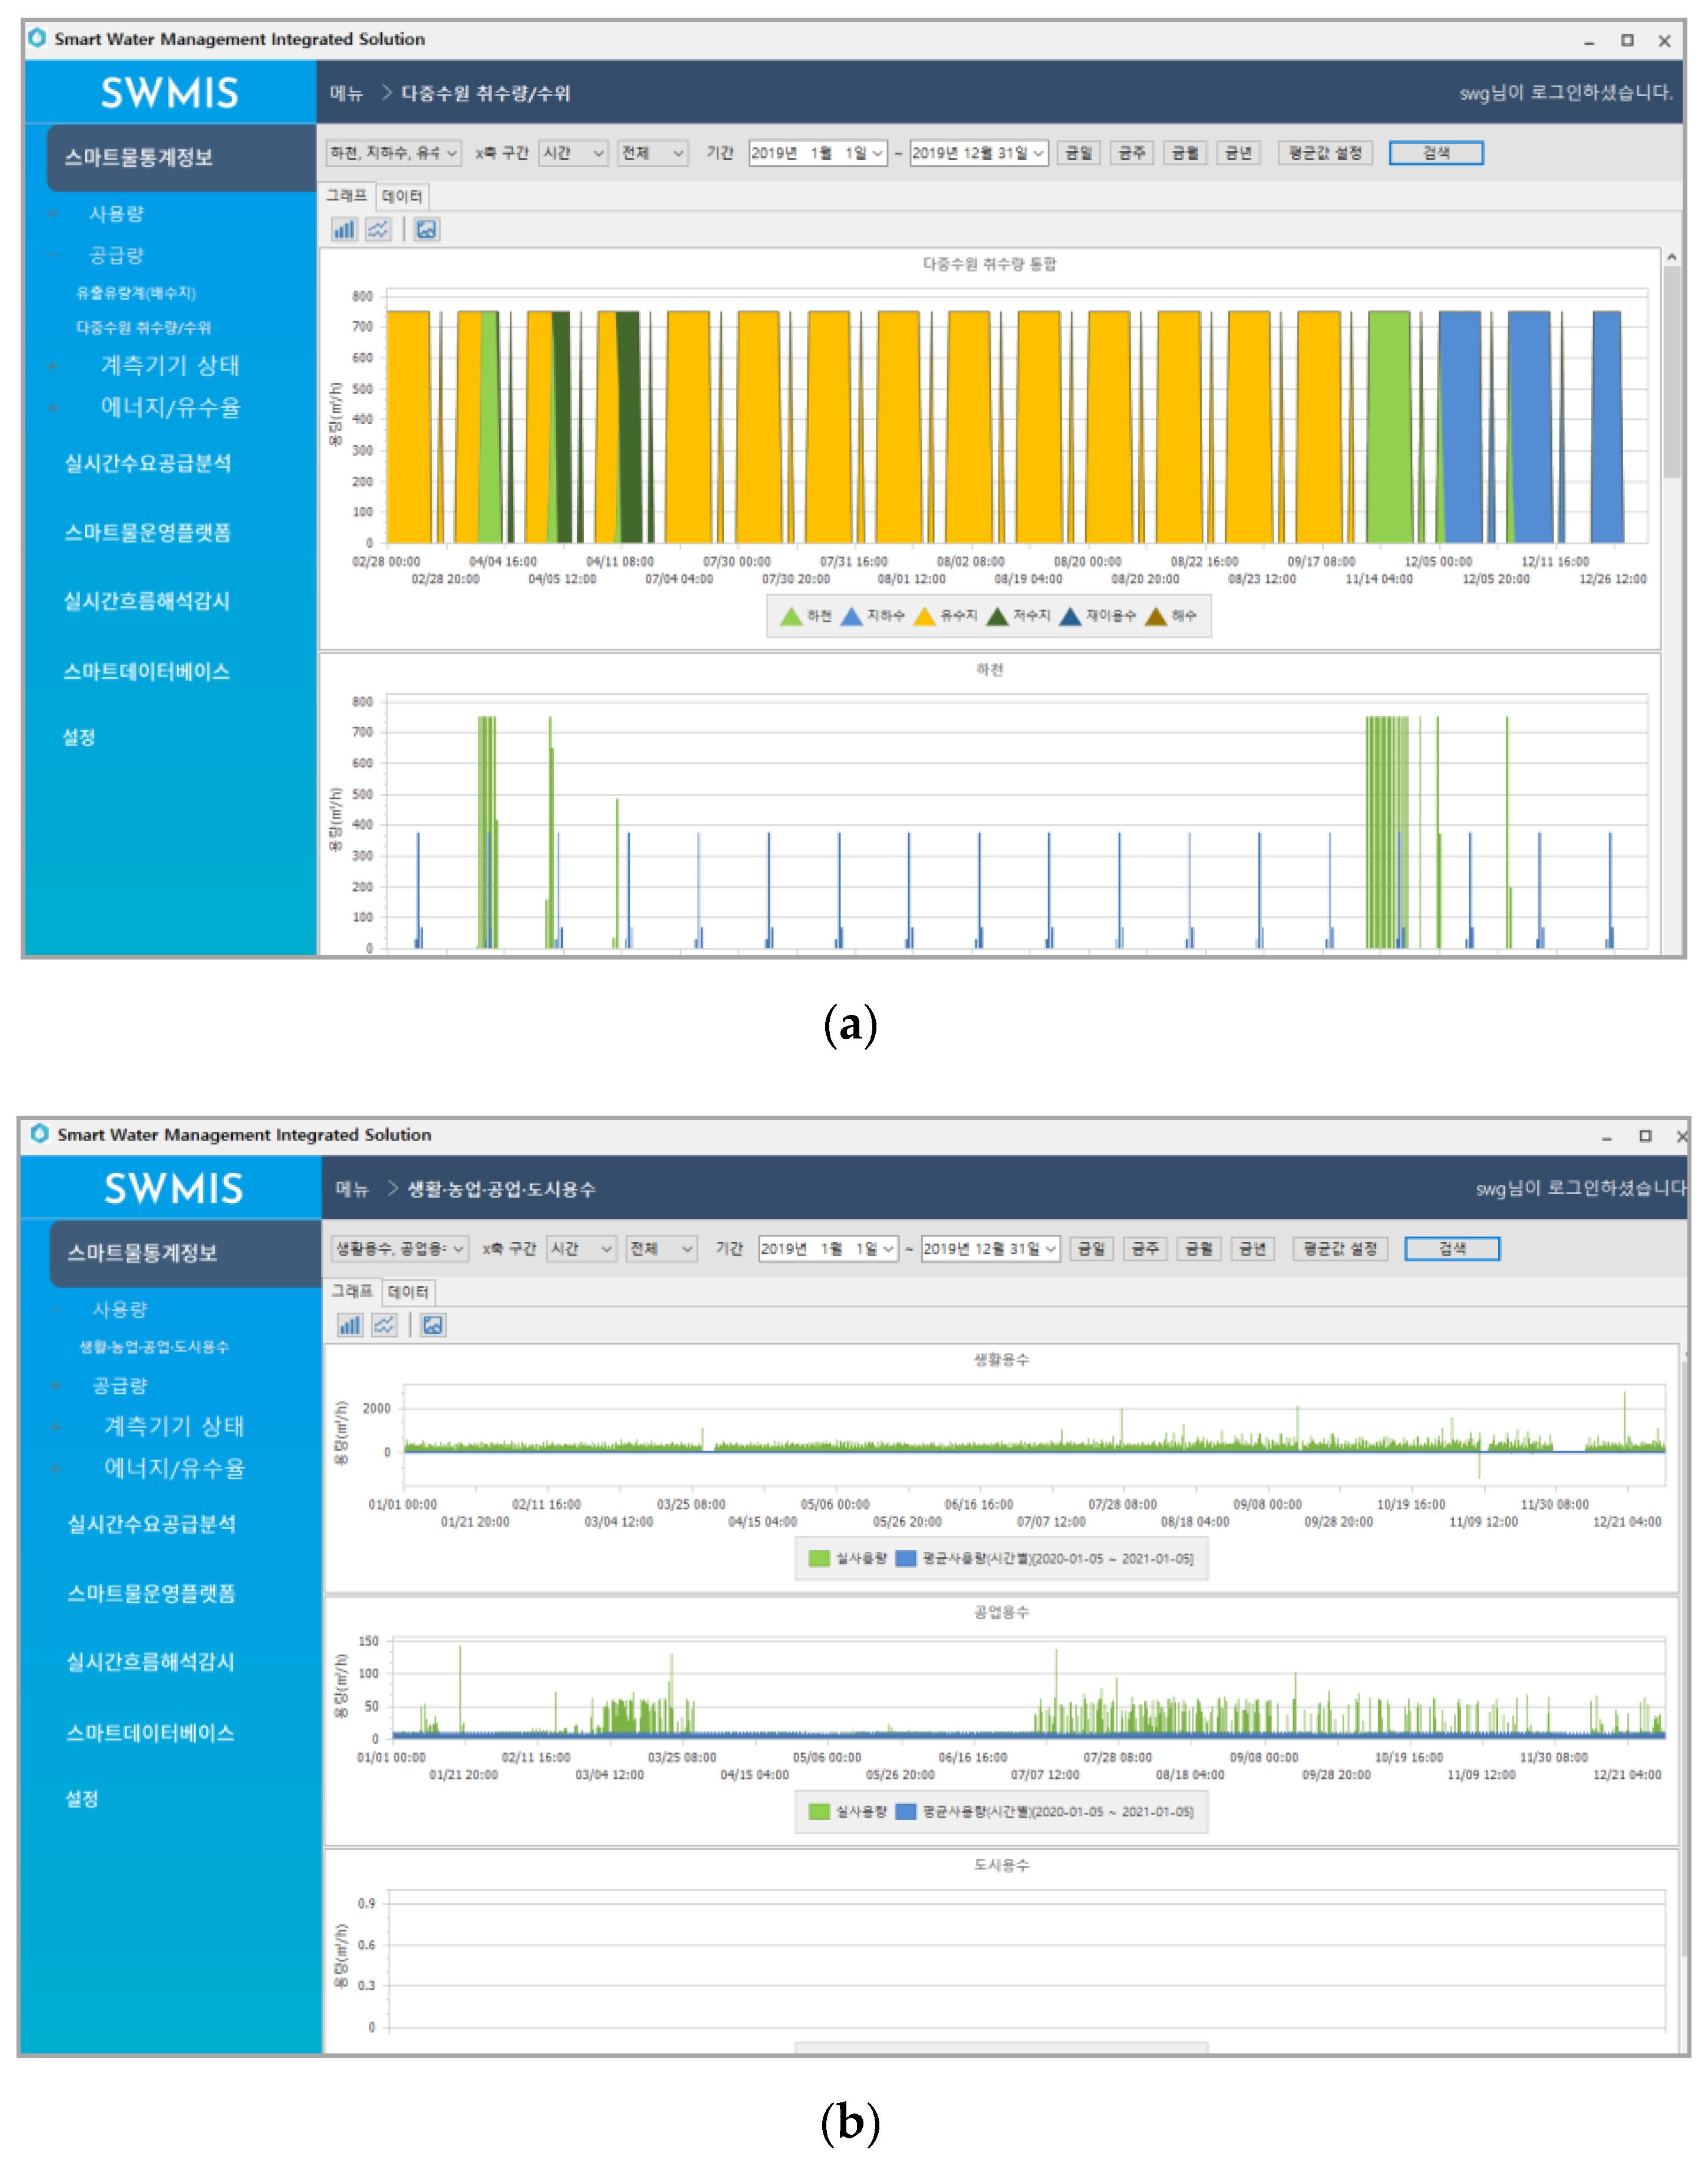
With smart water statistics information, real-time measurement data from AMI sensors installed at a water intake plant, a water filtration plant, a distributing reservoir, and at the locations of the end-users can be retrieved and viewed with ease (
Figure 12). In addition, hourly, daily, monthly, and a specified period of information on water consumption and water supply by use (domestic, agricultural, and industrial), the status of measuring instruments, the energy consumed, and the revenue water ratio are provided. In particular, as shown in
Figure 12, it is possible to check in real-time water withdrawal based on the source (stream, underground water, retarding basin, reservoir, sewage reuse water, and seawater) and water level, and the real water consumption based on use and average consumption. AMI data include outliers (missing data, incorrect measurement data) according to sensor abnormalities or communication errors, and these missing and erroneous data are corrected by applying a pre-processing technique [
15] of big data combining a lagged k-nearest neighbor (k-NN) with fast Fourier transform.
4.2. SWG-DSM
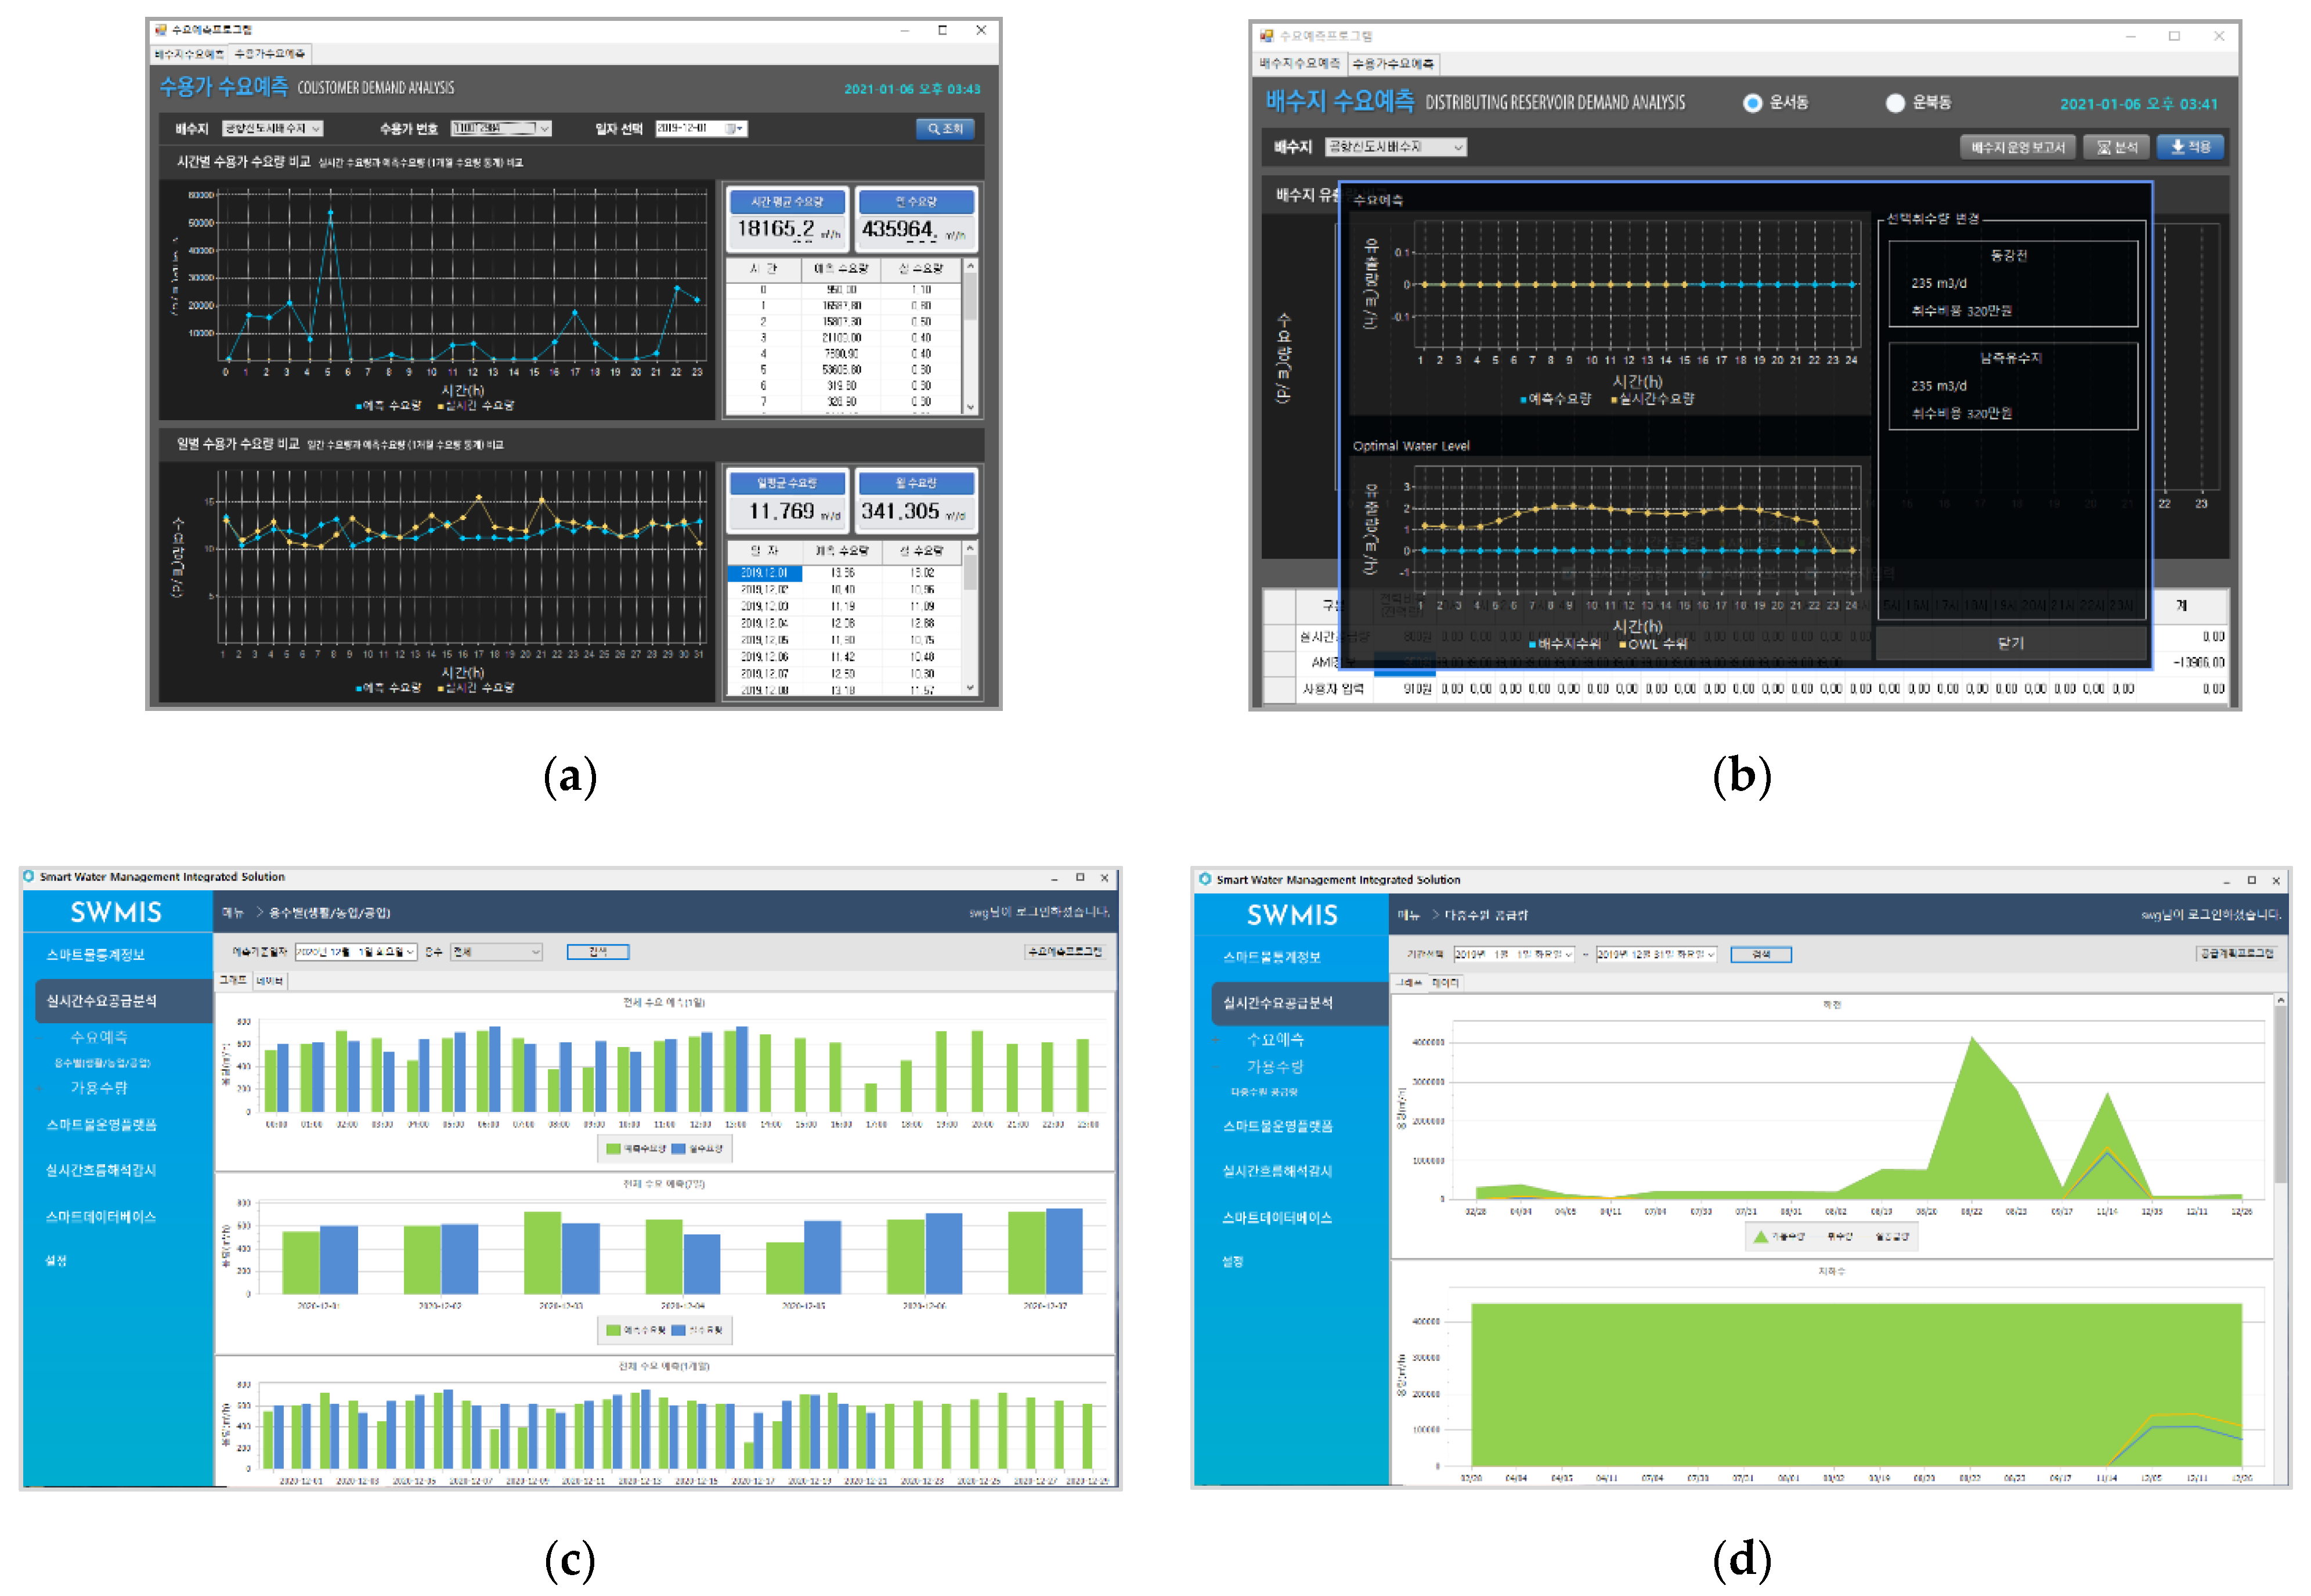
In a real-time supply–demand analysis, a water distribution and supply plan can be established through the analysis of a multi-source water supply according to the forecasted water demand by use and region. The water demand of end-users can be forecast in real time by combining the statistical seasonal autoregressive integrated moving average method [
16] and machine learning k-NN [
17]. The results are provided on a daily, weekly, and monthly basis and a comparative analysis between the forecasted water demand and real water demand is possible. As shown in
Figure 13, the results of the demand forecast consist of demand at end-use, the distributing reservoir demand, and demand by use. Using these results, the available quantity, water withdrawal, and real water supply of multiple sources can be analyzed. The combination of selective water withdrawal of multiple sources uses the cost function for calculating the lowest supply cost, and the optimal solution is found using the Harmony search optimizer [
18].
4.3. SWG-DSS
With the decision support system, the WDN operator monitors the operation status on regular days for integrated water management, and in the event of an emergency, such as a water supply shut-off, multi-source pollutant inflow, or drought, the system supports prompt decision making on the water distribution, supply, and shut-off [
19]. On regular days, the available number of multiple sources, water inflow, distributing reservoir water level, and BOD water quality are monitored (
Figure 14), and when an emergency situation arises, the operator can respond according to the scenario by displaying the emergency screen, and the consumer can be informed of the emergency through an SNS alert.
4.4. SWG-HyNet
A real-time hydraulic pipeline network analysis consists of an interface visualized through GIS and hydraulic modeling using the EPANET engine. The water pipeline network is composed of nodes (including end-users), pipes, distributing reservoirs, valves, and pumps. The EPANET engine can conduct a simulation of the flow rate of each node and pipe, water pressure, water quality behavior, and residence time [
20]. As shown in
Figure 15, when demand-driven modeling is performed with the forecast water demand of each end-use in SWG-DSM as input data, the hydraulic pressure distribution can be determined for the points of interest in the block. Identifying the leak location is difficult with the existing WDNs, but SWG-HyNet easily locates the points at which the measured pressure is significantly lower than the simulated pressure, facilitating a localization of the leakage points. To maintain the optimal water pressure in the water pipeline network, it can also support the operation of valves and pumps.
4.5. SWG-DBM
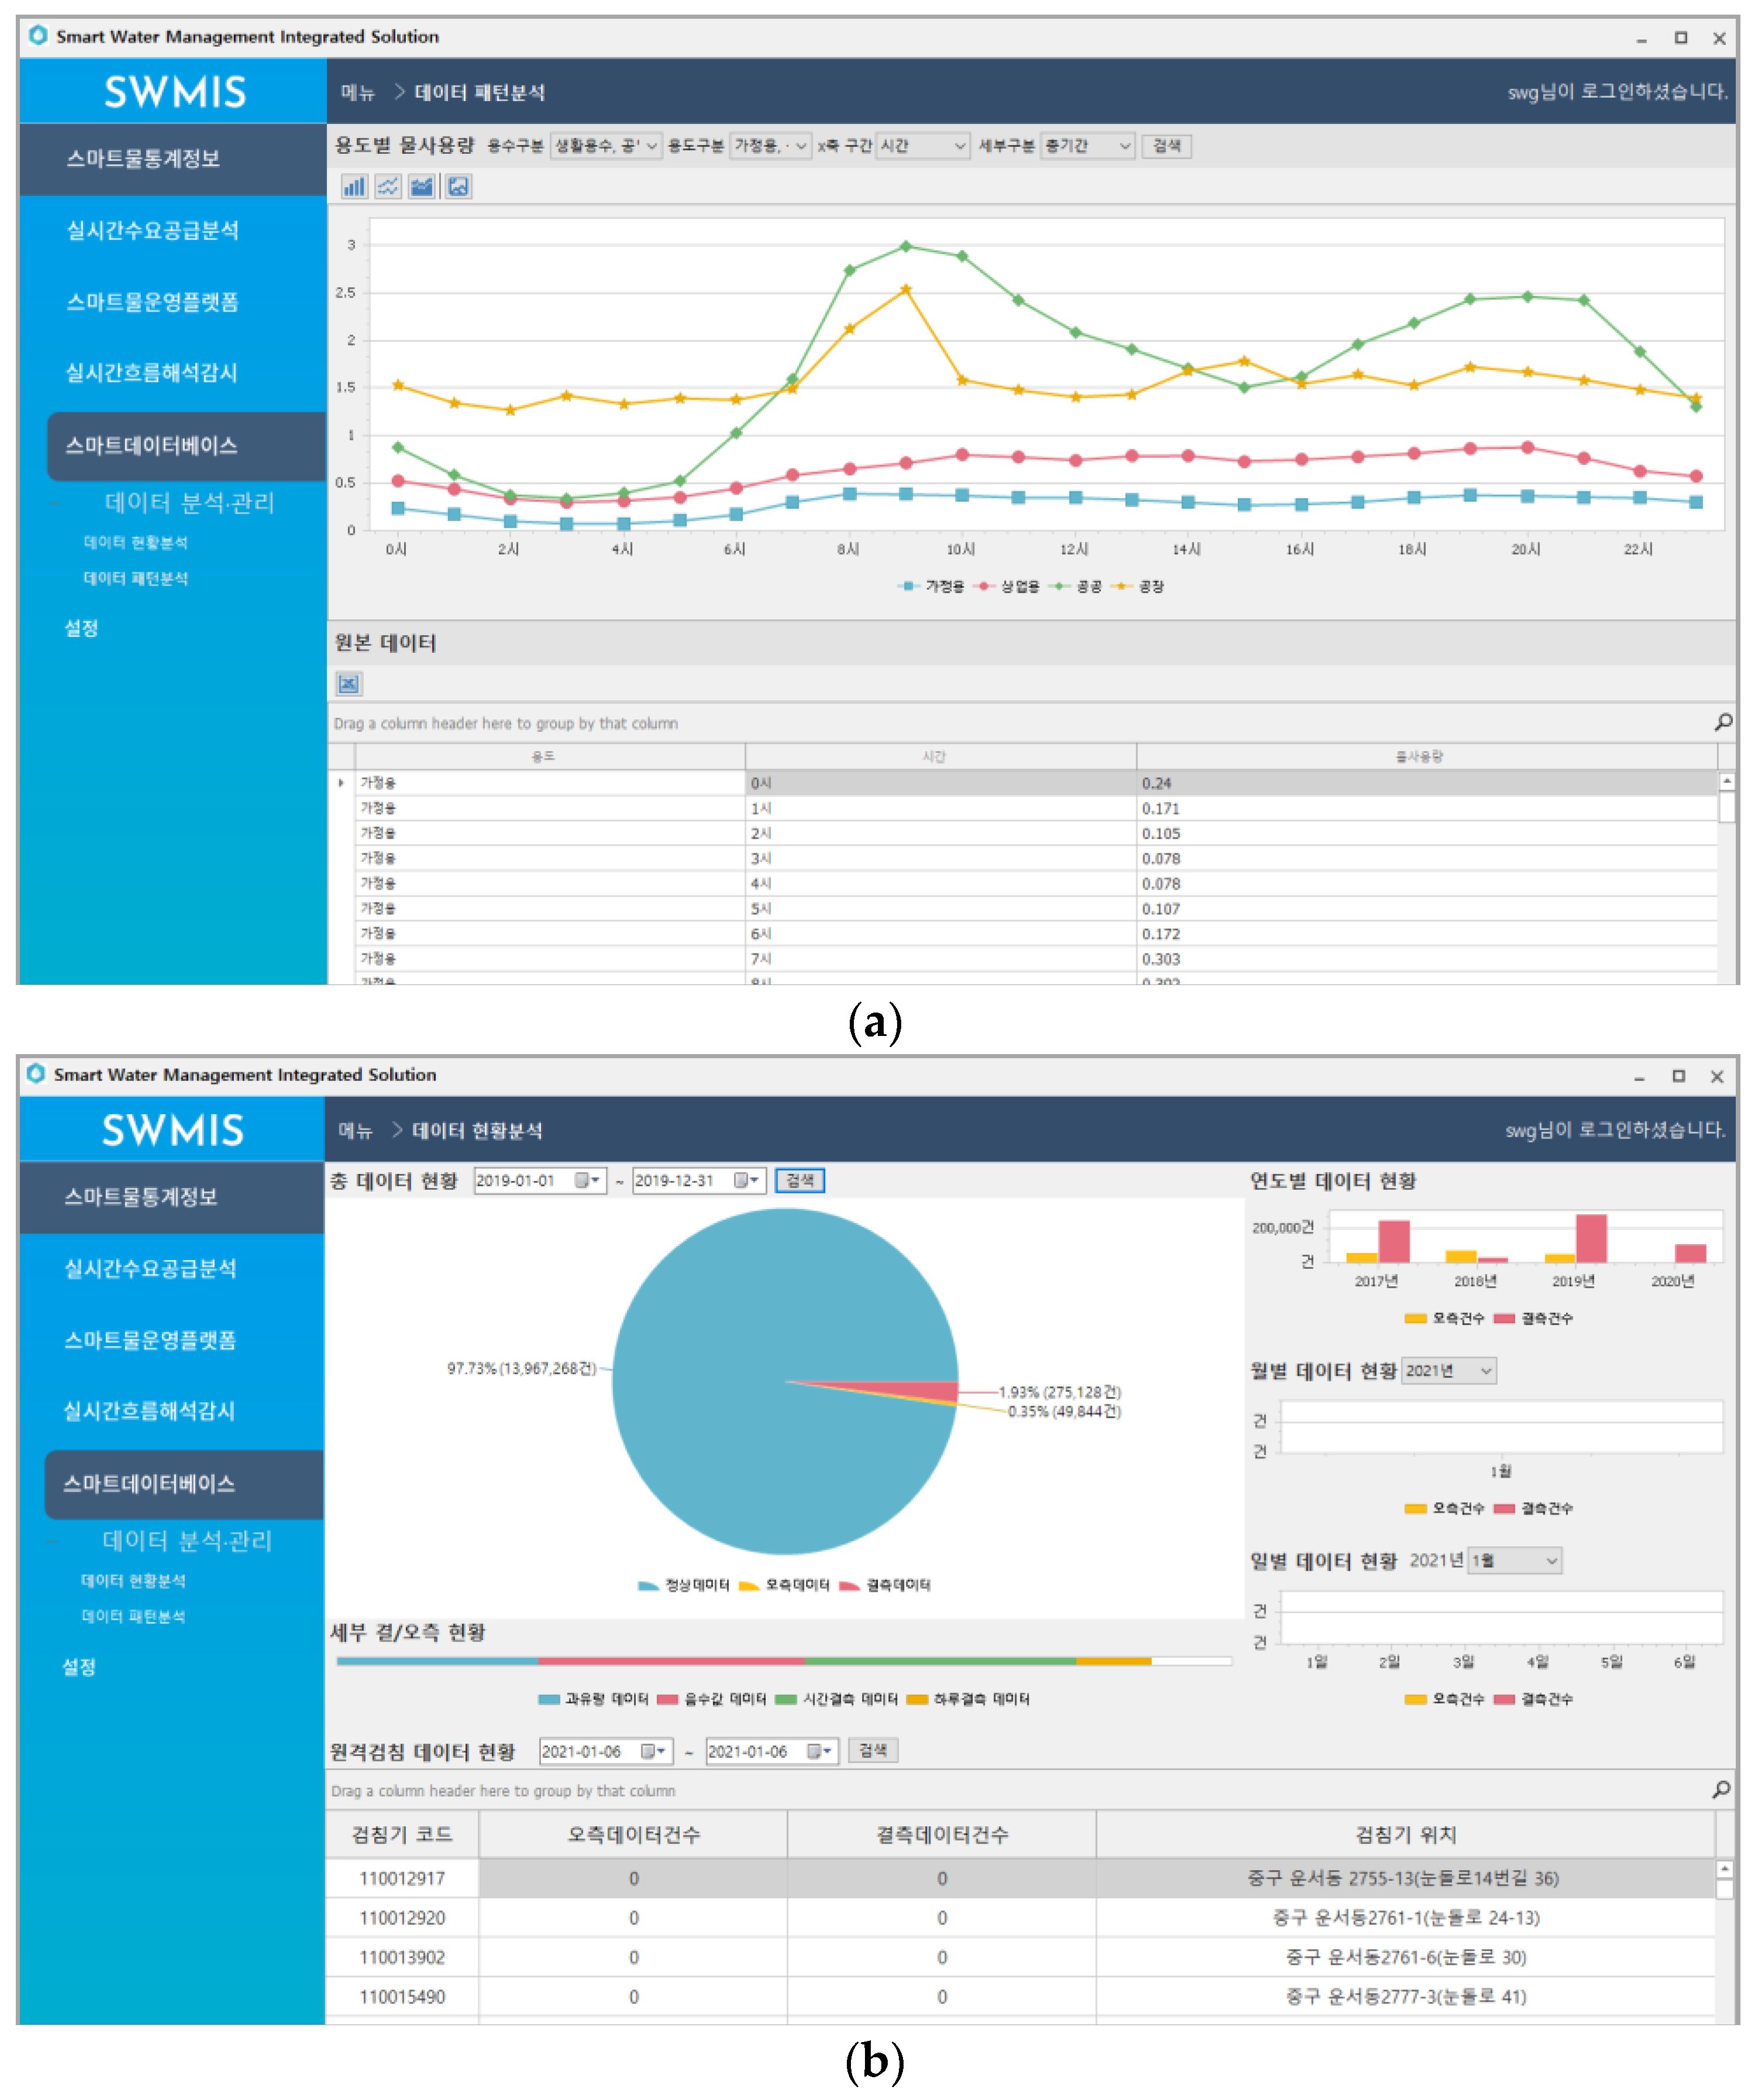
Smart DB management promotes the efficiency of SWG operation and management by creating daily, weekly, monthly, and yearly metadata of the input/output data of the integrated operation DB. In particular, using remote inspection water consumption data, there are functions for analyzing the water consumption patterns for each use and sending bills to consumers (
Figure 16).
4.6. SWG-App
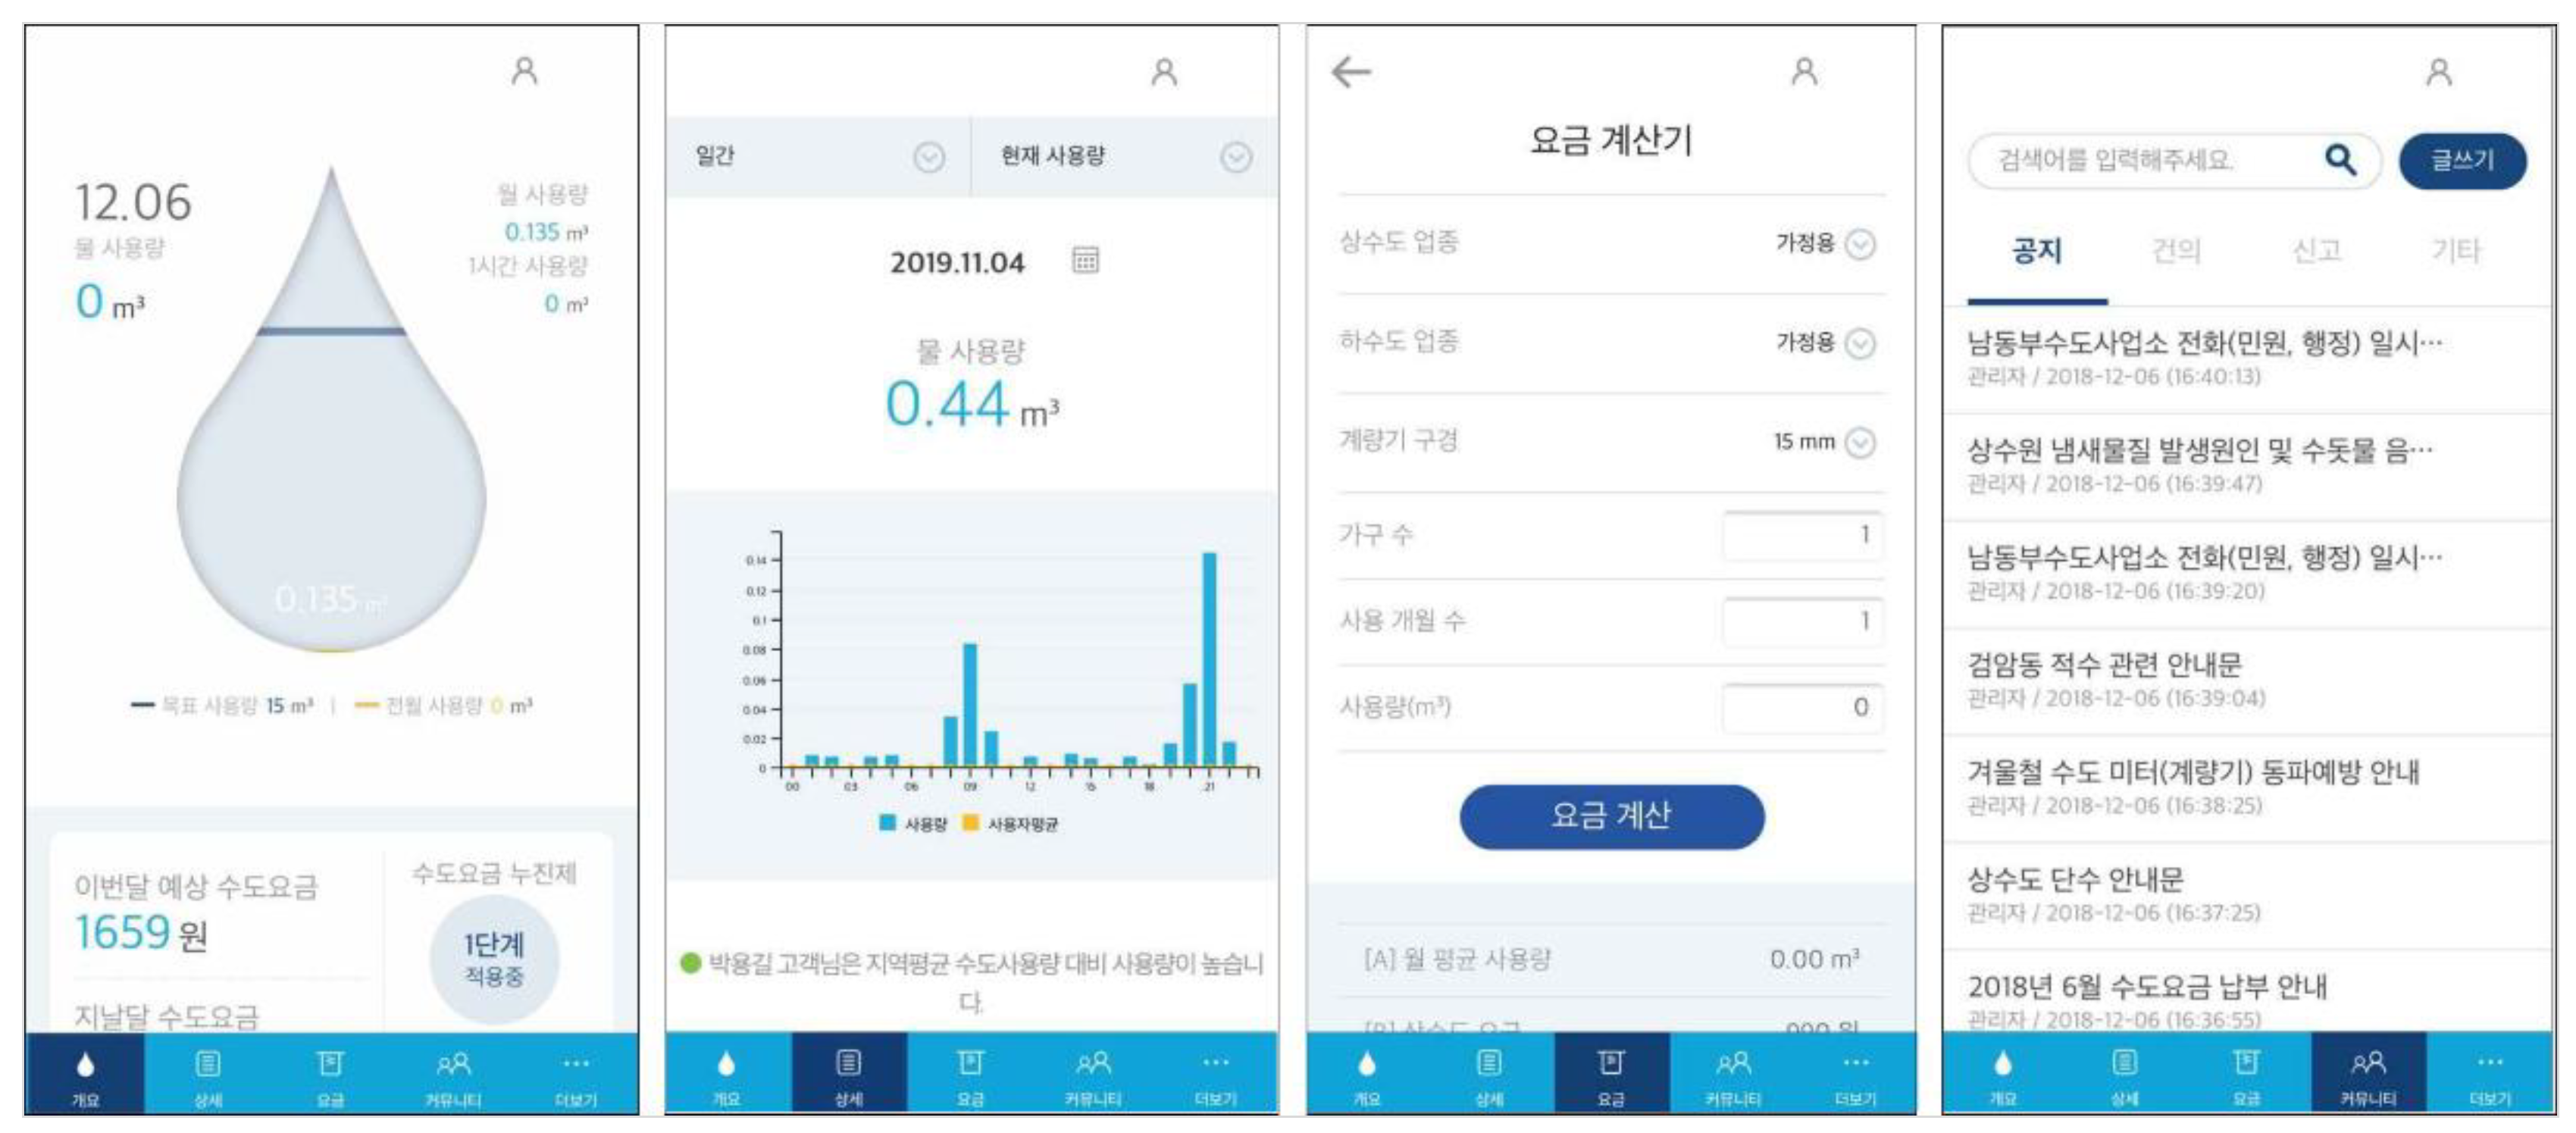
The water information mobile app has the following functions developed: retrieval and viewing of consumer water consumption information in real time or within a specific period (day, week, month, or year), information on progressive rate of water utility and real-time water rate, welfare services for the socially vulnerable such as the elderly living alone or those without family or friends, and a community function for bi-directional communication and sharing of water information between water utility companies and consumers (
Figure 17). Water utility companies can collect consumer opinions and quickly respond to incidents such as pipeline damage or freezing/bursting.
5. Discussions and Perspectives
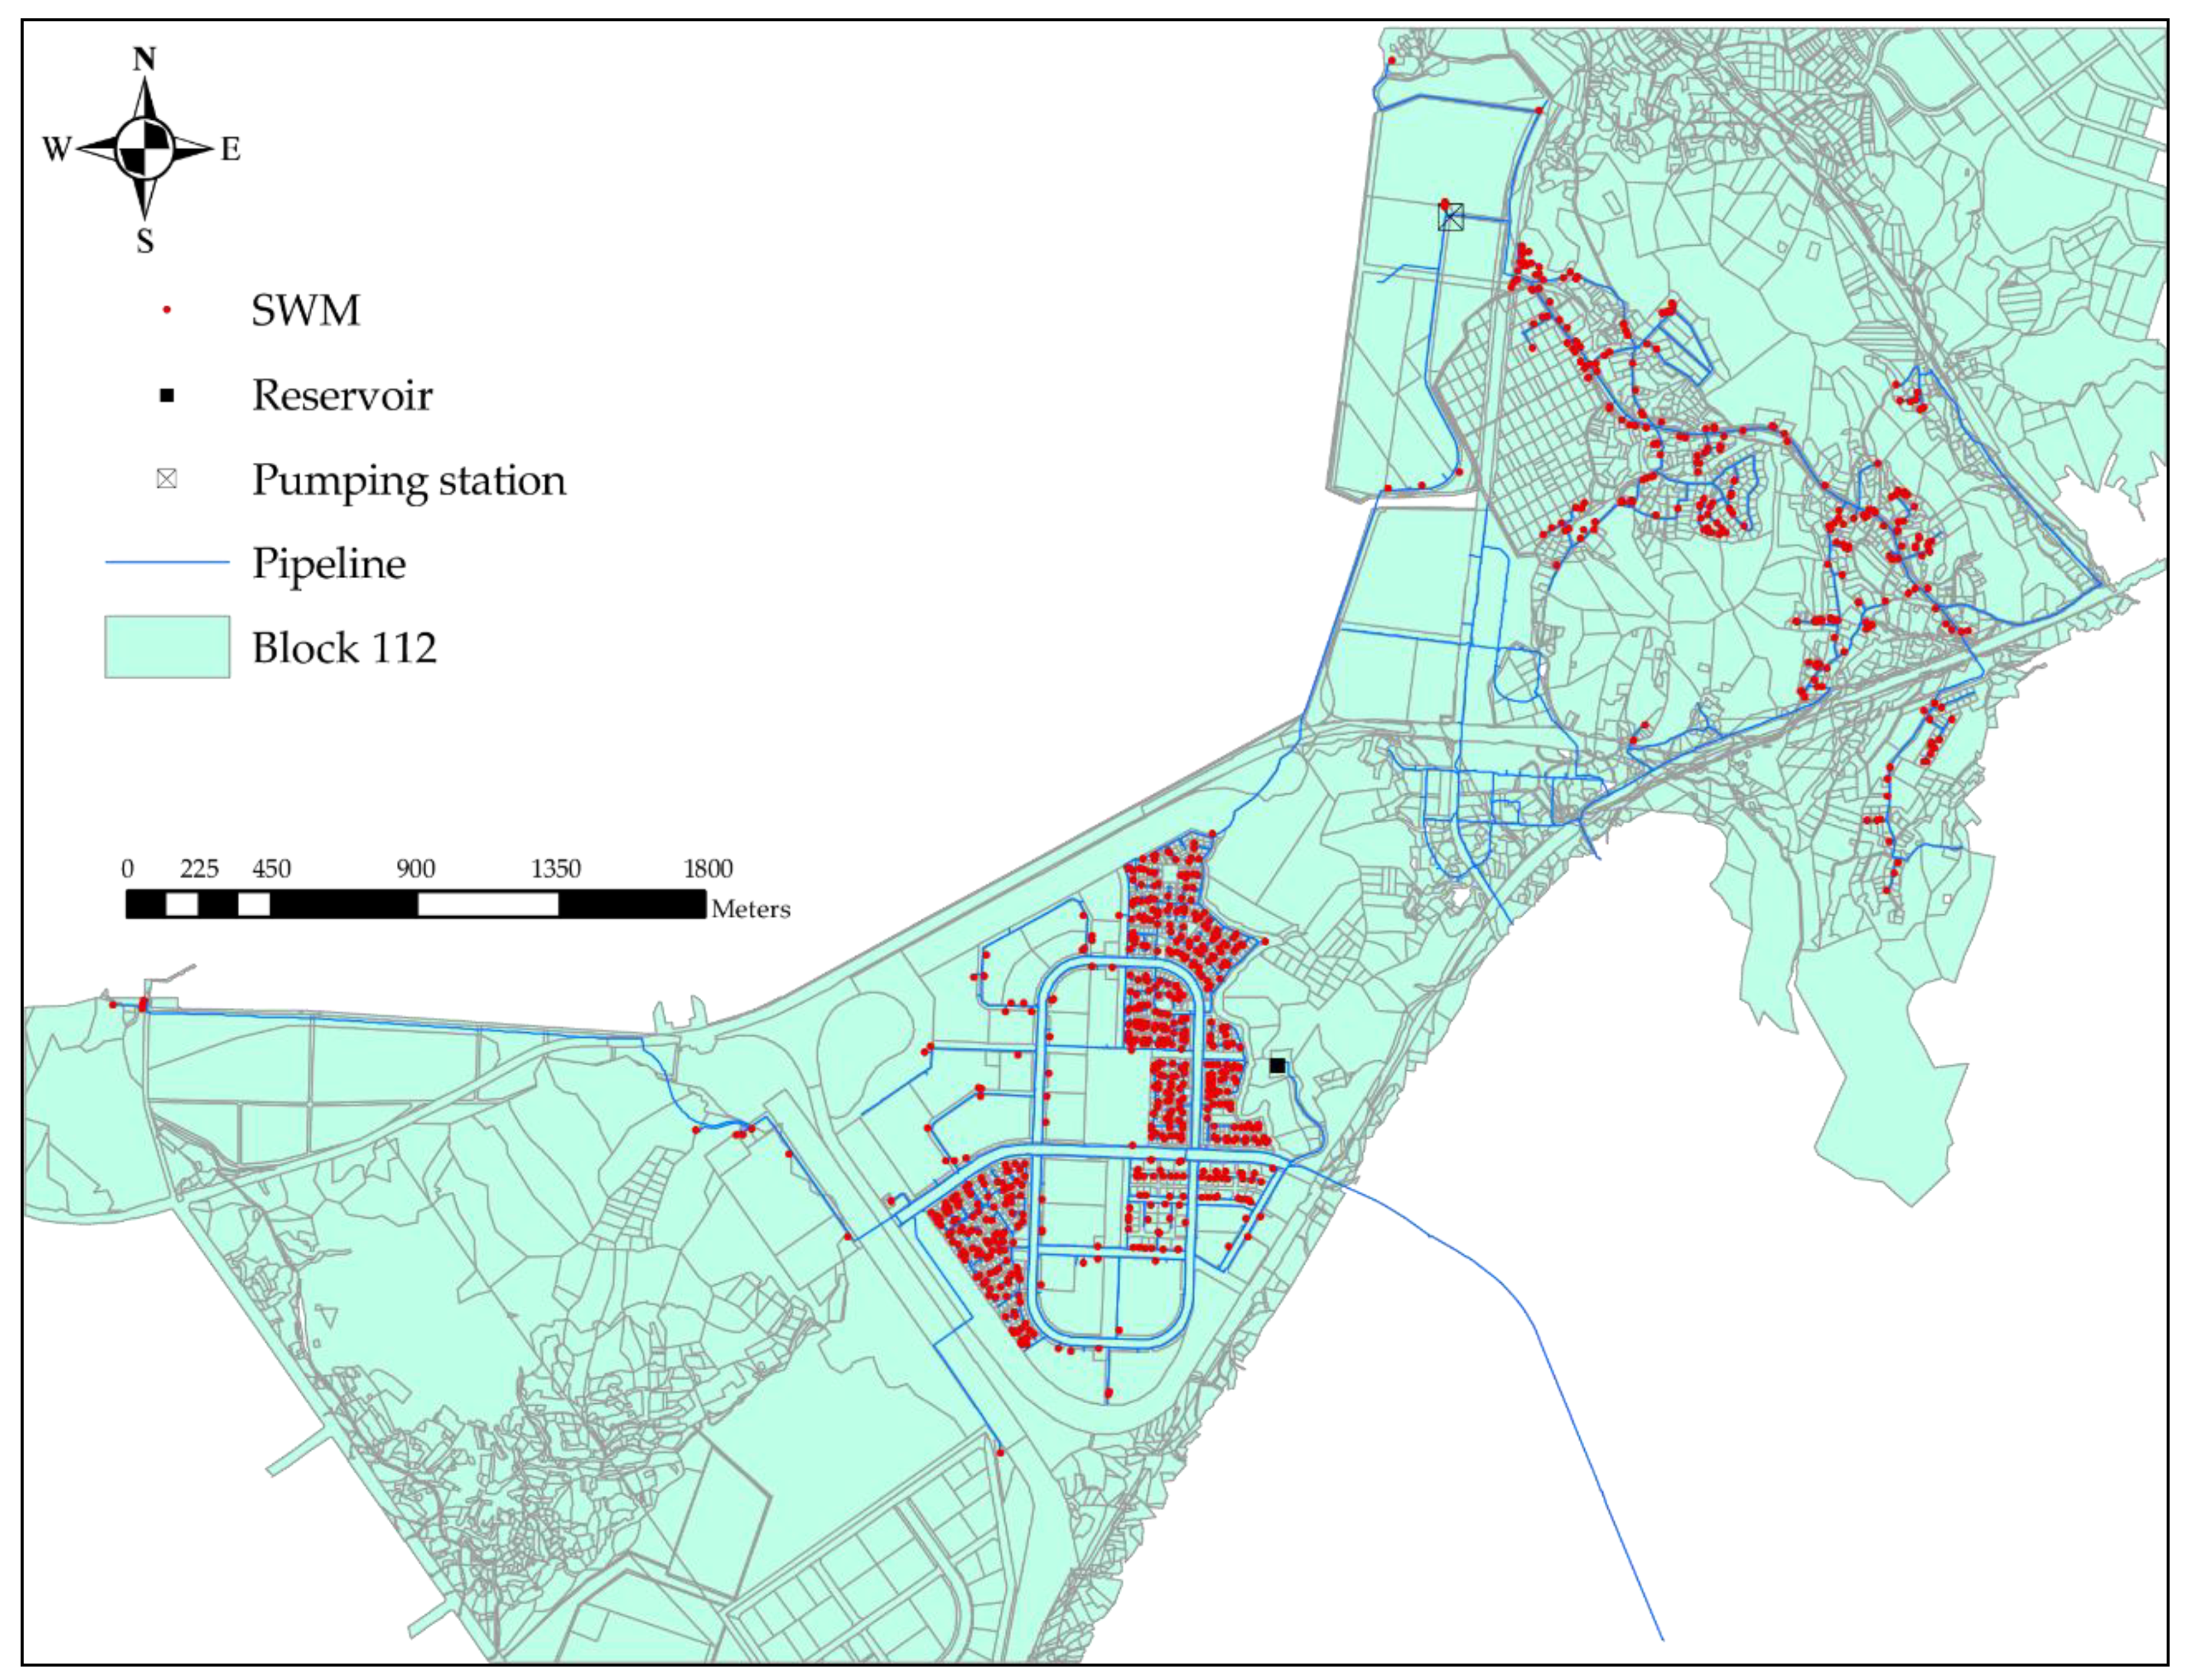
Research has recently been on-going for the implementation of a hyper-connected smart city, which provides a solution to overall urban problems through data-based analysis and simulation by connecting all data related to the city through the Internet of Things. Based on the SWG element technologies developed in Phase 1, the SWGRG has developed a solution for integrated management of water resources in a smart city through the field operation of the SWG living lab installed at Block 112 of YeongJong Island, Incheon from 2017 to 2019. As a result, the SWGRG has outlined the following three points (data quality, unmeasured water consumption of consumers, and leak point detection) for a discussion presented on the development of an SWG-integrated operation solution through the field operation of the living lab.
5.1. Real-Time AMI Data Quality
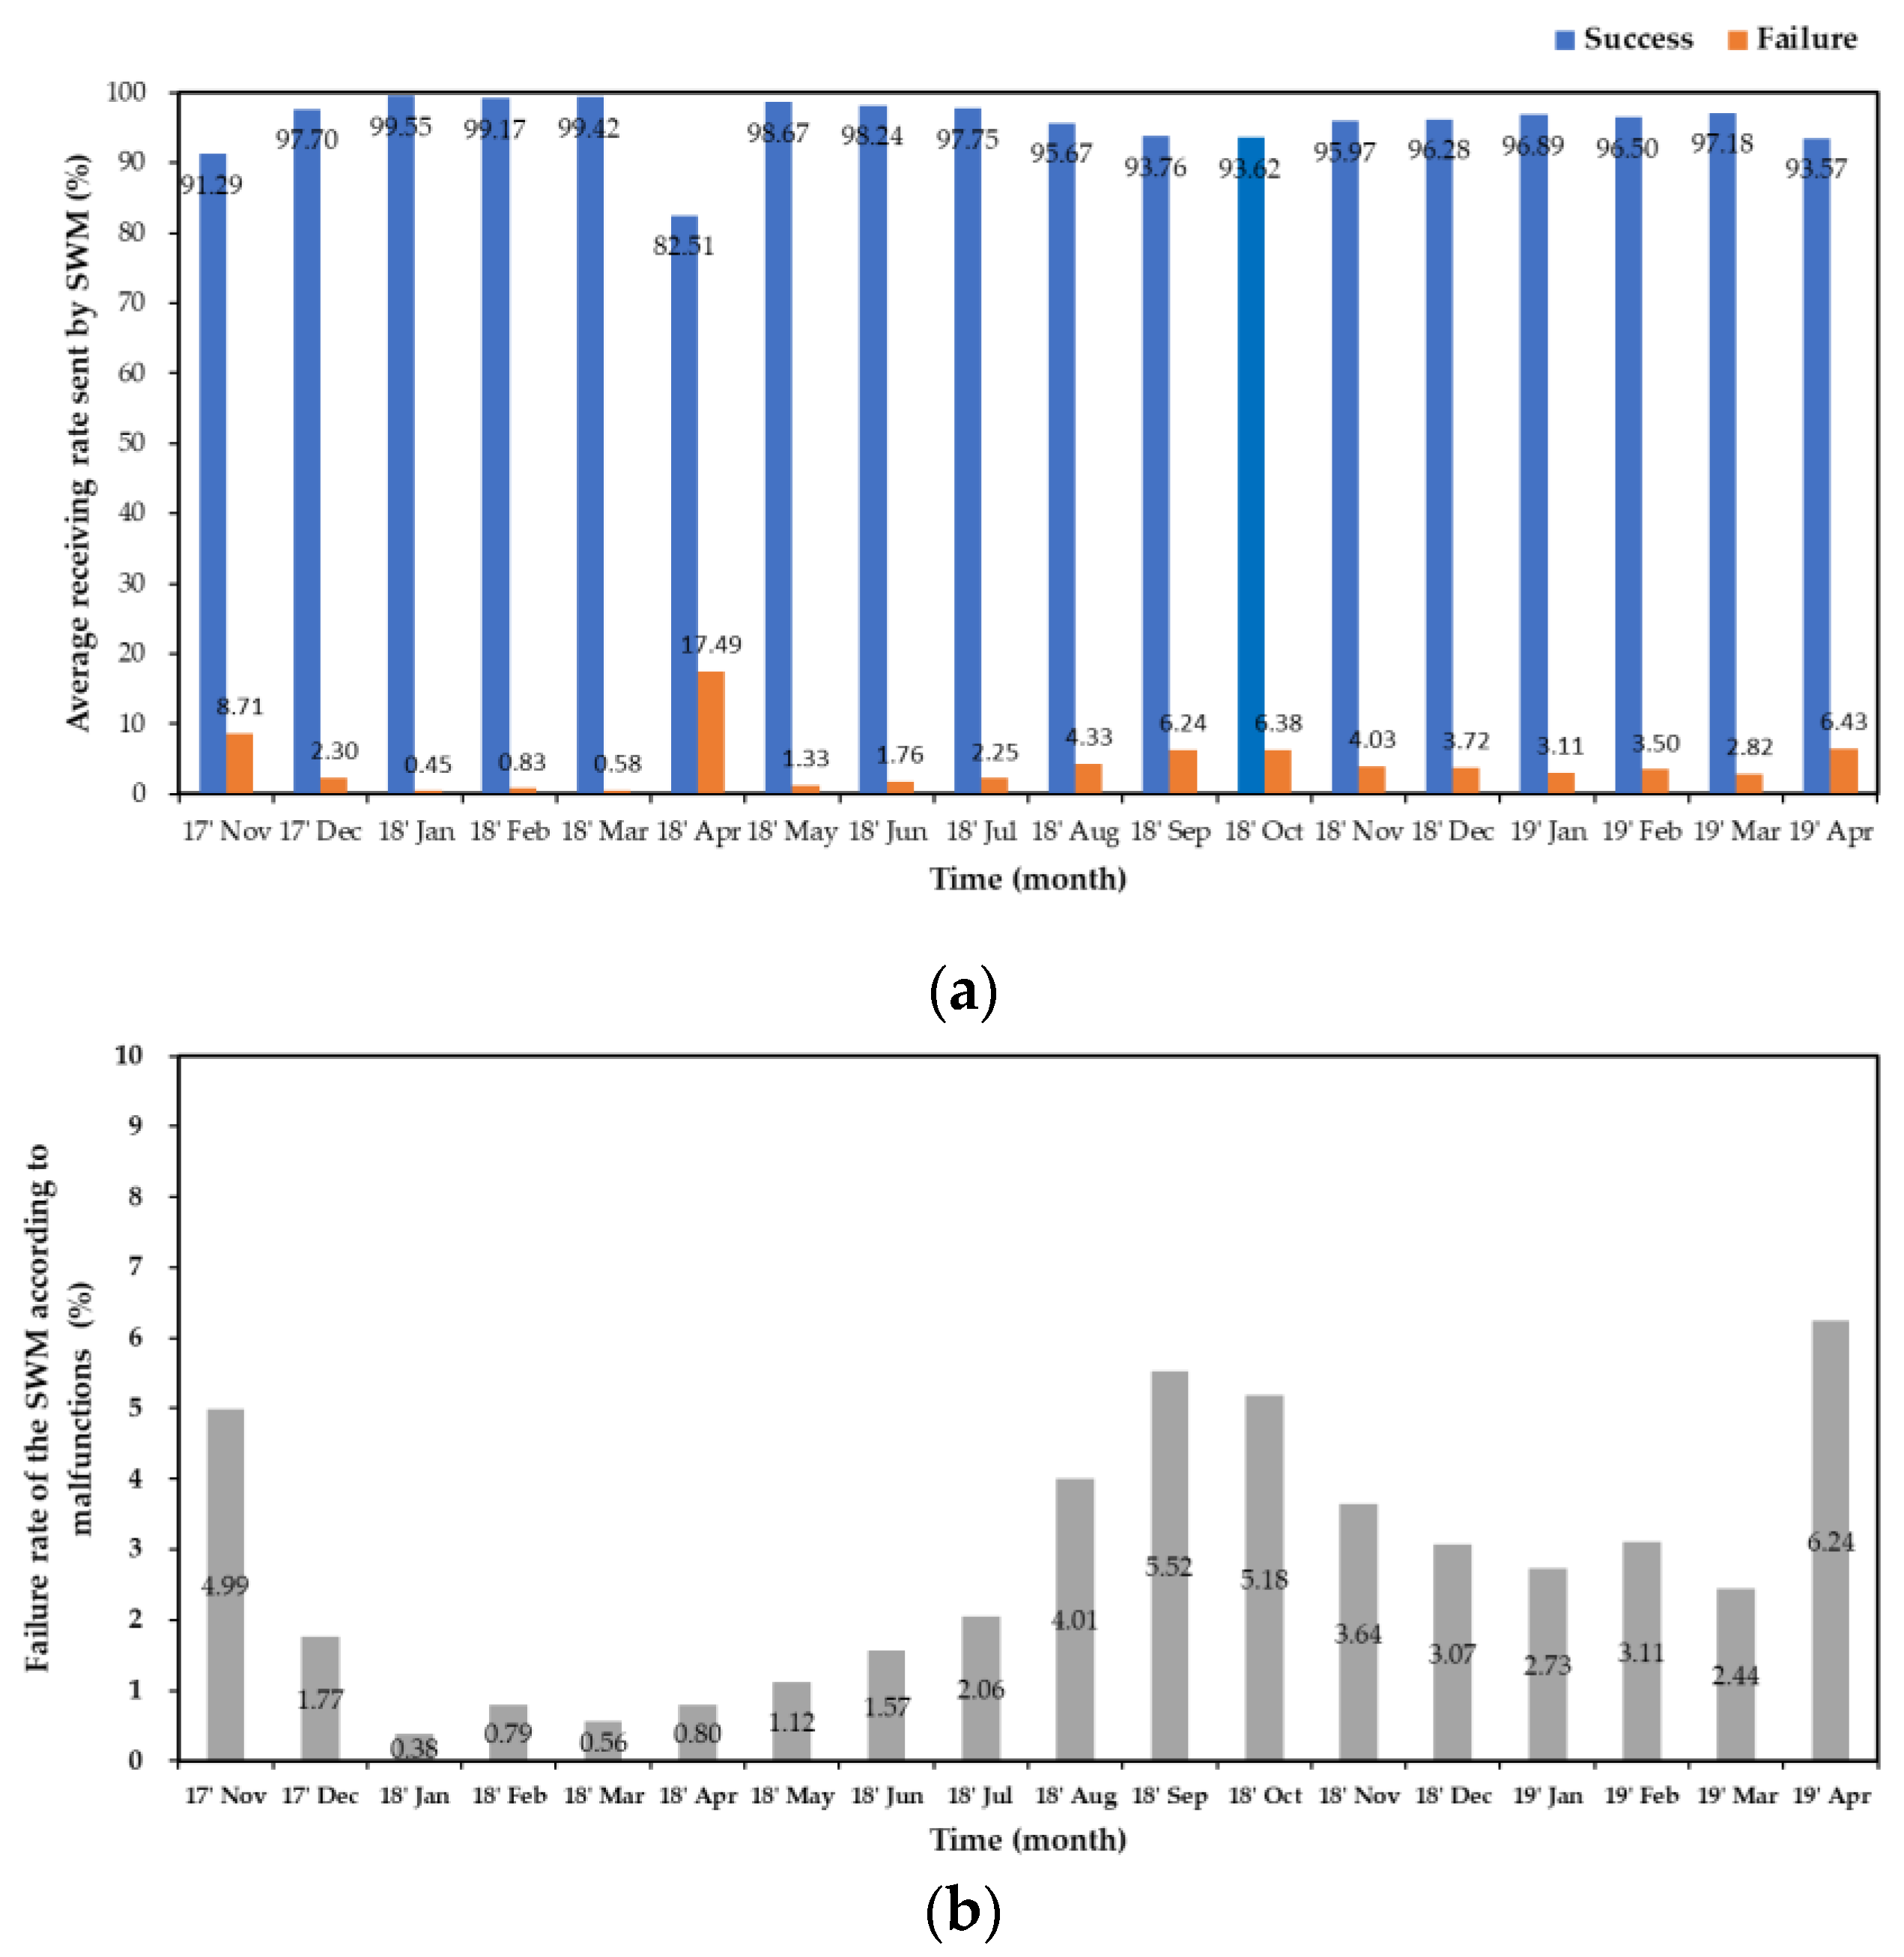
The most important factor in the field operation of the SWG living lab is the quality of real-time water consumption data received through the AMI network. Poor quality data lead to unreliable analysis results. Therefore, a statistical analysis was conducted to evaluate the quality of the AMI network using the accumulated water consumption data collected hourly from November 2017 to April 2019. As shown in
Figure 18, the average successful and failed receiving rates were 95.76% and 4.24%, respectively. In addition, the average failed receiving rate owing to a malfunction of the SWM was 2.78%, and the communication failure rate was 1.46%. In April 2018, a receiving rate of 82.51%, which is lower than the average, was obtained, which was due to non-payment of communication fees.
The maximum industry average of a smart meter failure rate is 5% [
22], and the general smart meter failure rate is 0.5% [
23]. The average failed receiving rate owing to a malfunction of the ultrasonic wave type SWM used in the field operation is lower than the maximum industry average, but higher than the rate of general smart meters. In particular, in April 2019, the failure rate reached approximately 6.24%, strongly indicating a need for improvement. In addition, the failed receiving rate owing to an SWM malfunction or failure was approximately 1.3% higher than that of communication error. In particular, it is greater than the average failed receiving rate at 18:00–21:00 h, and thus further analysis on the cause of such high failure rates is necessary.
In addition, in the event of an SWM failure, water consumption data cannot be sent even if the consumer uses water. Therefore, cases of missing data inevitably occur from the time of failure to the time of replacement. Because the collected data are the cumulative water consumption data and are counted from zero, a correction is required to calculate the water consumption before and after SWM replacement. Water consumption can be estimated through a linear regression analysis of the mass curve from the time of failure to the time of replacement; however, because it shows an inaccurate rate of consumption, proper measures for improvement are required.
5.2. Unmeasured Water Consumption of Customers
The installation of an SWM can encourage savings in water consumption from consumers, and the necessity for an SWM installation to achieve proper water management in practice is increasing for the socially vulnerable; however, consumer acceptance is required. There are currently 958 end-users on Block 112 of YeongJong Island, but SWMs are installed and operated in only 527 locations. Approximately 45% of the total amount of water use is measured by mechanical meters. The water withdrawal by water source, the amount of water filtration, and the optimal water level of the distributing reservoir are determined according to the forecast demand from the end-users. Therefore, more accurate demand forecasting is possible only when data are acquired in real time at all 958 end-user locations. In the field operation of the living lab, the real-time demand of unmeasured customers could not be obtained, and thus a demand forecast was conducted using water consumption data, monthly bill using mechanical meters, pipe diameter, usage, and water demand patterns according to the day of the week. However, it is difficult to expect high reliability for 45% of the water consumption data estimated using 55% of the real-time data. Therefore, there is a pressing need to encourage the installation of SWMs.
5.3. Leak Point Detection
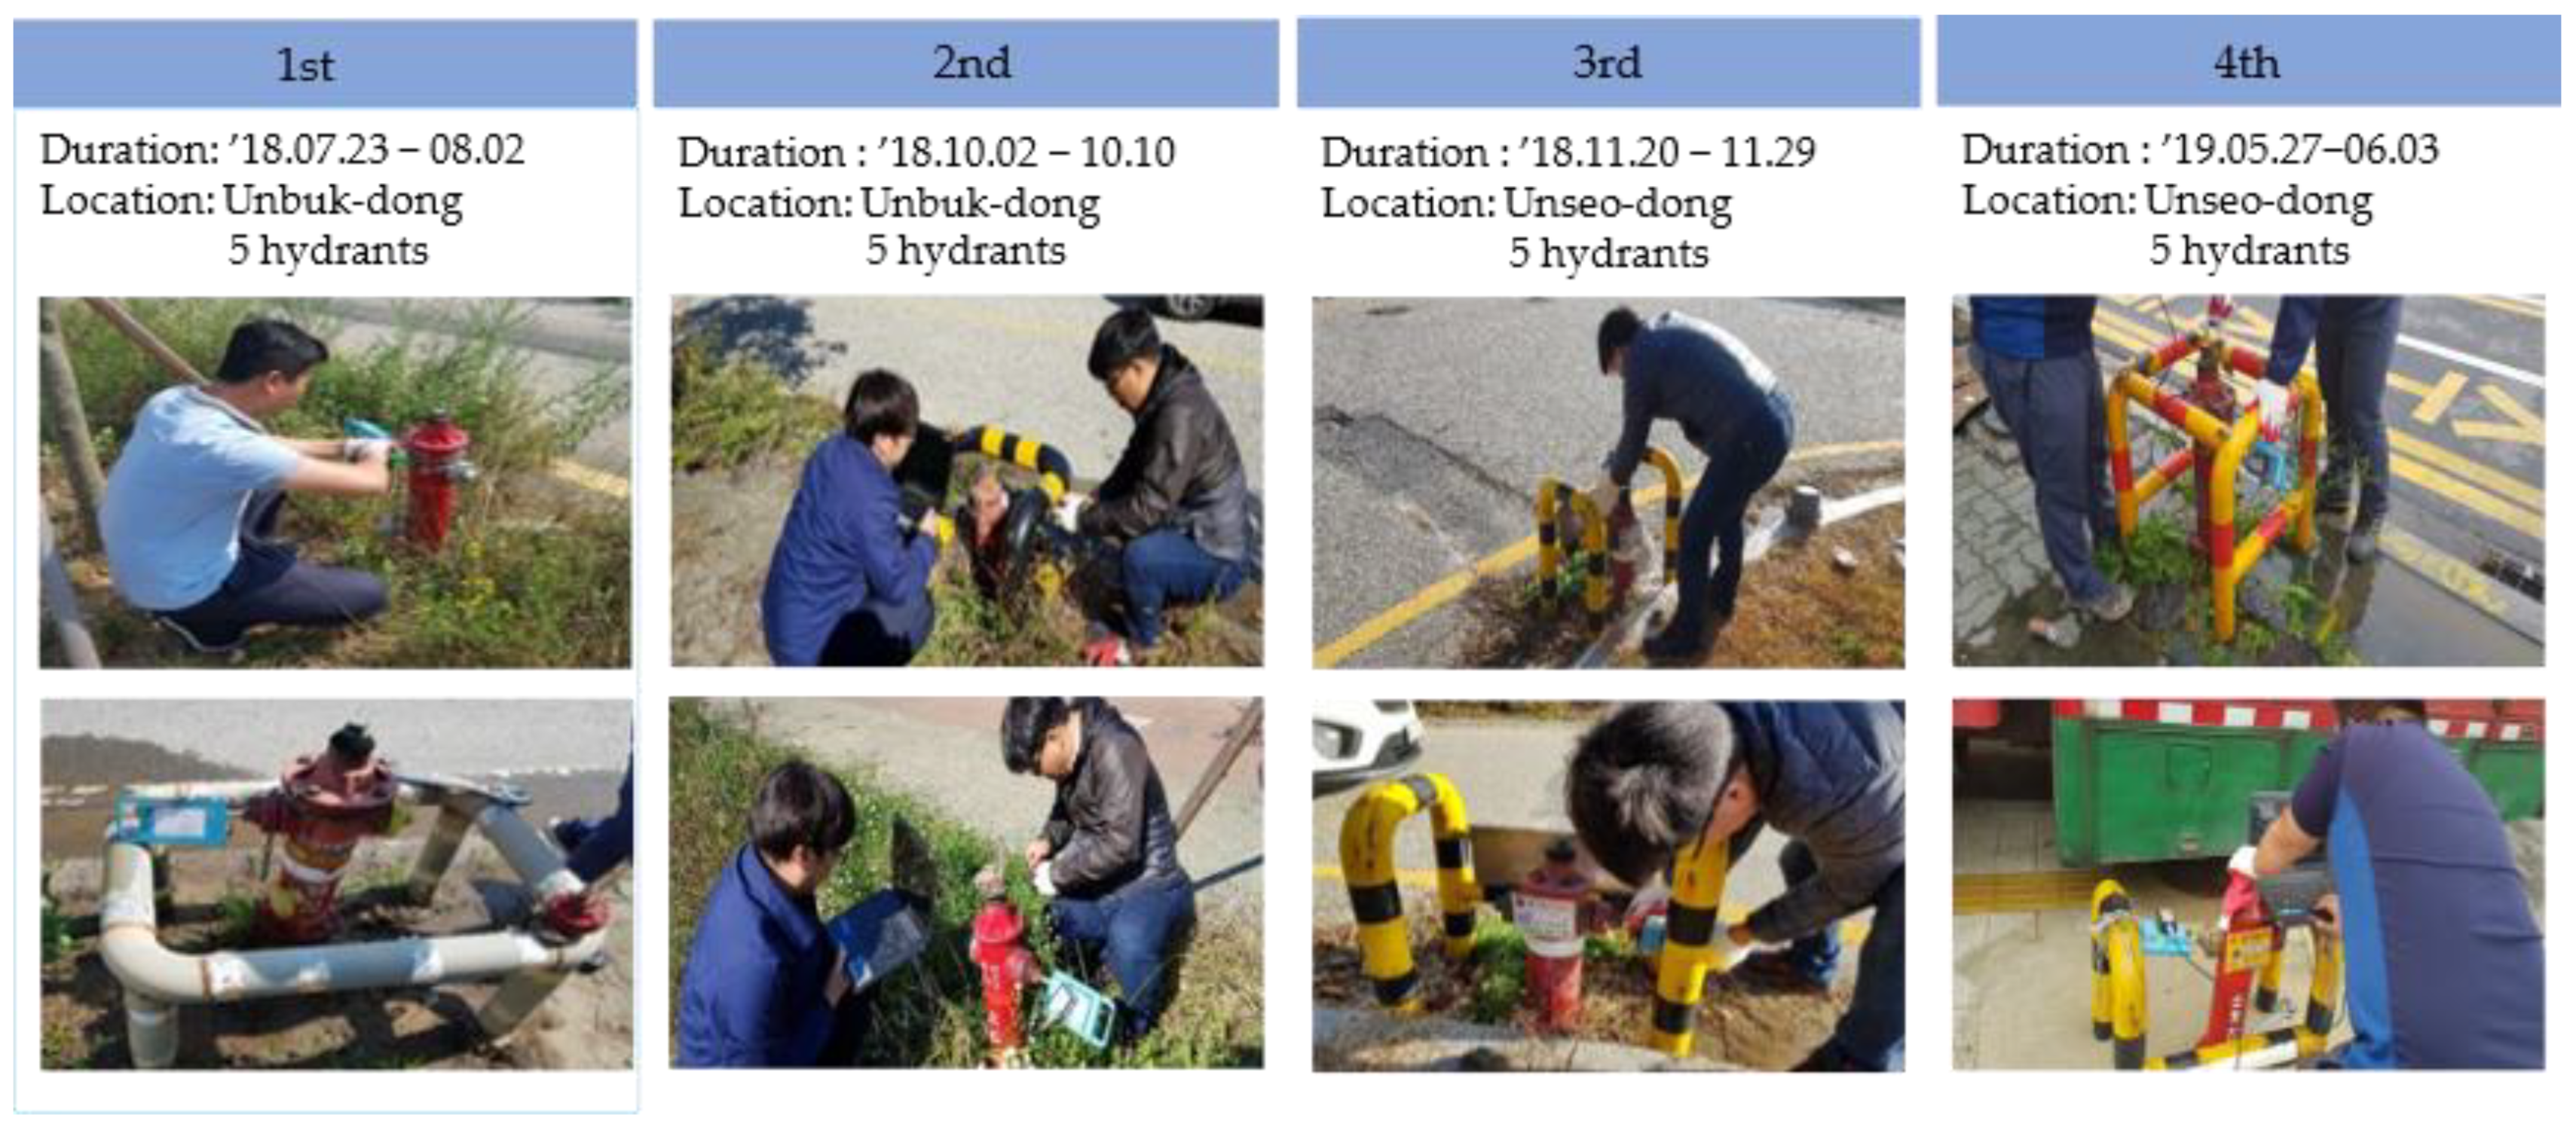
Locating the pipeline point where the leak occurs and carrying out prompt repair work is an important task to reduce non-revenue water. Because the pipelines are buried in the ground and are difficult to access, abnormalities are detected by ultrasonic waves or vibrations, or a water pipeline network analysis is used. Such an analysis is largely divided into pressure- and demand-driven approaches [
24]. A pressure-driven water pipeline network analysis has recently drawn attention because water demand can be modeled as a function of the pressure conditions. However, it is considerably difficult in both models to predict pipeline abnormalities owing to various uncertainties. In general, a demand-driven water pipeline network analysis has been used to calculate the appropriate pressure by applying the maximum daily water consumption per person according to the population for the design of a new city. With more precise demand forecasts using an SWM and the development of water-pressure sensors, pipeline leak detection research has recently been conducted through a demand-driven water pipeline network analysis. In a living lab field operation, water pressure was measured by installing a portable water pressure meter at the fire hydrant in block 112 four times. In addition, as a result of comparing the water pressure calculated through the water pipeline network analysis using the real water demand and the water pressure measured by a portable water pressure meter, a meaningful result was obtained indicating that the water pressure simulation was possible only with the demand data (
Figure 19). However, to detect the leakage point through a water pipeline network analysis, research is needed with the installation of more water pressure meters.
6. Conclusions
It is increasingly difficult to supply safe and sustainable water to consumers by current WDNs due to insufficient supply, deteriorating water quality, increased energy consumption, and climate change. To solve these problems, SWG integrates ICT technology and conventional water management system. Supply efficiency can be improved by solving the uncertainty of the existing manpower meter reading and alleviating water problems.
Therefore, research on the application of SWG is being conducted all over the world. In Korea, SWGRG was launched in 2012 to build an intelligent water management system using alternative water resources with the aim of reducing water and energy and built the living lab for the SWG demonstration operation. Living Lab was built in block 112 of YeongJong Island, Incheon, where Incheon International Airport, the hub of Northeast Asia, is located. Here, water is supplied through a single submarine pipeline, making it the best place to respond to water crises and build water supply systems in emergencies. SWG core technologies were developed in the living lab by combining ICT technology and water resource management technology, and demonstration operation and verification were performed.
Therefore, in this study, the core element technologies (Intelligent water source management and distribution system, Smart water distribution net-work planning/control/operation strategy establishment, AMI network and device development, and Integrated management of bi-directional smart water information) developed through the living lab demonstration operation and the development of the demonstration operation solutions (Smart water statistics information, Real-time demand-supply analysis, Decision support system, Real-time hydraulic pipeline network analysis, Smart DB management, and Water information mobile application) were introduced.
On the other hand, through the living lab demonstration operation, we found that there were several issues to be dealt with. First, one of the most important things for SWG operation is the quality of data received from AMIs. In-depth analysis of the reception failure rate due to malfunction or failure is required, and must be lowered. Second, not all consumers want to install a smart meter, so for more precise operation of the water supply system, it is necessary to forecast the water consumption of unmeasured consumers. Finally, it is necessary to examine the applicability of demand-driven pipe network analysis to the point where leakage occurs.


