- Article

Agent-Based Modeling of Urban Agriculture: Decision-Making, Policy Incentives, and Sustainability in Food Systems
- Thiago Joel Angrizanes Rossi,
- Aline Martins de Carvalho and
- Flavia Mori Sarti
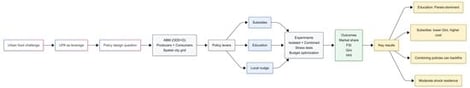
Urban and peri-urban agriculture (UPA) has emerged as a critical strategy to address multidimensional urban challenges, including food insecurity, environmental degradation, and social inequality. Despite its potential benefits, UPA occupies a marginal position in municipal governance frameworks. Understanding how public policies and social influence mechanisms shape consumer behavior and producer viability requires a systems-thinking approach capable of capturing complex socio-economic-ecological interactions. Therefore, we developed an agent-based model (ABM) following the ODD + D protocol to simulate urban agriculture market dynamics, incorporating producer and consumer agents within a spatially explicit grid environment representing the urban landscape. We implemented three policy interventions and conducted six complementary experiments. Education campaigns achieved the highest local market share, demonstrating strict Pareto dominance over all subsidy-based strategies. Production subsidies yielded equivalent outcomes but at a fiscal cost, reducing producer income inequality (Gini). Stress tests revealed moderate resilience to production shocks. The findings demonstrate the power of agent-based modeling to uncover policy dynamics in complex urban food systems, providing actionable evidence for sustainable urban governance.
6 February 2026
![Panel (A). Experimental design timeline showing the five visits made by the participants. 3MT = 3 min all-out tethered running test; CONTROL = no conditioning activity before 3MT; PAPE = post-activation potentiation enhancement by conditioning activity before 3MT; 1RM = one maximal repetition test. Panel (B). Scenarios for constructing the complex networks and complex network nodes used in these two scenarios. Legend: BM = body mass, Height = height, % BF = % of body fat, LM = lean mass, 1RM = one maximal repetition, VT1 = ventilatory threshold 1, VT2 = ventilatory threshold 2, VO2max = maximum oxygen uptake, iVO2max = intensity corresponding to maximum oxygen uptake, %VT2-iVO2max = percentage of ventilatory threshold 2 corresponding to iVO2max, EP = end power, rEP = end power relativized by body mass, WEP = work above end power, rWEP = work above end power relativized by body mass, HR post = post-test heart rate, CK24h = 24 h post-test creatine kinase, [Lac peak] = post-test peak lactate concentration, 3MT VO2peak = peak of oxygen consumption during 3MT, EPc = mean oxygen consumption during EP, EPOC = excess post exercise oxygen consumption, RPE = rating-of-perceived-exertion, Ppeak = peak output power, rPpeak = peak output power relativized by body mass, Pmean = mean output power, rPmean = mean output power relativized by body mass, Fpeak = peak force, rFpeak = peak force relativized by body mass, Fmean = mean force, rFmean = mean force relativized by body mass, Vpeak = peak velocity, and Vmean = mean velocity.](https://mdpi-res.com/cdn-cgi/image/w=281,h=192/https://mdpi-res.com/complexities/complexities-02-00001/article_deploy/html/images/complexities-02-00001-g001-550.jpg)