



Journal Description
Forecasting
Forecasting
is an international, peer-reviewed, open access journal on all aspects of forecasting published bimonthly online by MDPI.
- Open Access— free for readers, with article processing charges (APC) paid by authors or their institutions.
- High Visibility: indexed within Scopus, ESCI (Web of Science), RePEc, and other databases.
- Journal Rank: JCR - Q1 (Multidisciplinary Sciences) / CiteScore - Q1 (Economics, Econometrics and Finance (miscellaneous))
- Rapid Publication: manuscripts are peer-reviewed and a first decision is provided to authors approximately 23.8 days after submission; acceptance to publication is undertaken in 2.9 days (median values for papers published in this journal in the first half of 2026).
- Recognition of Reviewers: Reviewers whose reports are timely and of high quality receive an APC discount voucher for a future publication in an MDPI journal. Become a reviewer.
- Journal Cluster of Economics, Finance and Risk Systems: Commodities, Econometrics, Economies, FinTech, Forecasting, Games, International Journal of Financial Studies, Journal of Risk and Financial Management, Platforms and Risks.
Impact Factor:
4.2 (2025);
5-Year Impact Factor:
3.3 (2025)
Latest Articles
Hybrid Traditional Statistical and Deep Learning Models for Modelling the FTSE/JSE Top 40 Index: Evidence from an Emerging Equity Market
Forecasting 2026, 8(5), 90; https://doi.org/10.3390/forecast8050090 (registering DOI) - 18 Sep 2026
Abstract
Forecasting equity returns remains challenging because financial markets exhibit nonlinear dynamics, volatility clustering, and complex temporal dependencies that are difficult to capture using a single modelling approach. Traditional statistical models can capture dependence and volatility dynamics, while deep learning models are capable of
[...] Read more.
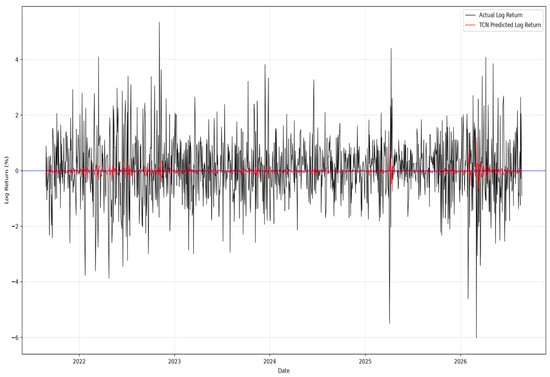
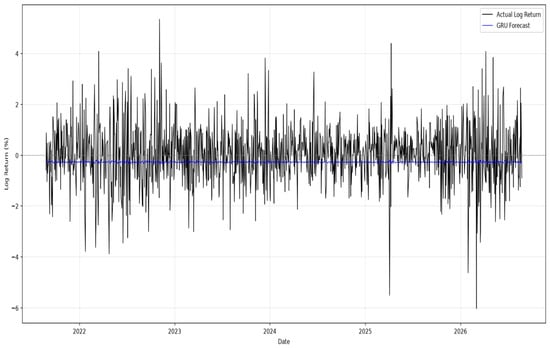
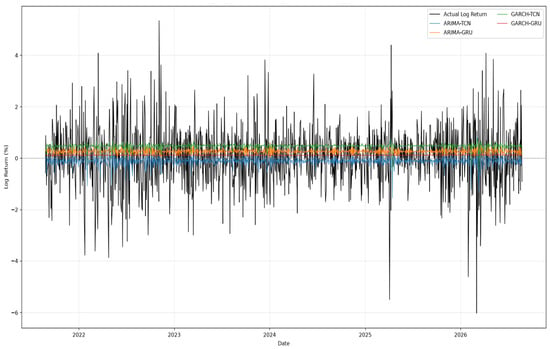
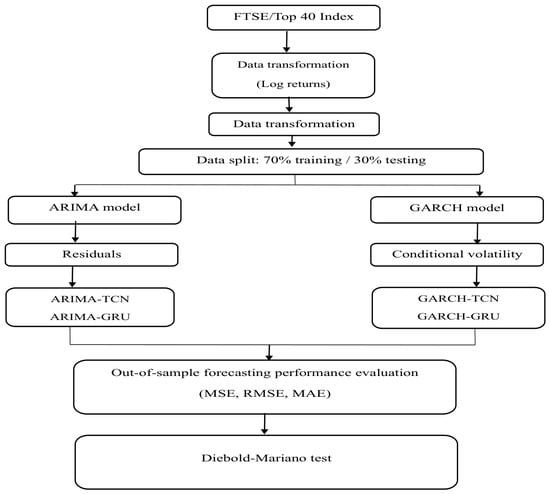
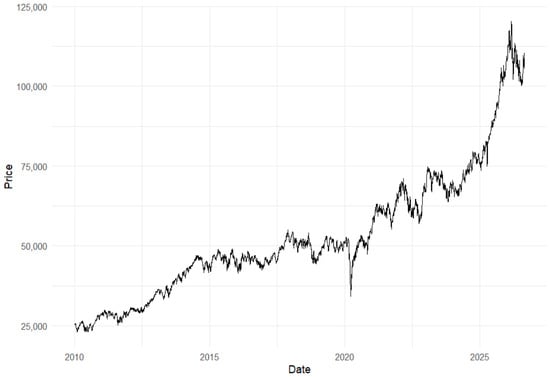
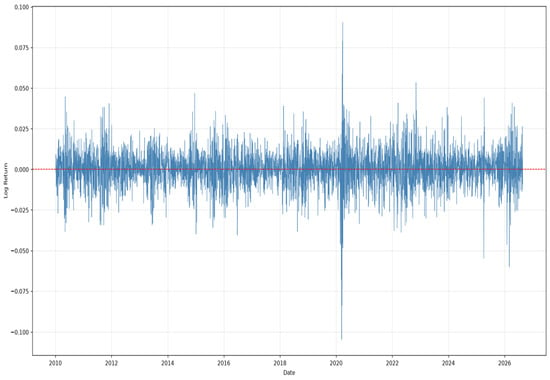
Forecasting equity returns remains challenging because financial markets exhibit nonlinear dynamics, volatility clustering, and complex temporal dependencies that are difficult to capture using a single modelling approach. Traditional statistical models can capture dependence and volatility dynamics, while deep learning models are capable of learning nonlinear temporal patterns. This study evaluates the forecasting performance of traditional statistical models (ARIMA and GARCH), deep learning models (TCN and GRU), and hybrid models (ARIMA-TCN, ARIMA-GRU, GARCH-TCN, and GARCH-GRU) for forecasting the FTSE/JSE Top 40 index in South Africa. Daily closing prices comprising 4159 observations from 2010 to 2026 were analysed, with model performance evaluated on log returns using MSE, RMSE, and MAE, with the Naïve model used as a benchmark. The results show that all competing models substantially outperformed the Naïve benchmark, while the TCN outperformed the standalone GRU. GARCH-based models also demonstrated strong forecasting performance, highlighting the relevance of volatility dynamics in forecasting equity returns. Although GARCH-GRU recorded the lowest MSE, RMSE, and MAE among the models evaluated, its performance was very similar to that of the GARCH (2,2) model. The Diebold-Mariano test further showed no statistically significant difference in predictive accuracy between GARCH-GRU and (DM = 0.9495; p = 0.3424). These findings indicate that GARCH-GRU and provide statistically comparable forecasting performance, suggesting that the additional complexity of the hybrid framework does not necessarily result in a significant improvement in predictive accuracy. This study contributes to the financial forecasting literature by providing empirical evidence from an emerging African equity market and demonstrating the importance of volatility modelling and complementary statistical–deep learning approaches for forecasting FTSE/JSE Top 40 log returns.
Full article
(This article belongs to the Section Forecasting in Economics and Management)
►
Show Figures
Open AccessArticle
Pooling Beats Structure on Short Annual Panels: Parameter Sharing and the Forecast Accuracy of Evolutionary Models for Compositional Time Series
by
Aras Yolusever
Forecasting 2026, 8(5), 89; https://doi.org/10.3390/forecast8050089 (registering DOI) - 18 Sep 2026
Abstract
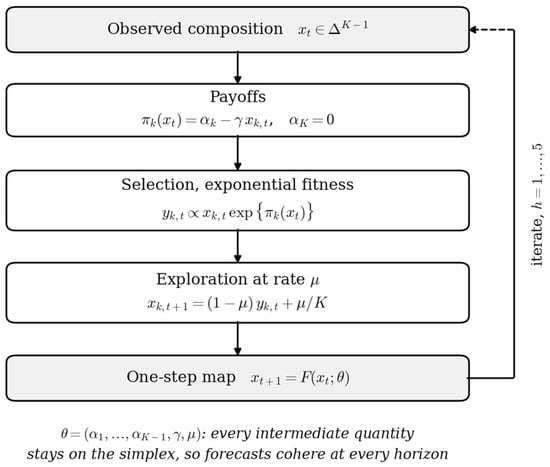
Many economic time series are compositions: educational attainment shares, waste treatment routes, energy mixes, and sectoral employment. Forecasters usually move such series to log-ratio coordinates and apply generic methods that impose no economic restriction on how the parts move. Evolutionary game theory supplies
[...] Read more.
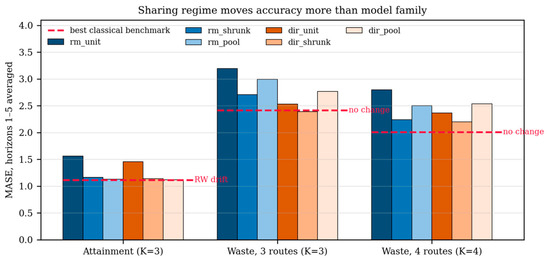
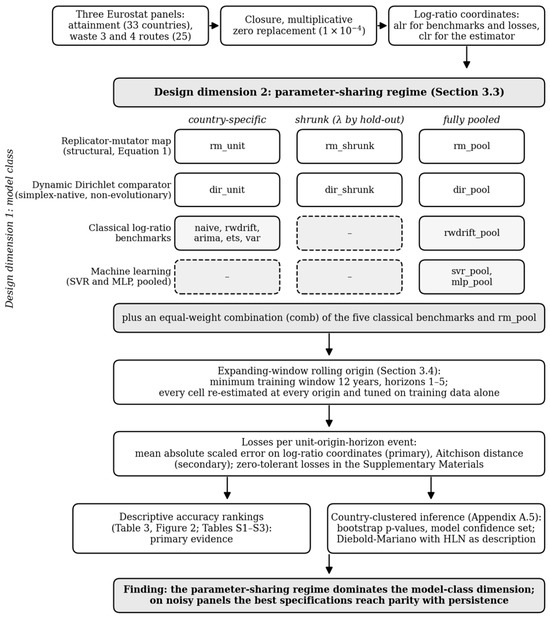
Many economic time series are compositions: educational attainment shares, waste treatment routes, energy mixes, and sectoral employment. Forecasters usually move such series to log-ratio coordinates and apply generic methods that impose no economic restriction on how the parts move. Evolutionary game theory supplies one: replicator dynamics make the growth rate of a share proportional to its payoff advantage, which is the logic of imitation, diffusion and congestion that economics itself uses to explain why shares move. We turn that restriction into a forecast function with parameters for a -part composition; estimate it under three parameter-sharing regimes, namely country-specific, fully pooled and validation-shrunk; and race it against classical log-ratio benchmarks, a non-evolutionary Dirichlet comparator and two pooled machine-learning benchmarks in an expanding-window, rolling-origin design on three Eurostat panels. The evolutionary restriction does not buy accuracy: its best specification ties the random walk with drift on educational attainment and loses to persistence on municipal waste routes. What moves accuracy is the sharing regime. Moving from country-specific estimation to the best sharing regime cuts the mean absolute scaled error by 27.8% on attainment and by 15.3% to 19.8% on the waste panels, more than the gap between the best structural and the best statistical model, and the same ordering reappears in the Dirichlet family. The estimated congestion parameters carry the economics the restriction was built for, increasing returns in attainment and congestion in waste routes, while a simulation grid shows the sharing gain reversing once cross-country heterogeneity is appreciable. We close with a walk-forward procedure for tuning the shrinkage weight and the mutation rate.
Full article
(This article belongs to the Section Forecasting in Economics and Management)
►▼
Show Figures

Figure 1
Open AccessArticle
Enhancing Methods for Grid-Load Forecasting in Order to Reduce Grid Losses
by
Leon Olive
Forecasting 2026, 8(5), 88; https://doi.org/10.3390/forecast8050088 - 17 Sep 2026
Abstract
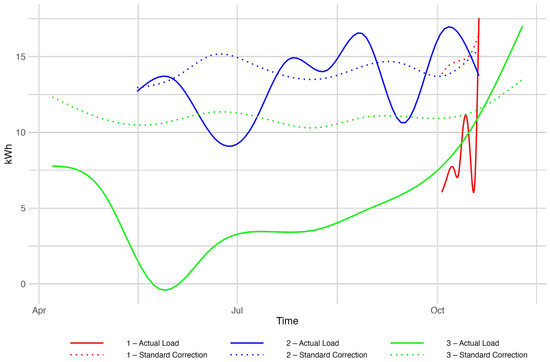
Accurate forecasting of electrical load at the substation level is essential for detecting grid losses that pose significant financial and safety challenges. This study investigates whether the standard correction method currently used by grid operators can be improved through the application of advanced
[...] Read more.
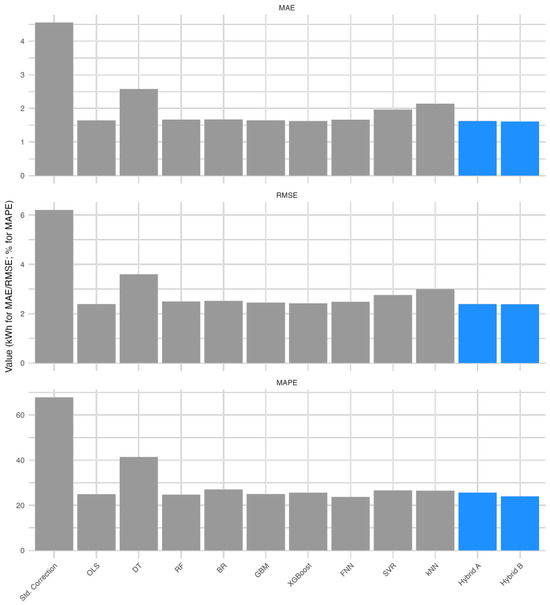
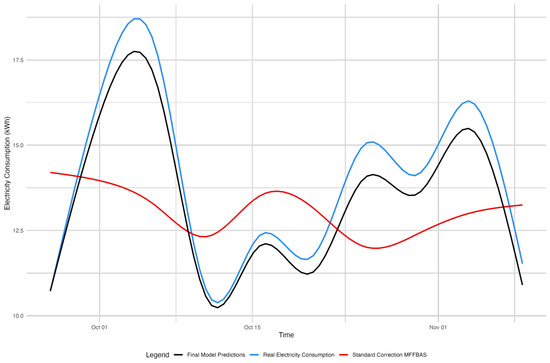
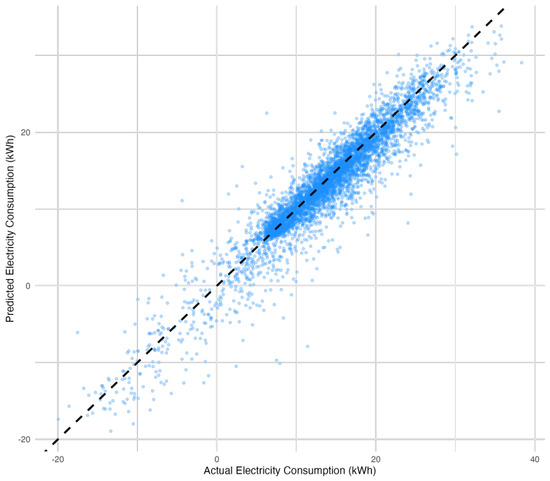
Accurate forecasting of electrical load at the substation level is essential for detecting grid losses that pose significant financial and safety challenges. This study investigates whether the standard correction method currently used by grid operators can be improved through the application of advanced forecasting models to granular, location-specific load data. Such improvements are particularly valuable for identifying abnormal consumption patterns indicative of grid losses due to electricity theft, defective meters, or cable damage. This paper evaluates a broad range of statistical and machine learning models—including ARIMAX, SARIMAX, Random Forests, Gradient Boosting Machines, Neural Networks, and Support Vector Regression—based on unique quarter-hourly datasets from several Dutch substations. Two hybrid approaches are proposed, combining the best-performing individual models through a stacked ensemble method and a simpler averaging strategy. The results show that incorporating lagged and additional exogenous variables, along with the application of various advanced models, significantly improves forecasting accuracy compared to the standard correction method, with the best hybrid model reducing MAE and RMSE by approximately 64.7% and 61.6%, respectively, relative to the current operational benchmark. This study demonstrates that substation-level, data-driven forecasting can strengthen the signals used to detect grid losses, offering practical implications for grid operators and policymakers.
Full article
(This article belongs to the Section Power and Energy Forecasting)
►▼
Show Figures

Figure 1
Open AccessArticle
Can Geopolitical Risk Improve the Forecasting of Thai Stock-Market Returns? Evidence from Econometrics and Machine-Learning Models
by
Tanattrin Bunnag
Forecasting 2026, 8(5), 87; https://doi.org/10.3390/forecast8050087 - 16 Sep 2026
Abstract
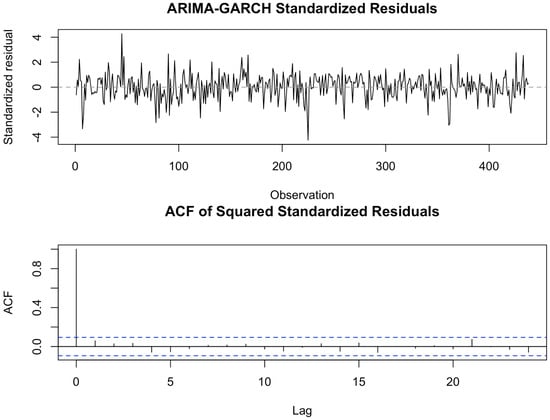
Geopolitical uncertainty may affect financial markets, but its incremental value for forecasting emerging-market stock returns remains unclear. Using monthly data from January 1990 to July 2026, this study compares ARIMA-GARCH and ARIMAX-GARCH benchmarks with Random Forest, XGBoost, LightGBM, and a zero-return benchmark across
[...] Read more.
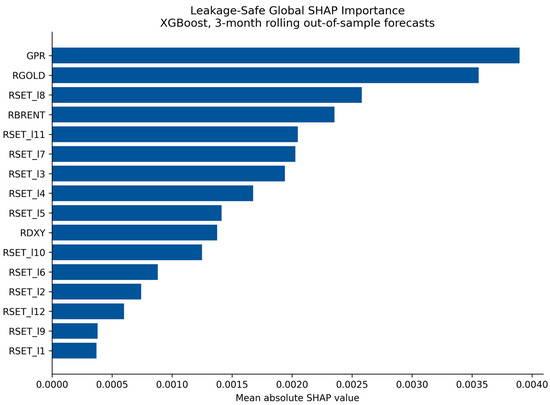
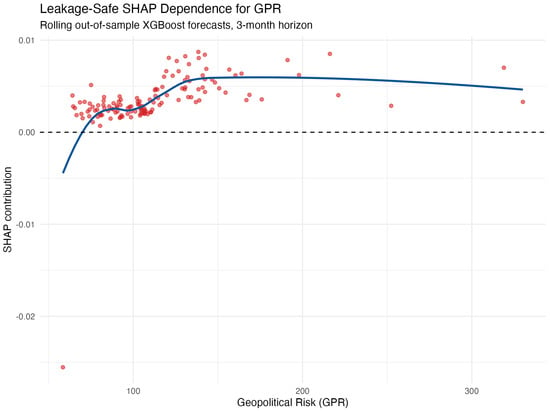
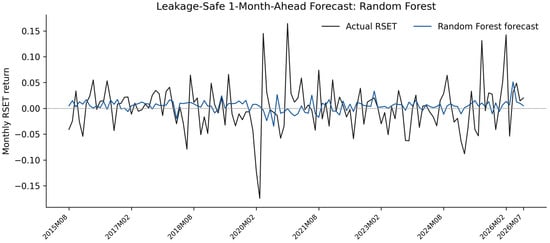
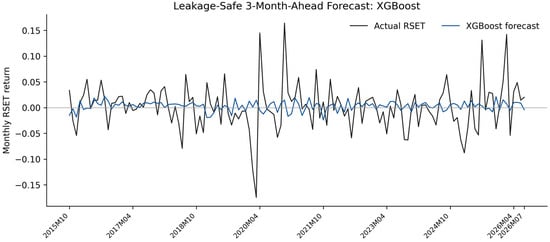
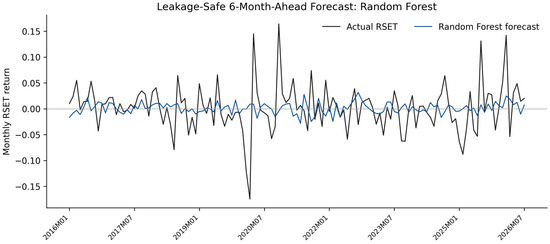
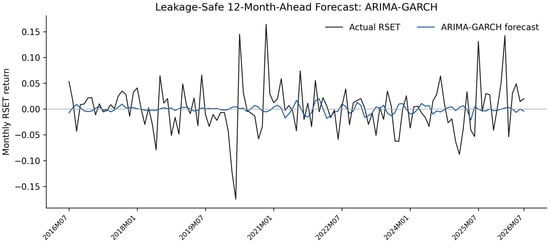
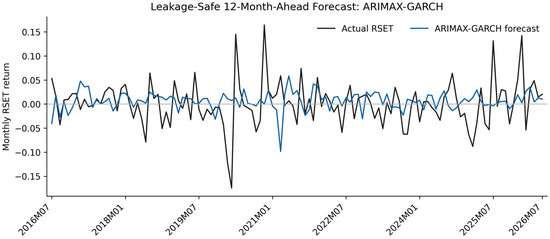
Geopolitical uncertainty may affect financial markets, but its incremental value for forecasting emerging-market stock returns remains unclear. Using monthly data from January 1990 to July 2026, this study compares ARIMA-GARCH and ARIMAX-GARCH benchmarks with Random Forest, XGBoost, LightGBM, and a zero-return benchmark across 1-, 3-, 6-, and 12-month horizons. Forecasts are generated with a target- and predictor-leakage-safe expanding-window design: training targets never exceed the forecast origin, and no realized future predictor values are used. Econometric forecasts are conditional on fixed ARIMA and ARIMAX orders selected during full-sample diagnostics. Among the estimated models, XGBoost achieves the lowest RMSE and MAE at three months, Random Forest has the lowest RMSE at one and six months, and ARIMA-GARCH performs best at twelve months. Nevertheless, the zero-return benchmark records the lowest RMSE at every horizon, while Diebold–Mariano tests generally do not reject equal predictive accuracy, and the Model Confidence Set retains multiple competitive models. Rolling SHAP analysis ranks geopolitical risk first among 16 predictors in the three-month XGBoost model, accounting for 14.38% of aggregate mean absolute attribution. Thus, geopolitical risk provides model-specific short-horizon conditioning information, but its standalone accuracy gain is modest, statistically insignificant, and absent at twelve months.
Full article
(This article belongs to the Topic Modern Challenges and Innovations in Financial Econometrics)
►▼
Show Figures

Figure 1
Open AccessArticle
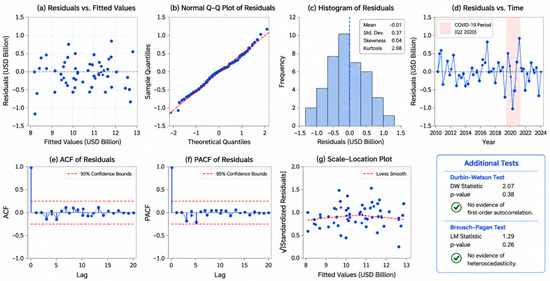
An Interpretable Structural-Break Forecasting Framework for Limited-Sample Quarterly Revenue Prediction: Evidence from Coca-Cola
by
Mani Honarvar Shakibaei Asli and Barmak Honarvar Shakibaei Asli
Forecasting 2026, 8(5), 86; https://doi.org/10.3390/forecast8050086 - 15 Sep 2026
Abstract
►▼
Show Figures
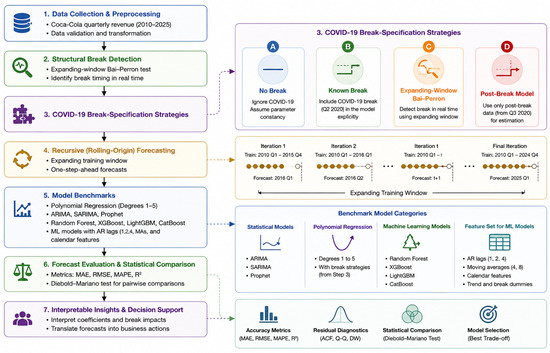
Forecasting quarterly revenue during structural breaks remains challenging, particularly when only limited historical data are available and interpretability is required for business decision-making. This study proposes an interpretable forecasting framework that integrates formal structural break detection, explicit break-specification strategies, and recursive forecast evaluation
[...] Read more.
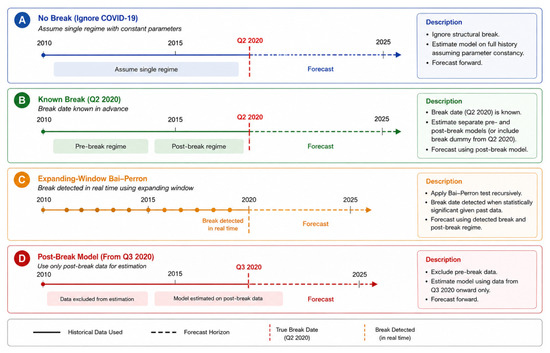
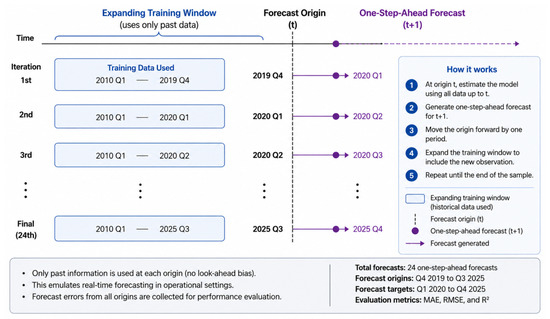
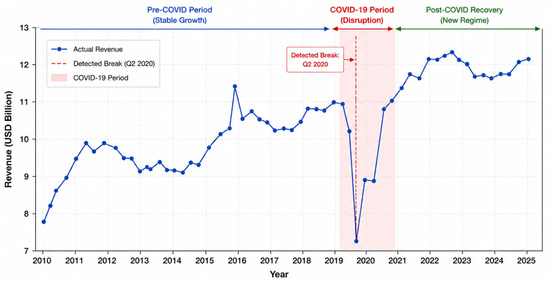
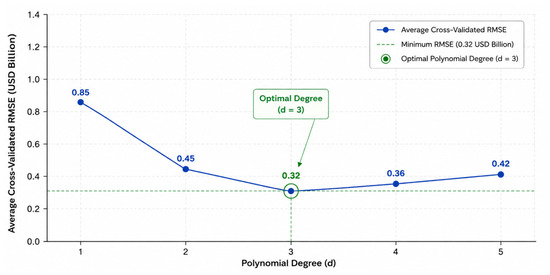
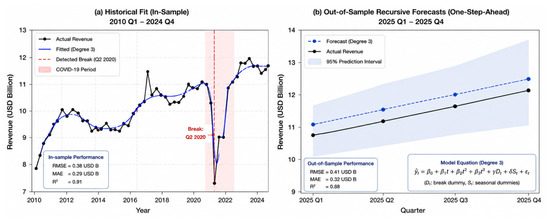
Forecasting quarterly revenue during structural breaks remains challenging, particularly when only limited historical data are available and interpretability is required for business decision-making. This study proposes an interpretable forecasting framework that integrates formal structural break detection, explicit break-specification strategies, and recursive forecast evaluation for quarterly revenue prediction under limited-data conditions. Using 64 quarterly observations (2010–2025) of Coca-Cola revenue, we implement a recursive forecasting experiment where models are estimated using only past data at each forecast origin—eliminating look-ahead bias. We compare polynomial regression against classical time series methods (ARIMA, SARIMA, Prophet) and machine learning models (Random Forest, XGBoost, LightGBM, CatBoost), with ML models receiving autoregressive features (lags 1, 2, 4, moving averages) and calendar features for a fair comparison. The Bai–Perron test is applied within an expanding-window forecasting protocol to evaluate forecasting under sequential information availability. A cubic polynomial with a level-shift dummy achieves R2 and MAE = USD 0.29 B when the break date is known in advance (ex post benchmark). In the more realistic expanding-window protocol, where the break is detected using only past data, the MAE is USD 0.31 B. Under the specific limited-sample Coca-Cola forecasting setting considered, these results are competitive with classical benchmarks (ARIMA: MAE = 1.34 B; SARIMA: MAE = 1.18 B) and machine learning methods (Random Forest: MAE = 0.38 B; XGBoost: MAE = 0.41 B) while remaining fully interpretable. The framework provides explicit coefficient estimates with direct business meanings, enabling stakeholders to understand and act on forecasts. However, validation on PepsiCo data illustrates limited transferability without recalibration, indicating that the framework should not be assumed to generalize broadly.
Full article

Figure 1
Open AccessArticle
Forecasting Demand Under Limited Data: Benchmark Models for Workforce Capacity Planning in Translation Services
by
Lorena Hernández-Mastrapa, Daniel René Tasé-Velázquez, Renato Máximo-Sátiro, Gelmar García-Vidal, Alexander Sánchez-Rodríguez and Reyner Pérez-Campdesuñer
Forecasting 2026, 8(5), 85; https://doi.org/10.3390/forecast8050085 - 13 Sep 2026
Abstract
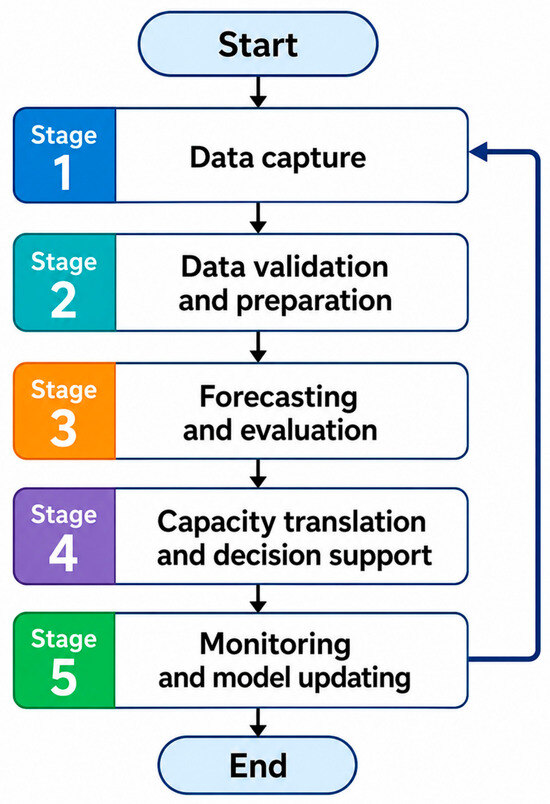
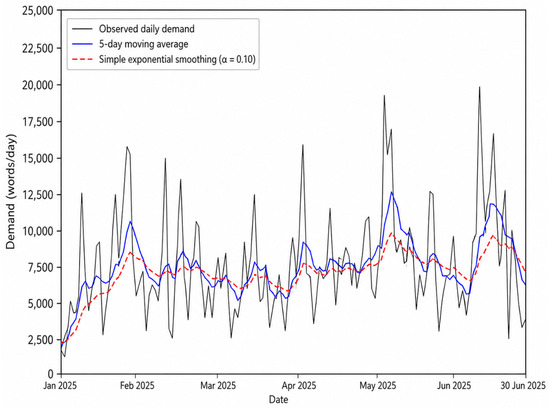
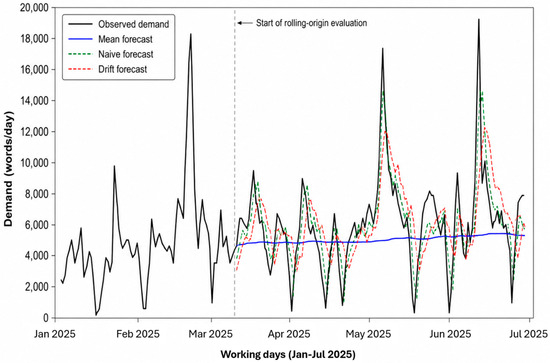
Demand variability complicates workforce capacity planning in knowledge-intensive services, particularly when only short historical records are available. This study evaluates parsimonious benchmark models for forecasting translation-service demand and translating the resulting forecasts into staffing requirements. The empirical analysis used 122 daily observations collected
[...] Read more.
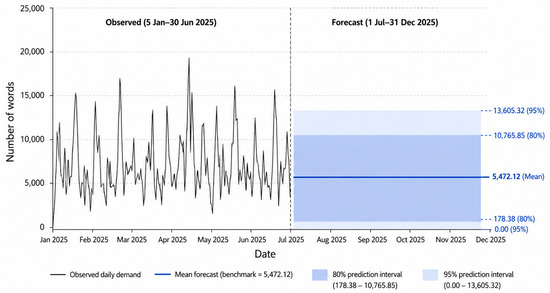
Demand variability complicates workforce capacity planning in knowledge-intensive services, particularly when only short historical records are available. This study evaluates parsimonious benchmark models for forecasting translation-service demand and translating the resulting forecasts into staffing requirements. The empirical analysis used 122 daily observations collected over six months from a translation team providing services in English and Spanish. Demand was measured as the number of words requested per working day, while nominal individual capacity was operationalized as 2000 translated words per day. Three benchmark forecasting methods—Naive, Mean, and Drift—were compared through expanding-window rolling-origin evaluation using ME, MAE, RMSE, MASE, and sMAPE. At the one-working-day horizon, the Mean benchmark achieved the lowest MAE (3221.66 words), RMSE (4424.81 words), MASE (0.845), and sMAPE (58.14%), and it maintained the lowest values for these measures at five- and twenty-working-day horizons. Re-estimated using all 122 observations, the Mean benchmark generated a point forecast of 5472.12 words per working day, equivalent to 2.74 translator-equivalents and a baseline requirement of three translators under the nominal productivity assumption. However, observed demand exceeded three-translator capacity on 34.43% of working days, indicating the need for flexible contingency capacity. The study provides a transparent framework connecting benchmark forecast evaluation with workforce-capacity decisions under limited temporal coverage.
Full article
(This article belongs to the Special Issue Benchmark Models in Time Series Forecasting)
►▼
Show Figures

Figure 1

Open AccessArticle
Bio-Inspired Hyperparameter Optimization of LSTM Networks for Long-Horizon Stock Price Forecasting
by
Manan Bhasin, Rajesh Mahadeva, Amit Kumar Goyal and Varun Sarda
Forecasting 2026, 8(5), 84; https://doi.org/10.3390/forecast8050084 - 12 Sep 2026
Abstract
►▼
Show Figures
Accurate stock price forecasting remains a challenging problem because financial markets are highly dynamic, nonlinear, and influenced by changing economic conditions. Deep learning models, particularly Long Short-Term Memory (LSTM) networks, have shown strong capability in capturing temporal dependencies in financial time series. However,
[...] Read more.
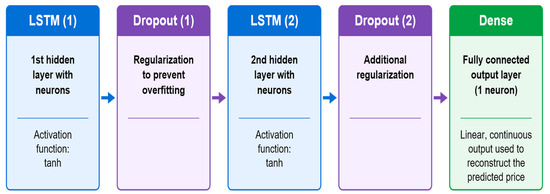
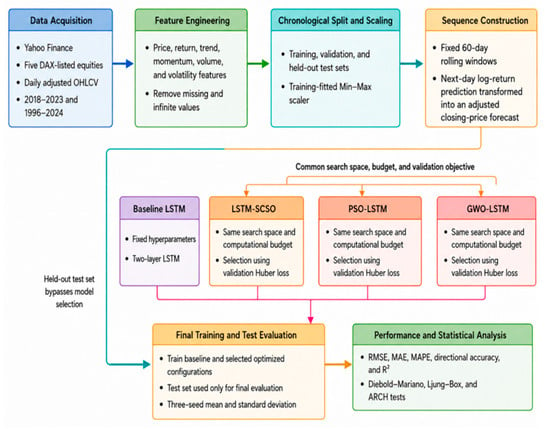
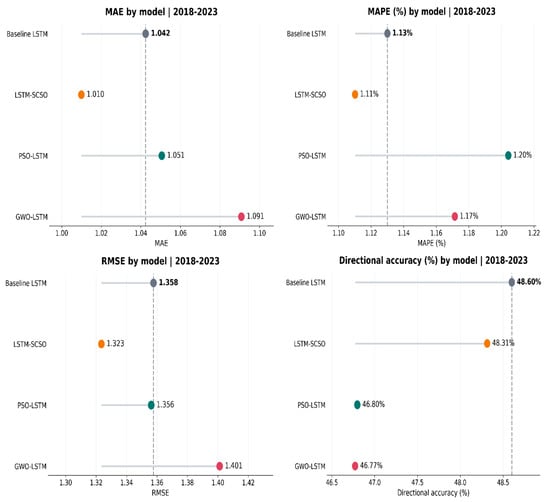
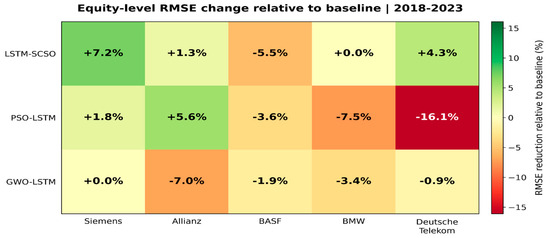
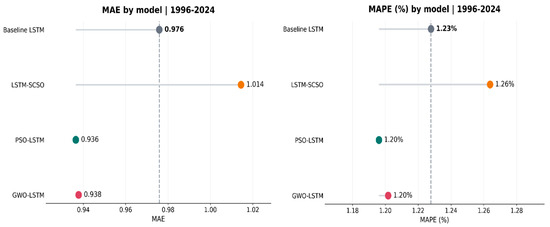
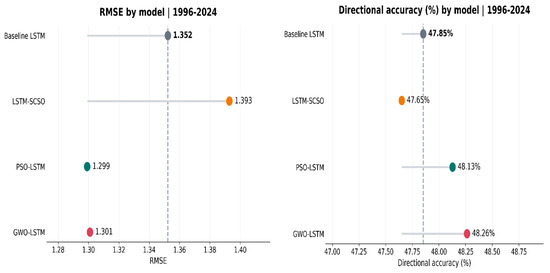
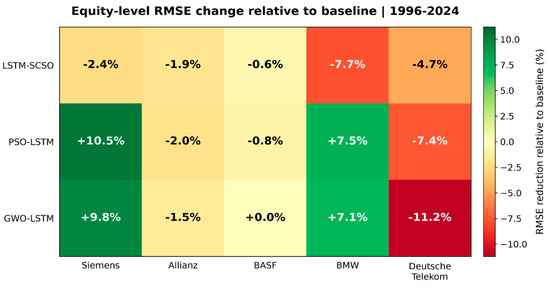
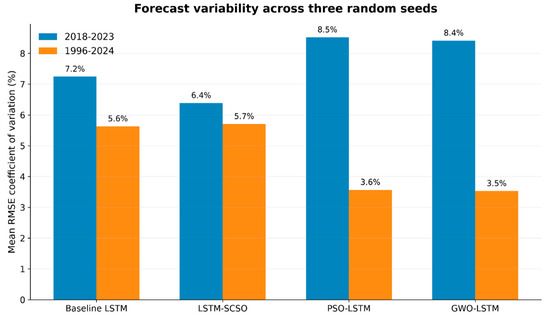
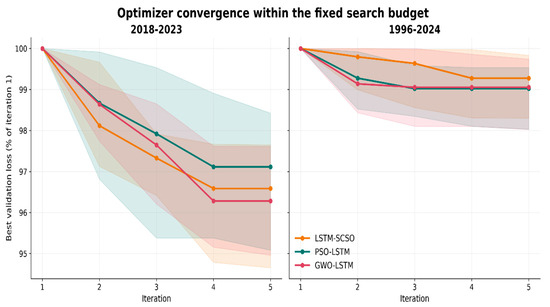
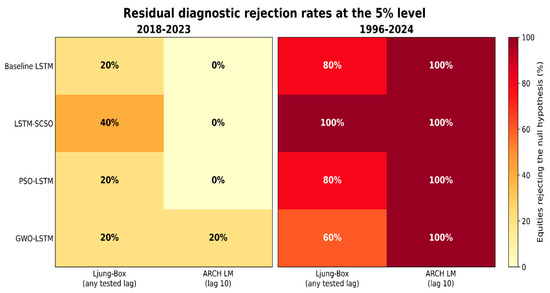
Accurate stock price forecasting remains a challenging problem because financial markets are highly dynamic, nonlinear, and influenced by changing economic conditions. Deep learning models, particularly Long Short-Term Memory (LSTM) networks, have shown strong capability in capturing temporal dependencies in financial time series. However, their performance is often sensitive to hyperparameter selection, which can affect convergence, stability, and generalization. This research presents a comparative forecasting framework using three bio-inspired hyperparameter optimization algorithms: Sand Cat Swarm Optimization (SCSO), Particle Swarm Optimization (PSO), and Grey Wolf Optimization (GWO). Each of the optimization algorithms works on a common hyperparameter search space comprising the learning rate, dropout rate, batch size and number of units in the LSTM layers, while the input sequence length is fixed at 60 trading days. The models are compared with a fixed-hyperparameter baseline LSTM to validate whether hyperparameter optimization improves price forecasting. The models are evaluated using daily data from five DAX-index equities over two sample periods: 2018–2023 and 1996–2024, respectively, with 2023 and 2019–2024 being their respective held-out test sets. The LSTM predicts the next-trading-day log return, which is transformed into a forecast of the next adjusted closing price. Historical prices and technical indicators representing trend, momentum, and volatility are incorporated into the modeling process. Chronological data splitting, training-only scaler fitting, validation-based hyperparameter selection, and a held-out test set used exclusively for final evaluation are employed to limit look-ahead bias, with every model evaluated across three random seeds. Model performance is assessed using Mean Absolute Error (MAE), Root Mean Squared Error (RMSE), Mean Absolute Percentage Error (MAPE), coefficient of determination (R2) and directional accuracy, along with support from Diebold–Mariano tests and Ljung–Box and ARCH residual diagnostics. LSTM–SCSO achieves the strongest aggregate error performance during 2018–2023, reducing mean RMSE by approximately 2.5% relative to the baseline. During 1996–2024, PSO–LSTM ranks first on RMSE, MAE, and MAPE, reducing mean RMSE by approximately 3.9%, while GWO–LSTM produces closely comparable results. Optimized models record the lowest equity-level mean RMSE for four of five equities in the short-term experiment and three of five equities in the long-term experiment. However, Diebold–Mariano significance varies across model–equity comparisons, and aggregate directional accuracy remains below 50% for all models in both periods. Long-term residual diagnostics also identify substantial autocorrelation and ARCH effects. The findings demonstrate that bio-inspired metaheuristic optimization can improve one-step-ahead LSTM forecasts, but its benefits depend on the optimizer, equity, and historical evaluation period.
Full article

Figure 1
Open AccessArticle
A Generalized Bayesian Structural Time Series Framework for Forecasting Seasonal Data with Sparse Observations
by
Autcha Araveeporn
Forecasting 2026, 8(5), 83; https://doi.org/10.3390/forecast8050083 - 10 Sep 2026
Abstract
►▼
Show Figures
This study proposes a Generalized Bayesian Structural Time Series (GBSTS) framework for forecasting seasonal time series with sparse observations. Rather than introducing new state-space components, the proposed framework systematically integrates alternative trend and seasonal specifications with multiple missing-data reconstruction strategies within a unified
[...] Read more.
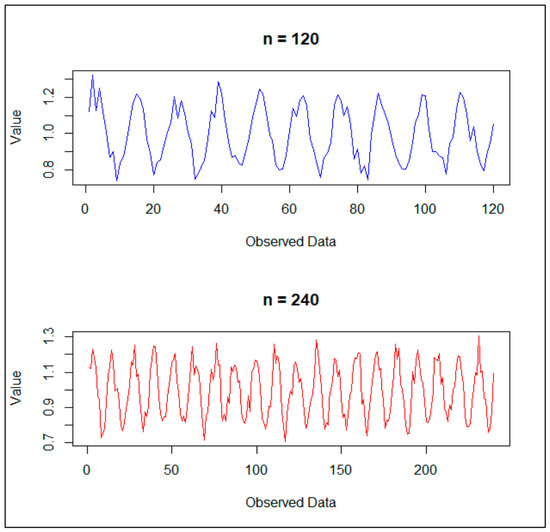
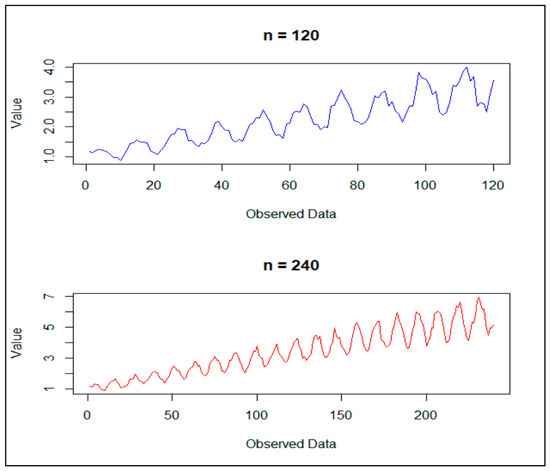
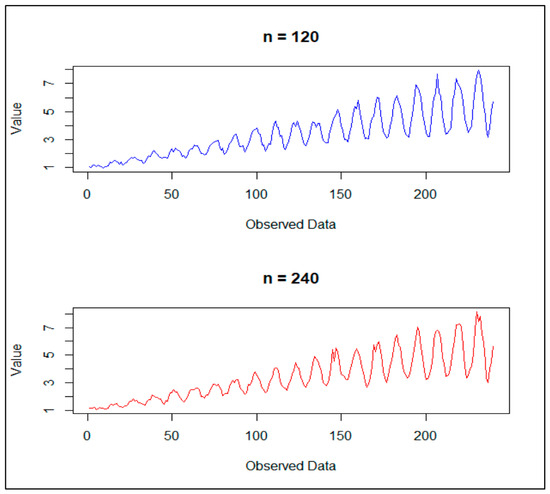
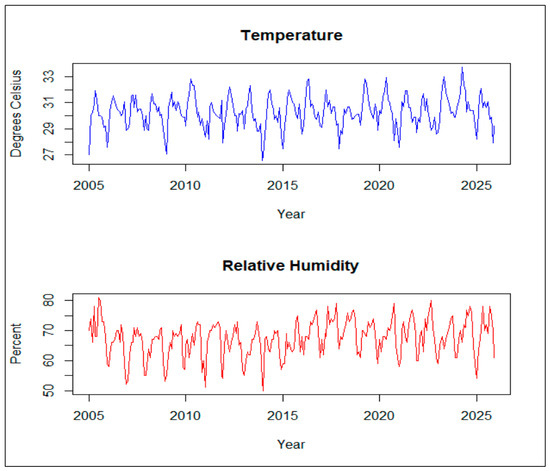
This study proposes a Generalized Bayesian Structural Time Series (GBSTS) framework for forecasting seasonal time series with sparse observations. Rather than introducing new state-space components, the proposed framework systematically integrates alternative trend and seasonal specifications with multiple missing-data reconstruction strategies within a unified Bayesian state-space formulation. This integration enables the joint assessment of structural model specification and missing-data treatment under varying sample sizes, seasonal structures, and levels of data sparsity. Forecasting performance is evaluated through a Monte Carlo simulation study considering different seasonal mechanisms, missing-data rates of 10%, 30%, and 50%, and a fixed 12-month forecasting horizon. An empirical analysis of monthly temperature and relative humidity series is additionally conducted to assess the practical applicability of the proposed framework. The results show that the GBSTS with a local linear trend and trigonometric seasonal component achieved the best overall forecasting performance among the models considered, demonstrating robust predictive accuracy across varying data conditions and levels of sparsity. Among the imputation methods examined, Kalman smoothing and seasonal split generally yielded comparable forecasting performance across different data conditions and levels of sparsity. Overall, the findings indicate that integrating flexible structural specifications and missing-data reconstruction within the GBSTS framework provides an effective and interpretable Bayesian approach for forecasting seasonal time series with sparse observations.
Full article

Figure 1
Open AccessArticle
Too Sharp to Be True? Illusory Gains in Regime-Weighted Conformal Prediction for Daily Rubber Price Changes
by
Montchai Pinitjitsamut
Forecasting 2026, 8(5), 82; https://doi.org/10.3390/forecast8050082 - 10 Sep 2026
Abstract
►▼
Show Figures
This study audits whether regime weighting can sharpen conformal forecast intervals without using target-period information or omitting the required finite-sample correction. Conformal prediction builds such intervals from past forecast errors. A natural refinement gives more weight to errors from days whose volatility resembles
[...] Read more.
This study audits whether regime weighting can sharpen conformal forecast intervals without using target-period information or omitting the required finite-sample correction. Conformal prediction builds such intervals from past forecast errors. A natural refinement gives more weight to errors from days whose volatility resembles the forecast day. On daily natural-rubber prices, the refinement appears to work: intervals become about 20% narrower than plain split-conformal, with a significantly better Winkler score. This paper asks whether that gain is real. Three implementation choices are examined, one at a time. The first uses a regime signal that already sees the price move it is meant to predict. The second estimates the regime model on the same residuals the interval is calibrated on. The third omits a correction that the weighted quantile requires in finite samples. The forecast-feasible construction—predictive regime probabilities, a validation-fitted regime model, and the finite-sample correction—shows no detectable improvement over split-conformal, at a paired Winkler difference of (95% CI to ). Applying the correction alone is not always enough: it removes the apparent advantage on the VMD-augmented ridge residuals, but the filtered comparison arm survives it on the AR(1) residuals at . Only withholding target-period information eliminates the artifact on both. Concentrated weights also leave some intervals unbounded, whereas adaptive conformal baselines remain finite throughout. A controlled simulation reproduces the same apparent gain where no regime information exists at all. Apparent sharpness must therefore be audited for information timing, calibration reuse, and the finite-sample correction.
Full article

Figure 1
Open AccessArticle
A Student-t Copula Economic Scenario Generator for Emerging-Market Liability-Driven Investment: Density Forecasting, Tail Dependence, and Indonesian Evidence
by
Fathimah Al-Ma’shumah and Novriana Sumarti
Forecasting 2026, 8(5), 81; https://doi.org/10.3390/forecast8050081 - 9 Sep 2026
Abstract
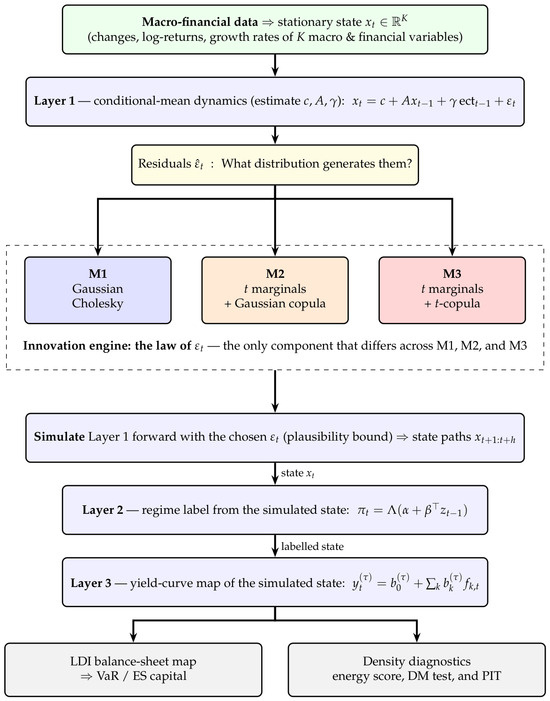
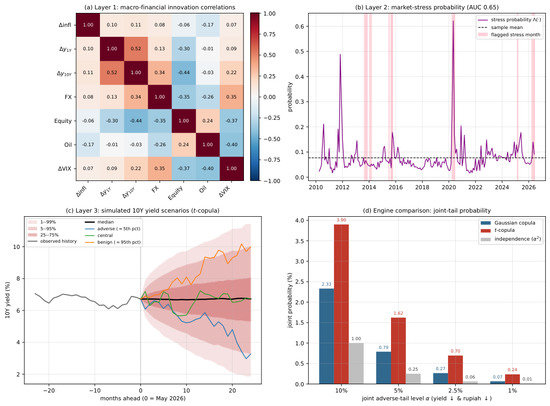
Pension funds and insurers in emerging markets size long-horizon capital with economic scenario generators (ESGs)—econometrically, simulators of a multivariate predictive density. The production benchmark draws its innovations by Gaussian Cholesky factorization, forcing thin marginal tails and zero joint tail dependence, so it cannot
[...] Read more.
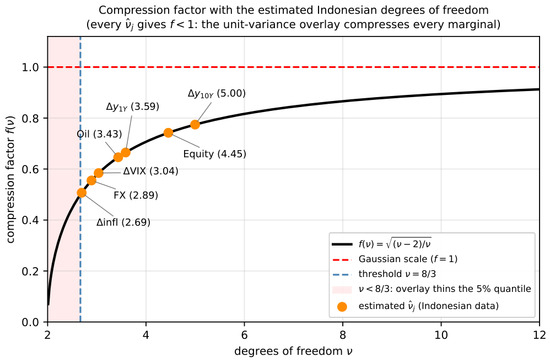
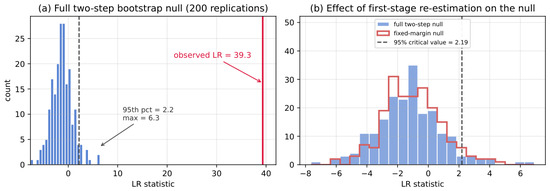
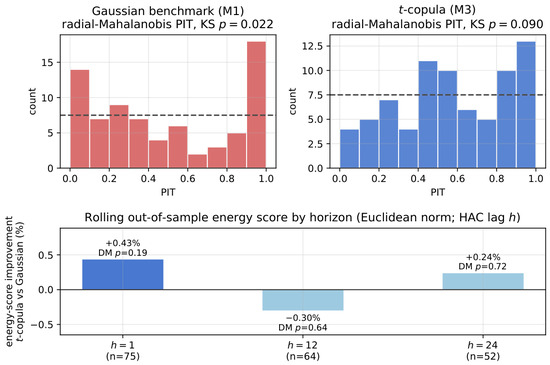
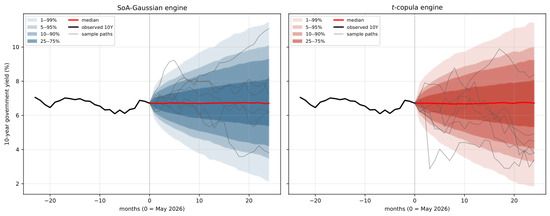
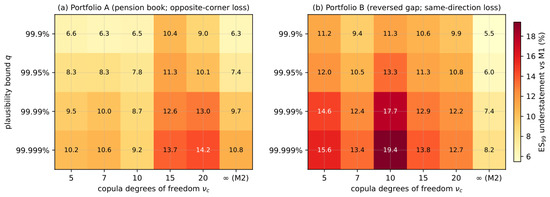
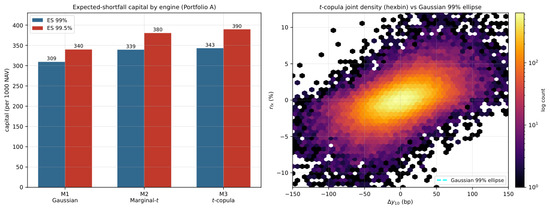
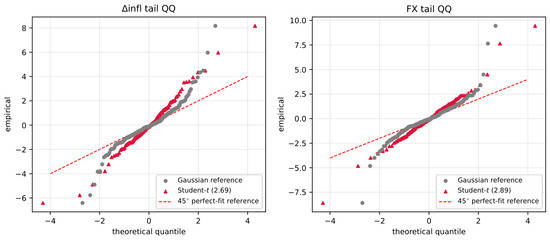
Pension funds and insurers in emerging markets size long-horizon capital with economic scenario generators (ESGs)—econometrically, simulators of a multivariate predictive density. The production benchmark draws its innovations by Gaussian Cholesky factorization, forcing thin marginal tails and zero joint tail dependence, so it cannot generate the simultaneous yield and currency shocks that dominate emerging-market stress; as supervisors move market-risk capital to expected shortfall, a density blind to joint extremes understates the number they now act on. We retain the three-layer liability-driven-investment cascade but replace its innovation engine with a Student-t copula over Student-t marginals, a more general specification of which the Gaussian benchmark is a special case, and validate it on Indonesian data from February 2010 to May 2026. A boundary-corrected bootstrap test rejects the Gaussian dependence structure; the heavy-tailed engine is the better-calibrated joint density forecast both in sample and in real-time rolling evaluation, with a scoring advantage that is clear in sample and small in real time; and the Gaussian default understates 99% expected-shortfall capital by about 11%, a direction that is robust across bootstrap resamples and across truncation and tail-heaviness settings, though imprecise in magnitude. Framed as a density forecast and judged by calibration and proper scores, the copula engine is better calibrated and more prudent, pricing the joint extremes the Gaussian default omits.
Full article
(This article belongs to the Section Forecasting in Economics and Management)
►▼
Show Figures

Figure 1
Open AccessArticle
Recurrent Deep Learning Models for PM2.5 Time Series Forecasting in Northern Thailand
by
Nawisa Jullapech, Mohamed Fazil Baksh and Suttida Sangpoom
Forecasting 2026, 8(5), 80; https://doi.org/10.3390/forecast8050080 - 8 Sep 2026
Abstract
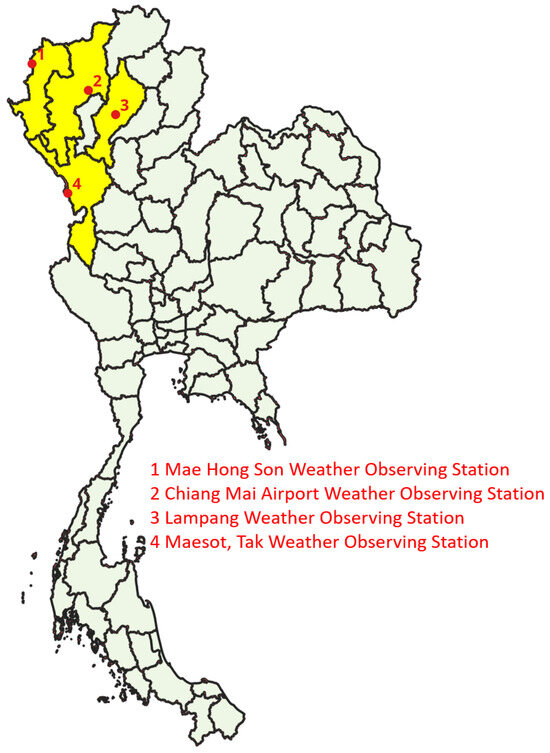
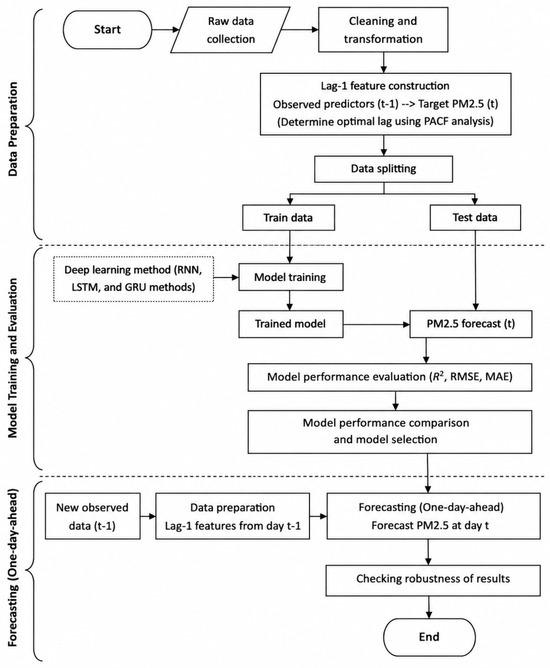
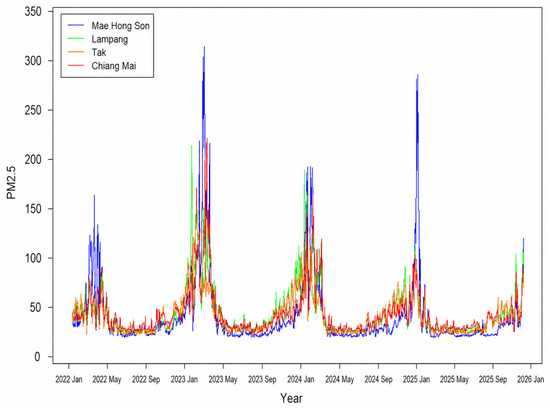
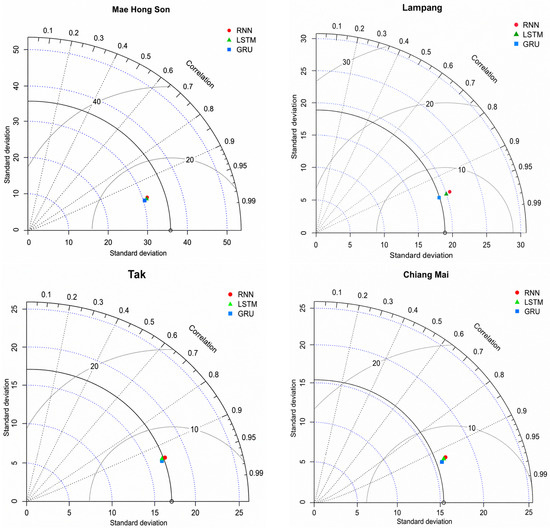
Forecasting concentrations remains a challenging data science problem because of strong nonlinearity, temporal dependence, and pronounced nonstationarity associated with seasonal and episodic pollution events. This study presents a comparative evaluation of recurrent neural network architectures for one-day-ahead forecasting using
[...] Read more.
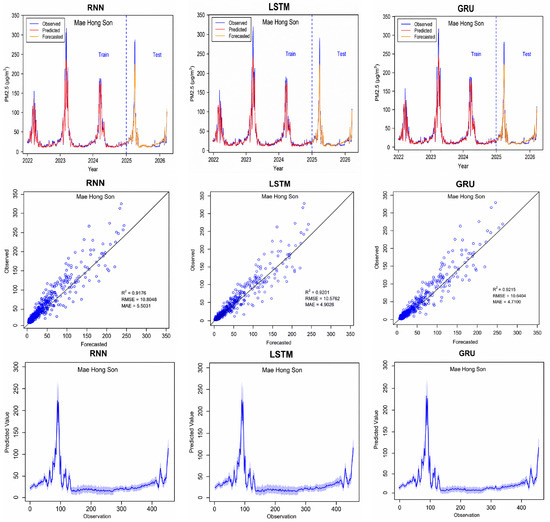
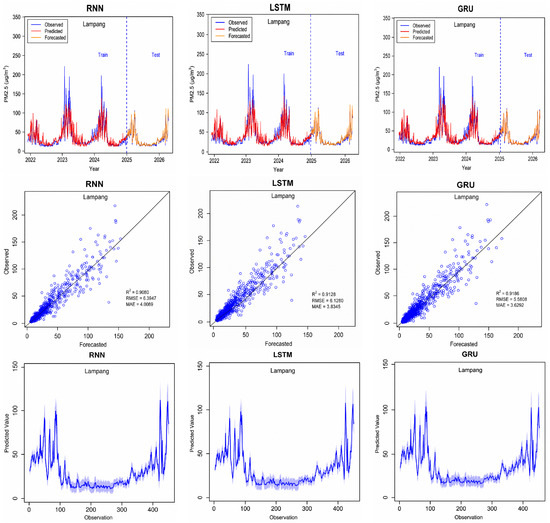
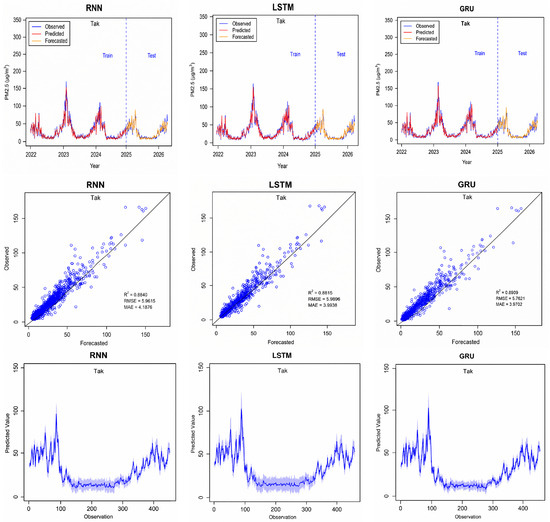
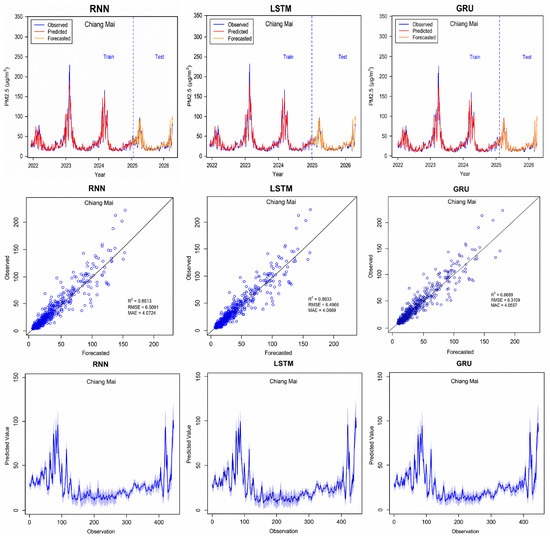
Forecasting concentrations remains a challenging data science problem because of strong nonlinearity, temporal dependence, and pronounced nonstationarity associated with seasonal and episodic pollution events. This study presents a comparative evaluation of recurrent neural network architectures for one-day-ahead forecasting using daily observations from four provinces in northern Thailand with varying pollution dynamics. Standard RNN, LSTM, and GRU models were developed within a unified forecasting framework using historical concentrations and meteorological variables as predictors. Model performance was evaluated on an independent test dataset using , , and , together with Diebold–Mariano tests based on forecast error series. The experimental results indicate that the GRU model provides more robust forecasting performance under conditions of strong volatility and nonstationary behaviour, while the LSTM and RNN models remain competitive in comparatively more stable environments. No single model consistently dominated across all provinces, indicating that forecasting effectiveness depends strongly on the temporal characteristics of local air pollution dynamics rather than on architectural complexity alone. While all models capture the overall seasonal structure of variation, extreme pollution peaks are systematically underestimated partly because MSE-based training biases predictions toward the central tendency of the data distribution. However, gated architectures show improved responsiveness to abrupt concentration changes relative to the standard RNN. These findings highlight the importance of matching recurrent architectural design to the temporal regime of the target environment.
Full article
(This article belongs to the Special Issue Forecasting Impacts of Air Pollution and Hydro-Meteorological Extremes: Models, Methods, and Applications)
►▼
Show Figures

Figure 1

Open AccessArticle
Does Machine Learning Improve Wind Power Forecasting? An Experimental Investigation
by
Zhimin Li, Yu Chen, Tingzhao Yu, Ruyi Yang, Yan Huang, Kuoyin Wang, Yongyan Su, Jinbing Gao and Bin Yuan
Forecasting 2026, 8(5), 79; https://doi.org/10.3390/forecast8050079 - 7 Sep 2026
Abstract
Accurate wind power forecasting is essential for the stable and economic operation of power systems with high renewable penetration. Although machine learning models have been widely adopted for this task, the assumption that greater model complexity invariably yields superior forecasting accuracy has received
[...] Read more.
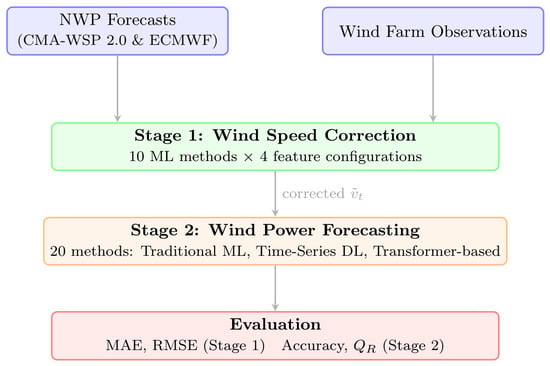
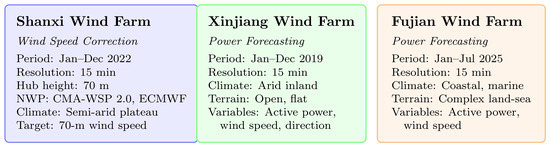
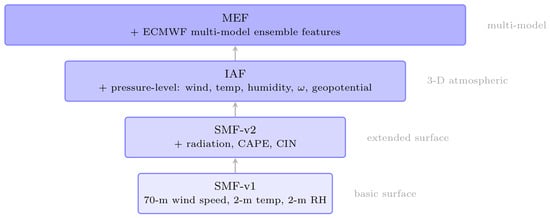
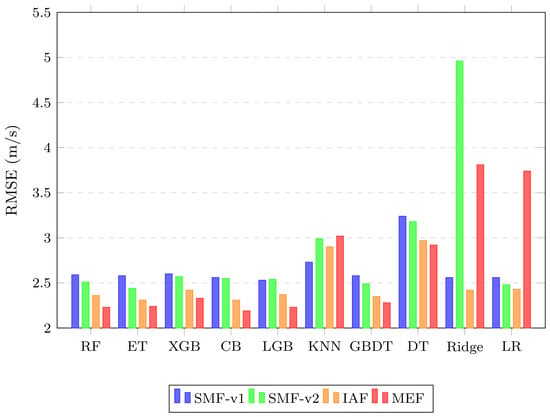
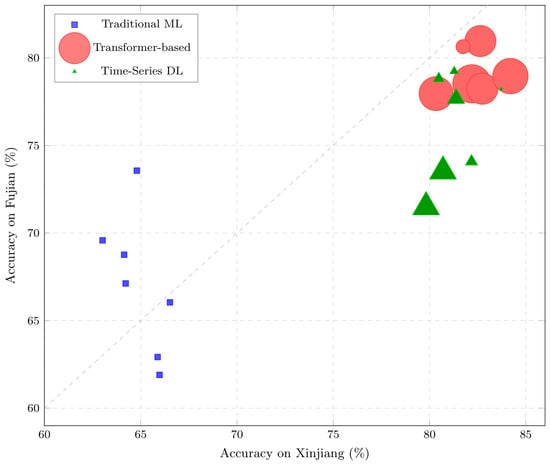
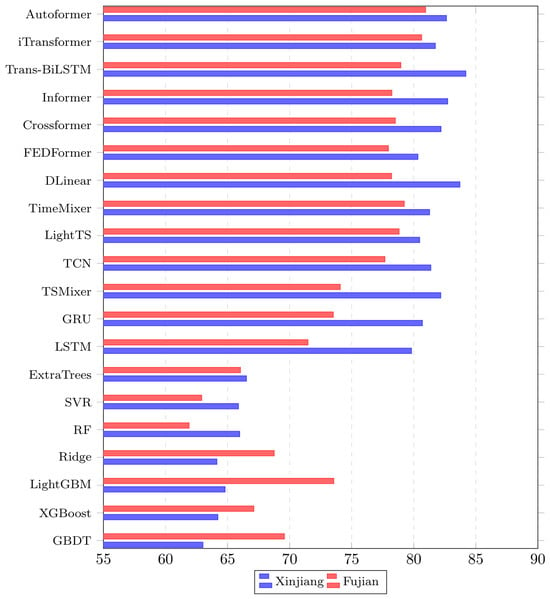
Accurate wind power forecasting is essential for the stable and economic operation of power systems with high renewable penetration. Although machine learning models have been widely adopted for this task, the assumption that greater model complexity invariably yields superior forecasting accuracy has received insufficient scrutiny. This paper presents a systematic experimental investigation that covers two complementary stages, i.e., wind speed correction and wind power forecasting. For wind speed correction, we compare 10 machine learning methods, including spanning linear, instance-based, and tree-based ensemble learners, under four newly proposed progressively enriched feature configurations. For wind power forecasting, we benchmark 20 methods spanning traditional machine learning, time-series deep learning, and Transformer-based architectures on two geographically distinct wind farms. Our results reveal a clear task-dependent pattern. In wind speed correction, tree-based ensemble methods, particularly gradient boosting variants, consistently dominate, and feature engineering contributes more to accuracy gains than model selection. In wind power forecasting, deep learning architectures substantially and consistently outperform traditional methods, with attention-based models generalizing the most robustly across regimes and recurrent networks proving to be the most sensitive to regime shifts. These findings provide actionable task-specific guidance for model selection in operational wind power forecasting systems.
Full article
(This article belongs to the Special Issue Benchmark Models in Time Series Forecasting)
►▼
Show Figures

Figure 1

Open AccessArticle
Forecasting the FIFA World Cup 2026 with Large Language Models: A Benchmark of Reasoning, Web-Augmented, Agentic, and Open-Weight AI Systems
by
Ádám Hartvég, Domonkos Dékány, Barbara Simon, Szász László and Dénes-Fazakas Lehel
Forecasting 2026, 8(5), 78; https://doi.org/10.3390/forecast8050078 - 4 Sep 2026
Abstract
Large language models are increasingly used for tasks that require prediction, interpretation, and decision support, yet their behavior in complex sports forecasting is still not well understood. This study evaluates how different large language models perform in predicting the FIFA World Cup 2026
[...] Read more.
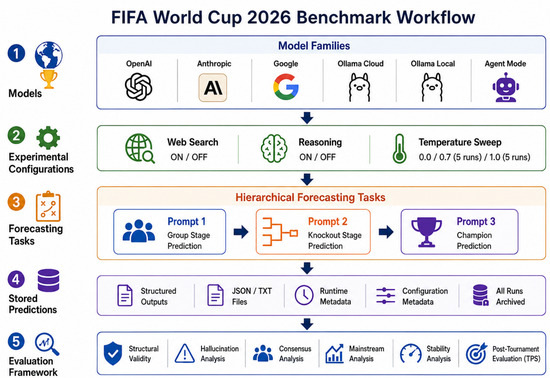
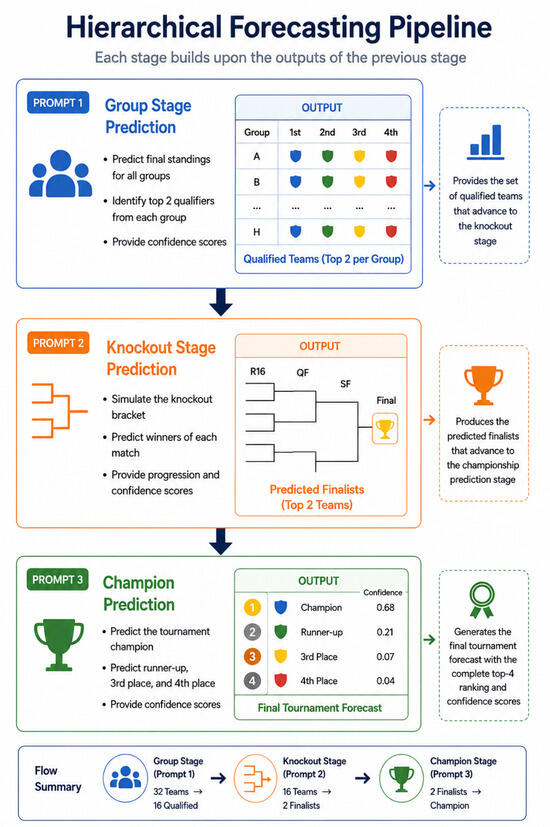
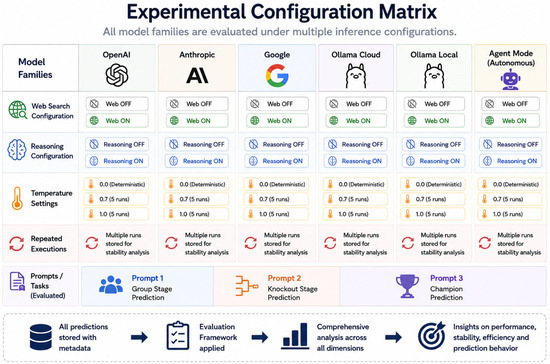
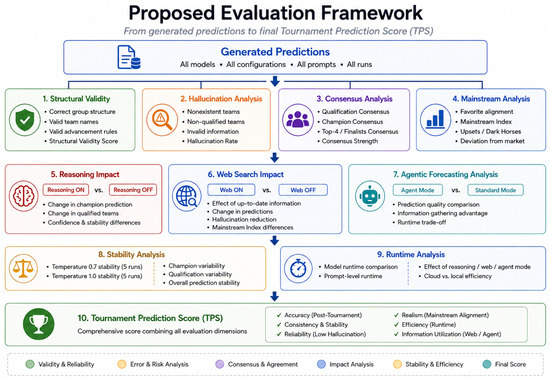
Large language models are increasingly used for tasks that require prediction, interpretation, and decision support, yet their behavior in complex sports forecasting is still not well understood. This study evaluates how different large language models perform in predicting the FIFA World Cup 2026 under several forecasting settings. The benchmark covers three levels of tournament prediction: the group stage, the knockout stage, and the final outcome of the competition. The evaluation includes proprietary models, cloud hosted models, and open weight models, tested with standard prompting, reasoning-based inference, web search support, and agent-based forecasting workflows. The analysis goes beyond simple winner prediction and examines structural validity, qualification accuracy, hallucination rate, consistency, forecast plausibility, and agreement with mainstream football expectations. The results indicate that access to current external information has the strongest effect on forecasting reliability. In the OpenAI-based experiments, web supported agent configurations increased structural validity from 58.50 to 90.87 and reduced hallucinations by 78.7 percent. A similar improvement was observed in the Ollama and cloud model group, where web access increased validity from 53.39 to 97.04 and reduced hallucinations by 75.7 percent. Reasoning improved the internal logic of several forecasts, but when it was used without external grounding, it sometimes produced confident but unsupported predictions. These findings suggest that reasoning alone is not sufficient for tournament forecasting when the task depends on current squads, recent performance, injuries, rankings, and evolving football context. The best results were achieved when models combined structured reasoning with access to up to date information. Overall, this study provides a reproducible evaluation framework for large language model-based sports forecasting and shows how grounding, reasoning, and model design influence prediction quality in a complex international tournament setting.
Full article
(This article belongs to the Section AI Forecasting)
►▼
Show Figures

Figure 1
Open AccessArticle
Heterogeneous-Horizon Conformal Ensembles for Online Prediction Under Distribution Shift: An Empirical Comparison with Strongly Adaptive Methods
by
Marzieh Amiri Shahbazi and Ali Baheri
Forecasting 2026, 8(5), 77; https://doi.org/10.3390/forecast8050077 - 1 Sep 2026
Abstract
Online conformal prediction methods such as Adaptive Conformal Inference (ACI) and Fully Adaptive Conformal Inference (FACI) adjust prediction intervals under distribution shift, but their calibration is based on a common stream of recent nonconformity scores. We introduce Population-based Adaptive Conformal Ensembles (PACE), a
[...] Read more.
Online conformal prediction methods such as Adaptive Conformal Inference (ACI) and Fully Adaptive Conformal Inference (FACI) adjust prediction intervals under distribution shift, but their calibration is based on a common stream of recent nonconformity scores. We introduce Population-based Adaptive Conformal Ensembles (PACE), a heuristic method that maintains online conformal quantile calibrators with different window sizes, decay rates, and quantile scales. PACE combines the best-calibrated members through fitness-weighted top-K averaging and periodically refreshes the population using clonal selection. For context, Strongly Adaptive Online Conformal Prediction (SAOCP) is a benchmark method that combines online calibration experts operating over different time intervals and provides a formal strongly adaptive regret guarantee. PACE is heuristic and does not provide an analogous regret or coverage guarantee. We evaluate the method on two synthetic datasets and three real-world time series. Against five adaptive conformal baselines, PACE achieves higher empirical coverage during extreme regimes. Compared with SAOCP, it generally obtains higher coverage by producing wider intervals, resulting in less favorable interval scores on most datasets.
Full article
(This article belongs to the Section AI Forecasting)
►▼
Show Figures

Figure 1
Open AccessArticle
Delayed Marks, Funding Memory, and Forecasting Liquidation-Tail Risk in Crypto Perpetual Futures
by
Edson Pindza and Hopolang Phillip Mashele
Forecasting 2026, 8(5), 76; https://doi.org/10.3390/forecast8050076 - 30 Aug 2026
Abstract
Crypto perpetual futures embed liquidation risk in one chain: leverage and funding move the margin boundary, the mark determines when a crossing is observed, and executable depth determines the concession paid after detection. The primary forecasting question is how to quantify both the
[...] Read more.
Crypto perpetual futures embed liquidation risk in one chain: leverage and funding move the margin boundary, the mark determines when a crossing is observed, and executable depth determines the concession paid after detection. The primary forecasting question is how to quantify both the probability of an isolated-margin boundary breach and the loss hidden by delayed or smoothed detection. This paper develops a first-passage density-forecasting framework in which the executable price is observed through a delayed or smoothed mark, funding is a persistent collateral drain, and liquidation occurs when isolated-margin surplus reaches its maintenance boundary. The output is a joint predictive distribution: a horizon-specific probability of a boundary breach and, conditional on detection, a distribution of catch-up loss. Under a fixed delay, expected overshoot is , and bad-debt probability is a Gaussian tail governed by the latency-to-margin ratio . Its leverage independence is exact only in the constant-maintenance, fixed-non-price-drain benchmark. For time-weighted-average marks, fixed-time variance reduction does not imply liquidation-time safety. A stationary-downcrossing approximation size-biases the stale error in the adverse direction, producing a mean overshoot about times the same-window fixed-delay value. A rolling comparison with historical simulation scores model-consistent margin-breach forecasts from public price and funding paths. The structural forecast has lower Brier scores at over 24-, 72- and 168-hour horizons and across the 24-hour grid, but historical simulation performs better for one-week forecasts at and . The evidence supports a conditional risk-forecasting use of the framework, while not establishing uniform forecast dominance.
Full article
(This article belongs to the Section Forecasting in Economics and Management)
►▼
Show Figures

Figure 1

Open AccessArticle
Regime-Dependent Sectoral Information Transmission in S&P 500 Forecasting
by
László Vancsura, Tibor Tatay and Tivadar Zakár
Forecasting 2026, 8(4), 75; https://doi.org/10.3390/forecast8040075 - 16 Aug 2026
Abstract
►▼
Show Figures
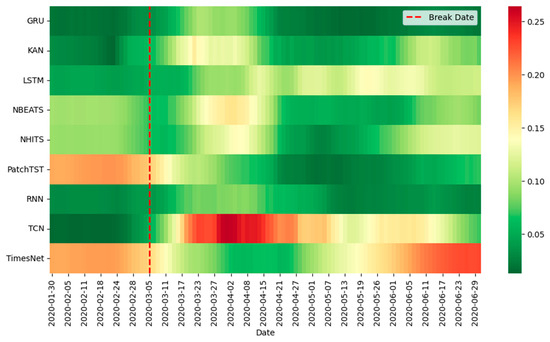
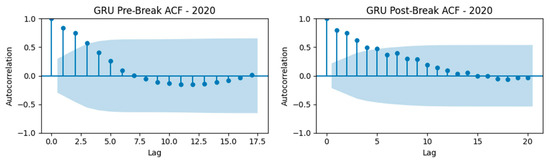
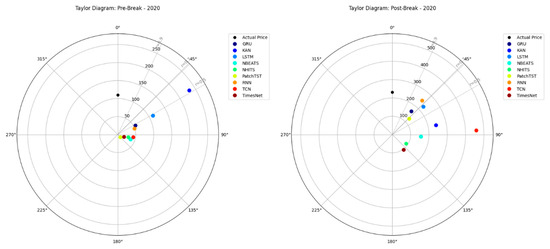
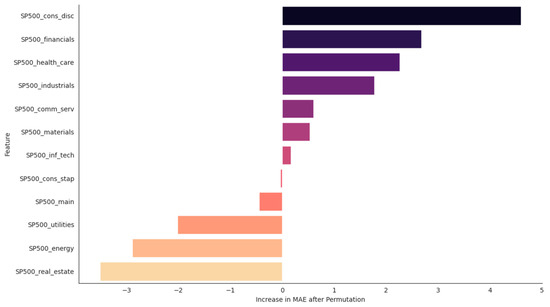
Understanding which segments of the economy drive aggregate stock market movements is central to risk management. This study traces how the economic drivers of the Standard & Poor’s 500 Index (S&P 500) changed across two episodes: the 2020 COVID-19 shock and the 2025
[...] Read more.
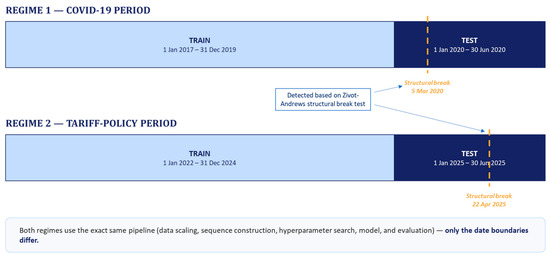
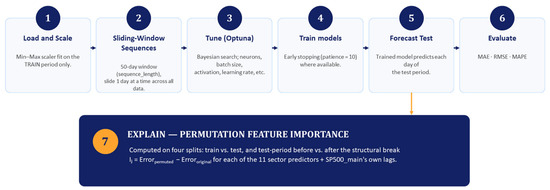
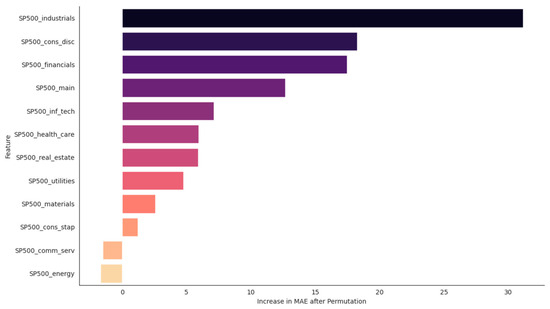
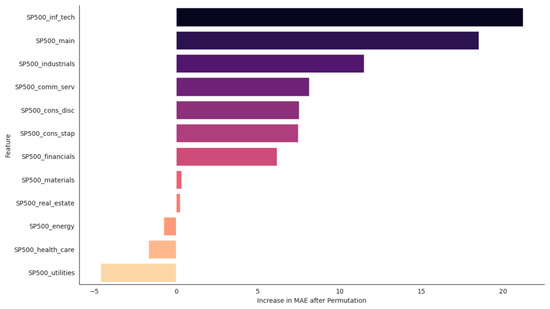
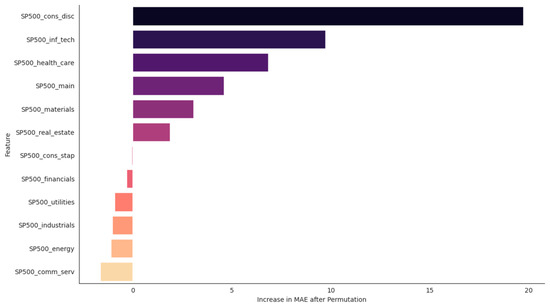
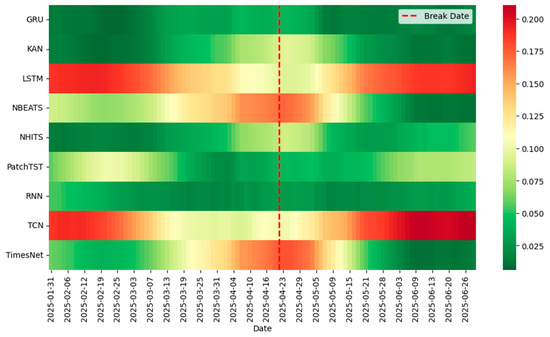
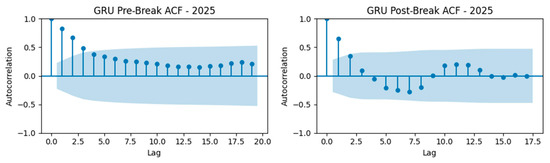
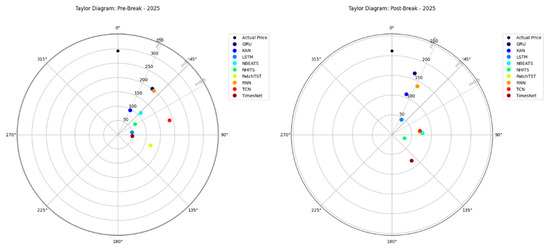
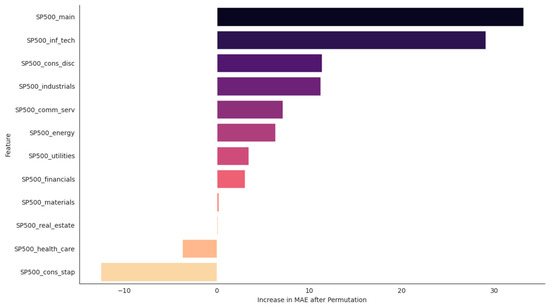
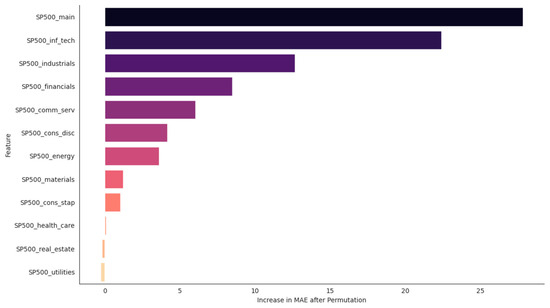
Understanding which segments of the economy drive aggregate stock market movements is central to risk management. This study traces how the economic drivers of the Standard & Poor’s 500 Index (S&P 500) changed across two episodes: the 2020 COVID-19 shock and the 2025 technology-led period, using eleven sector indices and nine deep learning architectures. During COVID-19, forecasting power concentrated in Consumer Discretionary, Health Care, and Industrials before reorganizing sharply around Information Technology, consistent with a disruptive break. In 2025, Information Technology and market momentum dominated throughout, with no comparable reorganization, consistent with a gradual adjustment rather than a disruptive shift. This distinction, invisible from accuracy metrics alone (Gated Recurrent Unit: Mean Absolute Percentage Error = 3.41% and 2.16%), shows that information-concentration diagnostics can complement forecast-accuracy and risk-monitoring frameworks.
Full article

Figure 1
Open AccessArticle
Forecasting the Evolving Composition of Guest Origin Markets in Platform Bookings: A Bayesian Compositional Time-Series Approach Using Airbnb Data
by
Harrison E. Katz
Forecasting 2026, 8(4), 74; https://doi.org/10.3390/forecast8040074 - 16 Aug 2026
Cited by 1
Abstract
►▼
Show Figures
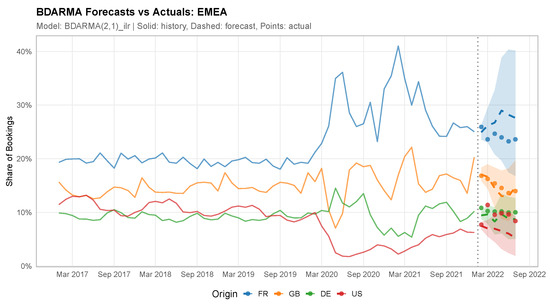
Tourism-demand forecasting overwhelmingly targets aggregate volumes, leaving the question of where demand will come from largely unaddressed. This paper forecasts that question directly. We make three contributions. First, we apply Bayesian Dirichlet autoregressive moving average (BDARMA) models to guest origin composition in large-scale
[...] Read more.
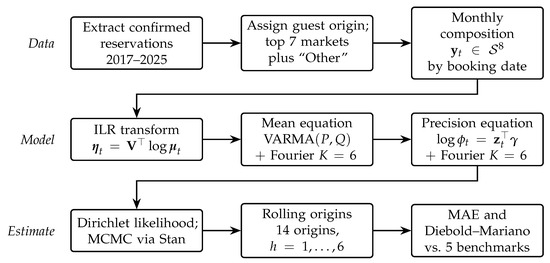
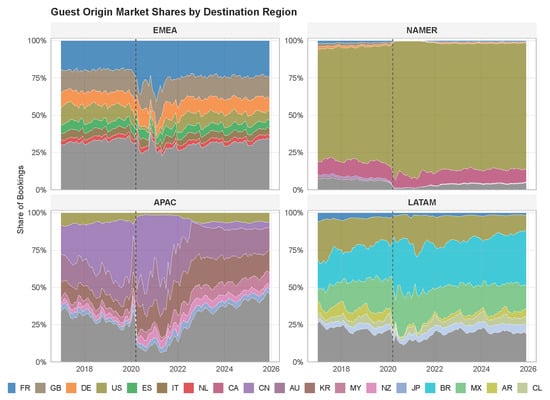
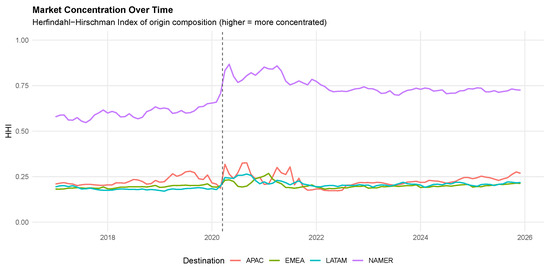
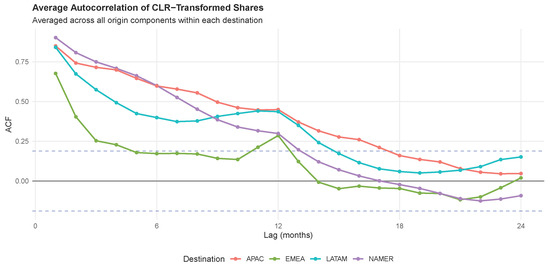
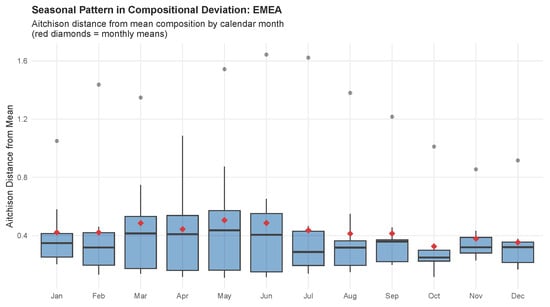
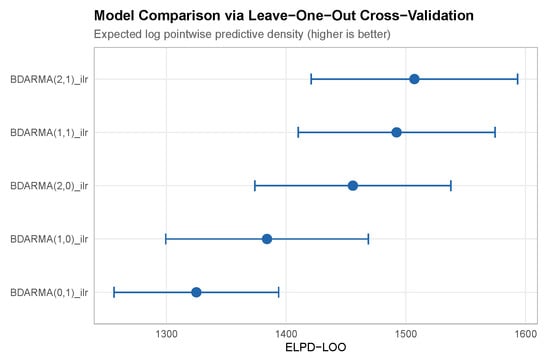
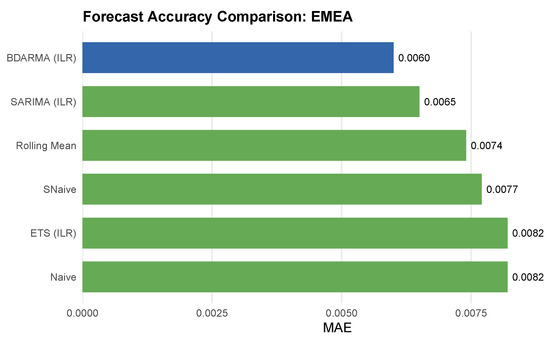
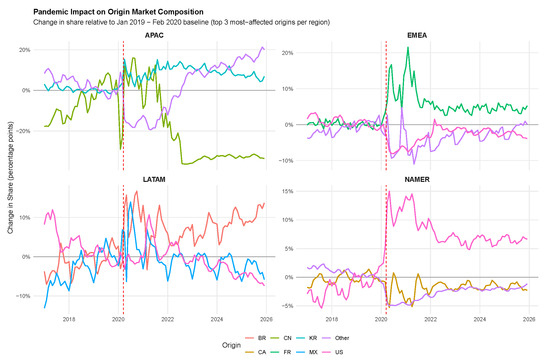
Tourism-demand forecasting overwhelmingly targets aggregate volumes, leaving the question of where demand will come from largely unaddressed. This paper forecasts that question directly. We make three contributions. First, we apply Bayesian Dirichlet autoregressive moving average (BDARMA) models to guest origin composition in large-scale platform booking data, which to our knowledge is the first use of Bayesian compositional time-series methods on booking-origin shares across multiple global destination regions. Second, we introduce seasonal structure in the Dirichlet precision parameter, and we isolate its contribution through an ablation against an otherwise identical constant-precision specification: seasonal precision lowers mean absolute error in all four destination regions, by between 13% and 35%. Third, the forecast target is the monthly composition of bookings indexed by booking date rather than stay date, which makes it observable ahead of realized arrivals and therefore usable for decisions with long lead times. Using proprietary Airbnb reservation data spanning 2017–2025 across four destination regions, we document substantial pandemic-era shifts in booking composition with heterogeneous recovery patterns. In rolling-origin evaluation, BDARMA achieves the lowest forecast error for EMEA, the most compositionally diverse region, reducing mean absolute error by 27% relative to naïve forecasts ( ). Performance elsewhere is mixed: simple benchmarks remain hard to beat, and exponential smoothing on isometric log-ratio-transformed data attains the lowest error averaged across the four regions. The EMEA pattern suggests that direct compositional modeling is most valuable where several origin markets hold material shares, although four destination regions are too few to establish this as a general rule. The methodology yields probabilistic forecasts of source market shares that can inform marketing allocation, concentration-risk monitoring, and forward-looking operational planning.
Full article

Figure 1
Open AccessArticle
Forecasting Multivariate Time Series: A Comparison of Machine Learning, Statistical and Deep Learning Models
by
Dler Hussein Kadir, Diyar Muadh Khalil and Azhin Muhammed Khudhur
Forecasting 2026, 8(4), 73; https://doi.org/10.3390/forecast8040073 - 12 Aug 2026
Abstract
►▼
Show Figures
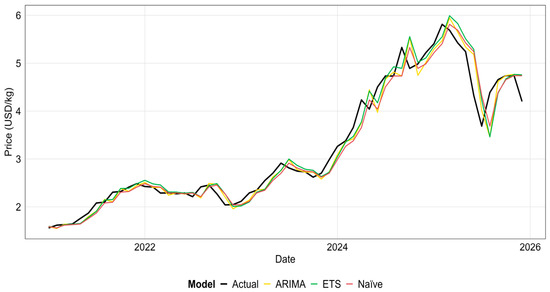
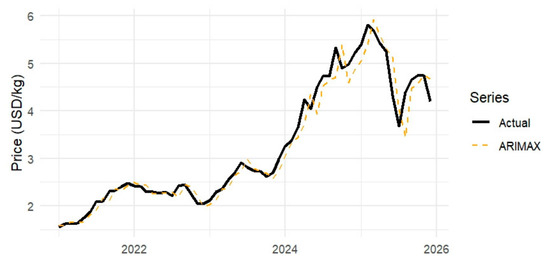
This study develops a rigorous, leakage-free forecasting framework for monthly Robusta coffee prices using historical observations from January 1975 to December 2025. A comprehensive set of explanatory variables is constructed from lagged coffee prices, moving averages, logarithmic returns, rolling volatility, and exogenous variables
[...] Read more.
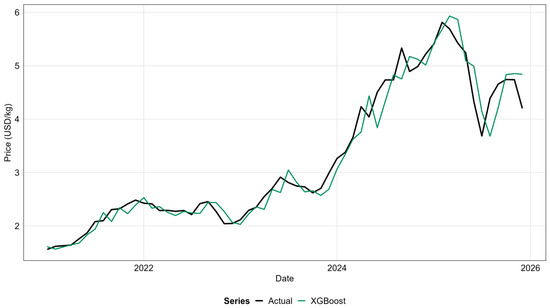
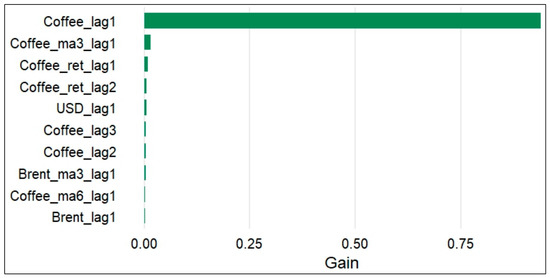
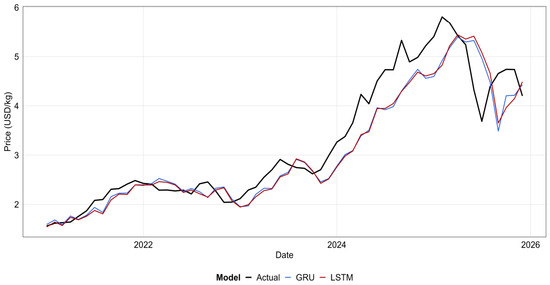
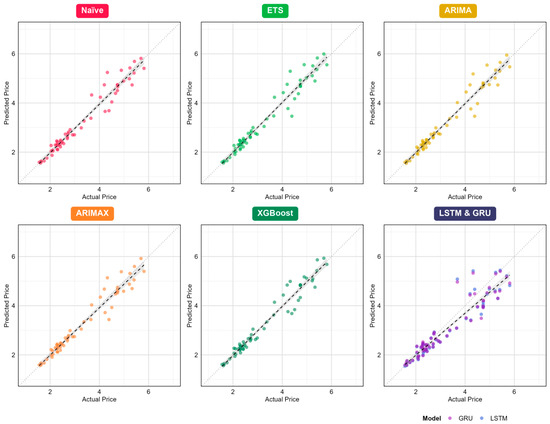
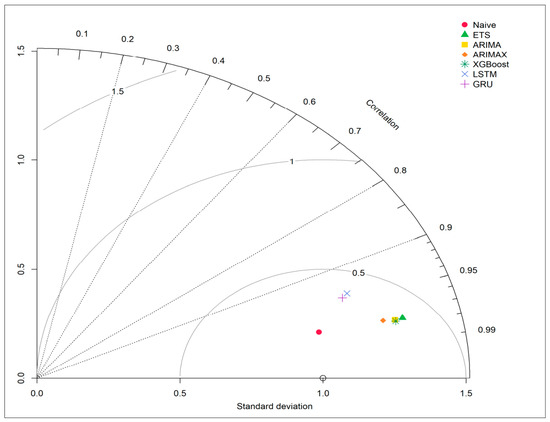
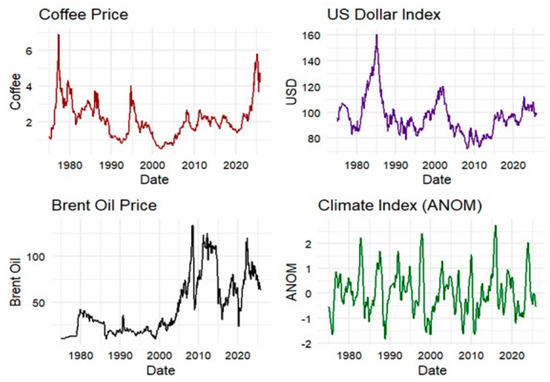
This study develops a rigorous, leakage-free forecasting framework for monthly Robusta coffee prices using historical observations from January 1975 to December 2025. A comprehensive set of explanatory variables is constructed from lagged coffee prices, moving averages, logarithmic returns, rolling volatility, and exogenous variables such as the Oceanic Niño Index (ONI), the U.S. Dollar Index, and Brent crude oil prices. To ensure methodological fairness, all predictors are generated exclusively from information available at the forecast origin, and all competing models are evaluated under a unified expanding-window walk-forward validation framework. Seven forecasting models are compared: Naïve, Exponential Smoothing (ETS), ARIMA, ARIMAX, Extreme Gradient Boosting (XGBoost), Long Short-Term Memory (LSTM), and Gated Recurrent Unit (GRU). Forecasting performance is evaluated using R2, RMSE, MAE, and MAPE, while Taylor diagrams and the Diebold–Mariano test are employed to assess model agreement and differences in predictive accuracy. The results show that XGBoost achieves the highest forecasting accuracy (R2 = 0.956, RMSE = 0.264), followed closely by the Naïve (R2 = 0.954, RMSE = 0.271) and ARIMA (R2 = 0.954, RMSE = 0.270) benchmarks, whereas ARIMAX and ETS provide comparable performance and the deep learning models (LSTM and GRU) produce substantially larger prediction errors. Feature importance analysis further indicates that the first lag of coffee price is the dominant predictor, accounting for approximately 94% of the predictive gain in XGBoost. Overall, the findings demonstrate that rigorous leakage-free validation is essential for reliable forecasting research and that, for monthly Robusta coffee prices, increased model complexity does not necessarily yield superior predictive performance.
Full article

Figure 1
Open AccessReview
Air-Quality Forecasting Across Monitoring, Predictor, and Validation Regimes: A Systematic Mapping Review and Decision Framework
by
Elena Chianese and Angelo Riccio
Forecasting 2026, 8(4), 72; https://doi.org/10.3390/forecast8040072 - 12 Aug 2026
Abstract
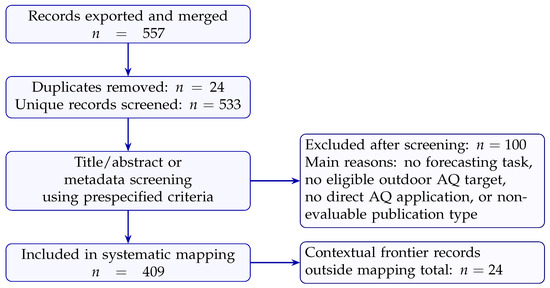
Air-quality forecasting models are often compared by architecture, although reported skill also depends on the pollutant, monitoring density, forecast horizon, predictor latency, validation design, and deployment objective. We conducted a systematic mapping review of 533 unique records published between 2000 and 15 June
[...] Read more.
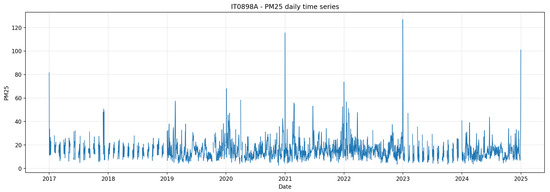
Air-quality forecasting models are often compared by architecture, although reported skill also depends on the pollutant, monitoring density, forecast horizon, predictor latency, validation design, and deployment objective. We conducted a systematic mapping review of 533 unique records published between 2000 and 15 June 2026; 409 met the forecasting eligibility criteria. The evidence was analysed in two layers: a metadata-derived map of the full corpus and a targeted full-text synthesis of representative studies. The non-exclusive metadata categories show that general machine learning or benchmark studies were most common ( ), followed by recurrent deep learning ( ), hybrid or decomposition methods ( ), Transformer or attention models ( ), tree ensembles ( ), CNN/ConvLSTM models ( ), classical statistical methods ( ), graph neural networks ( ), and physics-informed or CTM-coupled methods ( ). These counts describe topical prevalence, not comparative effectiveness. The main contribution is a decision framework that links the forecasting setting to a defensible starting model, the evidence available for that model family, and the minimum validation needed to support temporal, spatial, or external generalisation. The synthesis favours transparent statistical and tabular baselines for short or sparse single-station records; spatial deep models only when network geometry and leave-site-out testing support them; and CTM-coupled postprocessing when operational physical fields are available at issue time. Diffusion and foundation models remain promising but unevenly validated for pollutant forecasting. A leakage-safe daily PM2.5 case study in Naples illustrates the practical consequence: model rankings change with the metric, and every fitted model underestimates the highest 5% of concentrations.
Full article
(This article belongs to the Section Environmental Forecasting)
►▼
Show Figures

Figure 1
Open AccessArticle
Simulator-Grounded Benchmarking and a Corpus-Distilled Physics-Informed Forecaster for Fire Hazard-State and Damage Forecasting
by
Dohun Kim, Seonghee Lee and In-Hwan Lee
Forecasting 2026, 8(4), 71; https://doi.org/10.3390/forecast8040071 - 11 Aug 2026
Abstract
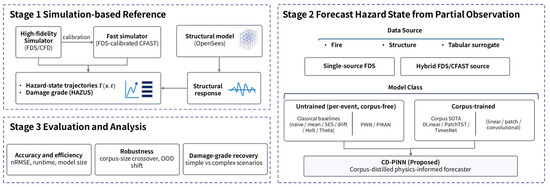
Forecasting research repeatedly finds that simple methods can match or beat complex ones out of sample. We test this in a safety-critical domain, near-real-time prediction of fire hazard state and structural damage, using a simulator-grounded benchmark: high-fidelity computational fluid dynamics (Fire Dynamics Simulator,
[...] Read more.
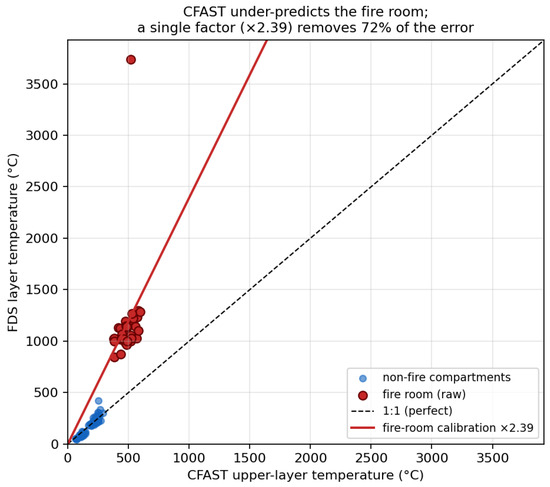
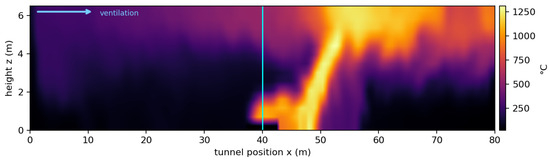
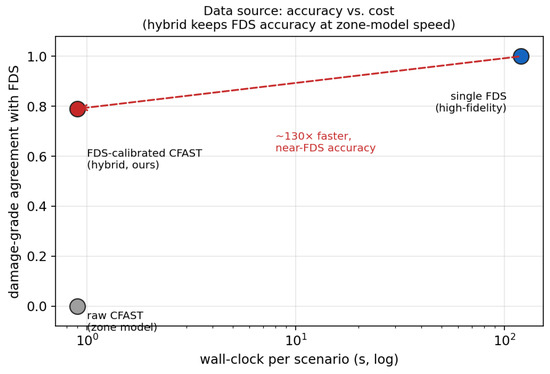
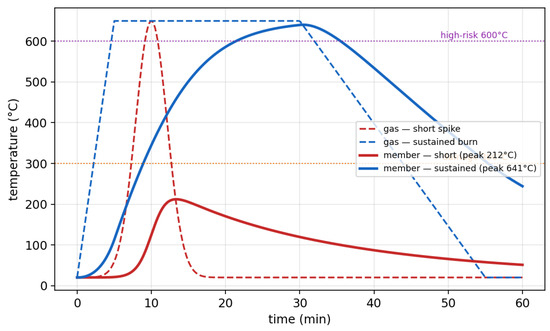
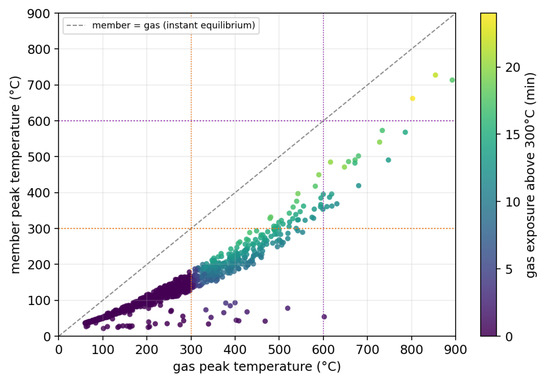
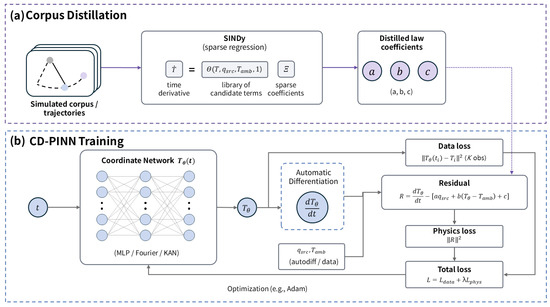
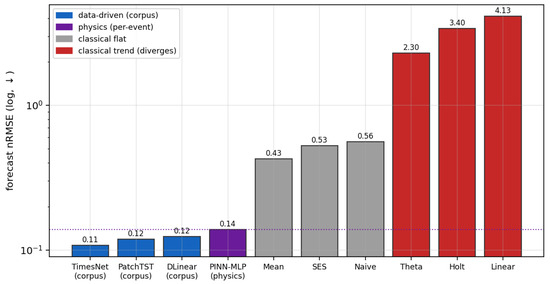
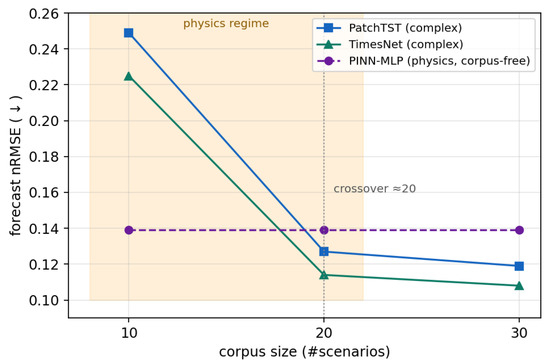
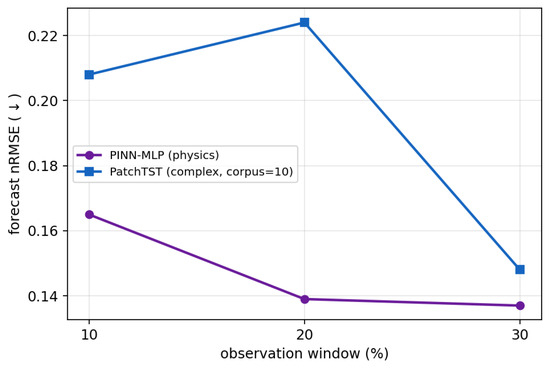
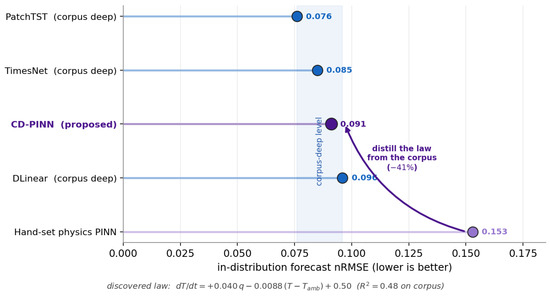
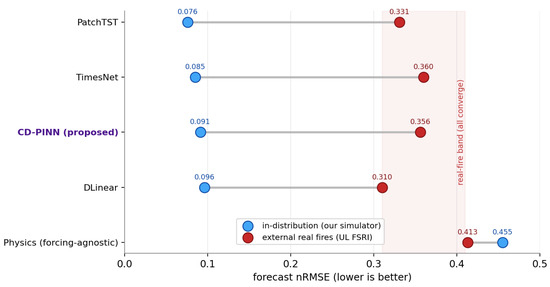
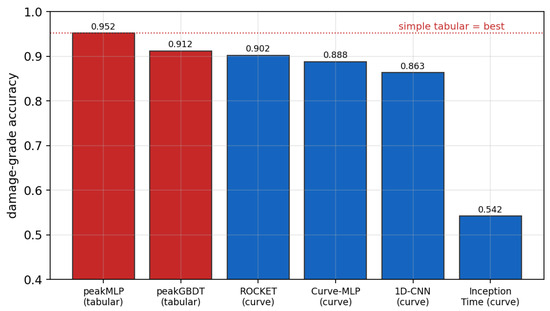
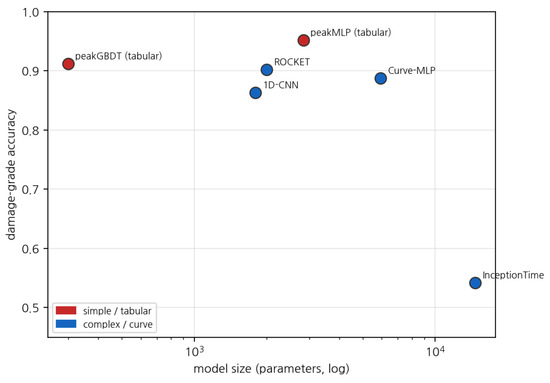
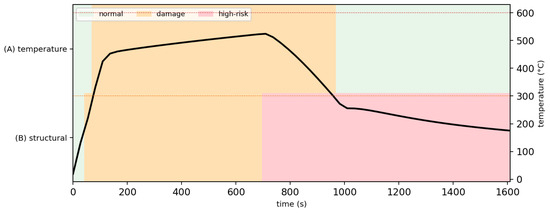
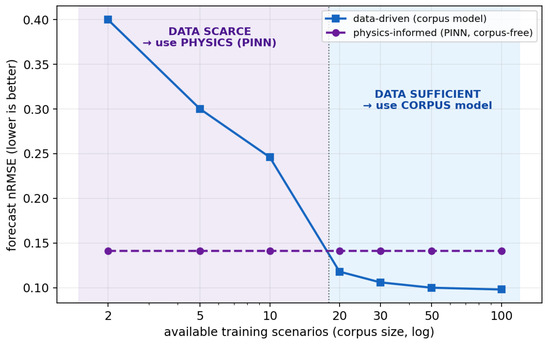
Forecasting research repeatedly finds that simple methods can match or beat complex ones out of sample. We test this in a safety-critical domain, near-real-time prediction of fire hazard state and structural damage, using a simulator-grounded benchmark: high-fidelity computational fluid dynamics (Fire Dynamics Simulator, FDS) provides reference data, an FDS-calibrated zone model (CFAST) generates a large corpus cheaply, and the temperature trajectories drive a finite-element model (OpenSees) and a HAZUS/Eurocode-informed damage rule. Under one protocol we compare simple, deep (PatchTST, TimesNet), and physics-informed (PINN, PIKAN) forecasters. Complex models do not dominate: a small corpus lets parsimonious models approach best accuracy, and physics helps mainly when data are scarce (crossover near twenty scenarios). We propose CD-PINN, which identifies a data-optimal reduced-order physics residual from the corpus by physics-guided regression over a candidate library and uses it as the physics constraint. This lifts a per-event physics model to the accuracy of corpus-trained forecasters while staying interpretable. On 26 laboratory-fire experiments, however, in-distribution rankings do not transfer: the large accuracy spread collapses to near-parity, so a leaderboard poorly predicts laboratory-fire accuracy. For downstream damage, we further show that the label definition, not the model class, sets the achievable ceiling.
Full article
(This article belongs to the Special Issue Benchmark Models in Time Series Forecasting)
►▼
Show Figures

Figure 1
Highly Accessed Articles
Latest Books
E-Mail Alert
News
Topics
Topic in
Applied Sciences, Energies, Forecasting, Solar, Wind, Batteries
Solar and Wind Power and Energy Forecasting, 2nd Edition
Topic Editors: Emanuele Ogliari, Alessandro Niccolai, Sonia LevaDeadline: 31 July 2027
Topic in
Econometrics, Economies, JRFM, Forecasting
Modern Challenges and Innovations in Financial Econometrics
Topic Editors: Agnieszka Szmelter-Jarosz, Hamed NozariDeadline: 31 August 2027
Topic in
Electronics, Energies, Processes, Sci, Sustainability, Wind, Forecasting, Applied Sciences
Advanced Forecasting Methods for Sustainable Power Systems
Topic Editors: Cristina Ventura, Santi Agatino RizzoDeadline: 30 November 2027
Conferences
Special Issues
Special Issue in
Forecasting
Advanced Forecasting in an Era of Uncertainty and Its Impact on Strategic Investment Decisions
Guest Editors: Marek Nagy, Katarina ValaskovaDeadline: 30 November 2026
Special Issue in
Forecasting
Fire Weather in a Warming Climate: From Surface Indices to Atmospheric Dynamics
Guest Editors: Theodore M. Giannaros, Georgios PapavasileiouDeadline: 31 December 2026
Special Issue in
Forecasting
Forecasting Impacts of Air Pollution and Hydro-Meteorological Extremes: Models, Methods, and Applications
Guest Editors: Chibuike Chiedozie Ibebuchi, Richard DamoahDeadline: 31 December 2026
Special Issue in
Forecasting
Feature Papers of Forecasting 2026
Guest Editor: Sonia LevaDeadline: 31 December 2026
Topical Collections
Topical Collection in
Forecasting
Supply Chain Management Forecasting
Collection Editors: Gokhan Egilmez, Juan Ramón Trapero Arenas