
Journal Description
Hydrology
Hydrology
is an international, peer-reviewed, open access journal on hydrology published monthly online by MDPI. The American Institute of Hydrology (AIH) and Japanese Society of Physical Hydrology (JSPH) are affiliated with Hydrology and their members receive discounts on the article processing charges.
- Open Access— free for readers, with article processing charges (APC) paid by authors or their institutions.
- High Visibility: indexed within Scopus, ESCI (Web of Science), PubAg, GeoRef, and other databases.
- Journal Rank: JCR - Q2 (Water Resources) / CiteScore - Q1 (Oceanography)
- Rapid Publication: manuscripts are peer-reviewed and a first decision is provided to authors approximately 16.5 days after submission; acceptance to publication is undertaken in 3.6 days (median values for papers published in this journal in the first half of 2026).
- Recognition of Reviewers: reviewers who provide timely, thorough peer-review reports receive vouchers entitling them to a discount on the APC of their next publication in any MDPI journal, in appreciation of the work done.
- Journal Clusters of Water Resources: Water, Journal of Marine Science and Engineering, Hydrology, Resources, Oceans, Limnological Review, Coasts and Hydropower.
Impact Factor:
3.1 (2025);
5-Year Impact Factor:
3.4 (2025)
Latest Articles
Hydroclimatic Variability and Floodplain Wetland Dynamics in the Magdalena River: A Case Study of Zambrano, Colombia
Hydrology 2026, 13(8), 202; https://doi.org/10.3390/hydrology13080202 (registering DOI) - 25 Jul 2026
Abstract
►
Show Figures
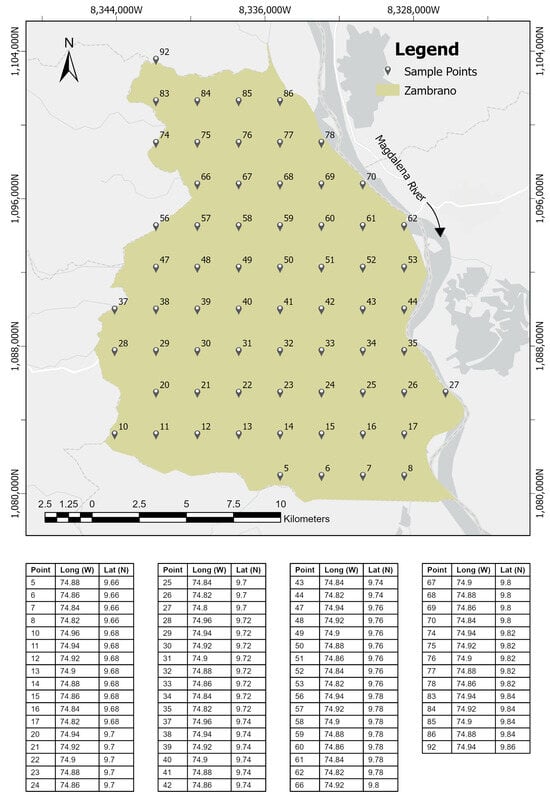
Understanding the interactions between vegetation dynamics and surface water availability is essential for assessing the resilience of tropical floodplain ecosystems under increasing hydroclimatic variability. This study analyzes the spatio-temporal dynamics of vegetation cover, surface water, and land use in Zambrano, a floodplain-dominated sector
[...] Read more.
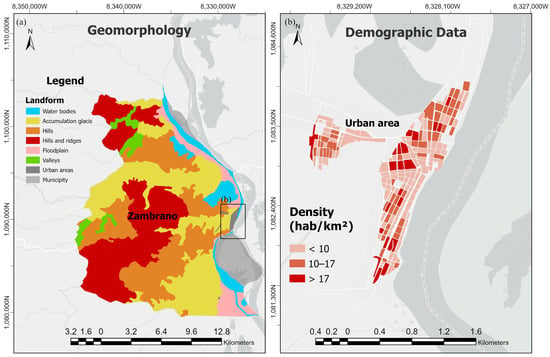
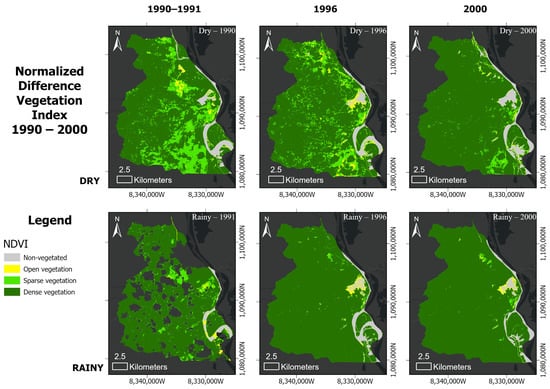
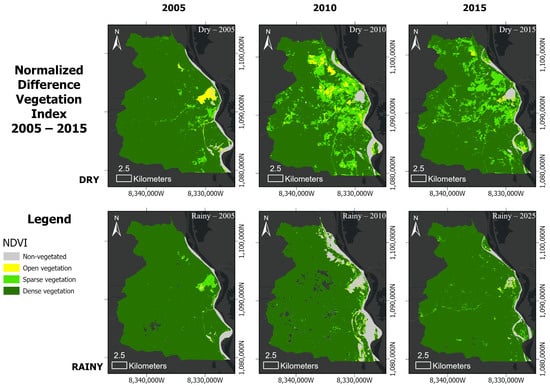
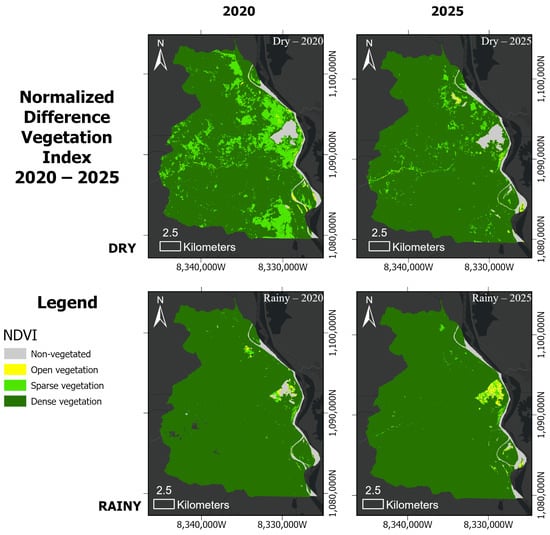
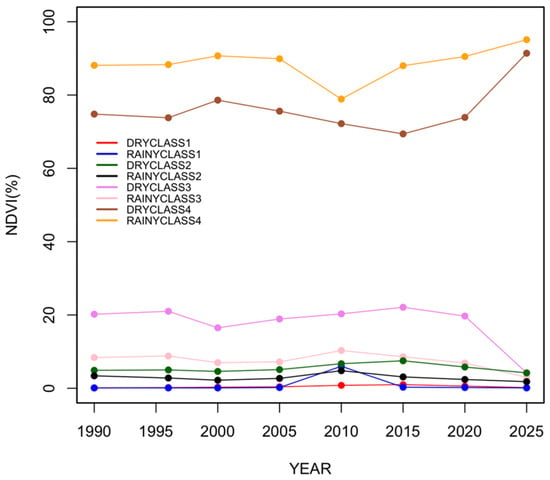
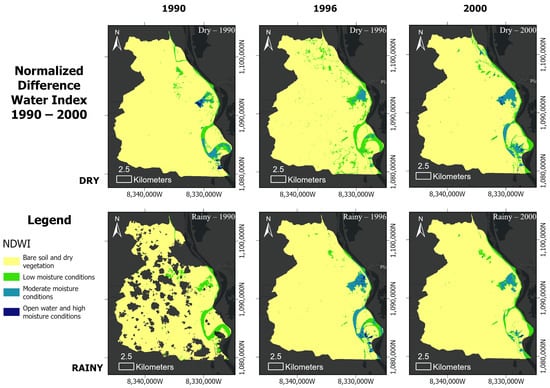
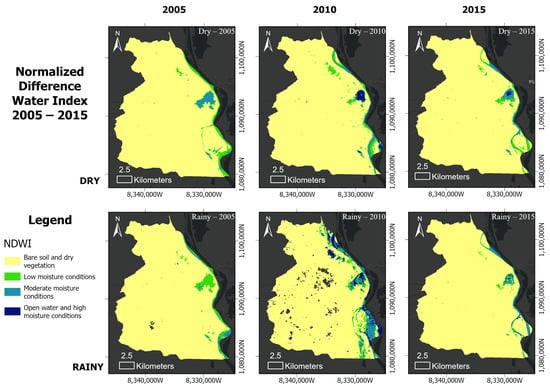
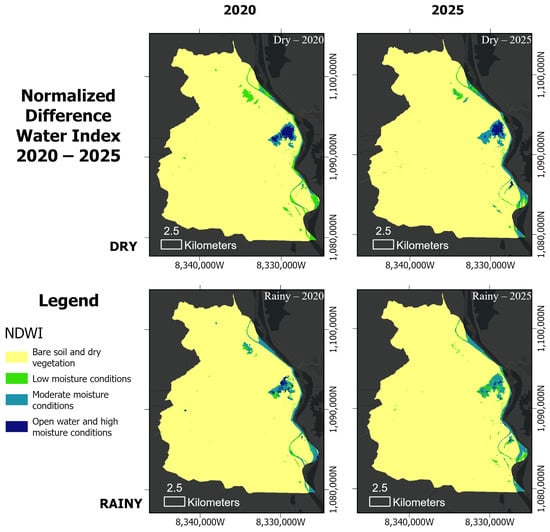
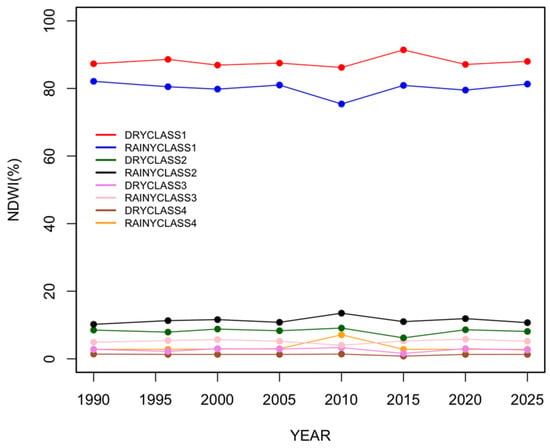
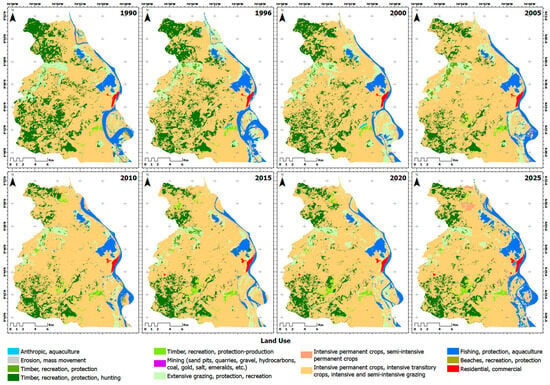
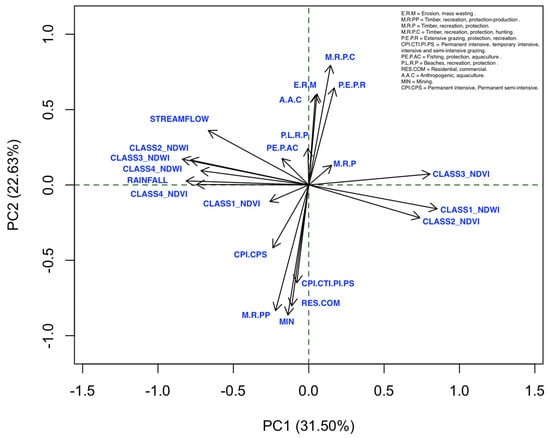
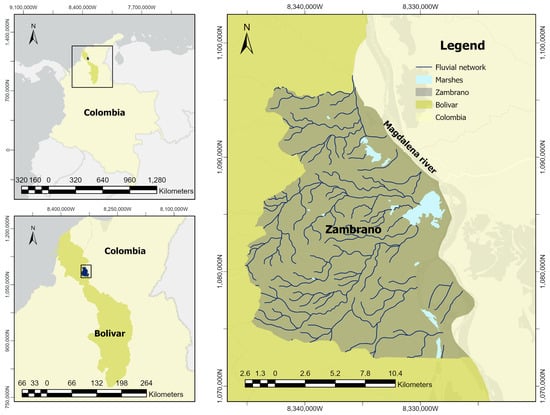
Understanding the interactions between vegetation dynamics and surface water availability is essential for assessing the resilience of tropical floodplain ecosystems under increasing hydroclimatic variability. This study analyzes the spatio-temporal dynamics of vegetation cover, surface water, and land use in Zambrano, a floodplain-dominated sector of the lower Magdalena River basin (Colombian Caribbean), over the period 1990–2025. Multi-temporal Landsat imagery was used to derive the Normalized Difference Vegetation Index (NDVI) and the Normalized Difference Water Index (NDWI), enabling the evaluation of seasonal and interannual ecohydrological variability under contrasting dry and rainy conditions. In addition, land-use classification was performed using a CORINE Land Cover methodology adapted for Colombia (CLC-C) to characterize the spatial organization of the landscape and its influence on vegetation–water interactions. Results show that vegetation dynamics are strongly controlled by hydroclimatic seasonality. Dense vegetation consistently expands during rainy periods, while dry seasons promote the expansion of open and sparse vegetation, reflecting seasonal vegetation stress rather than long-term degradation. NDWI patterns indicate that surface water and soil moisture are highly seasonal and spatially constrained, with open water largely confined to the Magdalena River channel and localized floodplain depressions. Extreme hydroclimatic events associated with the El Niño–Southern Oscillation (ENSO) produce abrupt but temporary changes in vegetation structure and surface moisture distribution. A strong inverse correlation between NDVI and NDWI reflects the contrasting spectral responses of vegetation and water surfaces resulting from the shared near-infrared (NIR) band in both indices. This spectral relationship is consistent with the observed seasonal variations in vegetation greenness and surface moisture across the floodplain. Land-use analysis reveals the progressive consolidation of the landscape, where the agropastoral matrix expanded from ~18,000 ha in 1990 to over 22,000 ha by 2025, driving a systematic reduction in natural and semi-natural forest structures. Forest conservation areas serve as critical ecological buffers, exhibiting lower seasonal variability in vegetation greenness. Overall, the results indicate that the Zambrano floodplain functions as a structurally stable yet highly responsive ecohydrological system, where vegetation dynamics and surface water availability are predominantly governed by interannual hydroclimatic pulses rather than long-term directional degradation. These findings demonstrate that while the structural matrix of the floodplain exhibits strong baseline resilience, its ecological functioning remains critically coupled with, and vulnerable to, the extreme phase shifts in ENSO cycles.
Full article
Open AccessArticle
Enhancing Daily Runoff Prediction via Uniform Design and Meta-Learning Integrated Hyperparameter Optimization Embedded in Transformer
by
Wenxue Wang, Liuyang Li, Donghui Su, Xin Zhang, Haibin Tong, Tiantian Shao and Jiaxin Fan
Hydrology 2026, 13(8), 201; https://doi.org/10.3390/hydrology13080201 (registering DOI) - 25 Jul 2026
Abstract
Accurate runoff prediction is an essential foundation for water resource management, flood prevention, and drought warning. Despite the superior performance of deep learning models in runoff prediction, the high-dimensional hyperparameter optimization limits their widespread application. To address this challenge, this study proposed a
[...] Read more.
Accurate runoff prediction is an essential foundation for water resource management, flood prevention, and drought warning. Despite the superior performance of deep learning models in runoff prediction, the high-dimensional hyperparameter optimization limits their widespread application. To address this challenge, this study proposed a hyperparameter optimization strategy that integrated Uniform Design (UD) and Meta-Learning (ML) within the Transformer framework (UD-ML-Transformer) for daily runoff prediction. Performance of the proposed model was systematically evaluated against five benchmark models, including the UD-Transformer, Particle Swarm Optimization (PSO)-Transformer, and three Receptance Weighted Key Value (RWKV)-based models (PSO-RWKV, UD-RWKV, and UD-ML-RWKV), using hydroclimatic data spanning 1980 to 2014 from the Rio Pueblo de Taos watershed in USA. Results showed that the UD-ML-Transformer model performed the best in both prediction accuracy and peak flow, with the highest Nash-Sutcliffe Efficiency (NSE) of 0.906, and the lowest Mean Squared Error (MSE), Root Mean Squared Error (RMSE), and Mean Absolute Error (MAE) of 0.004, 0.062, and 0.034, respectively. The UD-Transformer ranked second in performance, followed by the PSO-Transformer. The integrated UD-ML hyperparameter optimization strategy also improved the performance of RWKV-based models. Compared with the PSO-RWKV and UD-RWKV models, the UD-ML-RWKV model exhibited an NSE improvement of 0.45–7.65% and an RMSE reduction of 1.47–21.18%, respectively. Moreover, cross-watershed validation conducted in the Ford River watershed, USA, also demonstrated the satisfactory performance of the proposed UD-ML-Transformer model, with the highest NSE of 0.890, and the lowest MSE, RMSE, and MAE of 0.088, 0.296, and 0.141, respectively. These findings highlight the superiority of integrating UD and ML for hyperparameter optimization in runoff forecasting.
Full article
(This article belongs to the Special Issue Hydrological Modeling and Sustainable Water Resources Management, 2nd Edition)
Open AccessArticle
Evaporative Water Consumption and Heat Redistribution Under Pumped-Storage Hydropower Operation in an Arid Region
by
Jinhan Wang, Xinjun Yan, Shaolei Wang, Kewu Han, Kebin Shi and Dexin Zhao
Hydrology 2026, 13(8), 200; https://doi.org/10.3390/hydrology13080200 - 24 Jul 2026
Abstract
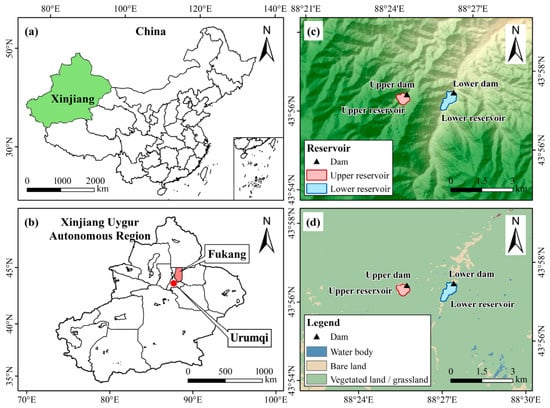
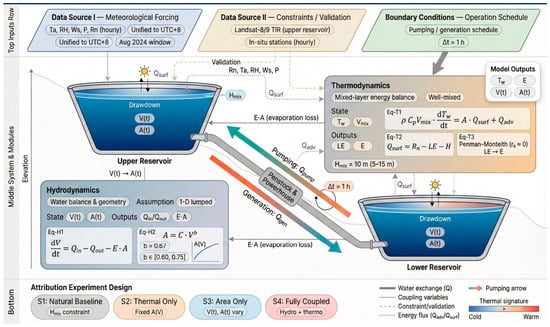
Pumped-storage hydropower (PSH) can modify reservoir evaporation in arid regions by altering water-level dynamics, surface-area exposure, and thermal exchange between reservoirs. This study quantifies operation-induced evaporation changes at the Fukang PSH station in Xinjiang, China, using a one-dimensional lumped hydrodynamic–thermal model driven by
[...] Read more.
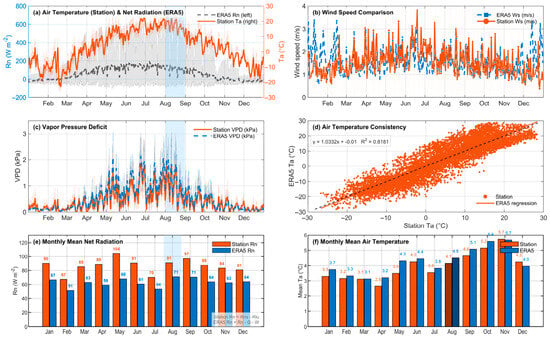
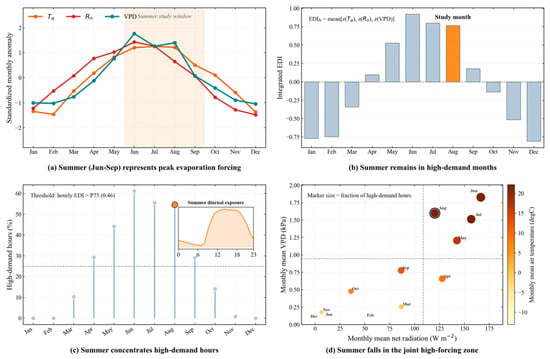
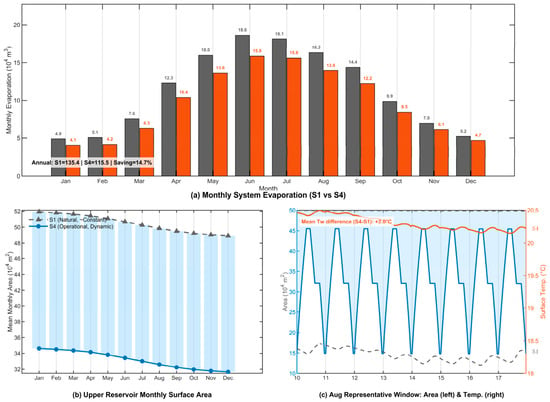
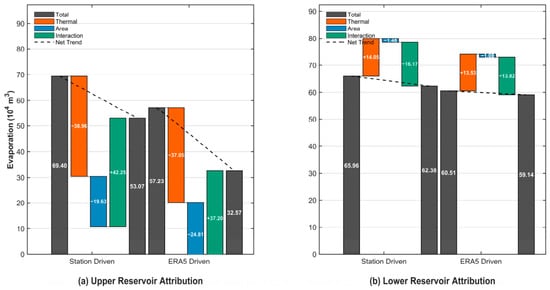
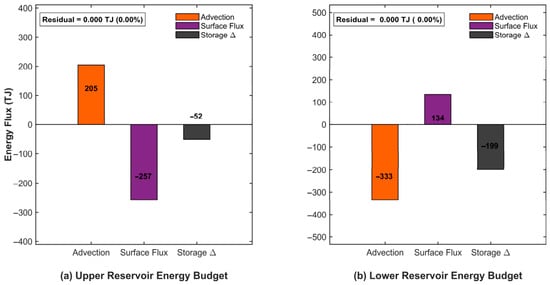
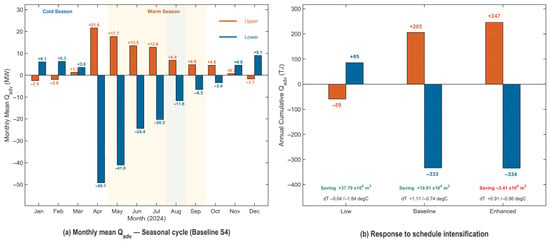
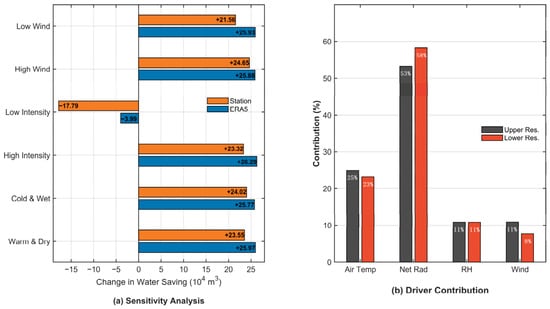
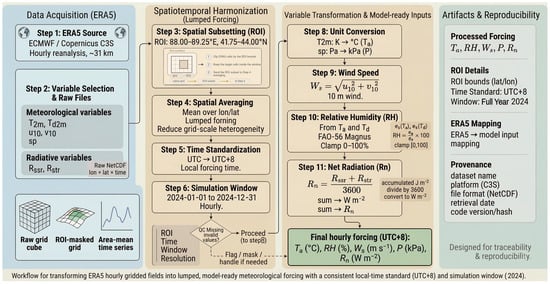
Pumped-storage hydropower (PSH) can modify reservoir evaporation in arid regions by altering water-level dynamics, surface-area exposure, and thermal exchange between reservoirs. This study quantifies operation-induced evaporation changes at the Fukang PSH station in Xinjiang, China, using a one-dimensional lumped hydrodynamic–thermal model driven by hourly station observations and ERA5 reanalysis for 2024. A four-scenario factorial design separates thermal, surface-area, and interaction effects within a unified water energy framework. Under station forcing, fully coupled operation reduces annual system-scale evaporation from 135.36 × 10⁴ m3 to 115.45 × 10⁴ m3, corresponding to a net reduction of 19.91 × 10⁴ m3 (14.7%). Energy-budget analysis identifies advective heat transport as the main pathway linking dispatch, reservoir thermal evolution, and evaporation response, with annual cumulative values of +205 TJ in the upper reservoir and −333 TJ in the lower reservoir. Dispatch-regime experiments further show that stronger exchange-flow operation does not necessarily increase evaporation reduction: the low, baseline, and enhanced schedules produce system-scale net changes of 37.70 × 10⁴ m3, 19.91 × 10⁴ m3, and −3.41 × 10⁴ m3, respectively. These results indicate that evaporation effects in arid-region PSH systems depend on the timing of surface-area exposure relative to local evaporative demand, rather than on exchange-flow magnitude or operating duration alone.
Full article
(This article belongs to the Section Water Resources and Risk Management)
►▼
Show Figures

Figure 1
Open AccessArticle
Frequency-Dependent Groundwater Responses to Canal Regulation and Extreme Rainfall in the Huaibei Plain
by
Zhaokai Wang, Hongwei Yuan, Jiwei Yang, Tao Shen and Youzhen Wang
Hydrology 2026, 13(8), 199; https://doi.org/10.3390/hydrology13080199 - 23 Jul 2026
Abstract
►▼
Show Figures
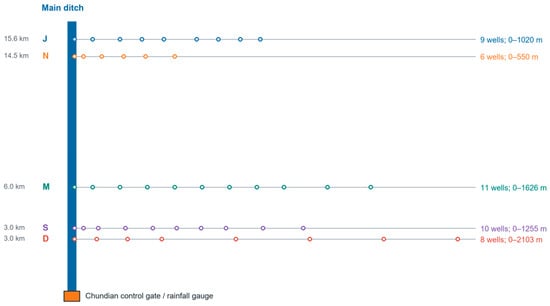
Groundwater levels in gated agricultural drainage networks respond to canal-stage changes, rainfall, antecedent storage, and changing operating conditions. We examined groundwater and surface-water records from the Chezegou Watershed, Huaibei Plain, China (2019–2024), using analytical solutions of the linearized Boussinesq equation. Groundwater was measured
[...] Read more.
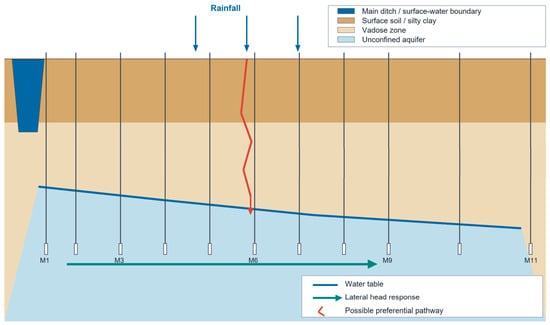
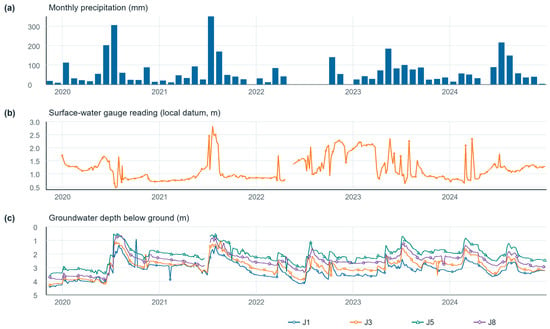
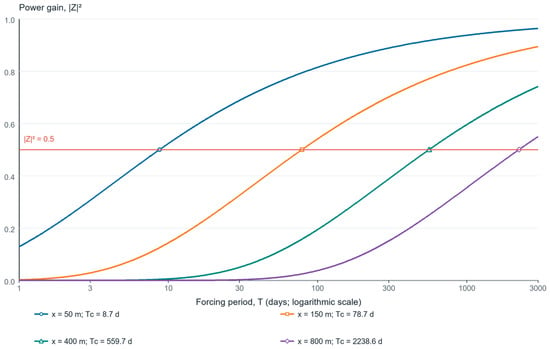
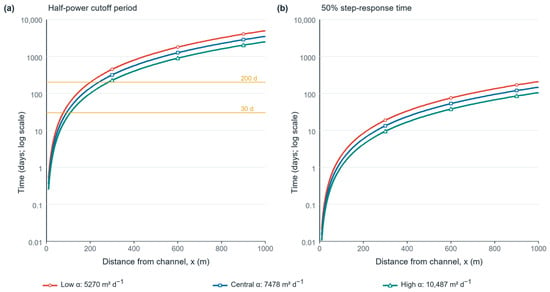
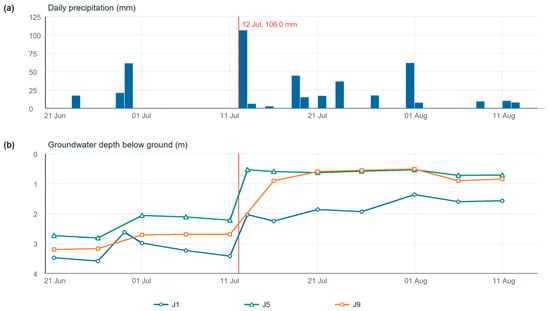
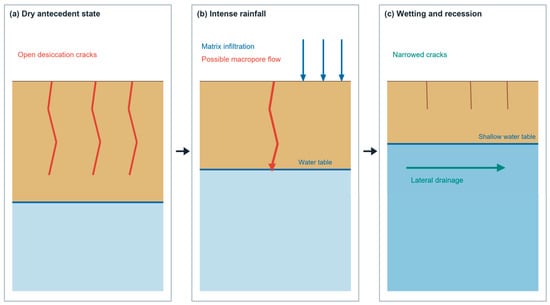
Groundwater levels in gated agricultural drainage networks respond to canal-stage changes, rainfall, antecedent storage, and changing operating conditions. We examined groundwater and surface-water records from the Chezegou Watershed, Huaibei Plain, China (2019–2024), using analytical solutions of the linearized Boussinesq equation. Groundwater was measured mostly at intervals of about five days, and analyses used the original observation dates. Using the half-power criterion |Z|2 = 1/2 and hydraulic diffusivities of 5.27 × 10³–1.05 × 10⁴ m2 d−1, cutoff periods were 56.1–111.7 d at 150 m and 399.1–794.1 d at 400 m; the half-power distance for a 30 d cycle was 77.7–109.7 m. The record also includes a 106 mm storm on 12 July 2020. Groundwater depth at J5 (490 m from the canal) decreased from 2.23 to 0.54 m in 48 h, a 1.69 m water-level rise, while J9 (1020 m) rose by 1.79 m over five days. These observations show a rapid shallow-groundwater head response, although water-level records alone do not separate vertical recharge from hydraulic-pressure transmission. Canal influence depends on forcing duration and aquifer properties, while rainfall responses also reflect lateral boundaries and the shrink-swell behavior of Shajiang black soil. The calculated time-distance relations provide site-specific reference values for canal operation.
Full article

Figure 1
Open AccessArticle
Groundwater Vulnerability Assessment Using an Integrated GIS-Based DRASTIC, Land-Use, and Expert Elicitation Framework in Southern Egypt
by
Mohamed El-Sayed El-Mahdy, Sally Sayed Saad, Ibraheem A. H. Yousif, Mohamed Ahmed Shahba and Abd-Alrahman S. Ahmed
Hydrology 2026, 13(8), 198; https://doi.org/10.3390/hydrology13080198 - 23 Jul 2026
Abstract
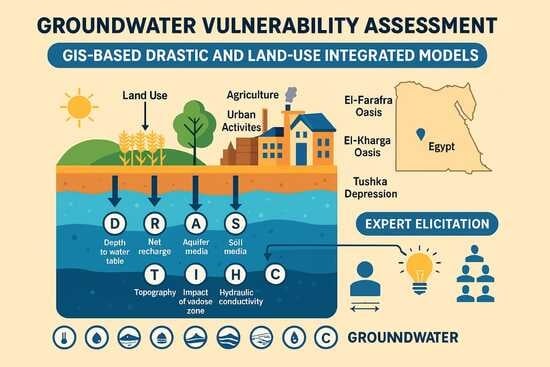
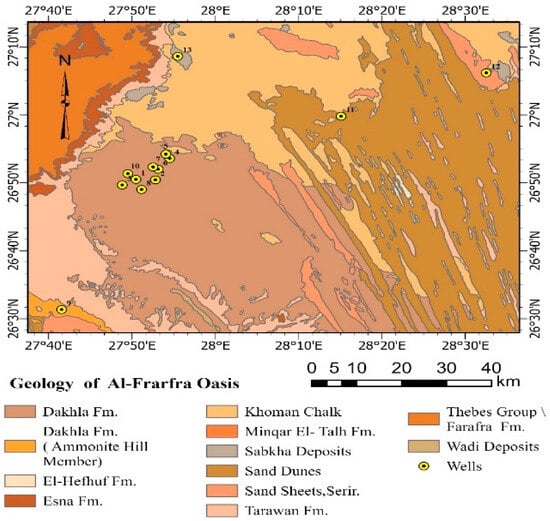
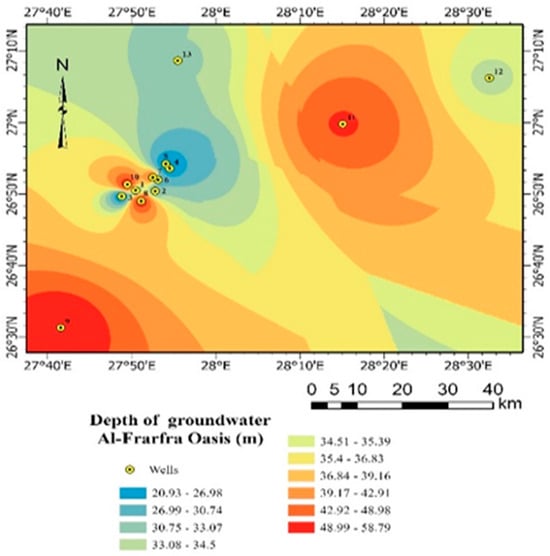
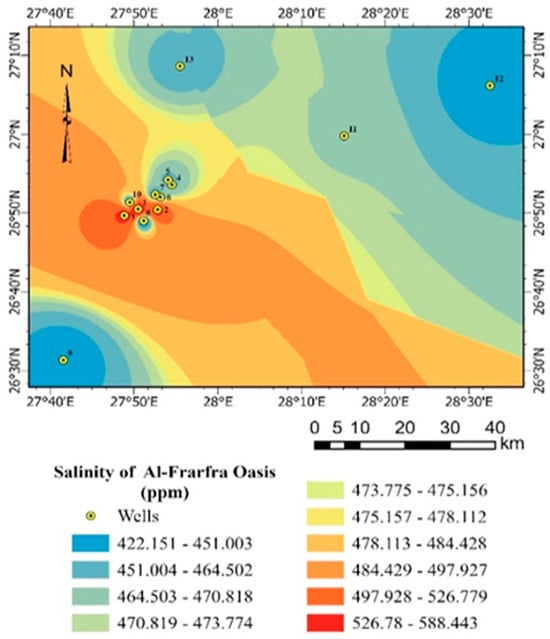
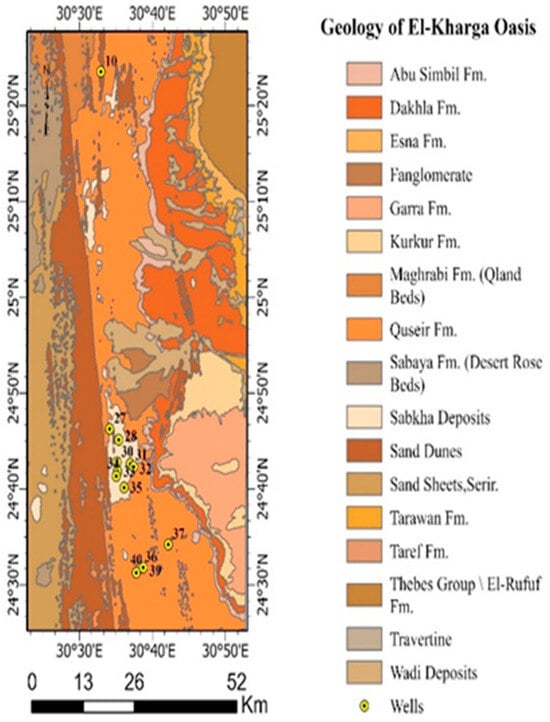
Groundwater vulnerability refers to an aquifer’s susceptibility to contamination based on natural hydrogeological properties, including geology, soil, topography, and unsaturated zone characteristics. In low-recharge arid systems, limited recharge reduces dilution and flushing, allowing contaminants introduced through anthropogenic activities to persist over time. This
[...] Read more.
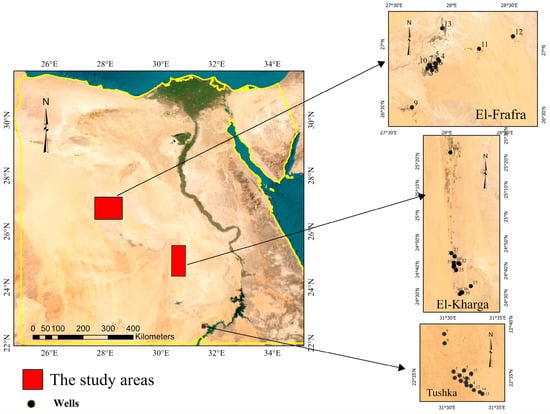
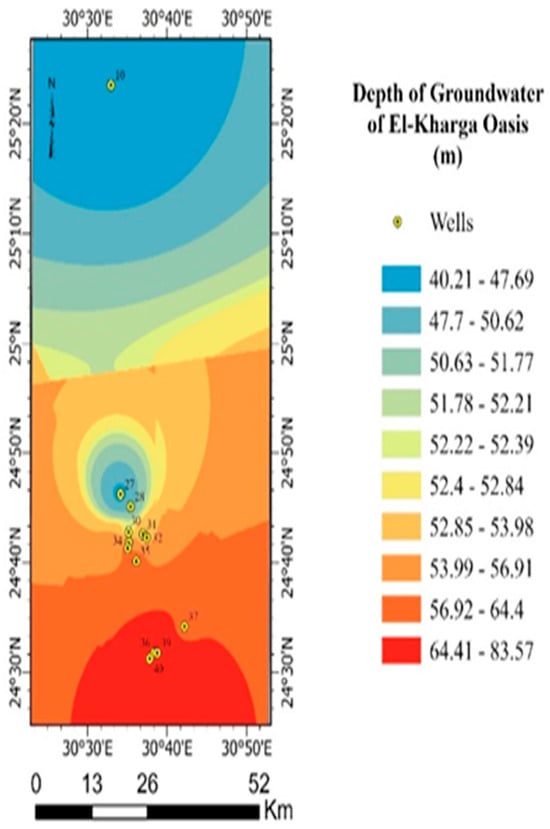
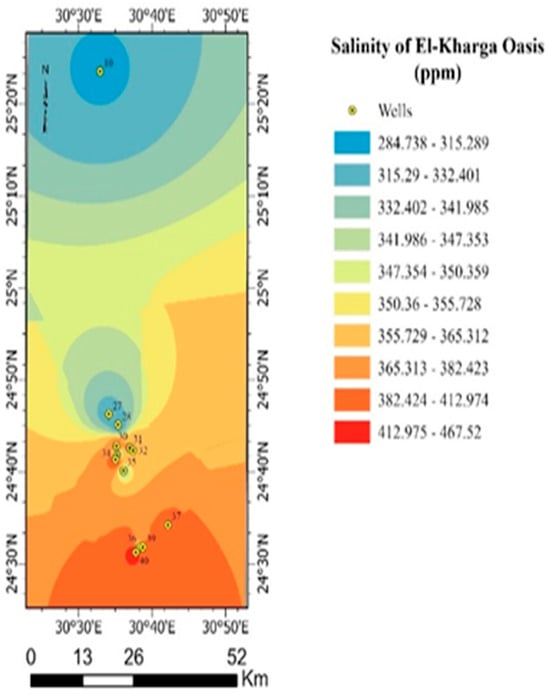
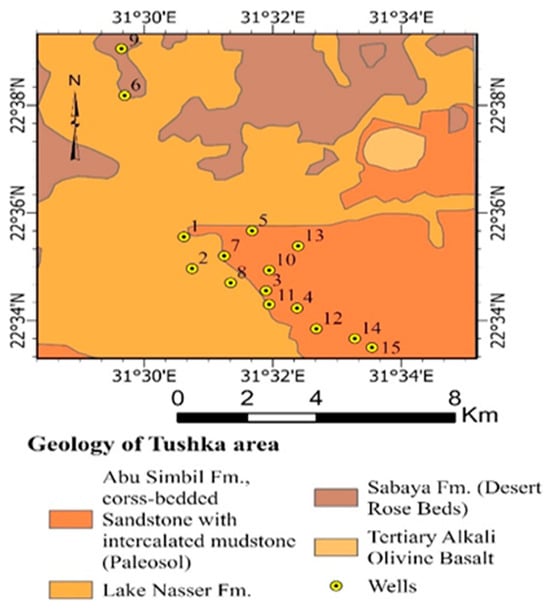
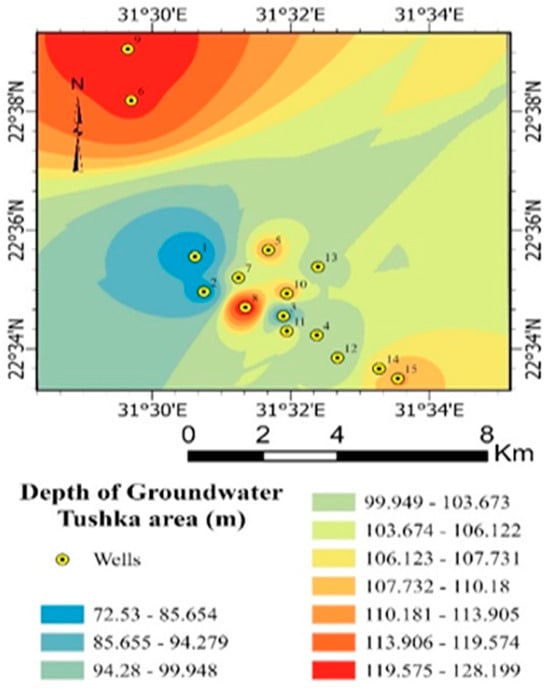
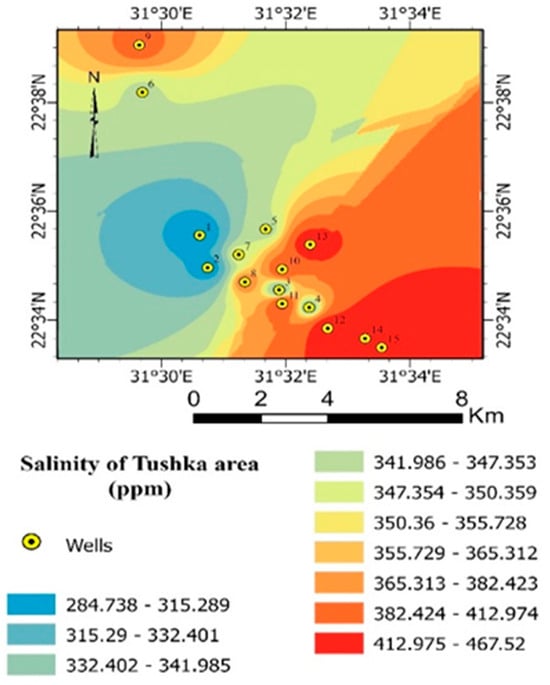
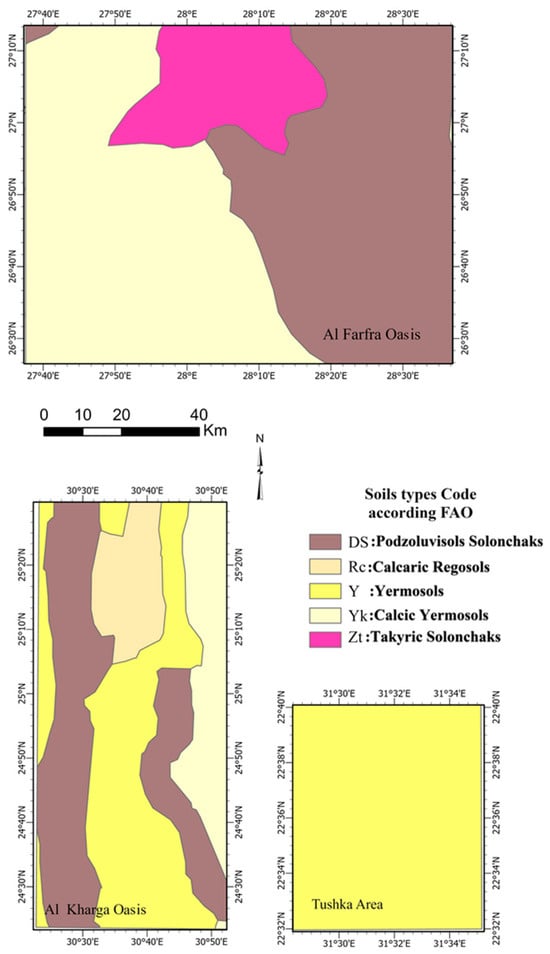
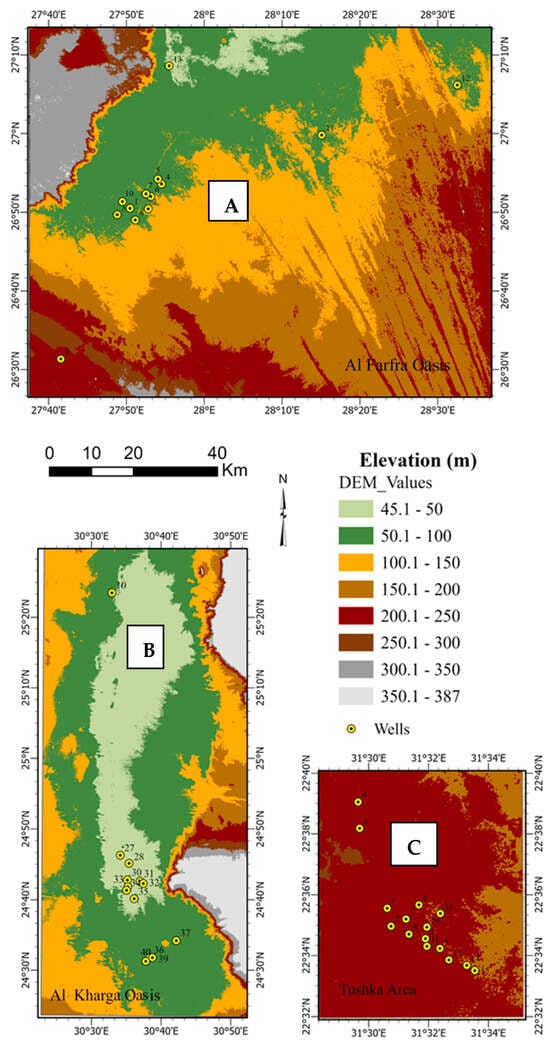
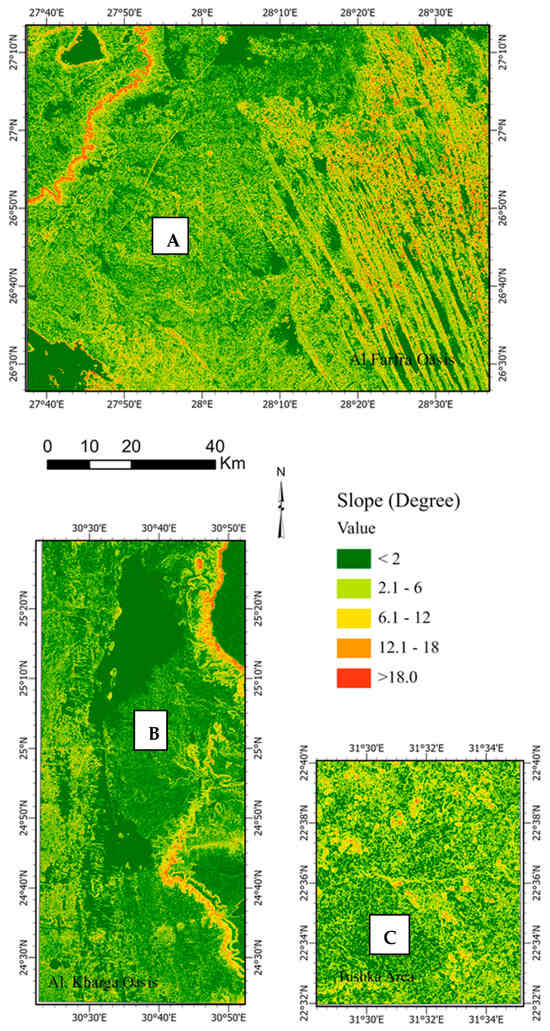
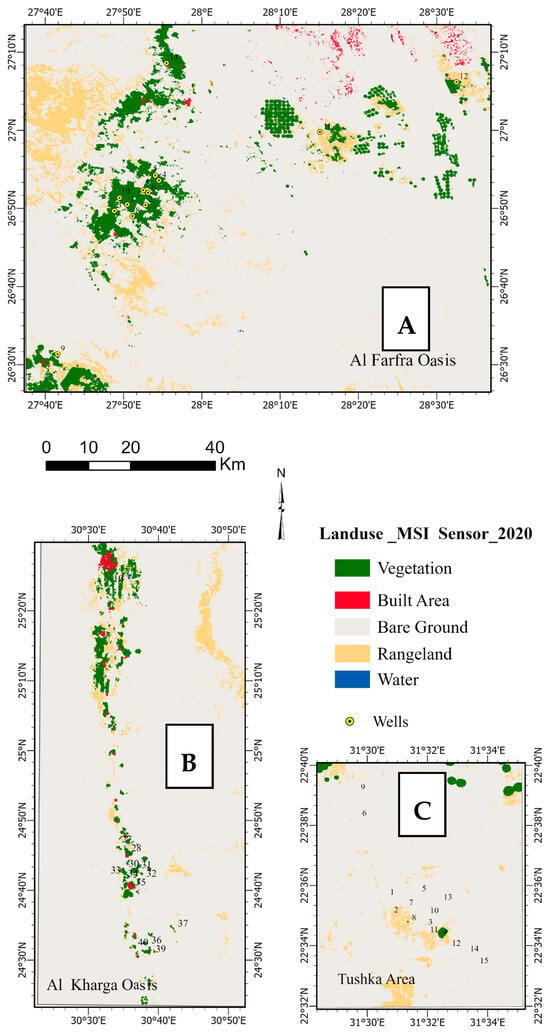
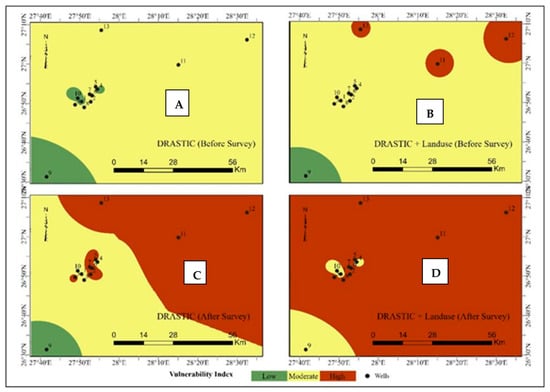
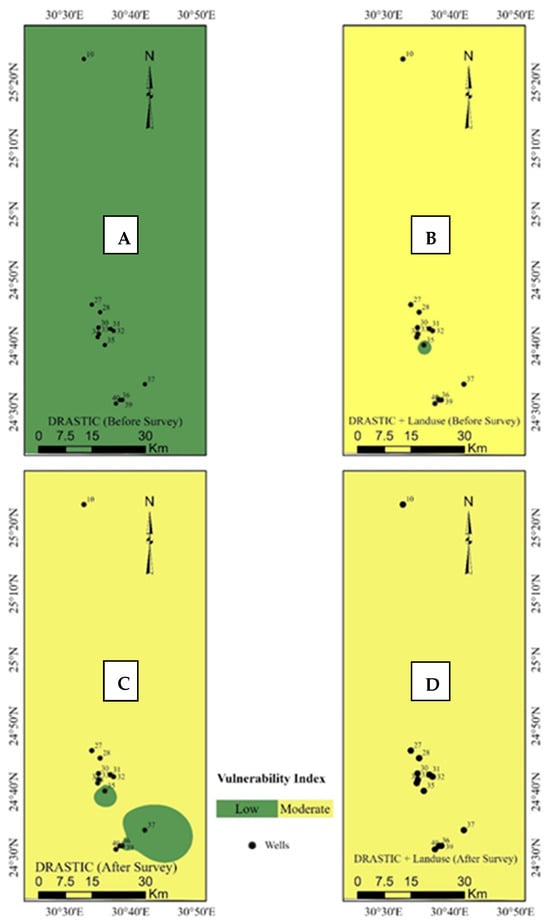
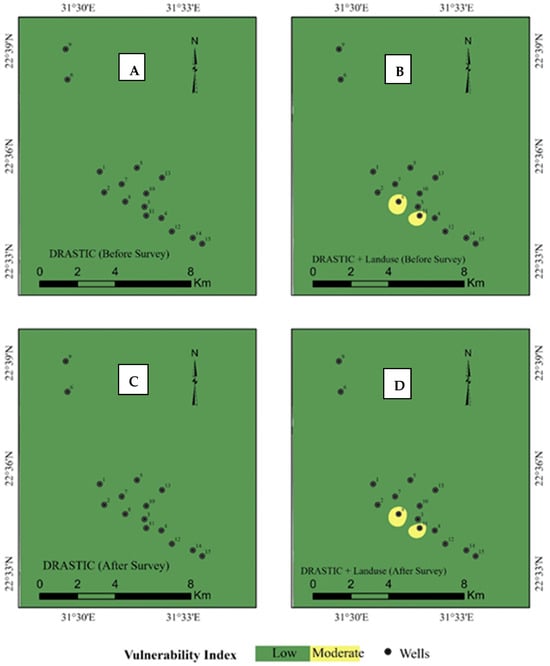
Groundwater vulnerability refers to an aquifer’s susceptibility to contamination based on natural hydrogeological properties, including geology, soil, topography, and unsaturated zone characteristics. In low-recharge arid systems, limited recharge reduces dilution and flushing, allowing contaminants introduced through anthropogenic activities to persist over time. This study assesses groundwater vulnerability in El-Farafra, El-Kharga, and Tushka using a GIS-based DRASTIC approach, enhanced with a Land-Use DRASTIC model to incorporate human activities. Parameters, including the depth-to-water table, net recharge, aquifer media, soil media, topography, the vadose zone, and hydraulic conductivity, were spatially analyzed to generate vulnerability indices. Sentinel-2 imagery was used for land-use classification. In addition, expert elicitation from twenty hydrogeology specialists provided alternative parameter weightings, which were compared with the standard DRASTIC weights. Results show that incorporating land use and expert-based weights refines vulnerability patterns, particularly in agricultural, urban, and industrial zones. El-Farafra exhibits the highest vulnerability due to intensive land use and hydrogeological conditions, El-Kharga shows moderate vulnerability, and Tushka shows lower vulnerability, where recharge from Lake Nasser enhances dilution and reduces contaminant persistence. The study highlights the importance of integrating land-use information and expert knowledge to improve vulnerability assessment in data-scarce arid environments and supports improved groundwater management strategies.
Full article
(This article belongs to the Section Surface Waters and Groundwaters)
►▼
Show Figures

Graphical abstract
Open AccessArticle
Analysis of Soil Infiltration Characteristics and Their Influencing Factors Under Different Vegetation Based on a PLS-SEM Model
by
Xuemin Tang, Yutong Peng, Jianli Zhang, Dandan Li, Yang Cao, Weiquan Zhao and Yunjie Wu
Hydrology 2026, 13(7), 197; https://doi.org/10.3390/hydrology13070197 - 22 Jul 2026
Abstract
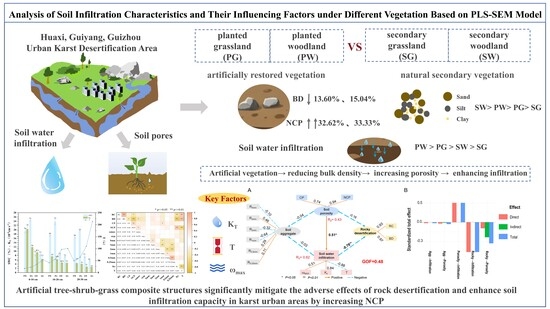
Urban rocky desertification areas are characterized by shallow soils, rock–soil mosaics, and strong human disturbance, so infiltration processes may differ from those in homogeneous soils. However, interactions among multiple controlling factors remain insufficiently quantified. This study compared soil infiltration under artificially restored vegetation
[...] Read more.
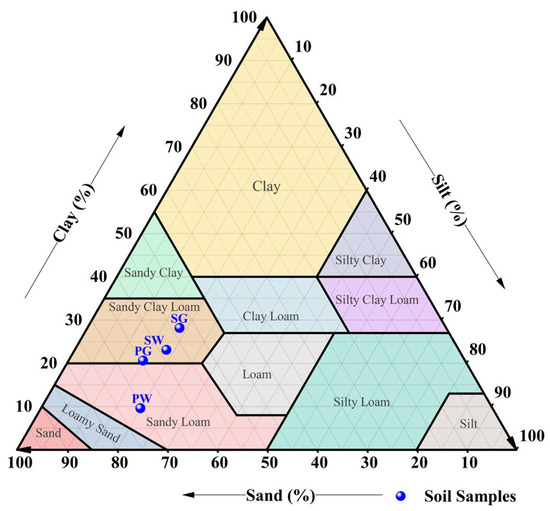
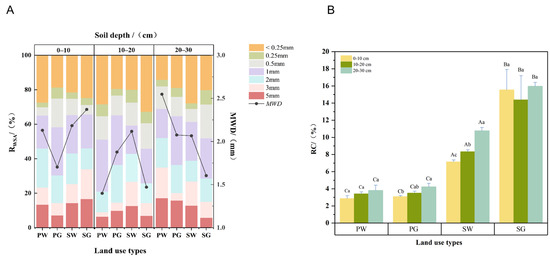
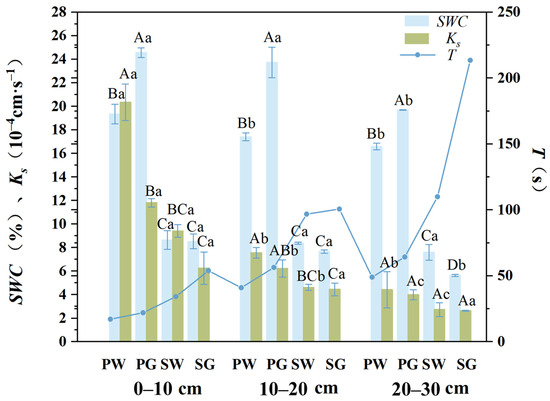
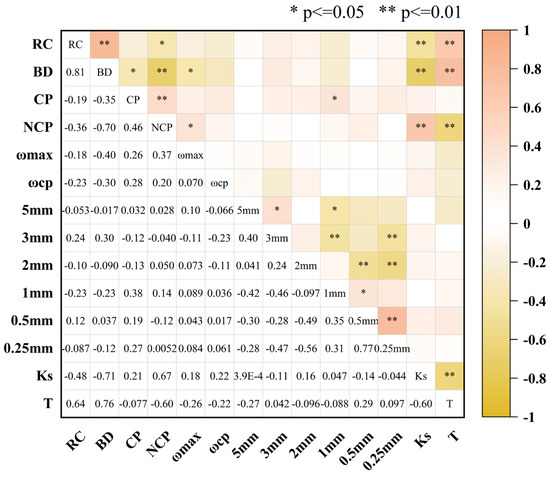
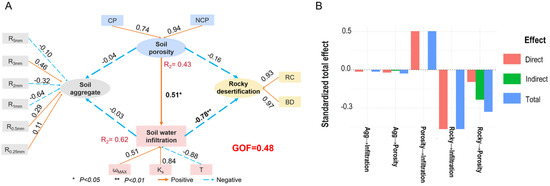
Urban rocky desertification areas are characterized by shallow soils, rock–soil mosaics, and strong human disturbance, so infiltration processes may differ from those in homogeneous soils. However, interactions among multiple controlling factors remain insufficiently quantified. This study compared soil infiltration under artificially restored vegetation (planted grassland (PG) and planted woodland (PW)), and natural secondary vegetation (secondary grassland (SG) and secondary woodland (SW)). Saturated hydraulic conductivity (Ks) and falling-head duration (T) were measured using falling-head tests on undisturbed soil columns. Soil physical properties were then integrated with partial least squares structural equation modeling (PLS-SEM) to assess the effects of rocky desertification, soil aggregates, and porosity. Soil bulk density was significantly lower under artificially restored vegetation, whereas capillary porosity, non-capillary porosity, and water-holding capacity were significantly higher (p < 0.05). Infiltration performance followed PW > PG > SW > SG. PLS-SEM indicated that rocky desertification (−0.78), porosity (0.51), and aggregates (−0.03) jointly regulated infiltration, with non-capillary porosity as the dominant positive factor. Higher infiltration in artificially restored plots was mainly associated with improved pore structure. These findings support vegetation configuration and soil–water management in urban rocky desertification areas.
Full article
(This article belongs to the Section Soil and Hydrology)
►▼
Show Figures

Graphical abstract
Open AccessArticle
Diagnostics of the Average Long-Term Water Discharge of Freely Meandering Rivers Based on Morphological Analysis of Their Channel Configurations
by
Alexey Terekhov, Ravil Mukhamediev, Gulshat Sagatdinova and Igor Savin
Hydrology 2026, 13(7), 196; https://doi.org/10.3390/hydrology13070196 - 22 Jul 2026
Abstract
Freely meandering rivers flow through gently sloping plains composed of loess and fluvial sediments. Low-gradient alluvial plains are formed without the influence of landscape features such as rock outcrops or other features that distort the flow path. The channel configurations of such rivers,
[...] Read more.
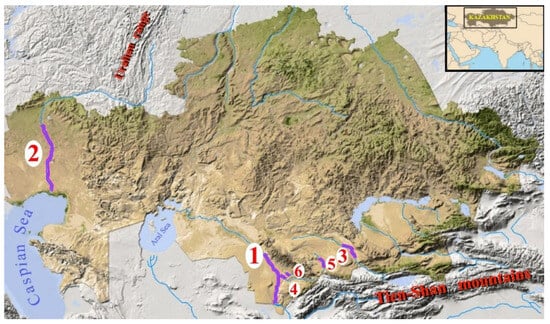
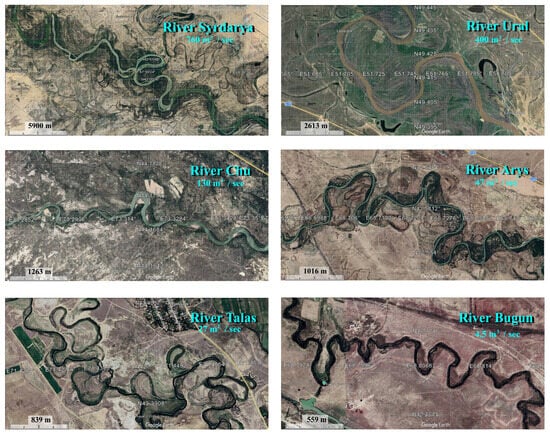
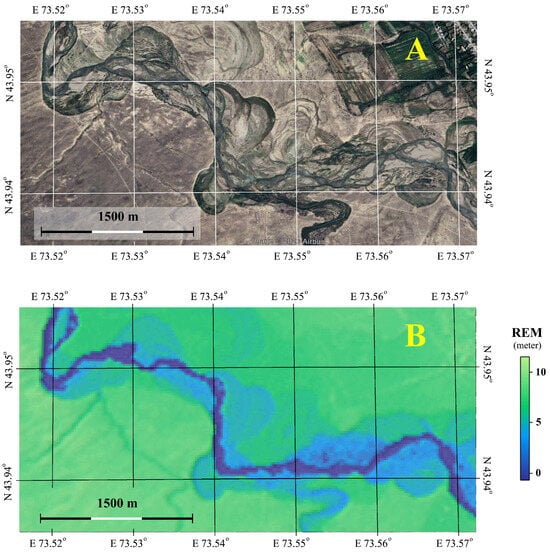
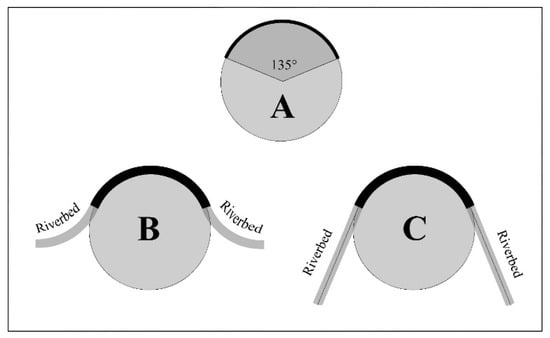
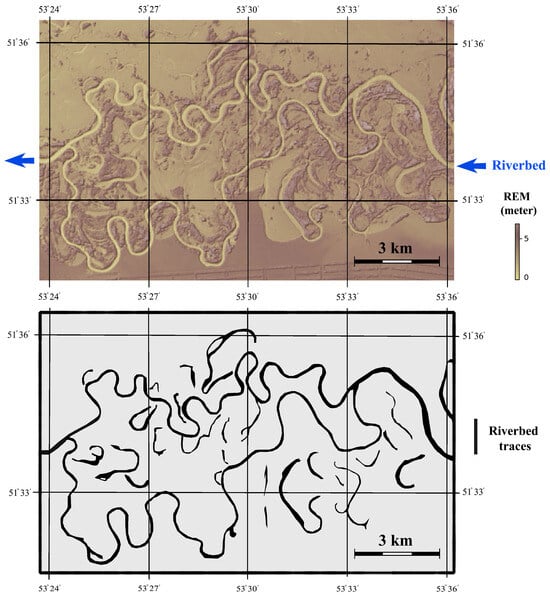
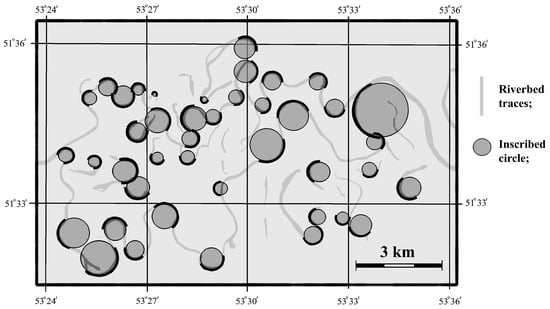
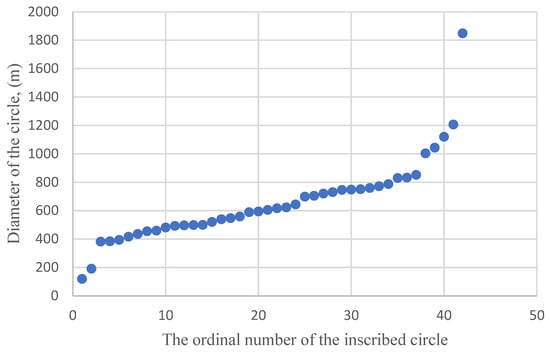
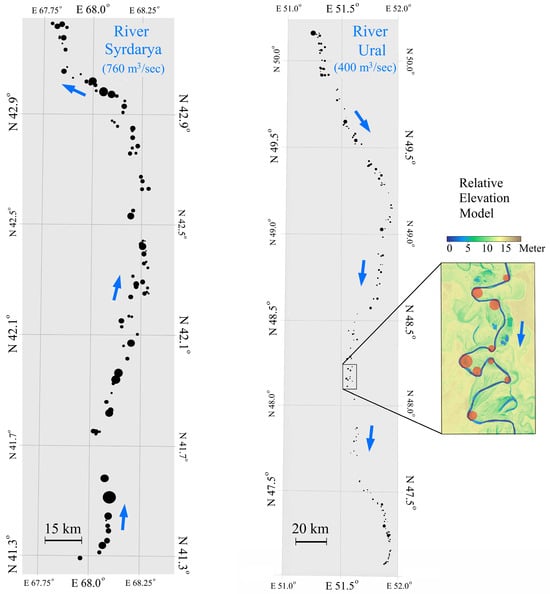
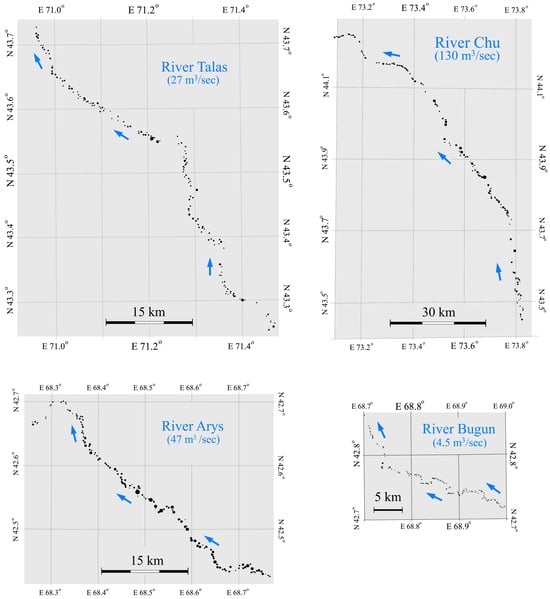
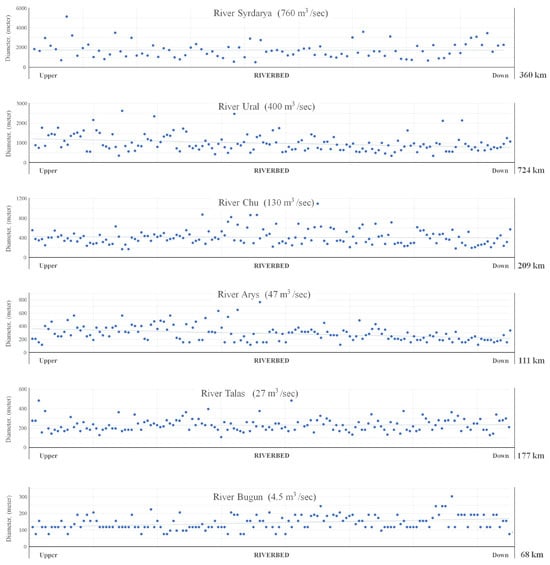
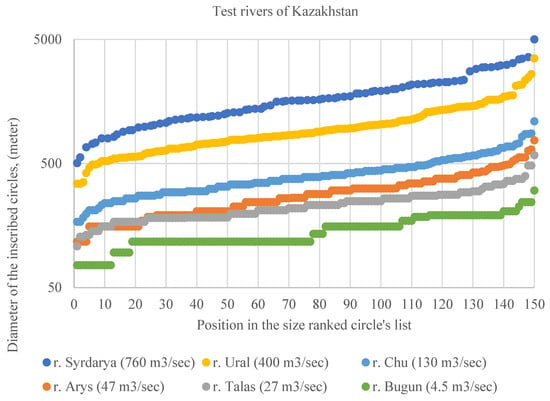
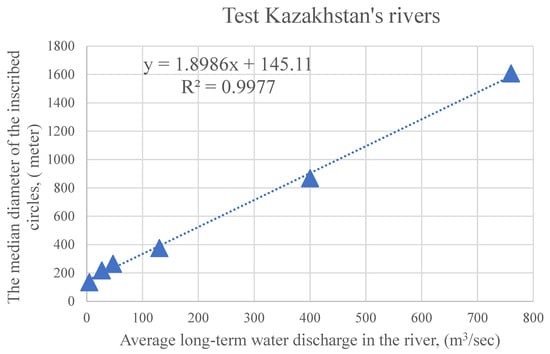
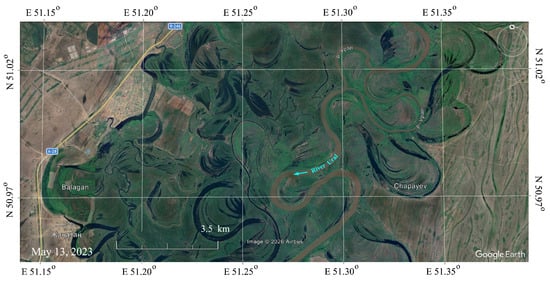
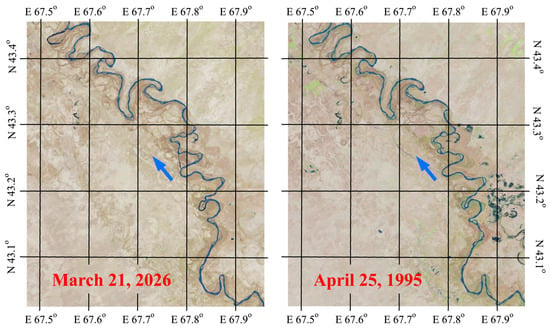
Freely meandering rivers flow through gently sloping plains composed of loess and fluvial sediments. Low-gradient alluvial plains are formed without the influence of landscape features such as rock outcrops or other features that distort the flow path. The channel configurations of such rivers, and in particular the size of meanders and oxbow lakes, depend on the average long-term water discharge. Large rivers form large meanders, while small rivers form correspondingly small ones. Morphological analysis of river channel configurations can offer a metric for estimating the average long-term water discharge of a river based solely on the sinuosity of its channel. The study examined six freely meandering rivers in Kazakhstan, with discharges ranging from 4.5 to 760 m3/s and channel slopes from 0.005 to 0.06%. The morphological analysis of river channels was based on the Relative Elevation Model, specifically its version based on the Copernicus Global Digital Elevation Model, with a spatial resolution of 30 m. River channel configurations were approximated using a set of inscribed circles, the diameters of which formed the basis for the river’s average long-term water discharge metric. The largest diameter circles, which could support the river channel with a sector of at least 135°, were expertly inscribed into river bends. The diameters of the inscribed circles within these sets varied from four times for small rivers to ten times for large rivers. These sets of circles, sorted by size, can characterize the average long-term water discharge of the analyzed rivers. For example, a sample of average median values of inscribed circle diameters has a high correlation with the average long-term water discharge, with a linear approximation reliability of R2 = 0.997. The scope of the developed method for assessing the average long-term water discharge of freely meandering rivers includes retrospective analysis of changes in average long-term average long-term water discharge. This can provide significant historical depth of analysis, spanning centuries and millennia, since the analysis is based on describing the results of very slow processes of natural deformation of river channels. Thus, the method proposed in this study for assessing the average long-term water discharge of freely meandering rivers based on morphological analysis of their channel configurations expands the arsenal of tools for reconstructing certain paleoclimate elements related to the hydrology of territories.
Full article
(This article belongs to the Section Surface Waters and Groundwaters)
►▼
Show Figures

Figure 1
Open AccessArticle
Prioritizing Small-Scale Water Retention Measures Through Spatial Differentiation of Dominant Runoff Processes
by
Katharina Pilar von Pilchau, Christoph Mudersbach, Udo Nehren and Klaus Maas
Hydrology 2026, 13(7), 195; https://doi.org/10.3390/hydrology13070195 - 22 Jul 2026
Abstract
In order to mitigate the negative effects of heavy rainfall events, natural water retention measures (NWRM)—such as hedges, erosion control strips, vegetated drainage channels, wooded strips, retention basins and ditch pockets—have gained renewed attention as an effective climate adaptation strategy. To identify potential
[...] Read more.
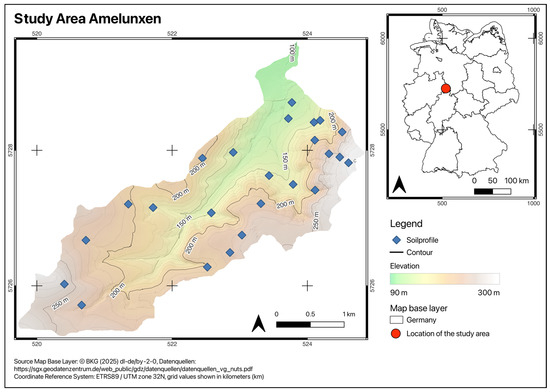
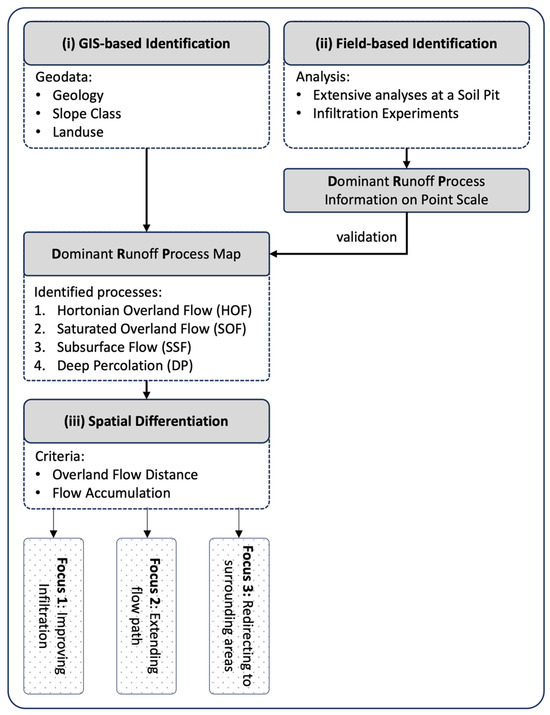
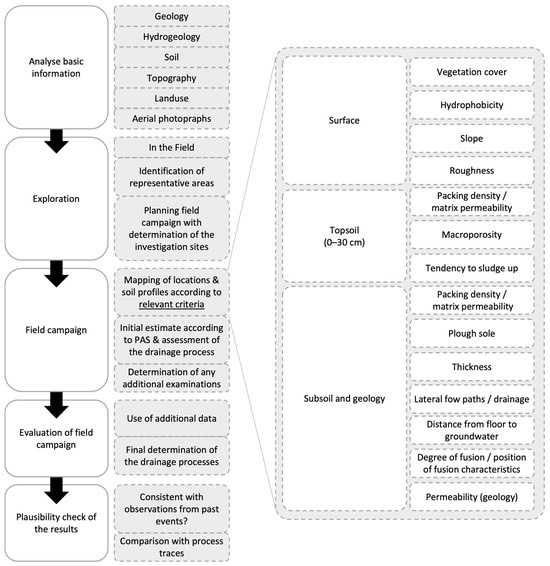
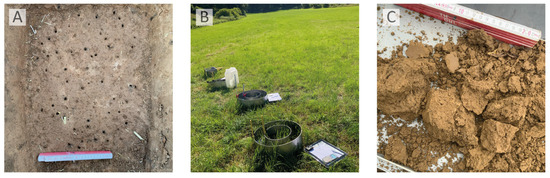
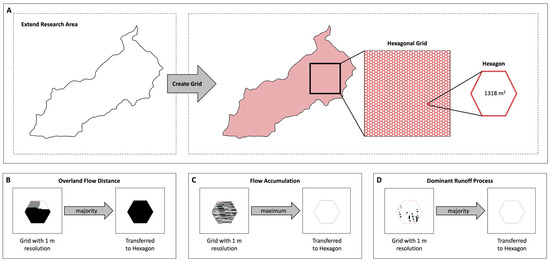
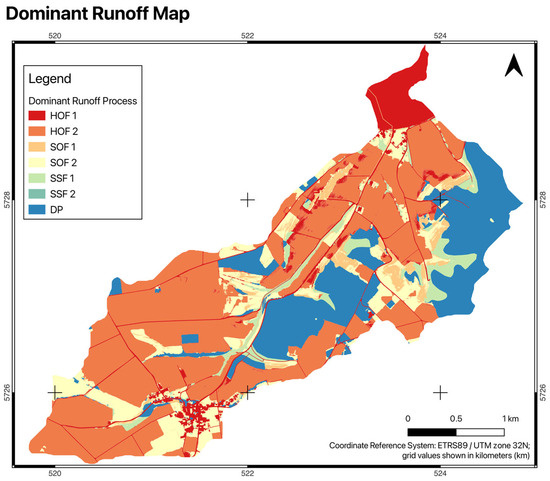
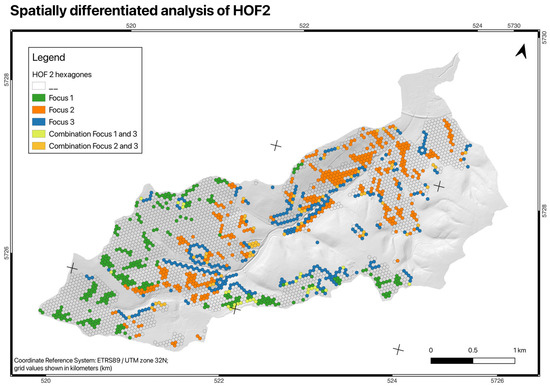
In order to mitigate the negative effects of heavy rainfall events, natural water retention measures (NWRM)—such as hedges, erosion control strips, vegetated drainage channels, wooded strips, retention basins and ditch pockets—have gained renewed attention as an effective climate adaptation strategy. To identify potential areas for NWRM, this study applied and methodologically expanded an existing approach for identifying dominant runoff processes (DRPs) to an agricultural sub-catchment in the Weserbergland region of Germany. The DRP were determined using a Geographic Information System (GIS) and validated through field surveys. Potential areas for water retention within the same runoff process classes were identified for three defined objectives: improving infiltration, extending flow paths, and redirecting runoff to surrounding areas. Spatial differentiation was achieved using accumulated catchment area and overland flow distance. The watershed is predominantly characterized by surface runoff (Hortonian Overland Flow). Field validation confirmed the DRP classification for around two-thirds of the study area, with deviations occurring predominantly on arable land. Supplementing the DRP approach with a topographic analysis allowed for further differentiation, focusing on small, topographically defined sub-watersheds. The identified areas offer significant potential for interventions. Combined with supplementary data, analyses of the water network and the involvement of local stakeholders, the resulting potential map provides a solid basis for planning smaller-scale water retention measures.
Full article
(This article belongs to the Section Hydrological and Hydrodynamic Processes and Modelling)
►▼
Show Figures

Figure 1
Open AccessArticle
Mechanical Load-Induced PFAS Transport in the Vadose Zone
by
Zhi-He Jin
Hydrology 2026, 13(7), 194; https://doi.org/10.3390/hydrology13070194 - 22 Jul 2026
Abstract
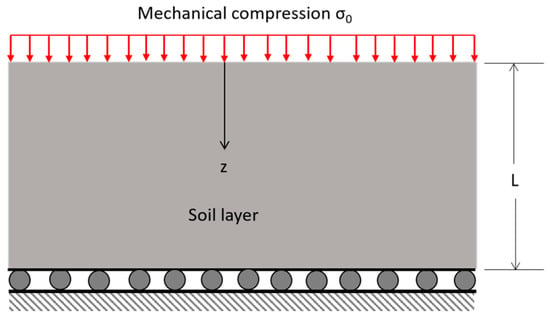
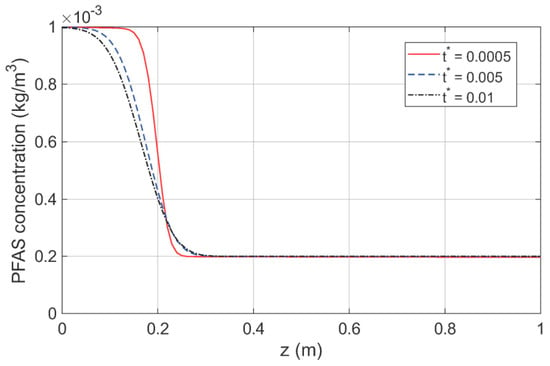
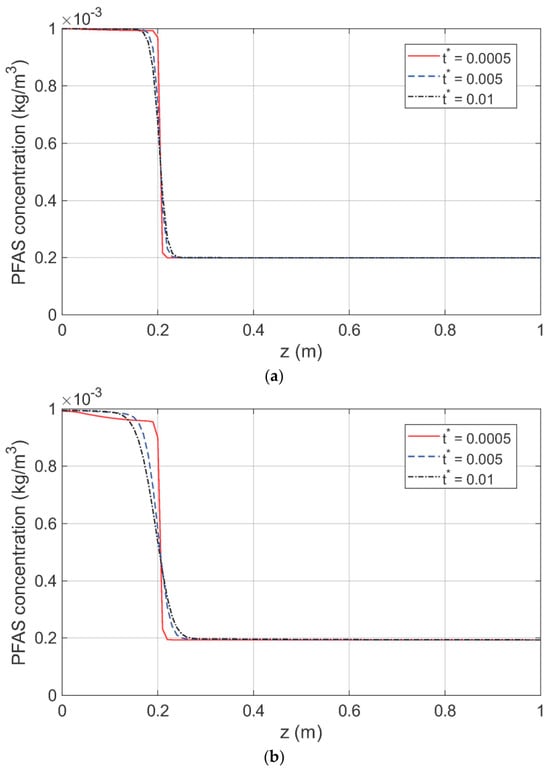
PFAS-laden fluid-filled porous media may be subjected to various mechanical loads which induce solid deformation and fluid flow and hence PFAS transport. This work employs a poroelasticity theory for unsaturated porous media to address the coupled solid deformation, fluid flow and PFAS transport
[...] Read more.
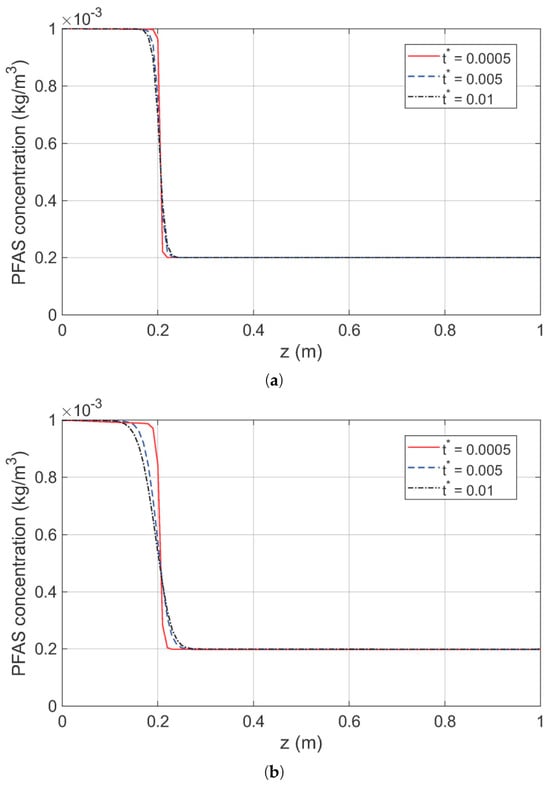
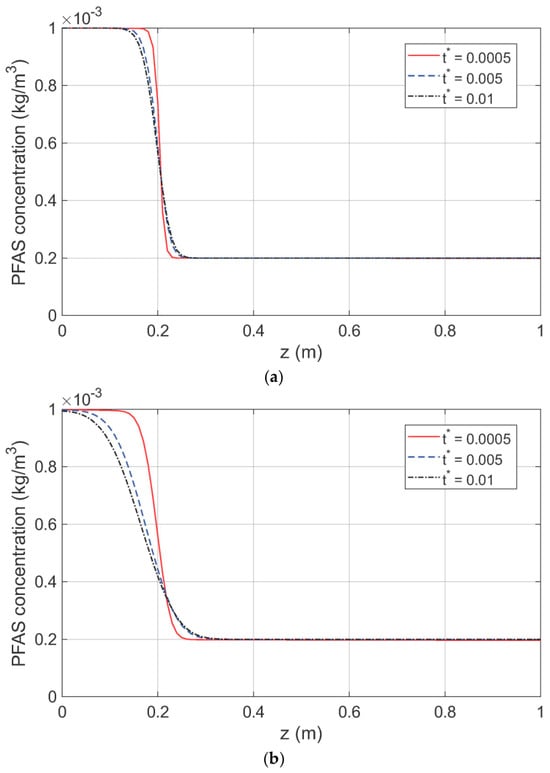
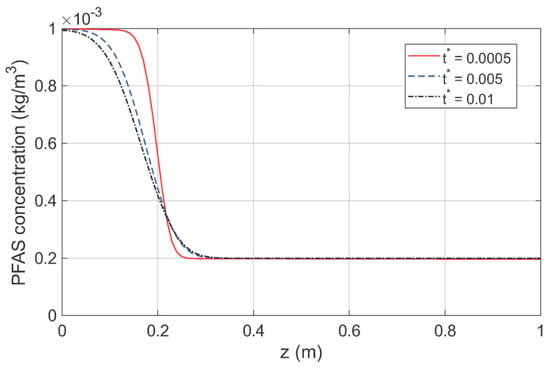
PFAS-laden fluid-filled porous media may be subjected to various mechanical loads which induce solid deformation and fluid flow and hence PFAS transport. This work employs a poroelasticity theory for unsaturated porous media to address the coupled solid deformation, fluid flow and PFAS transport in the vadose zone subjected to a mechanical load. The governing equation of the aqueous PFAS concentration is derived based on the PFAS mass balance that also considers the water content variation in the pores due to the solid deformation. Vertical PFAS transport in a finite soil layer under mechanical compression is studied using a finite difference method and the solutions of the pore fluid pressures and volumetric strain. Numerical results of the aqueous concentrations of perfluorooctane sulfonic (PFOS) in loamy sand and clay loam indicate that mechanical compression has pronounced effects on the spatial distribution of PFOS. In a loamy sand with relatively higher permeability, mechanical compression at the top drained surface leads to movement of PFOS from the topsoil to the surface thereby reducing the PFOS concentration in the topsoil especially at higher water saturations. The PFOS concentration in the subsoil, however, is not significantly influenced. The effect of mechanical compression on the PFOS concentration distribution in a clay loam can also be observed but is not as significant as in the loamy sand. The mechanical loading effects may be further explored to develop new technologies for PFAS risk assessment and remediation strategies.
Full article
(This article belongs to the Topic Transport, Transformation and Cycling of Elements in Water and Soil and Their Response to Human Activities)
►▼
Show Figures

Figure 1
Open AccessArticle
A Sensitivity Study of Vertical and Horizontal River–Aquifer Exchange and Implications for Flood Attenuation
by
Gadadhara de Figueiredo Ferraz and Tamás Krámer
Hydrology 2026, 13(7), 193; https://doi.org/10.3390/hydrology13070193 - 18 Jul 2026
Abstract
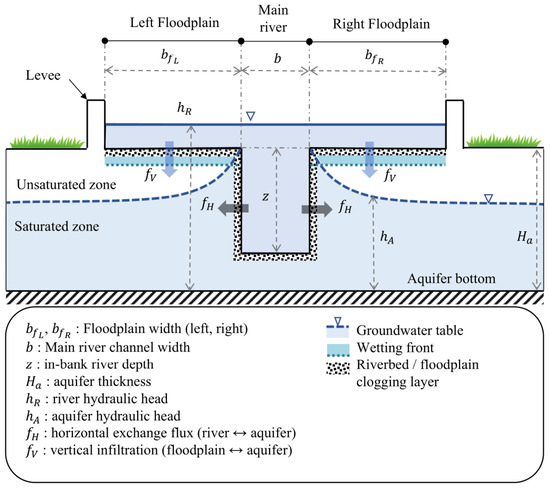
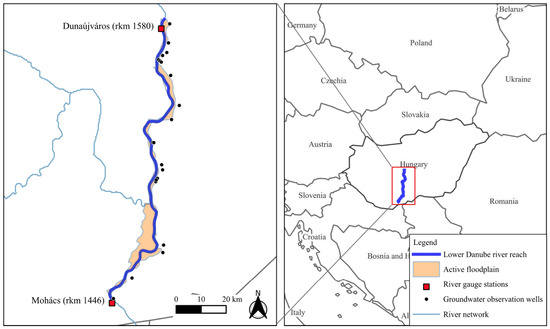
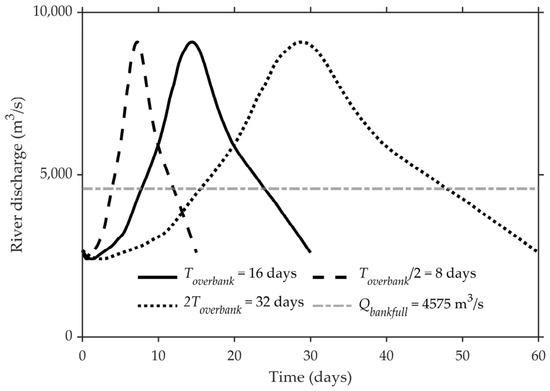
River–aquifer exchange during floods controls groundwater recharge and bank storage, yet its sensitivity to floodplain geometry, flood duration, and subsurface permeability remains insufficiently quantified. A coupled model integrating one-dimensional surface-water flow, two-dimensional groundwater flow, and vertically resolved unsaturated floodplain infiltration was parameterized using
[...] Read more.
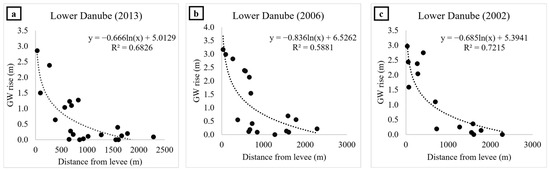
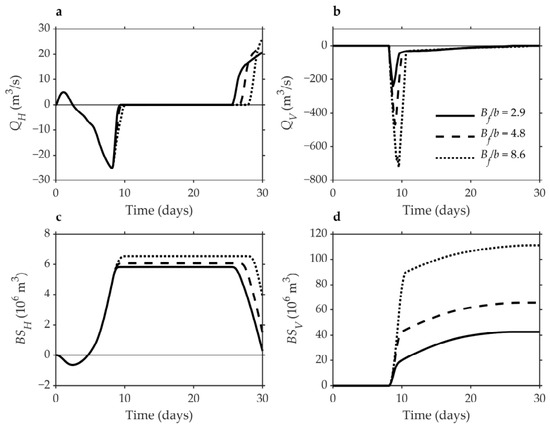
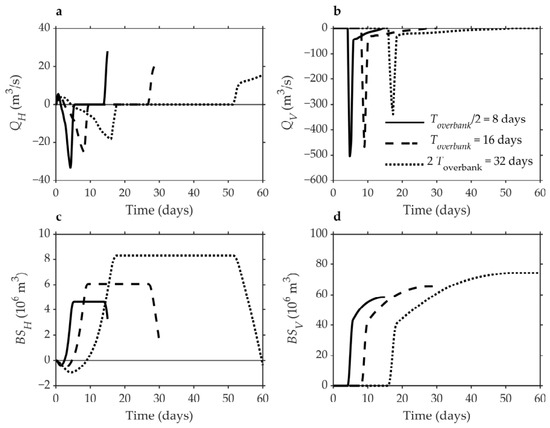
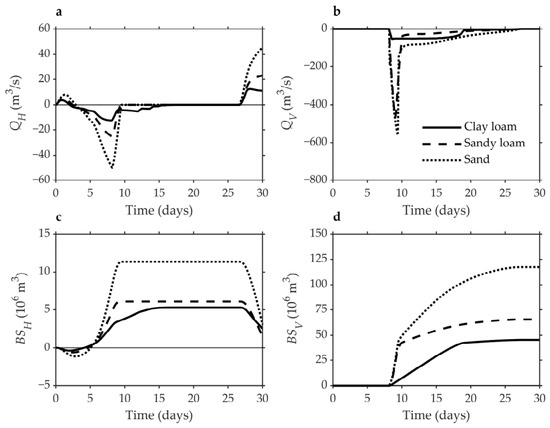
River–aquifer exchange during floods controls groundwater recharge and bank storage, yet its sensitivity to floodplain geometry, flood duration, and subsurface permeability remains insufficiently quantified. A coupled model integrating one-dimensional surface-water flow, two-dimensional groundwater flow, and vertically resolved unsaturated floodplain infiltration was parameterized using observation-derived bank-storage estimates from Hungarian Danube floods. Idealized scenarios evaluated the effects of floodplain width, flood duration, and aquifer and soil permeability on river–aquifer exchange, bank storage, and flood attenuation. Simulations indicated that, under the investigated conditions, vertical floodplain infiltration dominates exchange processes, accounting for approximately 82–92% of total exchange and bank storage, whereas horizontal riverbed exchange remains secondary. Floodplain geometry and flood duration exerted influences on bank storage and flood attenuation comparable to those of subsurface permeability. Wider floodplains enhanced infiltration, storage capacity, and flood attenuation. Short floods produced high but transient infiltration and strong peak attenuation, whereas longer floods promoted sustained infiltration, larger bank storage, and delayed attenuation. Subsurface permeability regulated exchange efficiency but exhibited a nonlinear influence on bank storage. These results demonstrated that flood attenuation during overbank flooding depends not only on river–aquifer exchange magnitude, but also on its partitioning and the temporal evolution of subsurface storage.
Full article
(This article belongs to the Section Surface Waters and Groundwaters)
►▼
Show Figures

Figure 1
Open AccessArticle
The Effects of Input Scale and Metric on Groundwater Level Forecasting with Deep Learning
by
Halima Hilal, Nourelhouda Karmouda, Tarik Bouramtane, Youssef Hamou-Ali, Ismail Mohsine, Houssne Bouimouass, Hassan Mosaid, Mounia Tahiri, Nadia Kassou, Ilias Kacimi and Marc Leblanc
Hydrology 2026, 13(7), 192; https://doi.org/10.3390/hydrology13070192 - 17 Jul 2026
Abstract
►▼
Show Figures
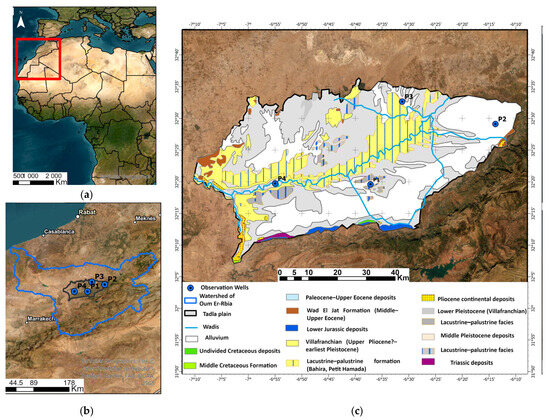
The Normalized Difference Vegetation Index (NDVI) is widely used as an indicator of irrigation activity in arid and semi-arid agricultural regions. This study evaluates how NDVI extraction scale and statistical metric influence groundwater level prediction accuracy in the irrigated Tadla Plain, MoroccoA total
[...] Read more.
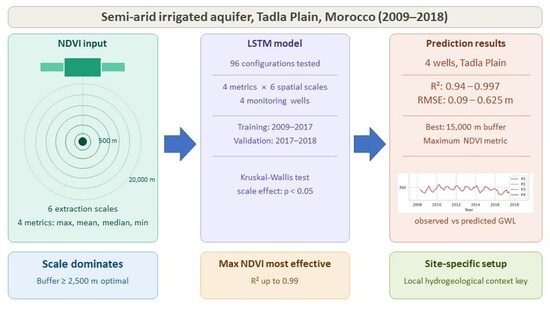
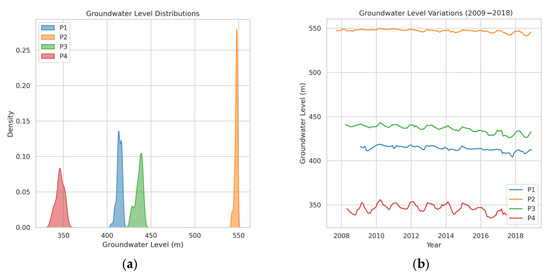
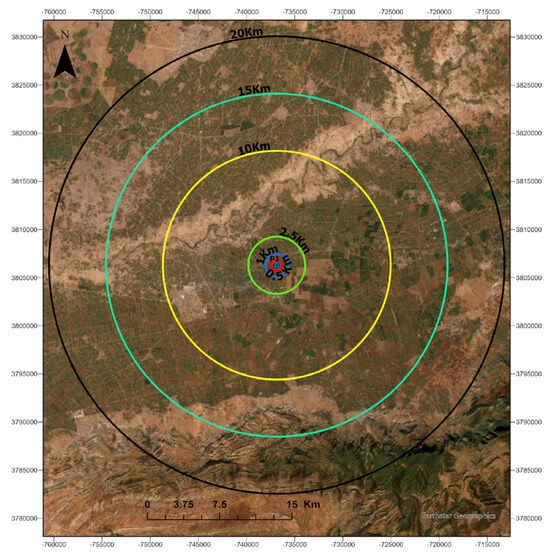
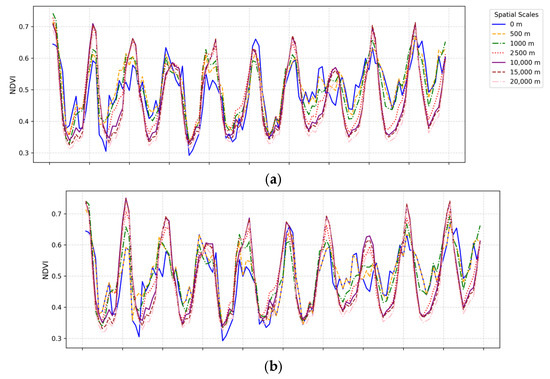
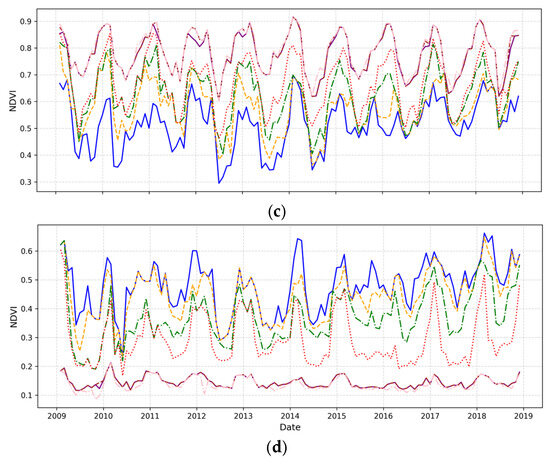
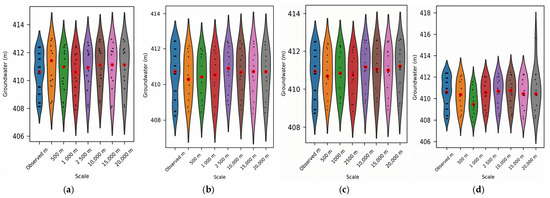
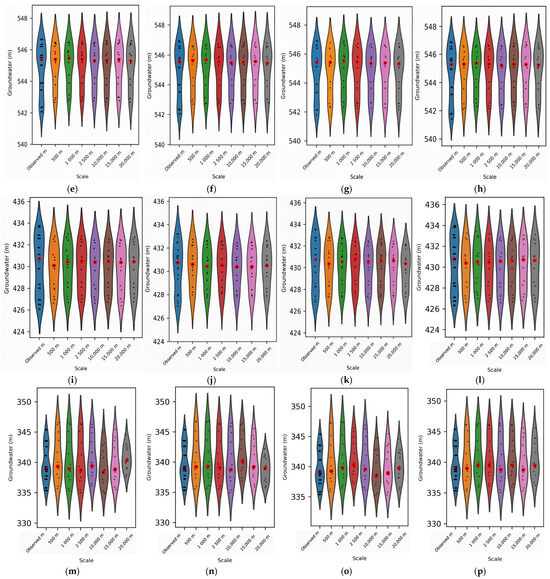
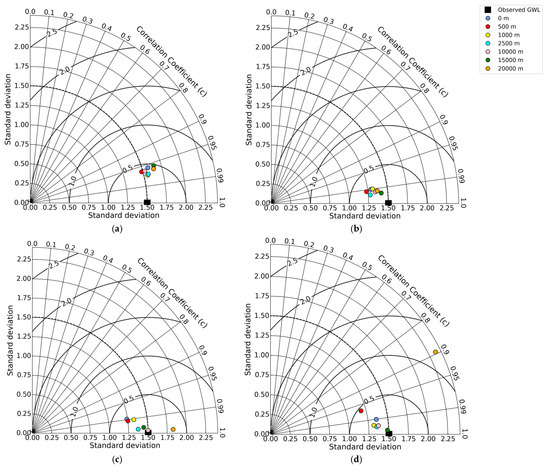
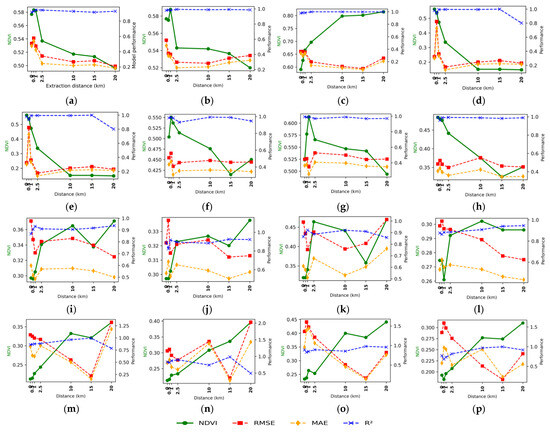
The Normalized Difference Vegetation Index (NDVI) is widely used as an indicator of irrigation activity in arid and semi-arid agricultural regions. This study evaluates how NDVI extraction scale and statistical metric influence groundwater level prediction accuracy in the irrigated Tadla Plain, MoroccoA total of 96 Long Short-Term Memory (LSTM) models were developed by combining six NDVI extraction scales, from the well pixel to 20,000 m buffers, and four statistical metrics: mean, median, maximum, and minimum. Results demonstrate that extraction scale is a critical factor controlling model performance. Across the four monitored wells, larger buffers (≥2500 m) generally outperformed smaller ones (≤1000 m), with the optimal scale occurring at 15,000 m for three wells, while one well achieved its best performance at the 1000 m scale. The best models achieved RMSE values between 0.09 and 0.625 m and R2 values ranging from 0.94 to 0.997. Maximum NDVI provided the highest predictive accuracy for three wells, whereas minimum NDVI performed best for one well. Statistical analyses further confirmed that extraction scale generally exerts a stronger influence on prediction performance than the choice of NDVI metric. Spatial validation revealed that irrigated areas more than doubled between 2001 and 2017, and model performance improved as NDVI captured this broader irrigation footprint. These findings suggest that groundwater level variations in the Tadla Plain are more strongly associated with NDVI signals extracted at broader spatial scales than with strictly local vegetation conditions around individual wells, highlighting the importance of optimizing both NDVI extraction scale and metric for groundwater forecasting in irrigated semi-arid regions.
Full article

Graphical abstract
Open AccessArticle
A Data-Driven Approach to Close the Water Balance of a Cascaded Multiple Reservoir–Lake System
by
Máté Chappon, Katalin Bene and Richard Ray
Hydrology 2026, 13(7), 191; https://doi.org/10.3390/hydrology13070191 - 16 Jul 2026
Abstract
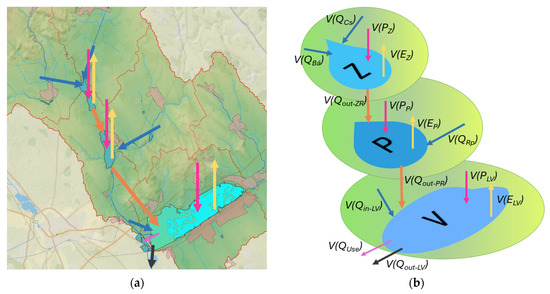
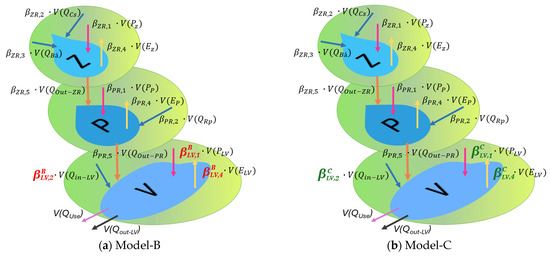
This study presents a data-driven methodology to develop and close the continuous water balance of a cascaded hydrological system consisting of two upstream regulating reservoirs and a downstream lake. The analysis is based on monthly hydrometeorological and hydrographic data for the period 1998–2024.
[...] Read more.
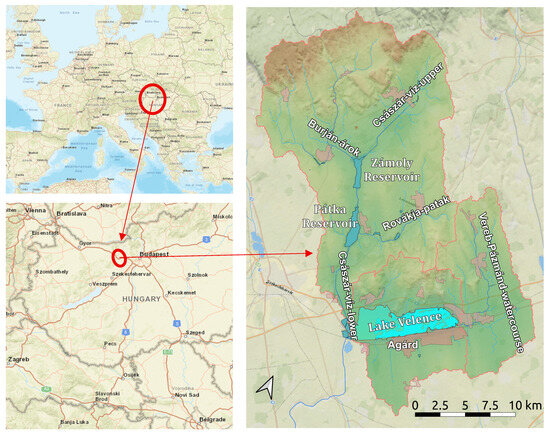
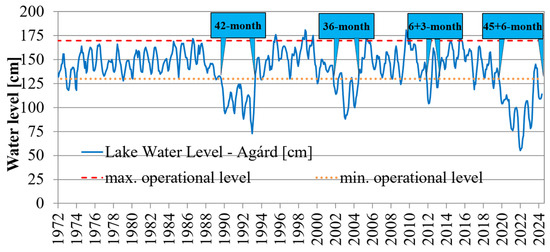
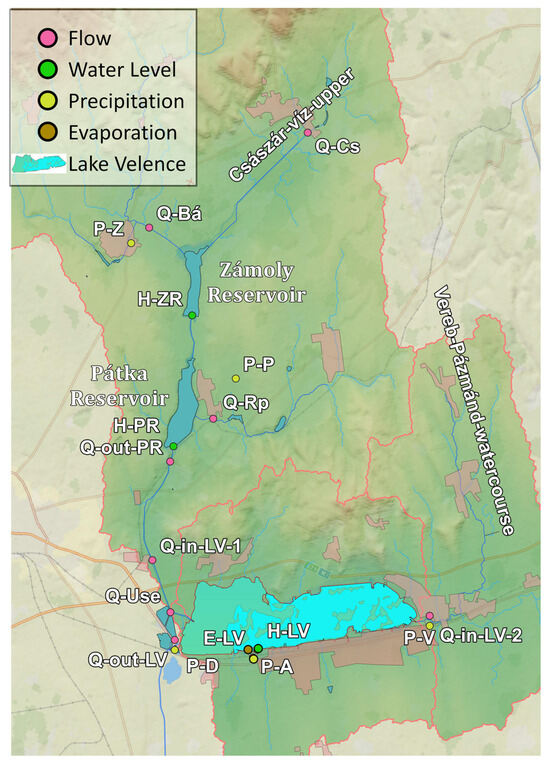
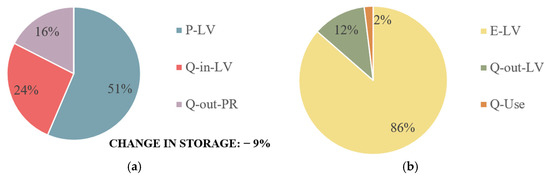
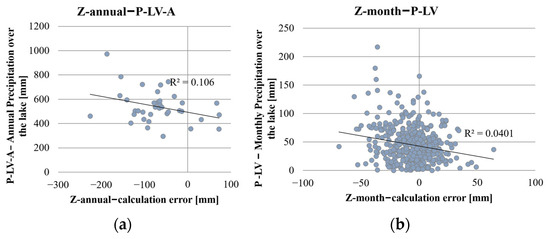
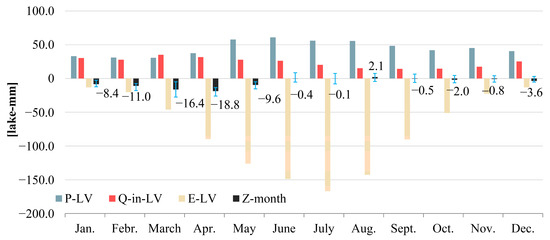
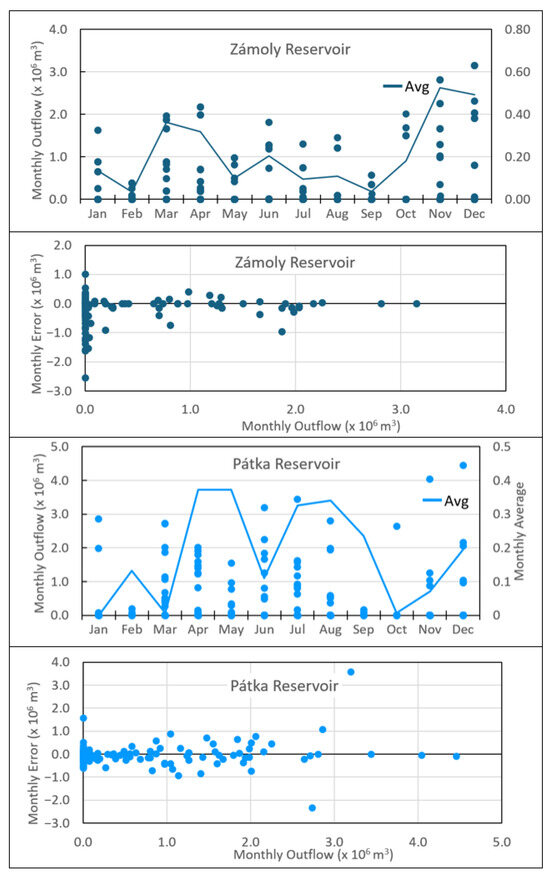
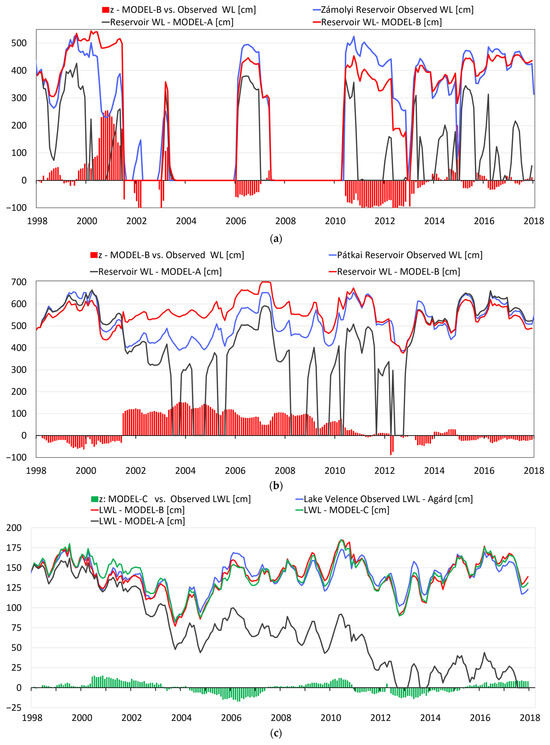
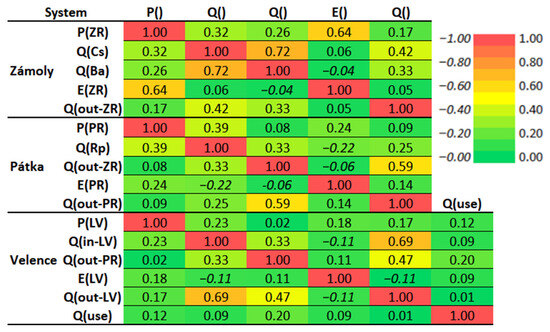
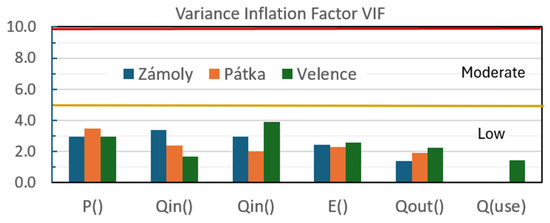
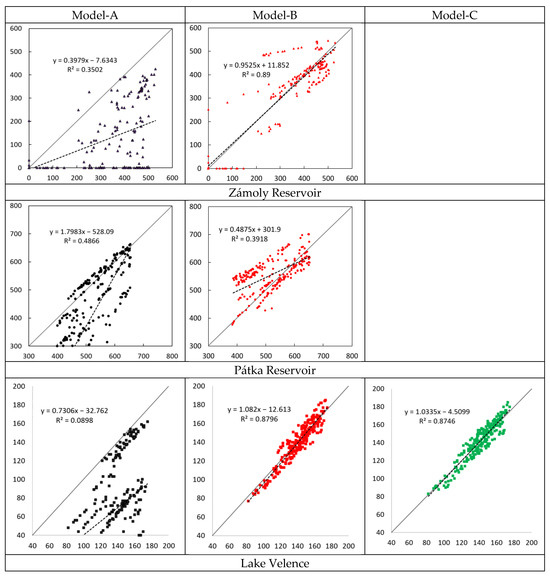
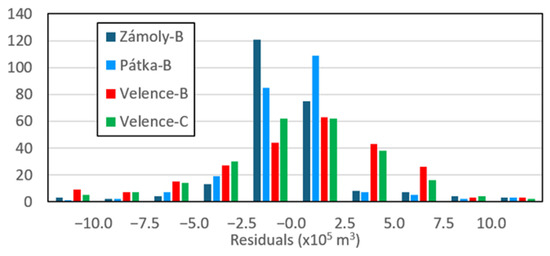
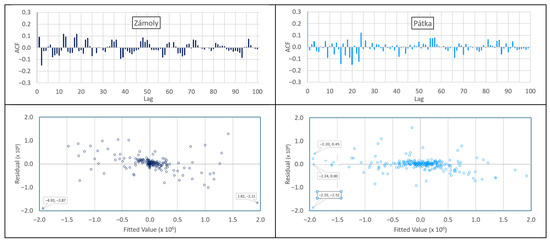
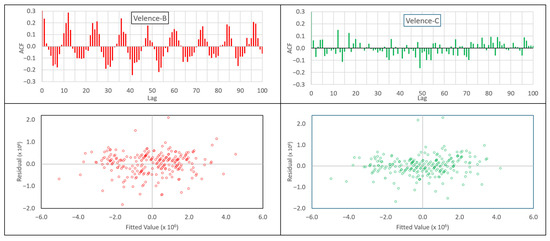
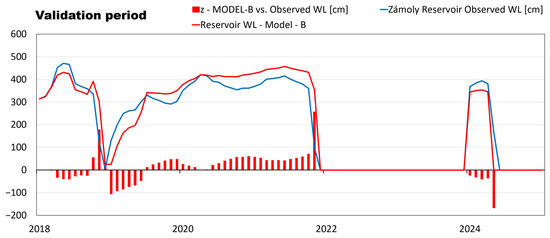
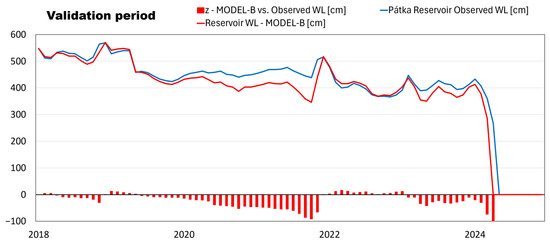
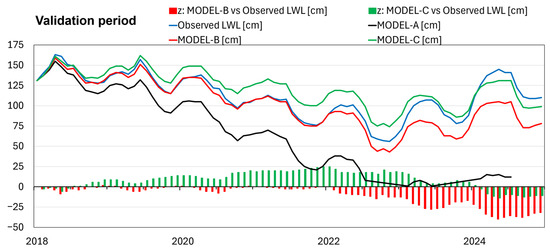
This study presents a data-driven methodology to develop and close the continuous water balance of a cascaded hydrological system consisting of two upstream regulating reservoirs and a downstream lake. The analysis is based on monthly hydrometeorological and hydrographic data for the period 1998–2024. A baseline water balance model using raw measured data was first implemented, followed by two bias correction approaches based on multiple linear regression coefficient estimation. The first approach applies uniform coefficients across all months, while the second accounts for seasonal variability by estimating coefficients only for the December–May period, when systematic errors are most pronounced. Model performance was evaluated using calibration (1998–2017) and validation (2018–2024) periods, with Nash–Sutcliffe efficiency (NSE) and residual diagnostics used as evaluation metrics. The baseline model showed substantial cumulative deviations due to systematic errors (NSE: −0.28 and −5.13 for the two reservoirs and −18.70 for the lake), confirming the need for bias correction. Both correction approaches significantly improved model performance, with NSE values up to 0.89 for reservoirs and 0.83–0.86 for the lake during calibration. In validation, the seasonally adjusted model performed more stably in simulating water levels for Lake Velence (NSE = 0.72) than the uniform coefficient model (NSE = 0.60), particularly under extreme hydrological conditions. Residual analysis further indicated improved independence and homoscedasticity when seasonal structure was considered. The results demonstrate that water balance closure in the system is affected by distributed errors across multiple components rather than a single dominant source. The proposed methodology provides a practical, scalable framework for reconstructing consistent water balance time series in data-limited, regulated systems and supports the development of water management scenarios.
Full article
(This article belongs to the Topic Water Management in the Age of Climate Change)
►▼
Show Figures

Figure 1
Open AccessArticle
Bridge Scour Analysis for Rocks: Classification, Method Selection, and Practical Case Studies
by
Darud E. Sheefa, Stanley Vitton, Zhen (leo) Liu and Brian Barkdoll
Hydrology 2026, 13(7), 190; https://doi.org/10.3390/hydrology13070190 - 16 Jul 2026
Abstract
Despite the availability of several scour calculation methods, bridge scour analysis for scour susceptible rocks is much less understood than its counterpart for sands, because scour calculation equations were traditionally obtained using flume tests with sands. As a result, there are three major
[...] Read more.
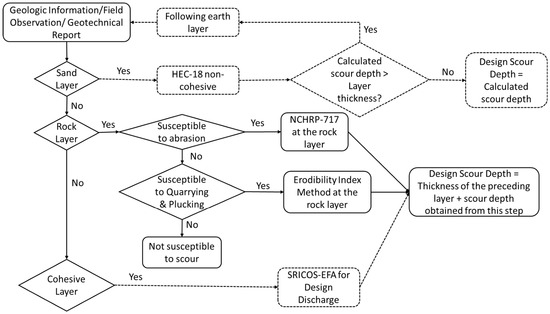
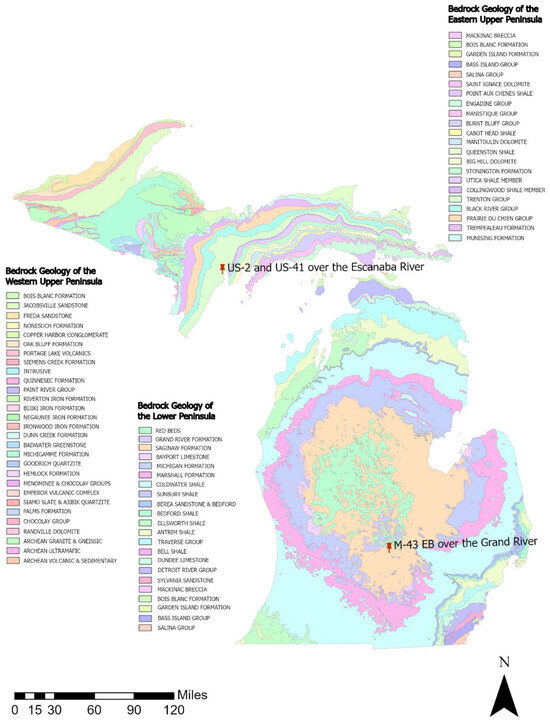
Despite the availability of several scour calculation methods, bridge scour analysis for scour susceptible rocks is much less understood than its counterpart for sands, because scour calculation equations were traditionally obtained using flume tests with sands. As a result, there are three major knowledge gaps in the bridge scour analysis for susceptible rocks: (1) a rock classification system is needed for scour considerations to serve as a pre-screening process before conventional scour analysis involving sampling, erodibility testing, and scour calculation, (2) there has been a lack of information to guide the scour analysis for rocks including detailed procedures, needed and available data, and interpretation of results, especially for real bridge sites, and (3) detailed comparisons between the available rock scour calculation methods and the widely used sand-based scour depth calculation equations are rare. This paper presents a study to bridge the above knowledge gaps. First, a rock classification system was proposed for the bedrock of Michigan to exemplify the use of a pre-screening tool for rock preliminary scour susceptibility determination. Then, two methods were selected for two modes of scour that are common to bridges: the Erodibility Index Method for the quarrying and plucking mode of rock scour and the NCHRP-717 method for the abrasion mode. Case studies were conducted at two real bridge sites using these methods as well as sand-based equations. These case studies are intended to demonstrate practical implementation using available project data, compare the outcomes of different scour-analysis methods, and identify common data limitations and implementation challenges.
Full article
(This article belongs to the Section Soil and Hydrology)
►▼
Show Figures

Figure 1
Open AccessArticle
Ecological Water Demand and Near-Natural Water-Replenishment Schemes for Wetlands in Semi-Arid Regions
by
Mingze Xiao, Fangli Su, Di Wang, Zining Wang, Pengxing Su, Hao Xu, Fei Song, Chao Wei, Haifu Li and Shuang Song
Hydrology 2026, 13(7), 189; https://doi.org/10.3390/hydrology13070189 - 13 Jul 2026
Abstract
Semi-arid wetlands are highly sensitive to changes in hydrological regimes, as strong evaporation often exceeds limited natural recharge. Ecological water replenishment is widely used to restore these systems, but schemes designed only to meet water-volume targets may cause excessive hydrodynamic disturbance, promote sediment
[...] Read more.
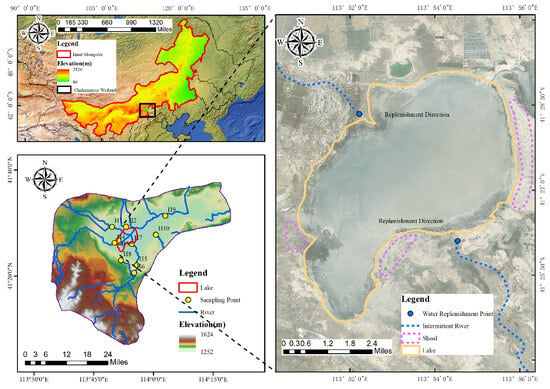
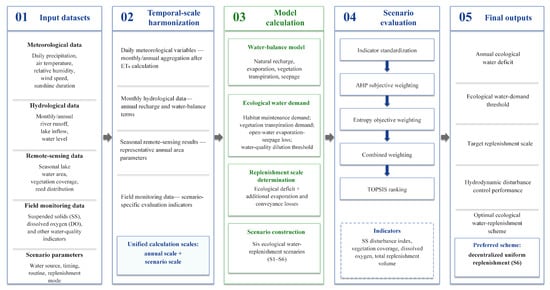
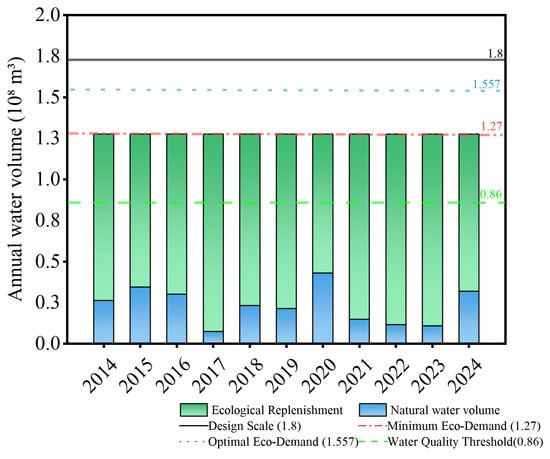
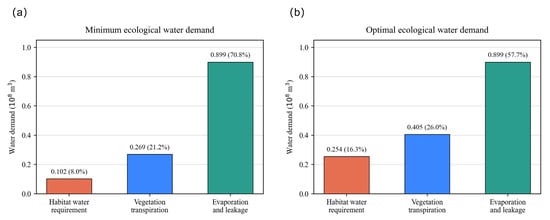
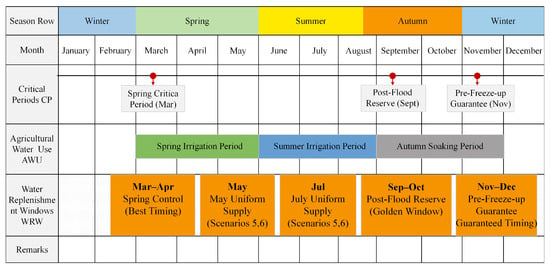
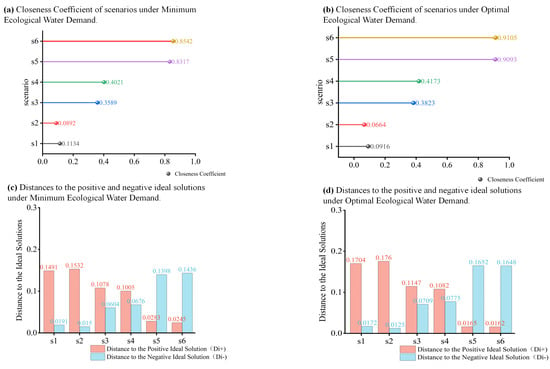
Semi-arid wetlands are highly sensitive to changes in hydrological regimes, as strong evaporation often exceeds limited natural recharge. Ecological water replenishment is widely used to restore these systems, but schemes designed only to meet water-volume targets may cause excessive hydrodynamic disturbance, promote sediment resuspension, and increase the release of internal pollutants. In this study, we developed an ecological water-replenishment assessment framework for Chahannaoer Wetland that incorporates ecological water-demand thresholds, suspended-solids disturbance, and an AHP–entropy weight–TOPSIS decision model. Using hydrological and meteorological data from 2014 to 2024, six replenishment scenarios were evaluated in terms of water-balance recovery, disturbance control, and habitat suitability. The results show that Chahannaoer Wetland experienced a persistent evaporation-dominated water deficit. The mean annual natural recharge was 0.225 × 10⁸ m3, with a mean annual ecological water shortage of 1.03 × 10⁸ m3 and an evapotranspiration-to-recharge ratio of 3.42–4.56. Based on the previous comprehensive water-quality assessment using DO, COD, NH3-N, TN, and TP, the minimum water volume required to maintain Class IV water quality was 0.86 × 10⁸ m3, whereas the suitable ecological water demand ranged from 1.27 × 10⁸ to 1.56 × 10⁸ m3. With the total replenishment volume held constant, centralized replenishment met the required water volume but substantially increased near-bed disturbance and sediment resuspension risk. By contrast, decentralized uniform replenishment performed best, with the highest relative closeness coefficient of 0.9105, a disturbance index of approximately 0.32, and water depths maintained within the suitable habitat range of 30–50 cm. These findings suggest that ecological restoration in semi-arid wetlands should move beyond volume-based water supplementation and pay greater attention to the timing, pathway, and hydrodynamic effects of replenishment. The proposed framework provides a quantitative basis for optimizing ecological water replenishment in evaporation-dominated wetlands and other inland lakes in arid and semi-arid regions.
Full article
(This article belongs to the Topic Linking Agricultural–Hydrological Processes and Extreme Events Under a Changing Climate)
►▼
Show Figures

Figure 1
Open AccessArticle
Topographic and Climatic Controls on Depth–Duration–Frequency Curve Parameters in the Gargano Promontory (Southern Italy)
by
Gabriele Iemmolo, Andrea Petroselli, Nunzio Angiola and Ciro Apollonio
Hydrology 2026, 13(7), 188; https://doi.org/10.3390/hydrology13070188 - 12 Jul 2026
Abstract
►▼
Show Figures
Accurate estimation of depth–duration–frequency (DDF) curves is essential for hydrological analyses and flood-risk mitigation. Regionalization methods are particularly important in areas with limited observations, but their performance may deteriorate where topography and climate generate strong spatial variability. This study investigates the Gargano promontory
[...] Read more.
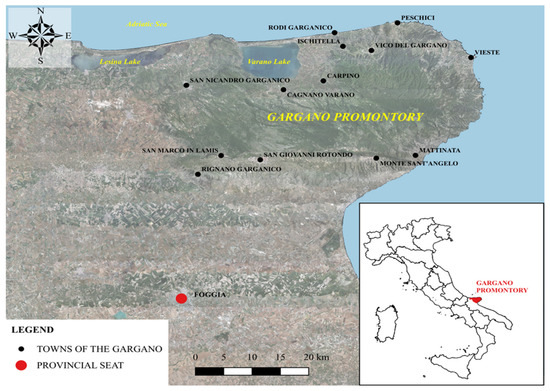
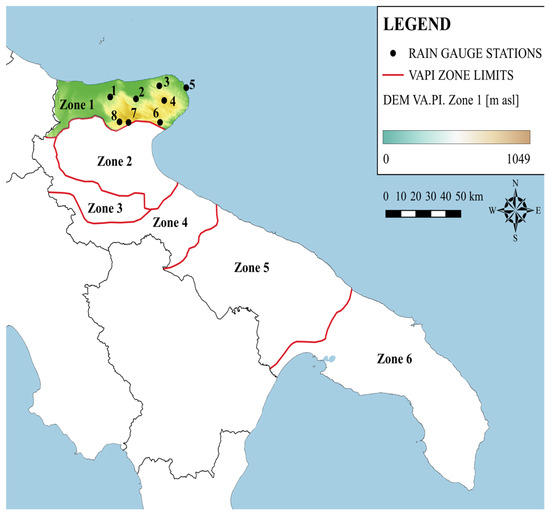
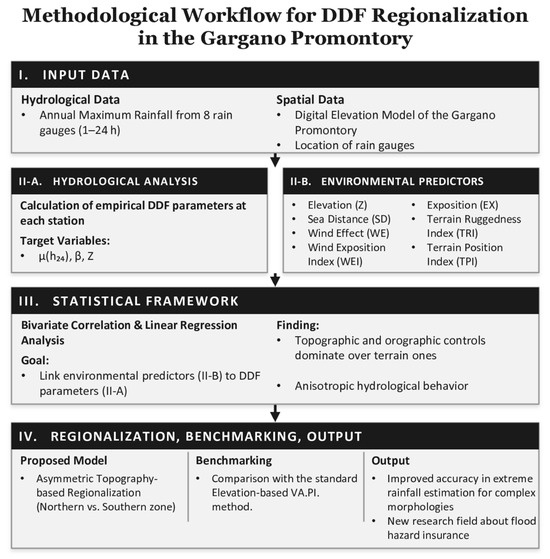
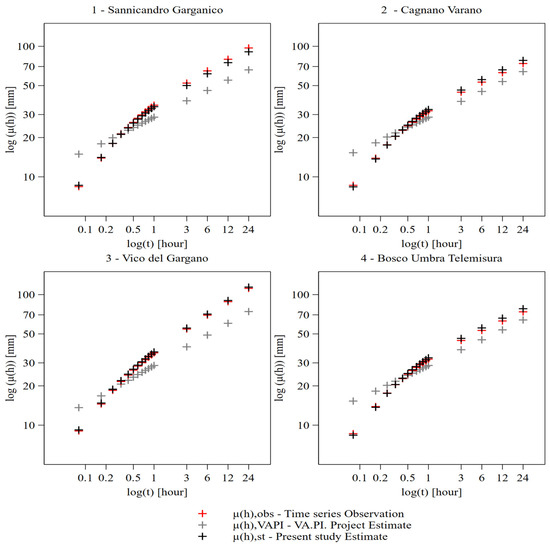
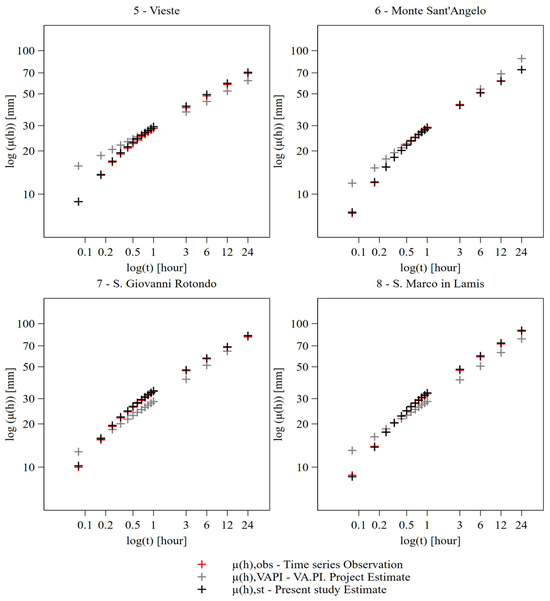
Accurate estimation of depth–duration–frequency (DDF) curves is essential for hydrological analyses and flood-risk mitigation. Regionalization methods are particularly important in areas with limited observations, but their performance may deteriorate where topography and climate generate strong spatial variability. This study investigates the Gargano promontory in southern Italy, an area that is commonly treated as a single hydrologically homogeneous zone despite its marked morphological and climatic contrasts. Annual maximum rainfall data from eight rain gauges, together with topographic and climatic descriptors, were analyzed to assess whether local factors help explain the variability of DDF-curve parameters. The analysis focused on elevation, distance from the sea, and a wind-effect index derived from a digital elevation model. The results indicate that the regional behavior of extreme rainfall is not spatially uniform and that several DDF-curve parameters are influenced by local physiographic controls. Different controls emerge for different station groups, and a physiographically based subdivision of the Gargano promontory into windward and leeward sectors provides a more coherent representation of DDF-curve parameters than the currently adopted single-zone regionalization.
Full article

Figure 1
Open AccessArticle
Projected Global Changes in Severe and Extreme Drought Occurrence: A CMIP6 Multi-Model Assessment Using SPI, SPEI, and Concurrent SPI-SPEI Conditions
by
Aili Yang, Jiaona Guo, Yueyu Su, Yurui Fan and Xiuquan Wang
Hydrology 2026, 13(7), 187; https://doi.org/10.3390/hydrology13070187 - 12 Jul 2026
Abstract
►▼
Show Figures
Understanding how different drought indicators characterise future drought conditions is essential for climate monitoring and adaptation planning. This study quantified annual severe- and extreme-drought occurrence rates at the 1- and 3-month timescales using the Standardised Precipitation Index (SPI), the Standardised Precipitation Evapotranspiration Index
[...] Read more.
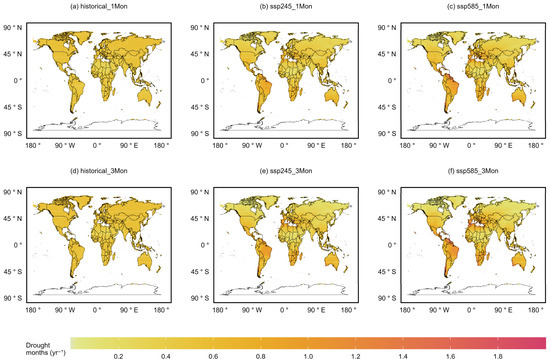
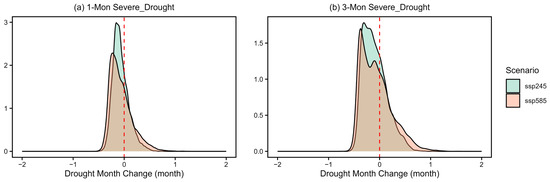
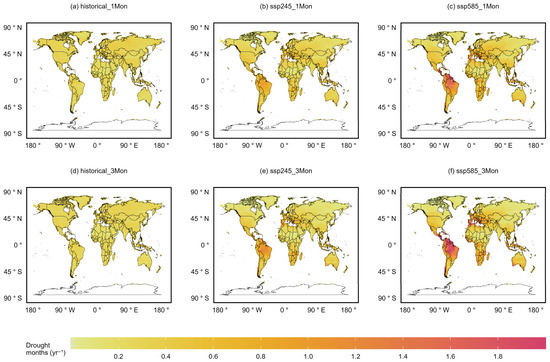
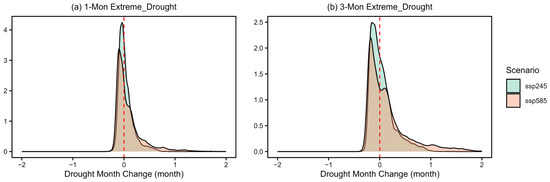
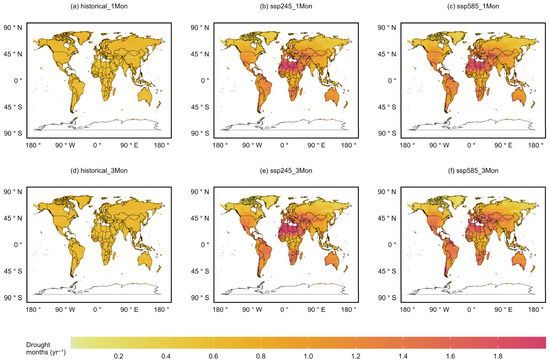
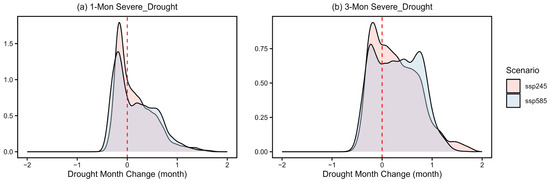
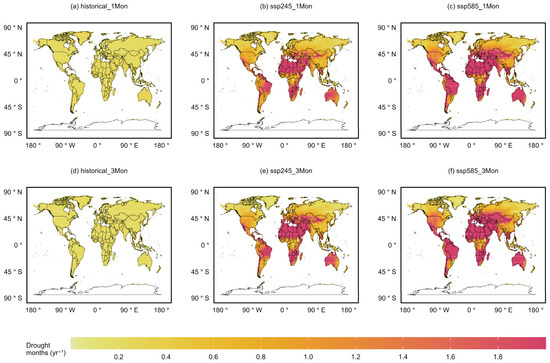
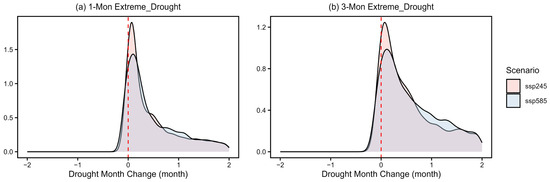
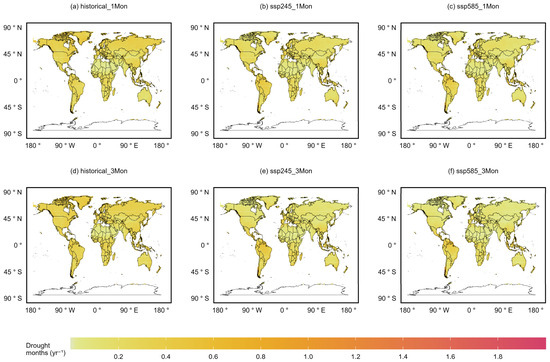
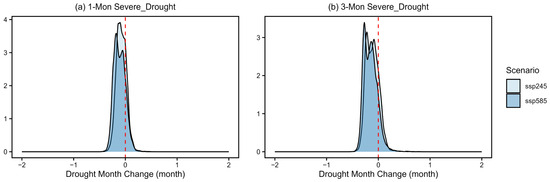
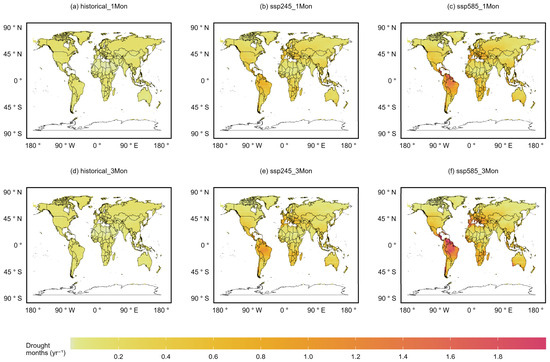
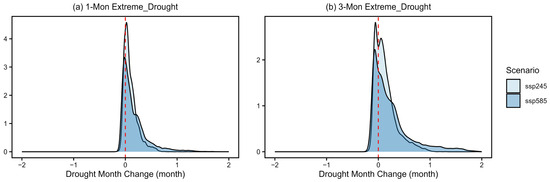
Understanding how different drought indicators characterise future drought conditions is essential for climate monitoring and adaptation planning. This study quantified annual severe- and extreme-drought occurrence rates at the 1- and 3-month timescales using the Standardised Precipitation Index (SPI), the Standardised Precipitation Evapotranspiration Index (SPEI), and their concurrent signals. Historical conditions during 1951–2010 were compared with projections for 2041–2100 under SSP245 and SSP585 using an ensemble of 12 CMIP6 General Circulation Models. Inter-model uncertainty was assessed using the 5th and 95th ensemble quantiles. The results reveal marked contrasts between precipitation-based and potential-evapotranspiration-sensitive drought indicators. Globally, SPI-based severe-drought occurrence decreases under both scenarios, whereas SPI-based extreme-drought occurrence increases, particularly at the 3-month timescale under SSP585. Stronger and more spatially extensive increases are identified using SPEI. The global mean occurrence rate of SPEI1-based extreme drought increases from 0.231 month/year historically to 0.791 month/year under SSP245 and 1.197 month/year under SSP585. For SPEI3, the corresponding rate increases from 0.207 to 1.090 and 1.716 month/year, respectively, with approximately 92.3% of land grid cells showing increases under SSP585. Concurrent SPI-SPEI severe-drought occurrence decreases, while concurrent extreme-drought occurrence increases across approximately 70–77% of land grid cells. This contrast indicates a redistribution of concurrent drought months from the severe to the extreme severity class under a mutually exclusive classification scheme, particularly at the 3-month timescale. The Mediterranean region, the Amazon and other parts of South America, southern Africa, parts of West and Central Asia, and Australia consistently emerge as major hotspots. Ensemble-quantile results support the direction of increasing SPEI-based and concurrent extreme-drought occurrence, although substantial uncertainty remains in the magnitude of change. These findings demonstrate the value of jointly considering precipitation-based and evaporative-demand-sensitive indicators in drought monitoring and regional climate adaptation planning.
Full article

Figure 1
Open AccessArticle
Surface Runoff Risk and Resilience Planning in a Plateau City Under System Non-Stationarity
by
Xinyu Wang, Ningkun Kang, Zihan Zhu, Jingli Zhang, Guanyu Chen, Samuel A. Cushman, Guifang Wang, Yawen Wu and Tian Bai
Hydrology 2026, 13(7), 186; https://doi.org/10.3390/hydrology13070186 - 11 Jul 2026
Abstract
►▼
Show Figures
Variations in urban surface runoff are often attributed to static infrastructure, neglecting the non-stationary hydrological responses induced by rapid urbanization and intricate micro-topography. This study introduces a Pressure–Trend–Pulse (PTP) framework to examine surface runoff dynamics in Kunming, China. By integrating continuous Soil and
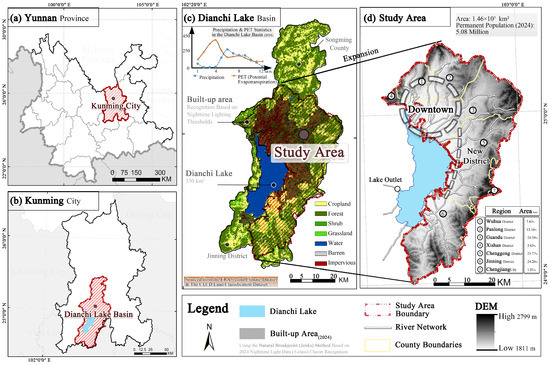
[...] Read more.
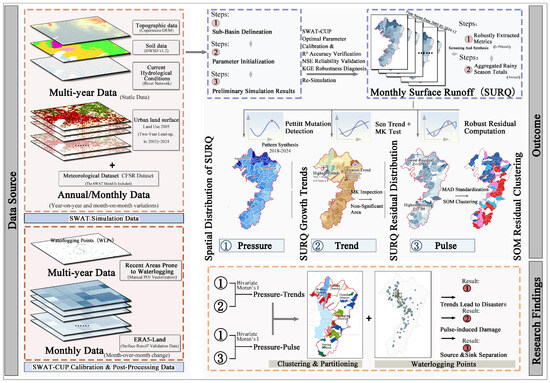
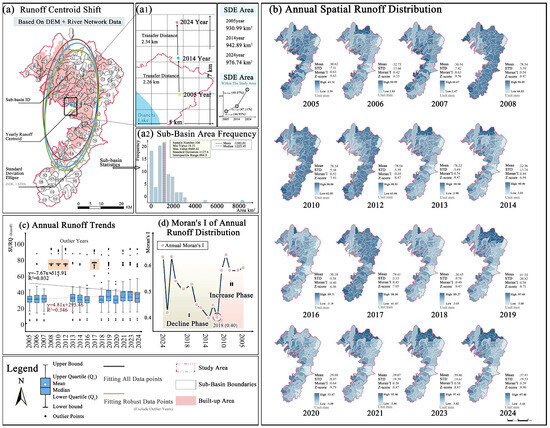
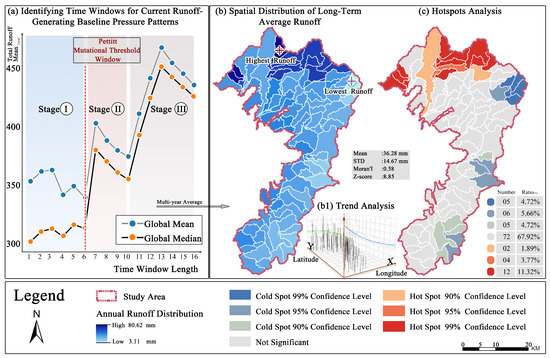
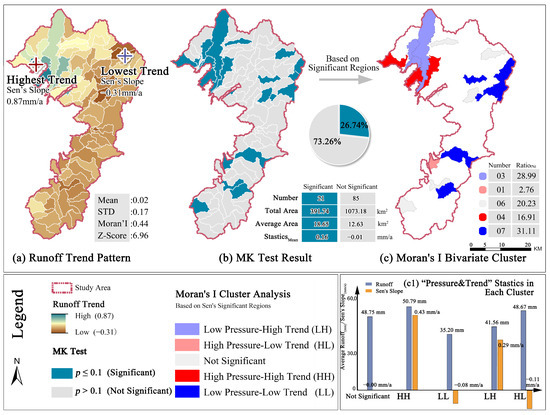
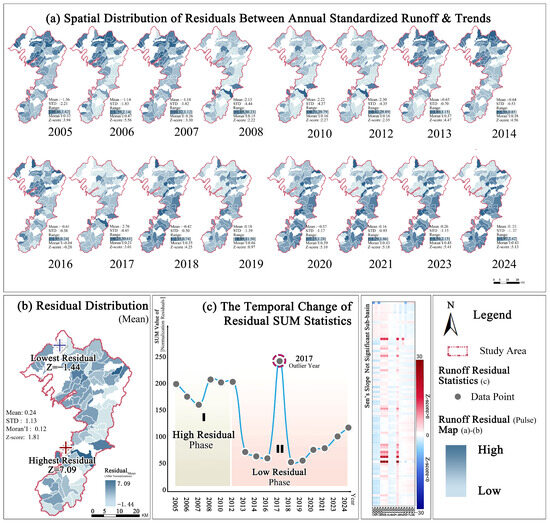
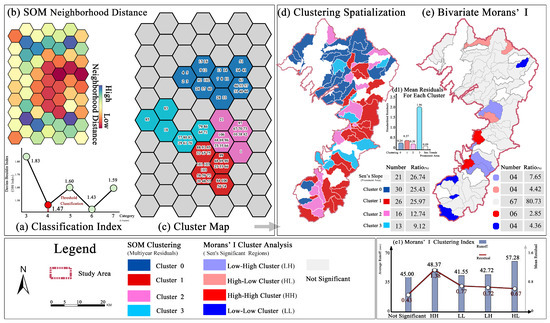
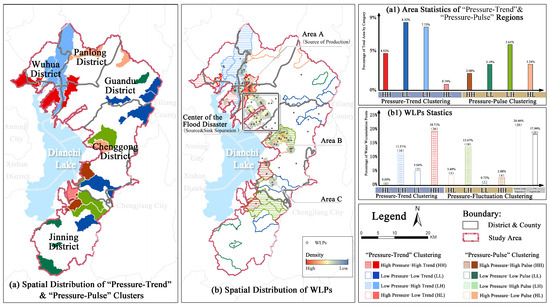
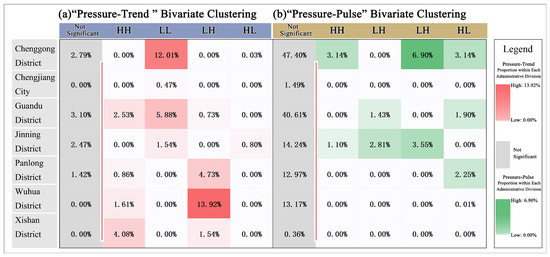
Variations in urban surface runoff are often attributed to static infrastructure, neglecting the non-stationary hydrological responses induced by rapid urbanization and intricate micro-topography. This study introduces a Pressure–Trend–Pulse (PTP) framework to examine surface runoff dynamics in Kunming, China. By integrating continuous Soil and Water Assessment Tool (SWAT) simulations (2005–2024), Sen’s slope estimation, the Mann–Kendall test, robust residual analysis, and Self-Organizing Map (SOM) clustering, we quantify these multi-dimensional changes. The findings indicate: (1) runoff displays a structural north–south gradient, with the generation centroid migrating northward at a rate of 2.3 km per decade; (2) non-stationary positive trends (0.16 mm/year) are exclusively concentrated in northern sub-basins, which constitute 26.74% of the total area, thereby exacerbating long-term cumulative pressure; and (3) detrended residual analysis reveals high-frequency pulse volatility predominantly in the southern sink areas. Overlaying 139 historical waterlogging points confirms that trend-driven and pulse-driven risks account for 30.22% and 13.67% of urban disasters, respectively. Furthermore, approximately 22% of waterlogging occurrences fall within non-significant downstream zones, implying a potential upstream-downstream source–sink decoupling. The PTP framework highlights the necessity of differentiated resilience planning: upstream source-control and downstream adaptive buffering.
Full article

Figure 1
Open AccessArticle
Flood Susceptibility Mapping: Scenario-Based Multi-Criteria Decision-Making Versus Random Forest Model
by
Mehdi Rahimi, Bahram Malekmohammadi, Mohammad Karimi Firozjaei, Reza Kerachian and Farhad Bahmanpouri
Hydrology 2026, 13(7), 185; https://doi.org/10.3390/hydrology13070185 - 11 Jul 2026
Abstract
Floods are among the most destructive natural hazards, posing a significant risk to lives and infrastructure worldwide. Effective flood risk management demands precise, multidimensional approaches. In this direction, the current study aims to evaluate and compare two methods for flood-risk assessment: the scenario-based
[...] Read more.
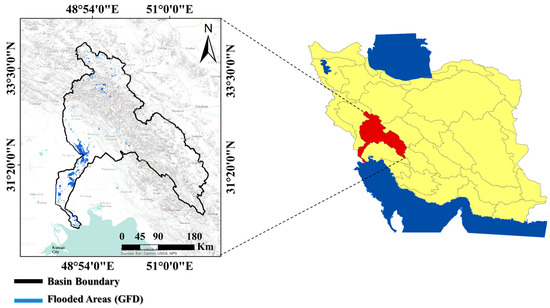
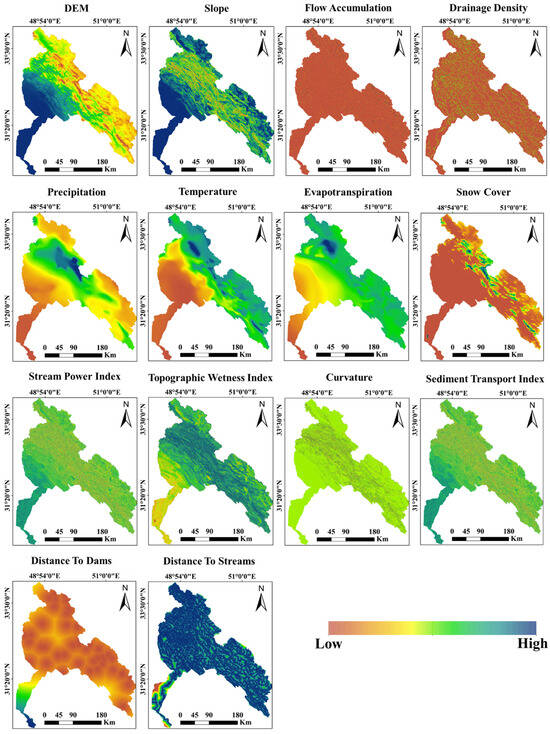
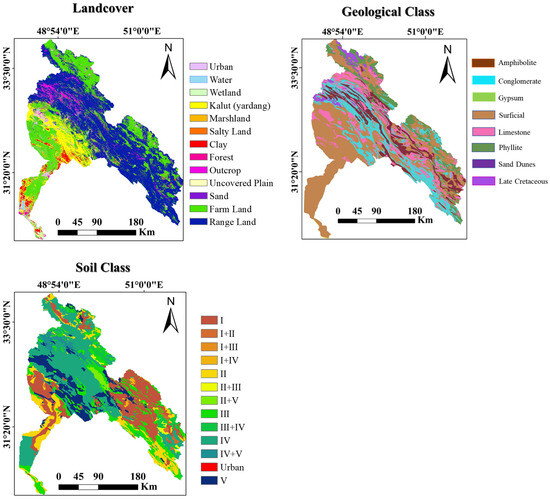
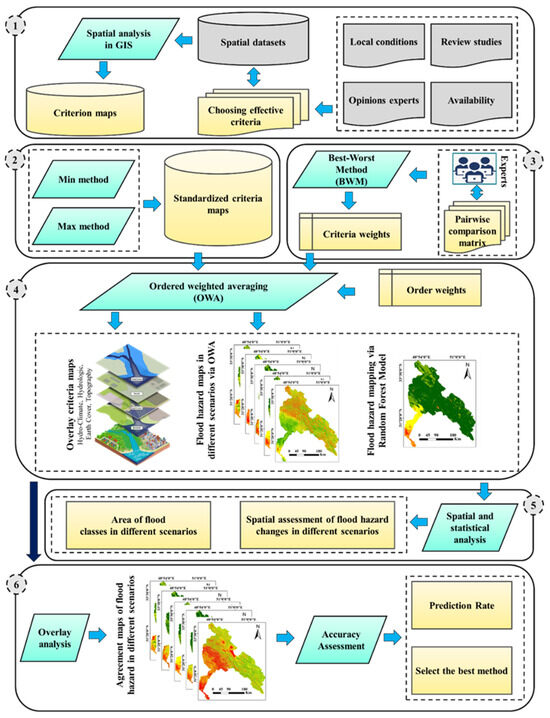
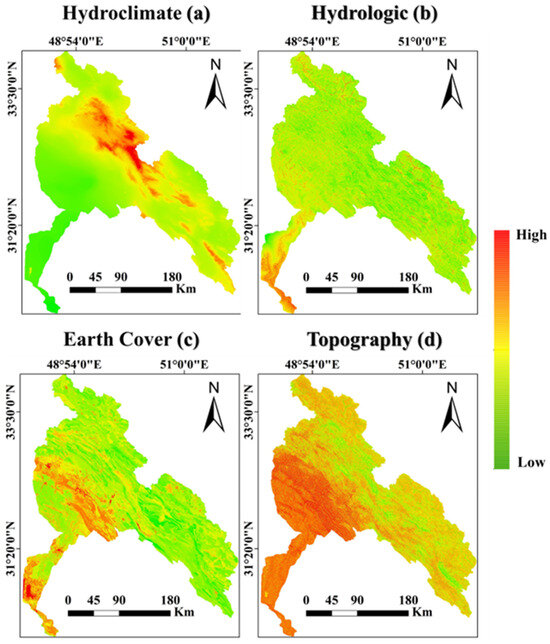
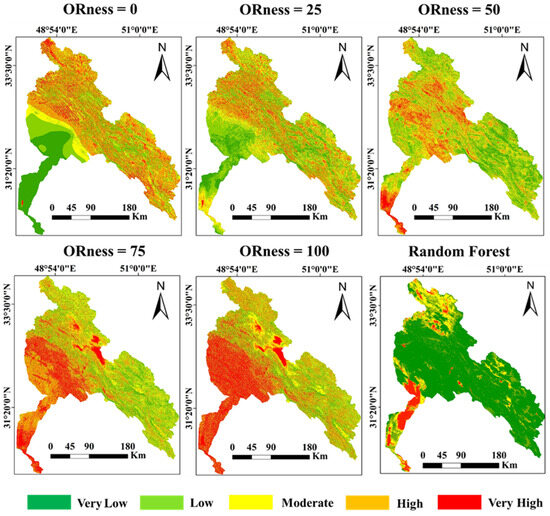
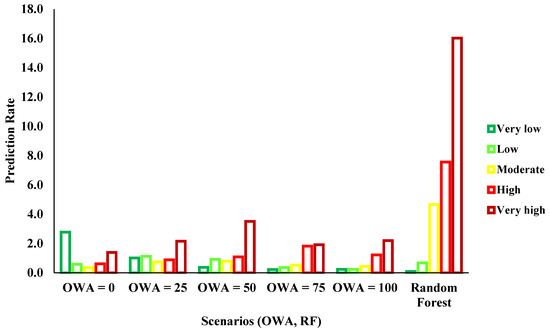
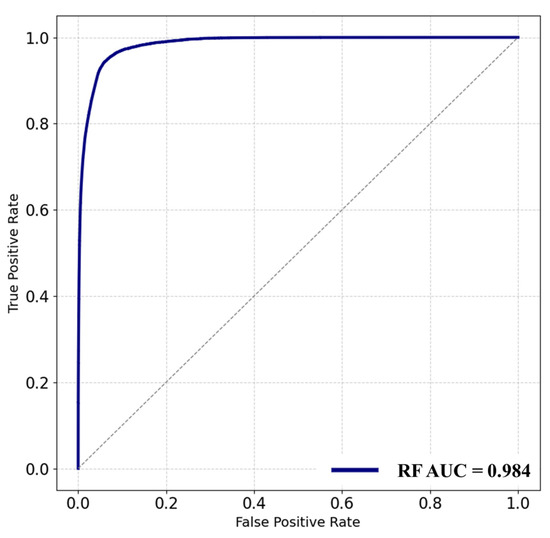
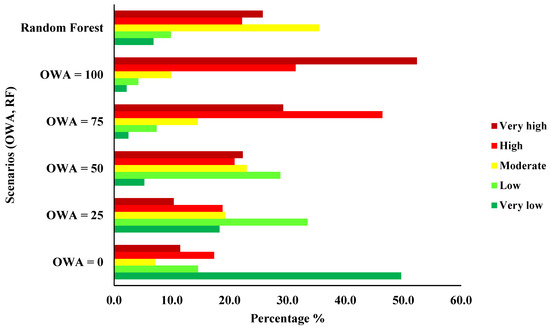
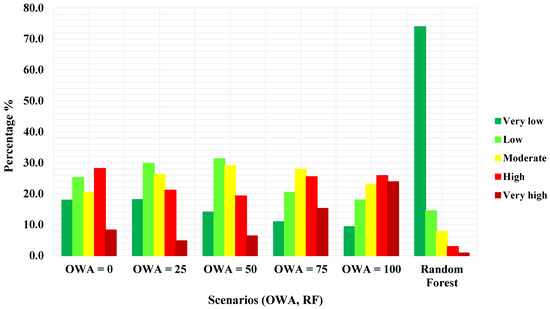
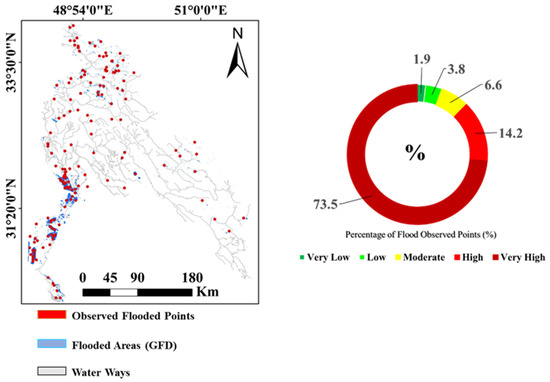
Floods are among the most destructive natural hazards, posing a significant risk to lives and infrastructure worldwide. Effective flood risk management demands precise, multidimensional approaches. In this direction, the current study aims to evaluate and compare two methods for flood-risk assessment: the scenario-based Ordered Weighted Averaging (OWA) and the data-driven Random Forest (RF) method. To this end, the Great Karun watershed in Iran was chosen due to its complex hydrological and climatic conditions. Hydro-climatic, hydrological, topographic, land-cover datasets, and actual flood observations were applied and analyzed based on fifteen influencing factors recommended by expert opinion. In the OWA approach, while factor weights were determined using the Best-Worst Method, flood-risk maps were produced based on five scenarios: very optimistic, optimistic, intermediate, pessimistic, and very pessimistic. In the RF approach, factor importance index was calculated via the mean decrease impurity algorithm, and the model was trained to generate flood-risk maps. Results showed that distance from rivers and slope were the most influential factors in OWA, while precipitation and flow accumulation dominated in RF. Prediction rate for OWA scenarios ranged from 1.4 to 3.5%, while RF achieved 16.0%, and the Area Under the Curve (AUC) was 0.984. Optimistic scenarios overestimated, and pessimistic scenarios underestimated risk, with the OWA intermediate scenario most closely matching RF results. RF demonstrated superior performance for flood-risk classification, highlighting its applicability for precise flood management. Overall, this study presents a novel comparative framework by integrating scenario-based OWA-BWM and Random Forest approaches to investigate the effects of decision-maker preferences and data-driven learning on flood susceptibility mapping.
Full article
(This article belongs to the Special Issue Advancements in Measuring and Modelling River Flow Characteristics and Sediment Transport)
►▼
Show Figures

Figure 1
Open AccessArticle
Deciphering Urban Flood Drivers: An Explainable Machine Learning Approach to Vulnerability Assessment in Indonesian Catchments
by
Ahyahudin Sodri, Geovanny Branchiny Imasuly, Nuraeni Nuraeni and Annisa Layyina Ihsani
Hydrology 2026, 13(7), 184; https://doi.org/10.3390/hydrology13070184 - 11 Jul 2026
Abstract
Flooding is one of the most frequent and damaging natural disasters, accounting for nearly half of global disasters and posing a major challenge in Indonesia, where floods represent approximately 77% of all nationally recorded disaster events. Rapid urbanisation, land-use change, and climate-induced extreme
[...] Read more.
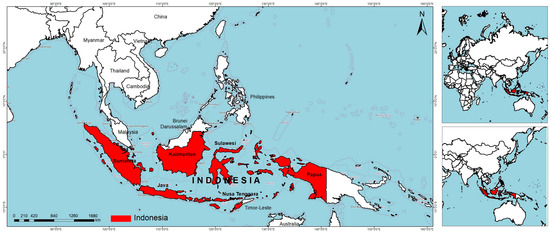
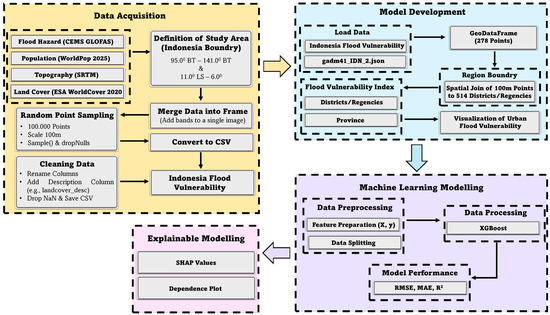
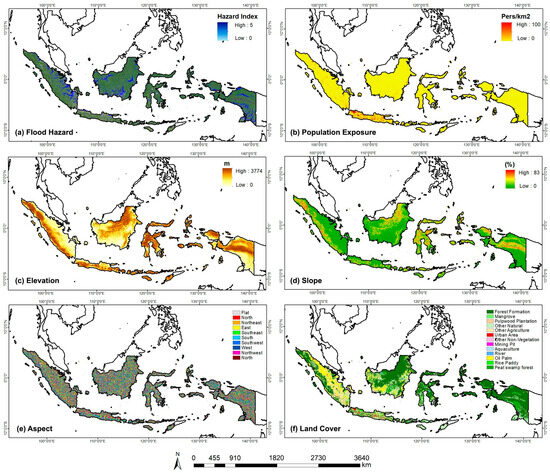
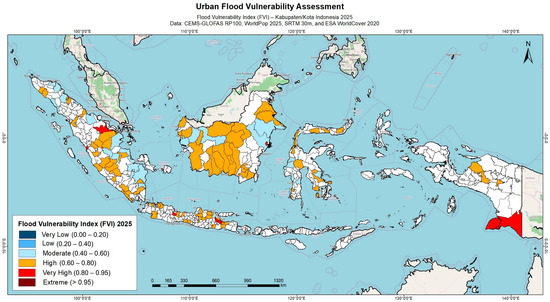
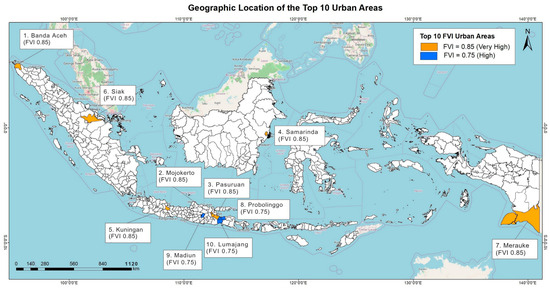
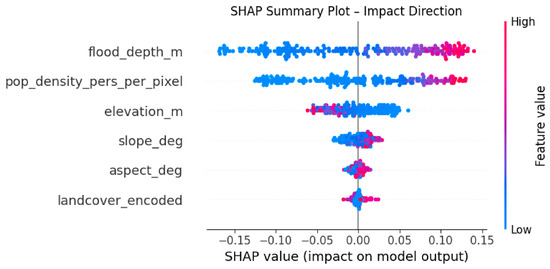
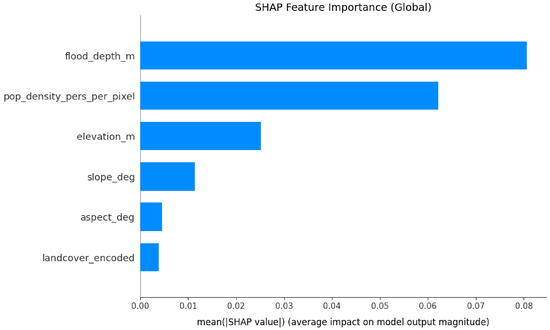
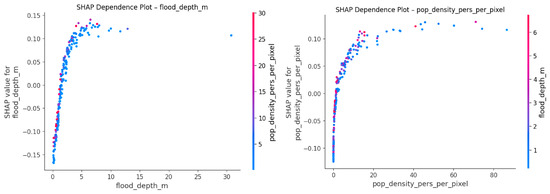
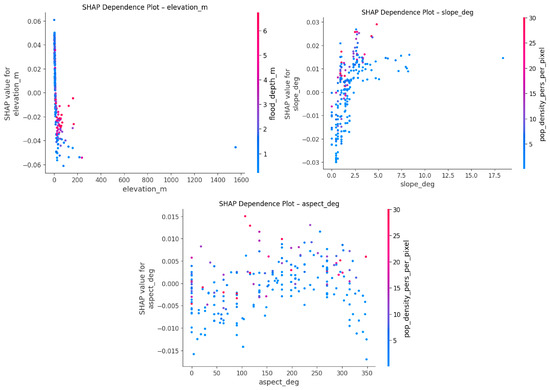
Flooding is one of the most frequent and damaging natural disasters, accounting for nearly half of global disasters and posing a major challenge in Indonesia, where floods represent approximately 77% of all nationally recorded disaster events. Rapid urbanisation, land-use change, and climate-induced extreme rainfall have intensified flood risks nationwide. However, existing vulnerability assessments remain fragmented and localised, limiting their relevance for national-scale adaptation planning. This study develops a measurable and explainable framework for assessing urban flood vulnerability across Indonesia using cloud-based geospatial data and interpretable machine learning. The approach integrates CEMS-GLOFAS (flood hazard), WorldPop (population exposure), SRTM (topography), and ESA WorldCover (land cover) datasets within Google Earth Engine (GEE). Flood vulnerability is quantified through a modified Flood Vulnerability Index (FVI) combining hazard, exposure, and physical vulnerability components. The Extreme Gradient Boosting (XGBoost) model predicts FVI values, while SHapley Additive exPlanations (SHAP) and Partial Dependence Plots (PDPs) enhance model transparency and identify the influence of key variables such as flood depth, population density, and elevation. The model achieved high predictive accuracy (R2 = 0.89; RMSE = 0.04728 FVI units, dimensionless) and revealed substantial spatial heterogeneity across 514 districts, with the highest FVI (0.75–0.85) in Banda Aceh, Mojokerto, Pasuruan, Samarinda, and Merauke. The integration of GEE and explainable AI offers a transparent, scalable framework to support data-driven flood risk mitigation and urban climate resilience in Indonesia.
Full article
(This article belongs to the Special Issue Urban Hydrology and Hydroclimate Resilience for Climate Change Adaptation)
►▼
Show Figures

Figure 1
Open AccessArticle
From Late Nineteenth-Century Drought to Modern Pluvial Conditions: Tree-Ring Reconstructions of Precipitation and Streamflow in the Central Alps
by
Julianne Webb, Maggie Duncan, Glenn Tootle, Wolfgang Gurgiser and Abel Andrés Ramírez Molina
Hydrology 2026, 13(7), 183; https://doi.org/10.3390/hydrology13070183 - 9 Jul 2026
Abstract
►▼
Show Figures
Understanding long-term hydroclimatic variability in the central Alps is essential when placing recent changes in precipitation and streamflow within a broader temporal context. This study reconstructs warm-season hydroclimatic variability in the central Alps using tree-ring-based hydroclimatic proxies from the Old World Drought Atlas
[...] Read more.
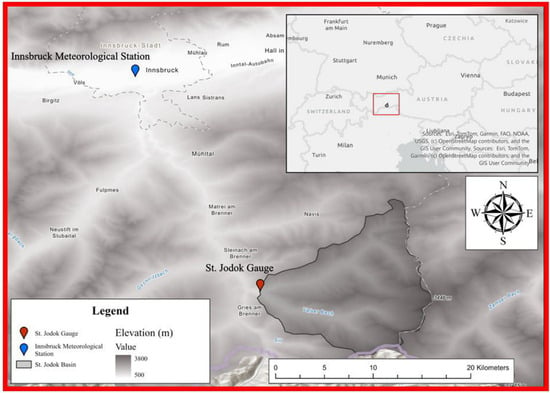
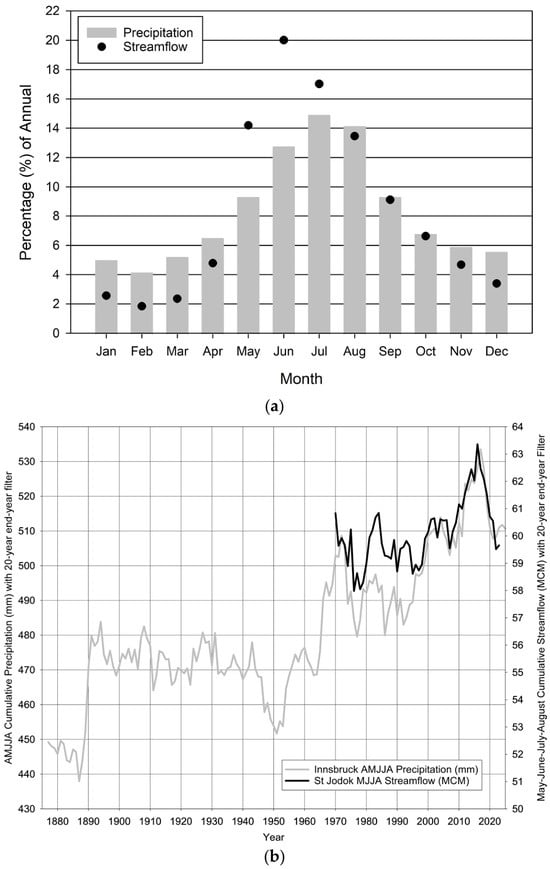
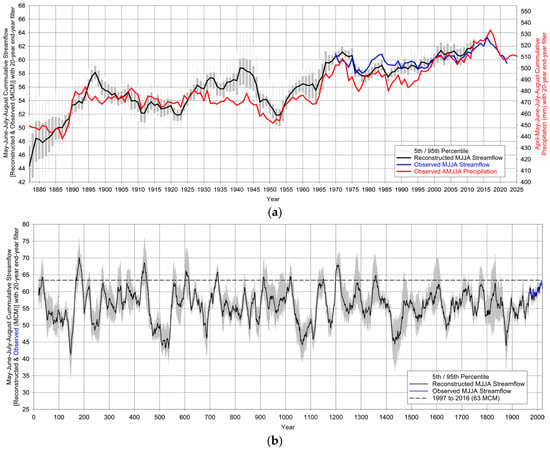
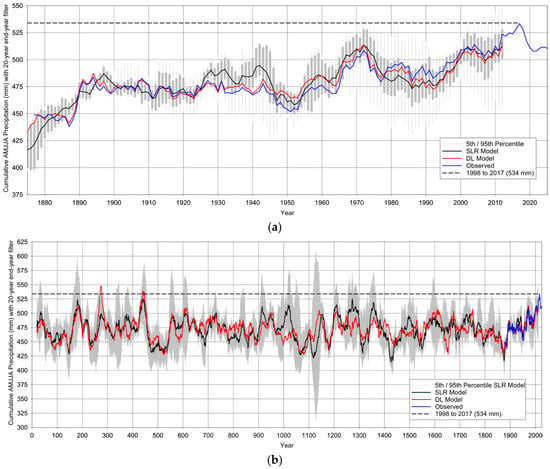
Understanding long-term hydroclimatic variability in the central Alps is essential when placing recent changes in precipitation and streamflow within a broader temporal context. This study reconstructs warm-season hydroclimatic variability in the central Alps using tree-ring-based hydroclimatic proxies from the Old World Drought Atlas (OWDA). Seasonal April–May–June–July–August (AMJJA) precipitation at Innsbruck, Austria, and seasonal May–June–July–August (MJJA) streamflow at the St. Jodok gauge were reconstructed using OWDA self-calibrating Palmer Drought Severity Index (scPDSI) predictors and moving-window Stepwise Linear Regression (SLR) models. Calibration windows of 30, 40, and 50 years were developed to account for temporal variability in predictor–climate relationships, and reconstruction uncertainty was quantified using multi-model ensemble bounds. An independent Deep Learning reconstruction was also developed for precipitation to provide an assessment of reconstruction skill and long-term climate trends. Specifically, the results demonstrate a robust reconstruction skill, with mean calibration R2 values of 0.65 for streamflow and 0.59 for precipitation. The streamflow reconstruction indicates that recent sustained increases represent the strongest positive anomaly in approximately 650 years, while reconstructed precipitation suggests recent decades are among the wettest sustained intervals of the last ~2000 years. Both records reveal a pronounced transition from severe late 19th-century drought conditions to persistent modern pluvial conditions. Agreement between regression and Deep Learning reconstructions supports the robustness of the identified long-term wetting trend and highlights the exceptional nature of recent hydroclimatic conditions in the central Alps.
Full article

Figure 1
Journal Menu
► ▼ Journal Menu-
- Hydrology Home
- Aims & Scope
- Editorial Board
- Topical Advisory Panel
- Early Career Editorial Board
- Instructions for Authors
- Special Issues
- Topics
- Sections & Collections
- Article Processing Charge
- Indexing & Archiving
- Editor’s Choice Articles
- Most Cited & Viewed
- Journal Statistics
- Journal History
- Journal Awards
- Society Collaborations
- Conferences
- Editorial Office
Journal Browser
► ▼ Journal BrowserHighly Accessed Articles
Latest Books
E-Mail Alert
News
Topics
Topic in
Earth, Hydrology, Sustainability, Water, JMSE, Agriculture
Human Impact on Groundwater Environment, 2nd Edition
Topic Editors: Zongjun Gao, Jiutan Liu, Qiao Su, Tengfei Fu, Dakang WangDeadline: 31 July 2026
Topic in
Energies, Environments, Hydrology, Sustainability
Green Technology, Environmental Management and Corporate Social Responsibility from a Global Perspective, 2nd Edition
Topic Editors: Pingping Luo, Guangwei Huang, Binaya Kumar Mishra, Mohd Remy Rozainy Bin Mohd Arif ZainolDeadline: 30 September 2026
Topic in
JoX, Sustainability, Water, Hydrology, Biology, Environments
Sustainable Water Resource Management: Controlling Nutrient and Contaminant Transport in Aquatic Systems
Topic Editors: Taotao Lu, Shuangcheng TangDeadline: 30 October 2026
Topic in
Applied Sciences, Hydrology, JMSE, Water, Eng
Hydraulic Engineering and Modelling
Topic Editors: Guohua Zhang, Feng Xiong, Xiaobo ZhangDeadline: 30 November 2026
Conferences
Special Issues
Special Issue in
Hydrology
Groundwater Pollution: Sources, Mechanisms, and Prevention (Second Edition)
Guest Editors: Pantelis Sidiropoulos, Ilias SiarkosDeadline: 31 July 2026
Special Issue in
Hydrology
Advances in Flood Studies: Enhancing Data Collection, Rating Curves, and Hydrological Analyses
Guest Editors: Guna Hewa, Trevor Daniell, David Kemp, Ranjan SarukkaligeDeadline: 31 July 2026
Special Issue in
Hydrology
Trends and Variations in Hydroclimatic Variables: 2nd Edition
Guest Editors: Adilson Pacheco De Souza, Frederico Terra De Almeida, Daniela Roberta BorellaDeadline: 31 July 2026
Special Issue in
Hydrology
Assessment and Mitigation Strategies for Urban Flood and Drought Risks Using High-Resolution Modeling
Guest Editors: Oana Elena Chelariu, Brunella BonaccorsoDeadline: 31 July 2026
Topical Collections
Topical Collection in
Hydrology
Feature Papers of Hydrology
Collection Editors: Ezio Todini, Tammo Steenhuis