
Effect of Climate Factors on the Childhood Pneumonia in Papua New Guinea: A Time-Series Analysis

 , ,
, ,  , , , ,
Abstract
:1. Introduction
2. Materials and Methods
2.1. Study Area

2.2. Data Sources
2.3. Variables in This Study
2.4. Statistical Analysis
2.5. GAM and GLM Analysis
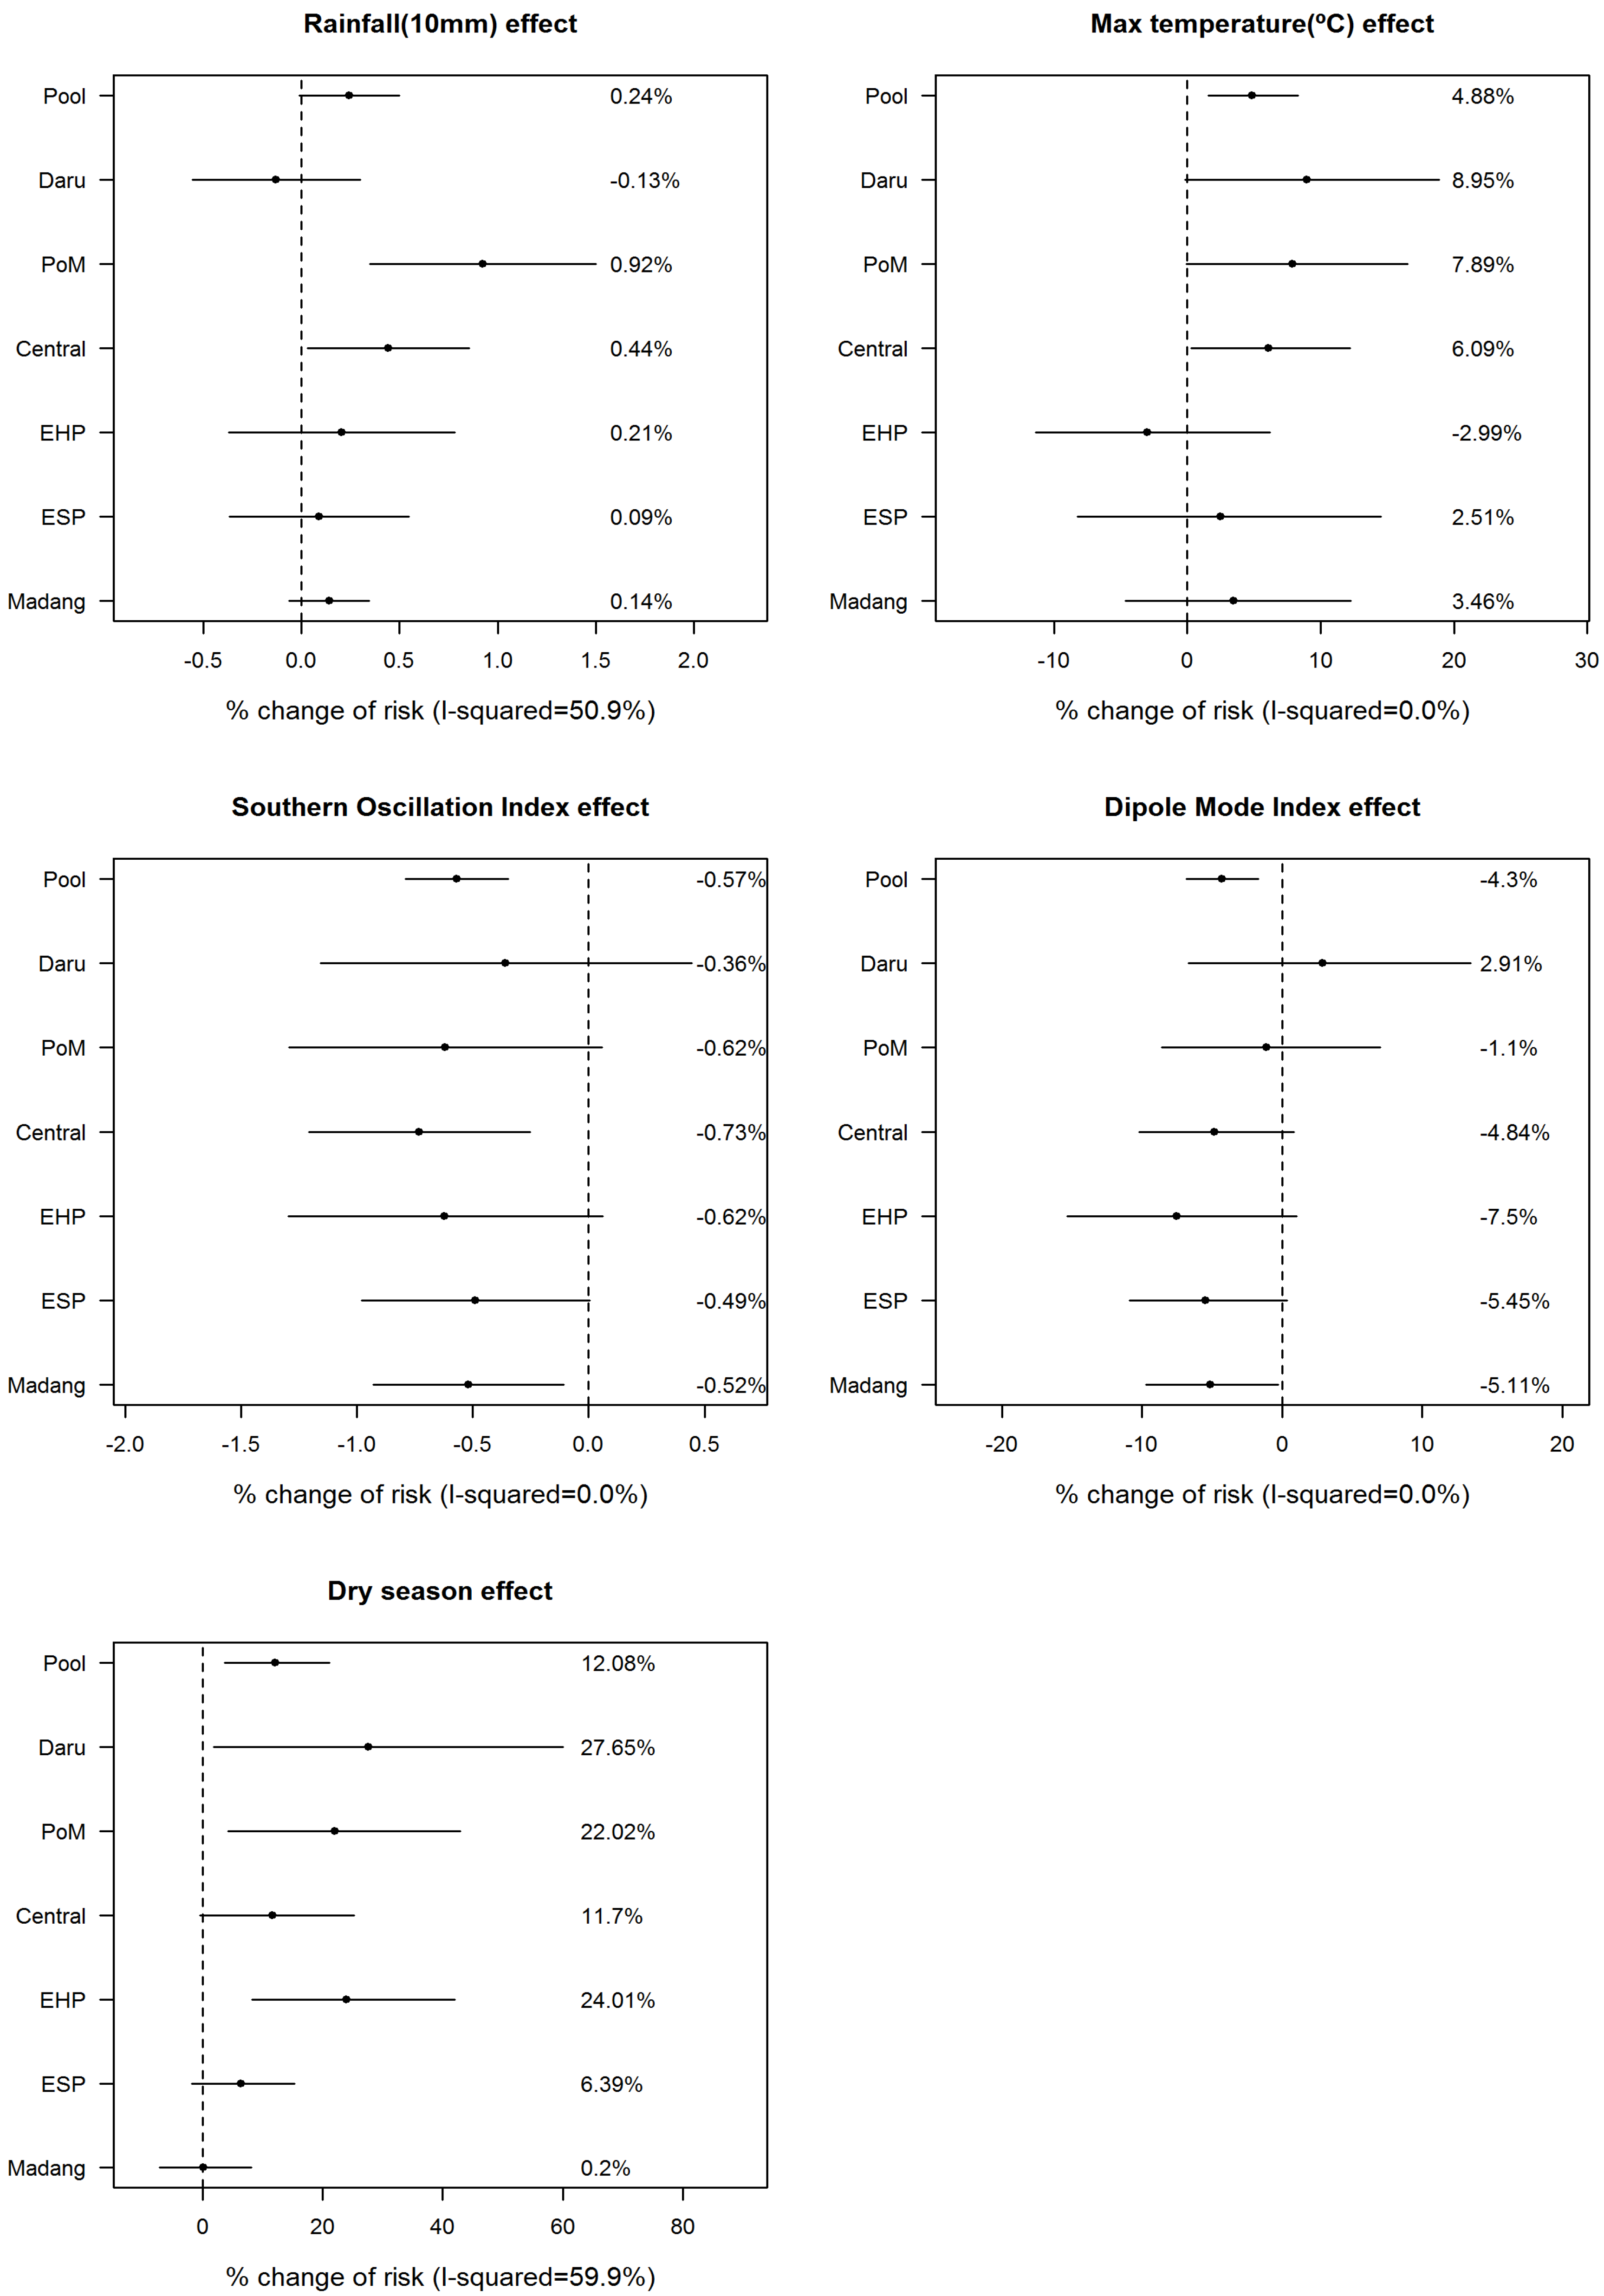
2.6. Meta-Analysis in the Six Areas
3. Results
3.1. General Characteristics of the Study Areas
3.2. Seasonal Variation in Variables and Correlations of Childhood Pneumonia Cases and Climate Variables

| Variables | Season | Daru (Western Province) | Port Moresby | Central Province | Eastern Highland Province | East Sepik Province | Madang Province |
|---|---|---|---|---|---|---|---|
| Population density (person/km2) | 2.4 ± 0.3 | 2468.0 ± 373.0 | 5.7 ± 0.4 | 30.4 ± 1.7 | 6.5 ± 0.4 | 51.3 ± 4.8 | |
| Population under five years old† | 20,166 | 90,391 | 27,989 | 49,365 | 51,931 | 59,310 | |
| Pneumonia under five years old (/month) | Total | 188.3 ± 67.6 | 1809.9 ± 637.8 | 491.3 ± 119.4 | 1780.3 ± 651.0 | 1434.2 ± 323.8 | 1481.4 ± 287.5 |
| Rainy | 181.2 ± 79.4 | 1764.2 ± 655.7 | 487.0 ± 101.6 | 1567.1 ± 570.8 * | 1381.5 ± 300.1 | 1491.3 ± 318.6 | |
| Dry | 195.4 ± 52.4 | 1855.6 ± 616.0 | 495.7 ± 134.7 | 1993.6 ± 656.4 * | 1487.0 ± 337.7 | 1471.6 ± 252.2 | |
| Incidence (/month, /1000 persons) | Total | 9.4 ± 3.2 | 25.6 ± 10.3 | 19.6 ± 4.6 | 39.1 ± 14.0 | 30.8 ± 6.7 | 28.9 ± 5.7 |
| Rainy | 9.0 ± 3.7 | 25.2 ± 11.3 | 19.5 ± 4.2 | 34.4 ± 12.3 * | 29.6 ± 6.2 | 29.2 ± 6.5 | |
| Dry | 9.9 ± 2.6 | 26.0 ± 9.1 | 19.7 ± 5.0 | 43.8 ± 14.1 * | 31.9 ± 7.0 | 28.7 ± 4.9 | |
| Rainfall (mm/month) | Total | 159.7 ± 161.6 | 100.1 ± 101.6 | 100.1 ± 101.6 | 167.6 ± 106.6 | 193.3 ± 89.1 | 281.6 ± 166.3 |
| Rainy | 180.8 ± 132.1 | 135.0 ± 97.0 * | 135.0 ± 97.0 * | 196.2 ± 119.3 * | 171.1 ± 68.3 * | 323.7 ± 138.9 * | |
| Dry | 138.6 ± 184.1 | 65.3 ± 93.8 * | 65.3 ± 93.8 * | 139.0 ± 82.7 * | 215.5 ± 101.2 * | 239.6 ± 180.3 * | |
| Mean of daily maximum temperature (°C) ‡ | Total | 30.1 ± 1.4 | 31.3 ± 1.1 | 31.3 ± 1.1 | 26.4 ± 0.7 | 30.8 ± 0.4 | 30.9 ± 0.5 |
| Rainy | 31.3 ± 0.7 * | 32.1 ± 0.7 * | 32.1 ± 0.7 * | 26.8 ± 0.6 * | 30.9 ± 0.4 * | 31.2 ± 0.4 * | |
| Dry | 29.0 ± 0.9 * | 30.6 ± 0.8 * | 30.6 ± 0.8 * | 26.0 ± 0.6 * | 30.7 ± 0.4 * | 30.6 ± 0.5 * | |
| SOI | Total | −1.61 ± 10.90 | |||||
| Rainy | 0.43 ± 11.32 * | ||||||
| Dry | −3.64 ± 10.06 * | ||||||
| DMI | Total | 0.06 ± 0.99 | |||||
| Rainy | −0.01 ± 1.10 | ||||||
| Dry | 0.12 ± 0.86 | ||||||
| Malnutrition (persons) | Total | 17.3 ± 56.5 | 44.5 ± 67.3 | 27.4 ± 23.3 | 53.0 ± 37.4 | 54.7 ± 39.5 | 39.1 ± 26.9 |
| Rainy | 11.4 ± 12.3 | 39.9 ± 29.6 | 27.8 ± 22.9 | 54.4 ± 43.7 | 45.3 ± 34.3 * | 36.1 ± 23.7 | |
| Dry | 23.2 ± 78.5 | 49.1 ± 90.2 | 27.0 ± 23.7 | 51.6 ± 29.6 | 64.2 ± 42.0 * | 42.1 ± 29.4 | |

3.3. Fitness of the Statistical Models (Degree of Freedoms, Autocorrelation and Collinearity).
| Variables | Season | Daru (Western Province) | Port Moresby | Central Province | Eastern Highland Province | East Sepik Province | Madang Province |
|---|---|---|---|---|---|---|---|
| Rainfall (mm/month) | Total | −0.001 | 0.107 | 0.107 | −0.028 | 0.126 | 0.188 * |
| Rainy | −0.031 | 0.058 | 0.063 | 0.138 | 0.144 | 0.080 | |
| Dry | 0.099 | 0.297 * | 0.232 | −0.013 | 0.045 | 0.321 * | |
| SOI | Total | −0.164 | −0.048 | −0.130 | −0.116 | −0.060 | −0.077 |
| Rainy | −0.216 | −0.045 | −0.047 | −0.032 | 0.055 | −0.080 | |
| Dry | −0.085 | −0.042 | −0.215 | −0.009 | −0.095 | −0.056 | |
| DMI | Total | 0.051 | 0.133 | −0.184 * | −0.146 | −0.221 * | −0.223 * |
| Rainy | 0.148 | 0.215 | −0.144 | −0.110 | −0.173 | −0.139 | |
| Dry | −0.026 | 0.065 | −0.246 | −0.379 * | −0.334 * | −0.338 * | |
| Dry season | Total | 0.113 | 0.087 | −0.003 | 0.353 * | 0.140 | −0.001 |
| Malnutrition (cases) | Total | 0.364 * | 0.306 * | 0.081 | 0.473 * | 0.324 * | 0.205 * |
| Rainy | 0.471 * | 0.370 * | −0.100 | 0.571 * | 0.155 | 0.149 | |
| Dry | 0.263 * | 0.246 | 0.265 * | 0.398 * | 0.432 * | 0.227 |
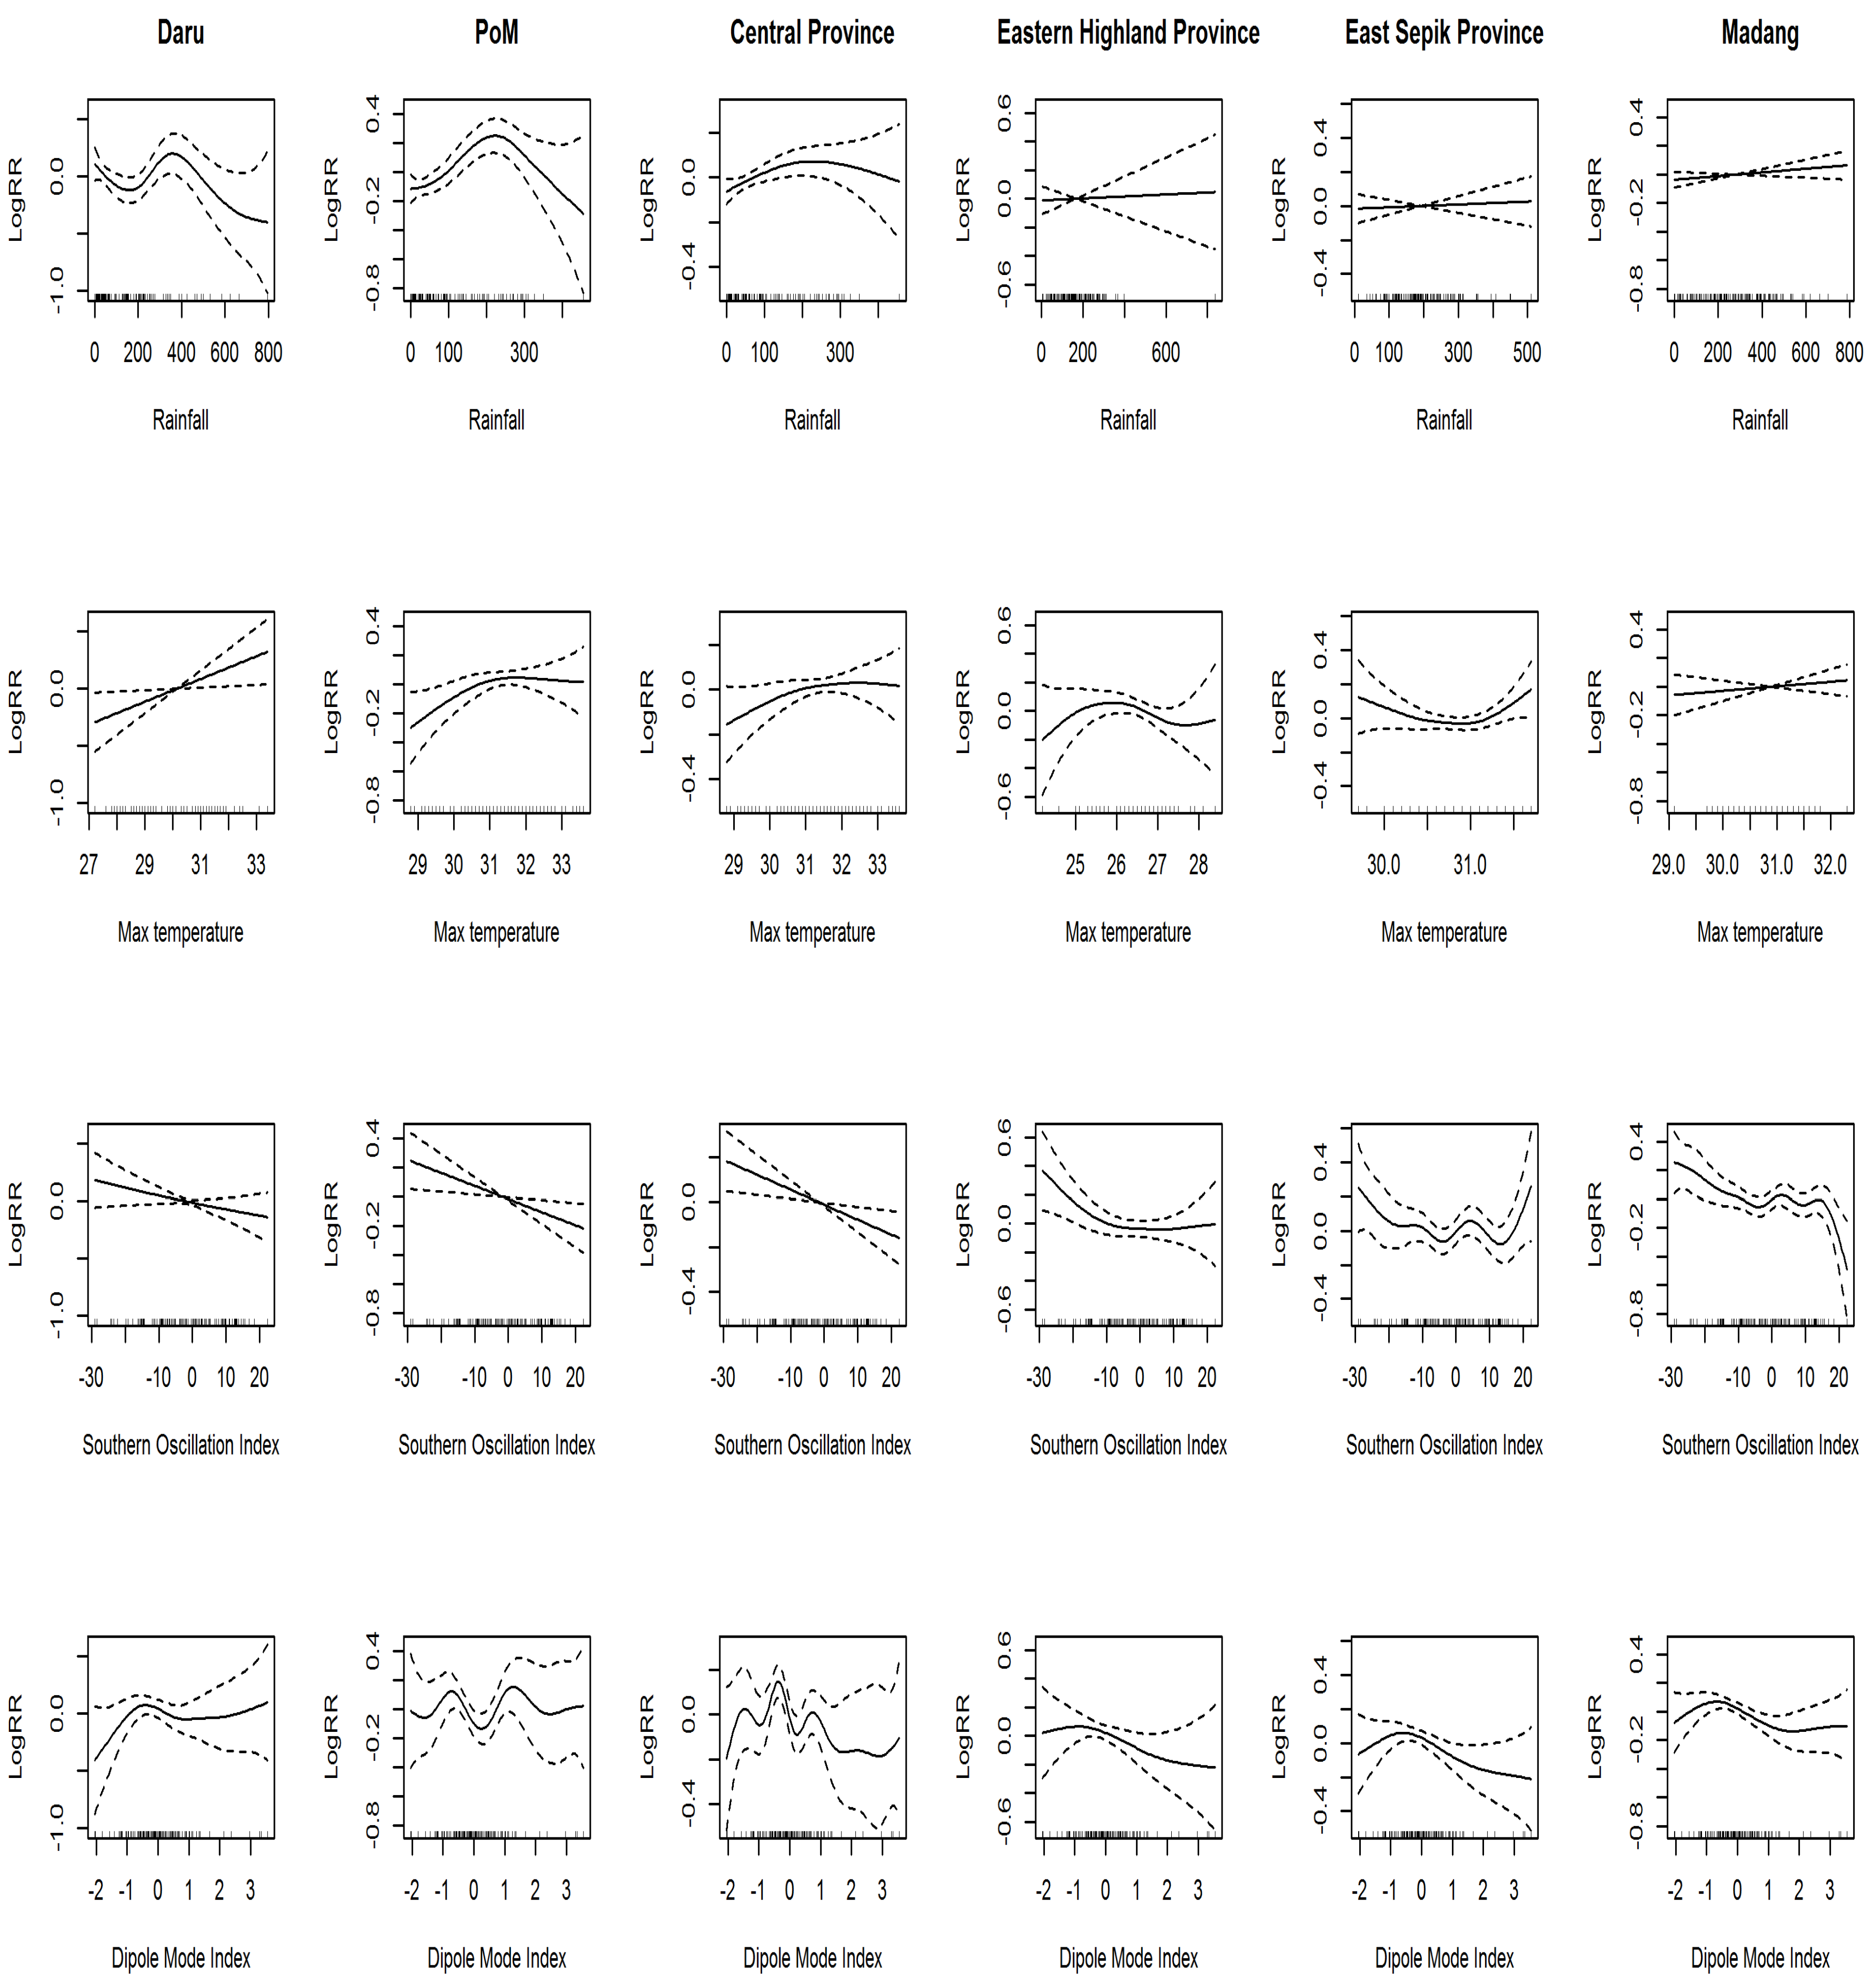
3.4. Generalized Additive Model and Generalized Linear Model

| Climate Factors | RR (95% CI) | |||||
|---|---|---|---|---|---|---|
| Daru (Western Province) | Port Moresby | Central Province | Eastern Highland Province | East Sepik Province | Madang Province | |
| Rainfall (10 mm/month) | 0.999 | 1.009 * | 1.004 * | 1.002 | 1.001 | 1.001 |
| (0.994–1.003) | (1.003–1.015) | (1.000–1.009) | (0.996–1.008) | (0.996–1.005) | (0.999–1.003) | |
| Mean of daily maximum temperature (°C) ‡ | 1.090 | 1.079 | 1.061 * | 0.970 | 1.025 | 1.035 |
| (0.998–1.189) | (0.999–1.165) | (1.003–1.122) | (0.886–1.062) | (0.918–1.145) | (0.953–1.122) | |
| SOI | 0.996 | 0.994 | 0.993 * | 0.990 | 0.995 | 0.995 * |
| (0.988–1.004) | (0.987–1.001) | (0.988-0.997) | (0.987–1.001) | (0.990–1.000) | (0.991-.999) | |
| DMI | 1.029 | 0.989 | 0.952 | 0.925 | 0.946 | 0.949* |
| (0.933–1.134) | (0.914–1.070) | (0.898–1.008) | (0.846–1.010) | (0.891–1.003) | (0.903-.997) | |
| Season† | 1.276 * | 1.220 * | 1.117 | 1.240 * | 1.064 | 1.002 |
| (1.018–1.599) | (1.041–1.428) | (0.995–1.253) | (1.083–1.420) | (0.982–1.153) | (0.928–1.082) | |

4. Discussion
5. Conclusions
Supplementary Materials
Acknowledgments
Author Contributions
Conflicts of Interest
Abbreviations
| CI | confidence interval |
| DMI | dipole mode index |
| ENSO | El Niño southern oscillation |
| GAM | generalized additive model |
| GLM | generalized linear model |
| IOD | Indian Ocean dipole |
| NDOH | National Department of Health, Papua New Guinea |
| NHIS | National Health Information System (Papua New Guinea) |
| PNG | Papua New Guinea |
| RR | relative risk |
| SOI | southern oscillation index |
| ACF | autocorrelation function |
References
- Rudan, I.; Boschi-Pinto, C.; Biloglav, Z.; Mulholland, K.; Campbell, H. Epidemiology and etiology of childhood pneumonia. Bull World Health Organ 2008, 86, 408–416. [Google Scholar] [CrossRef] [PubMed]
- Shek, L.P.-C.; Lee, B.-W. Epidemiology and seasonality of respiratory tract virus infections in the tropics. Paediatr. Resp. Rev. 2003, 4, 105–111. [Google Scholar] [CrossRef]
- Secretary for Health in PNG. PNG Child Health Plan 2008–2015; National Department of Health: Port Moresby, Guinea, 2008; pp. 7–8.
- World Health Organization Western Pacific Regional Office. Papua New Guinea country profile 2011; World Health Organization Western Pacific Regional Office: Manila, Philippines, 2011; Available online: http://www.wpro.who.int/countries/png/25PNGpro2011_finaldraft.pdf (accessed on 17 October 2015).
- Chan, P.; Chew, F.; Tan, T.; Chua, K.; Hooi, P. Seasonal variation in respiratory syncytial virus chest infection in the tropics. Pediatr. Pulmonol. 2002, 34, 47–51. [Google Scholar] [CrossRef] [PubMed]
- Simmerman, J.M.; Chittaganpitch, M.; Levy, J.; Chantra, S.; Maloney, S.; Uyeki, T.; Areerat, P.; Thamthitiwat, S.; Olsen, S.J.; Fry, A.; et al. Incidence, seasonality and mortality associated with influenza pneumonia in Thailand: 2005–2008. PLoS ONE 2009. [Google Scholar] [CrossRef] [PubMed]
- Lin, H.-C.; Lin, C.-C.; Chen, C.-S.; Lin, H.-C. Seasonality of pneumonia admissions and its association with climate: an eight-year nationwide population-based study. Chronobiol. Int. 2009, 26, 1647–1659. [Google Scholar] [CrossRef] [PubMed]
- Nascimento-Carvalho, C.M.; Cardoso, M.R.; Barral, A.; Araújo-Neto, C.A.; Oliveira, J.R.; Sobral, L.S.; Saukkoriipi, A.; Paldanius, M.; Vainionpää, R.; Leinonen, M.; et al. Seasonal patterns of viral and bacterial infections among children hospitalized with community-acquired pneumonia in a tropical region. Scand. J. Infect. Dis. 2010, 42, 839–844. [Google Scholar] [CrossRef] [PubMed]
- Paynter, S.; Ware, R.S.; Weinstein, P.; Williams, G.; Sly, P.D. Childhood pneumonia: A neglected, climate-sensitive disease? Lancet 2010, 376, 1804–1805. [Google Scholar] [CrossRef]
- Saji, N.; Yamagata, T. Possible impacts of Indian Ocean dipole mode events on global climate. Clim. Res. 2003, 25, 151–169. [Google Scholar] [CrossRef]
- Bourke, R.M. Impact of the 1997 drought and frosts in Papua New Guinea. In El Niño: History and Crisis; Studies from the Asia-Pacific Region; Grove, R.H., Chappell, J., Eds.; The White Horse Press: Cambridge, UK, 2000; pp. 149–170. [Google Scholar]
- Tudhope, A.W.; Chilcott, C.P.; McCulloch, M.T.; Cook, E.R.; Chappell, J.; Ellam, R.M.; Lea, D.W.; Lough, J.M.; Shimmield, G.B. Variability in the El Niño-Southern Oscillation through a glacial-interglacial cycle. Science 2001, 291, 1511–1517. [Google Scholar] [CrossRef] [PubMed]
- Cibulskis, R.; Hiawalyer, G. Information systems for health sector monitoring in Papua New Guinea. Bull. World Health Organ. 2002, 80, 752–758. [Google Scholar] [PubMed]
- Kovats, R.S.; Bouma, M.J.; Hajat, S.; Worrall, E.; Haines, A. El Niño and health. Lancet 2003, 362, 1481–1489. [Google Scholar] [CrossRef]
- Behera, S.K.; Yamagata, T. Influence of the Indian Ocean dipole on the Southern Oscillation. J. Meteorol. Soc. Jpn. 2003, 81, 169–177. [Google Scholar] [CrossRef]
- O’brien, R.M. A caution regarding rules of thumb for variance inflation factors. Qual. Quant. 2007, 41, 673–690. [Google Scholar] [CrossRef]
- Hogg, R.; McKean, J.; Craig, A. Introduction to Mathematical Statistics; Pearson Education, Inc.: Upper Saddle River, NJ, USA, 2005; p. 692. [Google Scholar]
- Guisan, A.; Edwards, T.C., Jr.; Hastie, T. Generalized linear and generalized additive models in studies of species distributions: setting the scene. Ecol. Model. 2002, 157, 89–100. [Google Scholar] [CrossRef]
- Hastie, T.; Tibshirani, R. Generalized Additive Models; Chapman & Hall/CRC: New York, NY, USA, 1990. [Google Scholar]
- Wood, S.N.; Augustin, N.H. GAMs with integrated model selection using penalized regression splines and applications to environmental modelling. Ecol. Model. 2002, 157, 157–177. [Google Scholar] [CrossRef] [Green Version]
- Corbeil, R.R.; Searle, S.R. Restricted maximum likelihood (REML) estimation of variance components in the mixed model. Technometrics 1976, 18, 31–38. [Google Scholar] [CrossRef]
- Allen, B.J. Birthweight and environment at Tari. PNG Med. J. 2002, 45, 88–98. [Google Scholar]
- Banu, S.; Guo, Y.; Hu, W.; Dale, P.; Mackenzie, J.S.; Mengersen, K.; Tong, S. Impacts of El Niño Southern Oscillation and Indian Ocean Dipole on dengue incidence in Bangladesh. Sci. Rep. 2015, 5, 16105. [Google Scholar] [CrossRef] [PubMed]
- Hashizume, M.; Terao, T.; Minakawa, N. The Indian Ocean Dipole and malaria risk in the highlands of western Kenya. Proc. Natl. Acad. Sci. USA 2009, 106, 1857–1862. [Google Scholar] [CrossRef] [PubMed]
- Annamalai, H.; Xie, S.; McCreary, J.; Murtugudde, R. Impact of Indian Ocean Sea Surface Temperature on Developing El Niño. J. Climate 2005, 18, 302–319. [Google Scholar] [CrossRef]
- Macias Fauria, M.; Johnson, E.A. Climate and wildfires in the North American boreal forest. Philos. Trans. R Soc. Lond. B Biol. Sci. 2008, 363, 2317–2329. [Google Scholar] [CrossRef] [PubMed]
© 2016 by the authors; licensee MDPI, Basel, Switzerland. This article is an open access article distributed under the terms and conditions of the Creative Commons by Attribution (CC-BY) license (http://creativecommons.org/licenses/by/4.0/).
Share and Cite
Kim, J.; Kim, J.-H.; Cheong, H.-K.; Kim, H.; Honda, Y.; Ha, M.; Hashizume, M.; Kolam, J.; Inape, K. Effect of Climate Factors on the Childhood Pneumonia in Papua New Guinea: A Time-Series Analysis. Int. J. Environ. Res. Public Health 2016, 13, 213. https://doi.org/10.3390/ijerph13020213
Kim J, Kim J-H, Cheong H-K, Kim H, Honda Y, Ha M, Hashizume M, Kolam J, Inape K. Effect of Climate Factors on the Childhood Pneumonia in Papua New Guinea: A Time-Series Analysis. International Journal of Environmental Research and Public Health. 2016; 13(2):213. https://doi.org/10.3390/ijerph13020213
Chicago/Turabian StyleKim, Jinseob, Jong-Hun Kim, Hae-Kwan Cheong, Ho Kim, Yasushi Honda, Mina Ha, Masahiro Hashizume, Joel Kolam, and Kasis Inape. 2016. "Effect of Climate Factors on the Childhood Pneumonia in Papua New Guinea: A Time-Series Analysis" International Journal of Environmental Research and Public Health 13, no. 2: 213. https://doi.org/10.3390/ijerph13020213