Abstract
The COVID-19 pandemic has become a public health emergency of international concern, which may have affected lifestyle habits and mental health. Based on national health profile assessments, this study investigated perceived changes of lifestyle habits in response to the COVID-19 pandemic and associations between perceived lifestyle changes and mental health in Swedish working adults. Among 5599 individuals (50% women, 46.3 years), the majority reported no change (sitting 77%, daily physical activity 71%, exercise 69%, diet 87%, alcohol 90%, and smoking 97%) due to the pandemic. Changes were more pronounced during the first wave (April–June) compared to the second (October–December). Women, individuals <60 years, those with a university degree, white-collar workers, and those with unhealthy lifestyle habits at baseline had higher odds of changing lifestyle habits compared to their counterparts. Negative changes in lifestyle habits and more time in a mentally passive state sitting at home were associated with higher odds of mental ill-health (including health anxiety regarding one’s own and relatives’ health, generalized anxiety and depression symptoms, and concerns regarding employment and economy). The results emphasize the need to support healthy lifestyle habits to strengthen the resilience in vulnerable groups of individuals to future viral pandemics and prevent health inequalities in society.
Keywords:
physical activity; sitting; alcohol; diet; smoking; SARS-CoV-2; Sweden; mental health; health anxiety; depression 1. Introduction
The pandemic caused by the coronavirus disease 2019 (COVID-19) has become a global public health emergency. To stop the virus, confinement, social distancing, and even full lockdowns have been implemented. Under such circumstances, there is a risk for radical changes of lifestyle habits such as physical activity (PA), sedentary behavior, smoking, diet, and alcohol consumption, which have all been previously linked to morbidity and pre-mortality [1,2,3,4]. For example, both short and long bouts of regular PA have been shown to improve physical and mental health in both children and adults [1,5,6].
During the first wave of the pandemic, several lifestyle habits seem to have changed, but with mixed reports from different countries. For example, studies from Belgium, France, and Switzerland have reported a general increase in both exercise frequency and sedentary behavior [7,8]. Conversely, in Italy, total PA decreased significantly during the first COVID-19 wave as compared to before, in all age groups and especially in men [9]. Moreover, several studies have shown small changes in dietary habits [10,11,12], while others have reported an increase in unhealthy food intake, overeating, and snacking between meals [10,13,14,15]. Similarly, studies have indicated that alcohol consumption has not changed during home confinement [13,16], while others have reported increased alcohol consumption [15,17,18]. Smoking has been reported to both have increased [17,19] and decreased [16,20] during the first wave of COVID-19.
Negative changes in lifestyle habits and an increased risk of depression, anxiety, and stress symptoms during the COVID-19 pandemic have been reported [17,21], while a positive association between more time spent in moderate-to-vigorous PA and better mental health has also been found [9,22,23]. However, previous studies have investigated changes in lifestyle during COVID-19 in a relatively short timeframe during the spring and summer of 2020. As the pandemic has continued, we need to examine longer-term effects on lifestyle and mental health, including comparing differences between the different waves of the pandemic. Also, with different governments employing varying countermeasures and social restrictions, it is important to study the effects on lifestyle habits and health experiences in the context of different countries. Sweden is one of the countries that has caught attention worldwide as the government chose to implement mainly recommended restrictions without any full-scale lockdown. Any comparative results from such a strategy on lifestyle habits and mental health is highly relevant for future decision making in similar situations.
The main aim of the present study was therefore to investigate perceived changes in time spent sitting, daily PA, exercise, diet, alcohol, and smoking in response to the COVID-19 pandemic in Swedish working adults, and to study potential differences across age, sex, education, occupational groups, and different waves of the pandemic. An additional aim was to study the odds ratio of perceived mental ill-health in relation to perceived lifestyle changes.
2. Materials and Methods
2.1. Study Population
Data originated from the Health Profile Assessment (HPA) database (http://www.hpihealth.se (assessed on 3 December 2020)) which contains data from HPAs carried out in health services all around Sweden since the middle of the 1970s. An HPA includes a questionnaire about lifestyle and health experiences, measurements of anthropometrics and blood pressure, estimations of maximal oxygen consumption from a submaximal cycle ergometer test, and a person-centered dialogue with an HPA coach. An HPA is offered to all employees working for a company or an organization connected to occupational or health-related services, and is voluntary and free of charge for the employee. All data are subsequently recorded in the Health Profile Institute database. In the light of the COVID-19 pandemic emerging in March 2020, additional questions regarding working and commuting habits, perceived change in lifestyle habits, and mental health experiences in relation to the COVID-19 pandemic were added to the HPA in the middle/end of April. It was optional for the participants to answer the additional questions. This study included and compared data from three periods: April to June, July to September, and October to December, 2020. From the 21 April 2020 to 2 December, a total of 5599 men and women answered the additional COVID questions, and were included in the present analyses (Table 1). For comparative purposes, an additional 6232 men and women who performed a HPA during the same time period without answering the additional COVID-questions, as well as 20,864 men and women performing a HPA during the same time period in 2019 (Appendix B, Table A1), were included. The study was approved by the ethics board at the Stockholm Ethics Review Board (Dnr 2020-02727). Informed consent was obtained from the participants prior to participation.

Table 1.
Participants with data from the health profile assessment (HPA) and the additional COVID-19 questions (n = 5599), and participants with only HPA data (n = 6232) between 21 April 2020 and 2 December 2021.
2.2. Measures
The additional questions in relation to the COVID-19 pandemic are presented in Appendix A. They included questions regarding current working situation, commuting habits, and perceived change in commuting habits, as well as perceived change in sitting time, daily activity, exercise, diet, alcohol intake, and smoking due to the COVID-19 pandemic. Moreover, open questions regarding hours and minutes spent in (a) mentally passive sitting (i.e., tv-viewing, using you phone/iPad/computer to browse the internet) (b) a mentally active sitting (i.e., working, reading, solving cross-words or Sudoku), and (c) socialization (i.e., having a meal, talking with friends or family) were included, as previous studies have indicated different relationships between these different types of sedentary behavior and mental well-being [24]. Finally, questions regarding health anxiety (SHAI) [25], in terms of both one’s own health and that of relatives (modified from SHAI); employment [26] and economic [27] concerns; generalized anxiety [28]; and depression [29] were included.
From the HPA, data on BMI and estimated VO2max [30] were derived, as well as self-reported baseline daily PA, exercise habits, sedentary behavior, diet, alcohol abuse by AUDIT-C [31], smoking habits, overall stress, perceived health, and perceived symptoms of anxiety and depression (see Appendix B). Highest educational attainment at the time for the HPA was obtained from Statistics Sweden by linking of the participants’ personal identity numbers. Occupation was reported by the participants and coded according to the Swedish Standard Classification of Occupation [32], and further dichotomized into blue- or white-collar workers.
2.3. Statistical Analyses
Chi-square test (percentages) or t-test (mean values) results were used to compare participants with HPA + COVID data and participants with only HPA data during the study period (21 April and 2 December 2020), as well as all participants with HPA data during the study period and participants with HPA data between the same dates in 2019. Differences in working situation, commuting habits, mental health and sitting time between subgroups (Table 2) were tested using a Chi-square test (percentages), or t-test (mean values). Wave 1 of the COVID-19 pandemic was defined as 21st of April to 30th of June, and wave 2 as 1st of October to 2nd of December, which corresponds to the two clear wave-shapes of hospitalization due to COVID-19 in Sweden according to the Public Health Agency of Sweden [33]. From 1 July to 30 September was defined as months between the two waves, with significantly lower incidence of COVID-19. Multinomial regression modelling was used to calculate odds ratios (ORs) with 95% confidence intervals (CIs) for self-reported perceived change in six different lifestyle habits due to the COVID-19 pandemic in association to sex (women vs. men), age group (18–59 years vs. 60–78 years), educational level (University vs. non-university), occupation group (white collar vs. blue collar), baseline level of each habit, and wave of COVID-19 compared to the summer months (April–June vs. July–Septemberand October–December vs. July–September) (Table 2). Clustering of negative and positive perceived changes in lifestyle habits, respectively, were defined as negative or positive change in two or more lifestyle habits compared to less. Daily activity was not included in the clustered variable, as change in time spent sitting and daily activity are interchangeably occurring (sitting less leads to more daily activity and vice versa). Moreover, odds ratio (OR) and 95% CI was calculated using logistic regression modelling to study the association of dichotomized mental ill-health variables in relation to sex, age group, educational level, occupation group, wave of COVID-19 pandemic, type of sitting, and perceived change in lifestyle habits. The mental health variables were dichotomized to describe mental ill-health according to the following: “Frequent health anxiety, own” (Question 7A in Appendix A, answer of reply 3 or 4 vs. 1), “Frequent health anxiety, relatives” (Question 7B, reply 3 or 4 vs. 1), “Frequent anxiety symptoms” (Question 10A, reply 3 or 4 vs. 1), “Frequent depression symptoms” (Question 10B, reply 3 or 4 vs. 1), “High concerns employment” (Question 8, reply 4 or 5 vs. 1), and “High concerns economy” (Question 9, reply 4 or 5 vs. 1). Significance level was set as α < 0.05. Data were analyzed using SPSS (version 26), R 4.0.3 (R Core Team, 2020) with the Tidyverse library [34].
Table 2.
Working and commuting situation, and type of sitting at home during the study period.
3. Results
A total of 11,831 men and women performed a HPA during the study period. Of these, 5599 (47%) answered the additional COVID-19 related questions (Table 1). There were small, albeit statistically significant, differences between individuals answering (included in the present analyses) and not answering (excluded) the extra COVID-19 related questions. Compared to nonincluded individuals, included individuals compromised more women, were older, had a higher educational level, were more often white-collar workers, had a lower BMI, exercised more, smoked less, sat more at work and experienced more stress and symptoms of anxiety and depression (Table 1). Moreover, when comparing individuals performing an HPA in year 2020 to 2019 (a “normal” year before COVID-19), we also noted some small but significant differences (Appendix B Table A1). Participants in 2020 were more likely to be women, older, exercised more and sat less, had a higher educational level, were more often white-collar workers, had better dietary habits, smoked less, and experienced less stress compared to HPA participants in 2019.
3.1. Working, Commuting Situation, and Type of Sitting at Home
Almost half of the participants answering the additional COVID-19 questions reported that their occupation required that they stay at work (Table 2). The majority reported that they did not change their commuting habits due to the pandemic, whereas 10% reported that they had changed. Of those who changed, the greatest shift was from public transport to car (54%) and to active commuting (26%). Mean reported time spent in mentally active sitting was slightly higher compared to mentally passive sitting, with less time spent sitting while socializing (131, 119, and 82 min/day). Men and blue-collar workers spent more time in mentally passive sitting and less time in mentally active sitting compared to women and white-collar workers. Participants <60 years spent more time in mentally active sitting than those ≥60 years.
3.2. Perceived Changes in Lifestyle Habits
Most individuals stated that they had not changed their lifestyle habits due to the COVID-19 pandemic. For time spent sitting, in daily activity, and exercise, respectively, only 5%, 9%, and 10% of the participants reported a positive change, while 18%, 20%, and 20% reported a negative change. Similarly, for diet, smoking, and alcohol intake, 7%, 3%, and 8% perceived a positive change in these lifestyle habits, while 5%, 1%, and 3% perceived a negative change. Figure 1, show changes during the first and second wave. For clustering of perceived change in lifestyle habits, 13% reported a negative change in two or more lifestyle factors, whereas 8% reported a positive change in two or more lifestyle habits.
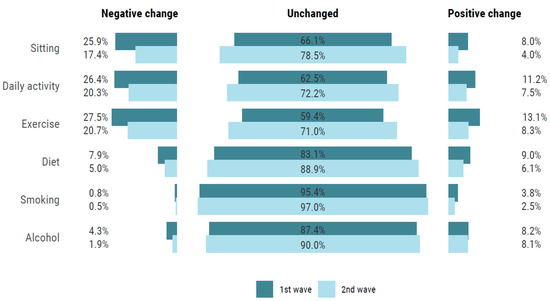
Figure 1.
Self-reported change in lifestyle habits comparing wave 1 (April to June) and wave 2 (September to December).
Comparing the two waves, the odds for lifestyle changes, both negative and positive, were higher during the first wave compared to the second (Figure 1 and Table 3). For example, the odds of both a perceived positive and negative change in sitting time, daily PA, and exercise were higher during the first wave compared to the second wave. Also, the odds were higher for a perceived negative change in diet and alcohol intake during the first wave compared to the second. Demographic factors were significantly associated with changes in lifestyle habits (Table 3). Women, younger participants (<60 years), participants with a university degree, white-collar workers, and those with more adverse lifestyle habits had higher odds of changing their lifestyle due to COVID-19 pandemic.
Table 3.
Odds ratio (95% CI) for change in six different lifestyle habits in relation to sex, age group, educational level, occupation group, baseline level of each habits, as well as wave of COVID-19 (no change as reference).
3.3. Mental Health Experiences
The majority of participants had low personal health anxiety, generalized anxiety and depression symptoms, as well as concerns regarding their employment and economy, with a higher proportion experiencing health anxiety for relatives (Table 4).
Table 4.
Health experiences during the study period in the total population, as well as in relation to sex, age, and occupational group.
Six percent had clustering of two or more variables of mental ill-health (Table 5). In general, women and participants <60 years had higher odds of mental ill-health compared to men and participants ≥60 years (Table 5), while participants with a university degree and white-collar workers had significantly lower odds of having concerns regarding employment or economy (only university degree participants) compared to their counterparts. As for perceived change in lifestyle habits, the odds of mental ill-health were higher during the first wave compared to the second.
Table 5.
Odds ratio (95% CI) for clustering of mental-ill health, as well as each individual mental ill-health variable, in relation to sex, age, occupational group, educational level, and wave of COVID-19 pandemic (above) and time sitting and engaging in either mentally passive, mentally active, or socializing activities (below).
3.4. Type of Sitting and Change in Lifestyle Habits in Relation to Mental Ill-Health
A negative perceived change in each lifestyle habit, compared to no or positive change, was associated with higher odds for clustered mental ill-health (Figure 2). This was seen for all separate mental ill-health variables, except that it was not observed for perceived change in smoking.
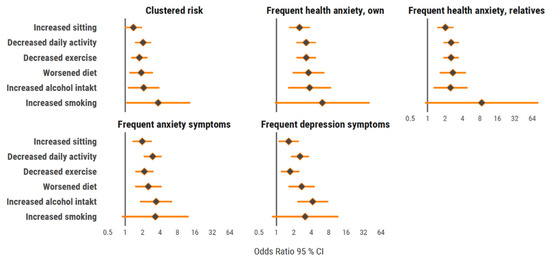
Figure 2.
Forrest plot with odds ratio (95% CI) for clustering of mental ill-health variables in relation to change in lifestyle habits. All analyses adjusted for sex, age group, educational level, occupational group, wave of COVID-19, and baseline values for each lifestyle habit.
More time spent in mentally passive sitting (Tertile 3; ≥120 min/day vs. Tertile 1; 0 to 90 min/day) was associated with higher odds for all variables and clustering of mental ill-health (Table 5). No similar associations were seen for more time spent in mentally active sitting or time in sitting socializing.
4. Discussion
In Sweden, a country with relatively few social restrictions during the pandemic, we noted small changes in the lifestyle variables overall in a large cohort of workers during the first and second wave of the COVID-19 pandemic in 2020. When changes were present, they were more pronounced during the first wave compared to the second. We also noted that the pandemic impacted some segments of the population more than others; women, individuals <60 years, those with a university degree, white-collar workers, and those with unhealthy lifestyle habits at baseline had higher odds of changing their lifestyle habits compared to their counterparts. Negative changes in lifestyle habits, as well as more time spent in mentally passive sitting at home, were associated with higher odds of mental ill-health.
4.1. Changes in Lifestyle Habits in Sweden Compared to Other Countries
The present results with small changes in lifestyle habits are in line with a report in May 2020 from the Swedish National Board of Public Health, where a majority reported no change compared to before the COVID-19 pandemic, (total PA 60%, diet 71%, alcohol 79%, and smoking 77%) [35]. The decrease in daily PA (26% first wave and 20% second wave) and exercise (28% and 21%) in the present sample is noticeably lower than in a large Australian study where approximately 50% reported a decrease in PA [17]. Another study exploring the number of daily steps worldwide during the first wave (March to June 2020), concluded that Swedish citizens maintained their number of daily steps to a higher degree in comparison to other countries. For example, while the maximal decrease of average step counts was 49% in Italy, Sweden had experienced a decrease of only 7% [36]. These differences might be partly explained by differences in lockdown regulations, where Sweden implemented less harsh social restrictions with no lockdown.
The increase in sitting time (26% first wave and 17% second wave) is in line with other studies [7,8,11], and may be due to similar restrictions regarding work situations in these countries. We also investigated the previously proposed difference between mentally passive and mentally active sitting behaviors on mental well-being. For example, Hallgren et al. showed that mentally active sitting was associated with a 29% lower risk for major depressive disorders after a 13-year follow-up in middle-aged men and women, while mentally passive sitting was associated with a 26% higher risk [24]. A study comparing sitting at work (presumably predominantly mentally active sitting) and in leisure time (presumably predominantly mentally passive sitting) showed weak associations of sitting at work and frequent symptoms of anxiety and depression, while more time sitting during leisure time was associated with three to four times higher OR compared to less leisure time sitting [37]. This is comparable to the results in the present study, where more self-reported time in mentally passive sitting (<120 min/day) compared to less (0 to 90 min/day) was associated with ~60% to 100% higher risk (OR) for different mental ill-health outcomes. No similar associations were found for mentally active sitting or time sitting while socializing. Although the directions of the observed associations are not clear, possible variations between different types of sitting and mental health outcomes should be considered in future studies examining the impact of pandemic restrictions, as well as in interventions targeting sitting for mental health outcomes.
For changes in sitting time, daily PA, and exercise, it was more evident that individuals with low PA levels at baseline had higher odds of a negatively perceived change in PA due to the pandemic. This is similar to a previous study by Lesser et al., which concluded that mainly inactive individuals had become less physically active during the pandemic [23]. On the contrary, a Canadian study showed that previously active adults decreased their PA, while previously inactive adults did not change their PA due to the pandemic [38]. In contrast to other studies, women in the present study had a 36–38% higher risk of decreasing their daily PA and exercise level compared to men. There were also differences between occupational groups, where white-collar workers had higher odds of increasing daily PA and exercise, while decreasing sedentary time compared to blue-collar workers. Differences in lifestyle changes due to COVID-19 in relation to occupation groups have not been addressed in previous studies.
The small changes in diet, alcohol, and smoking habits in the present study are in line with studies from other countries [10,11,12,13,15,17,19]. However, perceived changes varied between and within subgroups. For diet, individuals with healthy diets had an approximately 80% lower risk of dietary habits deteriorating compared to individuals with poor habits. Moreover, white-collar workers were more prone to changing their diet in either direction, and had approximately 90% higher probability of worsening as well as improving their diet compared to blue-collar workers. This might be due to blue-collar workers having to be at their workplaces to a higher extent, which probably contributed to fewer possibilities to change their diet behavior compared to white-collar workers, who were able to work more from home. The large differences between blue- and white-collar workers working from home or not in this study are similar to a report from Swedish statistics. The report concluded that while 56% of individuals with a university degree or equivalent reported that they did not work from home at all, the corresponding number among individuals with occupations requiring shorter education was 97% [39].
For alcohol, young individuals in this study had higher odds of both an increase and decrease in alcohol intake, with women having a lower probability of decreasing their alcohol intake. A Canadian study concluded that younger individuals and individuals with higher educational levels had higher risks of increasing their alcohol intake compared to older individuals and those with a lower education level [15]. For smoking, our results indicated that daily smokers had a 53% higher risk of increasing their smoking compared to occasional smokers, which is in line with a small Italian study [19]. However, a study of >20,000 men and women over 16 years of age found that smokers in England were more likely to report trying to quit smoking, and rates of smoking cessation were higher than before the COVID-19 pandemic [40].
There were more pronounced changes for all lifestyle habits during the first compared to the second COVID-19 wave. As recommended restrictions in Sweden were similar during both waves, possible explanations for this might be temporal effects and change saturation. This includes perceived changes in lifestyle habits during the first wave becoming the “new normal” and that people experienced more resistance to change during the second wave [41].
As healthy lifestyle habits are important in preventing noncommunicable diseases [1,42], the need to support individuals in improving or maintaining healthy lifestyle habits during the COVID-19 pandemic in order to prevent health inequalities in society and promote national public health is emphasized.
4.2. Changes in Mental Health in Sweden Compared to Other Countries
We found a relatively low prevalence of mental ill-health, with 4% to 6% scoring high on health anxiety regarding their own health, generalized anxiety and depression symptoms, as well as concerns regarding employment and economy. Only health anxiety for relatives was more prevalent (12%). The findings regarding health anxiety for one’s own health are similar to the report from the Swedish National Board of Public Health in May 2020, where 5% were very worried about their own health, whereas a higher frequency for health anxiety was noted for relatives (25%) [35]. This is lower in comparison to reports from the UK, where 37% experienced poor mental well-being [43]. We found that women, participants <60 years, and those with a perceived negative change in daily PA, sitting time, exercise, diet, and alcohol consumption, were more vulnerable to mental ill-health. The higher odds of mental ill-health in women and younger age groups has been reported in previous studies [21,43], as has the association between mental health and PA [7,8,9,38], alcohol consumption [17,18], diet [17], and smoking habits [17]. Interestingly in this study, the higher odds for women and younger individuals were also seen for health concerns for their relatives, which has not been reported previously.
4.3. Strengths and Limitations
A strength of this study is the reasonably large cohort of women and men of different ages, with a variation in educational level and occupation. The extended period of data collection (from April to December) enabled unique comparative analyses between the two waves of the COVID-19 pandemic in the total study population, as well as in subgroups. Another strength is that the study explored different components of the PA pattern, including both sitting, daily PA, and exercise, as well as different aspects of mental health (clustered mental ill-health, anxiety concern, generalized anxiety, and depression). A limitation is that the study is that it did not have data on baseline depression or anxiety. However, the analyses adjusted for self- reported general health. A limitation is the cross-sectional design, which decreased the ability to draw conclusions of causality and temporal order. Also, we examined self-reported perceived changes in lifestyle, which are not the same as within-person change based on multiple measurements. The study population consisted of individuals who accepted answering the extra covid-19-related questions, which poses a risk of selection bias. Another limitation is that data regarding lifestyle habits and changes in lifestyle habits were based on questionnaires not validated in previous work, thus risking recall bias [44]. However, questionnaires with categorical answer modes, as used in the present study, provide better validity compared to open answers for levels of PA [45].
5. Conclusions
Our findings suggest only small perceived changes in lifestyle habits, including time sitting, daily PA, exercise, diet, alcohol, and smoking in men and women from the Swedish working population in relation to the first two COVID-19 pandemic waves. Both negative and positive changes were more pronounced during the first wave compared to the second. Women, individuals <60 years, those with a university degree, and white-collar workers had higher odds of changing lifestyle habits compared to their counterparts. Individuals with an unhealthy lifestyle at baseline were more likely to change their lifestyle habits negatively. Thus, changes varied between sociodemographic subgroups, suggesting a clear divergence in how the pandemic waves might have impacted individuals and society. Furthermore, negative changes in lifestyle habits tended to be associated with higher levels of mental ill-health. The perceived negative changes in health-related lifestyles is a considerable public health concern, with possible implications for further increases in health inequality and mental health challenges in the light of the COVID-19 pandemic. To strengthen the resilience of both society and individuals to future viral pandemics, there is a clear need to focus on the promotion of healthy lifestyle habits, especially in socially vulnerable groups and individuals who already have an unhealthy lifestyle.
Author Contributions
Conceptualization, V.B., A.L., B.E., L.V.K., D.V., E.H., G.A., P.W., J.S.E., T.H., M.L., and E.E.-B.; methodology, V.B., G.A., P.W., D.V., A.S., and E.E.-B.; software, P.W., D.V., A.S., and E.E.-B.; validation, B.E., L.V.K., E.H., Ö.E., J.S.E., and T.H.; formal analysis, V.B., A.S., D.V., and E.E.-B.; investigation, G.A., P.W., V.B., A.L., and E.E.-B.; resources, G.A., P.W., and E.E.-B.; data curation, G.A., P.W., and E.E.-B.; writing—original draft preparation, V.B., A.L., B.E., L.V.K., J.S.E., T.H., and E.E.-B.; writing—review and editing, V.B., A.L., B.E., L.V.K., D.V., E.H., G.A., P.W., A.S., Ö.E., M.L., J.S.E., T.H., and E.E.-B.; visualization, D.V., A.L., and E.E.-B.; supervision, B.E., Ö.E., M.L., V.B., and E.E.-B.; project administration, G.A., P.W., V.B., and E.E.-B.; funding acquisition, B.E., Ö.E., and E.E.-B. All authors have read and agreed to the published version of the manuscript.
Funding
This research was funded by The Swedish Heart-Lung Foundation, grant number 20200564 and The Swedish Military Forces Research Authority, grant number AF 922 0915.
Institutional Review Board Statement
The study was conducted according to the guidelines of the Declaration of Helsinki, and approved by the Stockholm Ethics Review Board (Dnr 2020-02727, 30 June 2020).
Informed Consent Statement
Informed consent was obtained from all subjects involved in the study.
Data Availability Statement
The datasets generated and/or analyzed during the current study are not publicly available due being property of HPI Health Profile Institute, but are available from the corresponding author or the HPI Health Profile Institute on support@hpihealth.se.
Conflicts of Interest
Gunnar Andersson (responsible for research and method) and Peter Wallin (CEO and responsible for research and method) are employed at HPI Health Profile Institute.
Appendix A
1. Do you work at the moment?
□ Yes
□ No
2. Do you work from home?
□ All the time
□ Partly
□ My occupation requires that I am at work
□ I can work at home, but choose to be at work
3. How has your lifestyle changed the last 14 days due to the COVID-19 pandemic?
| Sitting | □ Increased | □ Unchanged | □ Decreased |
| Daily activity | □ Decreased | □ Unchanged | □ Increased |
| Exercise | □ Decreased | □ Unchanged | □ Increased |
| Diet | □ Worsened | □ Unchanged | □ Improved |
| Alcohol intake | □ Increased | □ Unchanged | □ Decreased |
| Smoking | □ Increased | □ Unchanged | □ Decreased |
4. How have your commuting habits to and from work changed due to the COVID-19 pandemic?
□ Same as before
□ Changed
□ Stopped commuting
5. If changed, how have they changed?
□ Bus/train to active commuting
□ Bus/train to car
□ Car to active commuting
□ Car to bus/train
□ Active commuting to car
□ Active commuting to bus/train
6. When sitting at home, how much of the time do you spend in:
- Mentally passive sitting, including tv-viewing, using you phone/ipad/computer to browse the internet etc.
______ hours/day ______ min/day
- Mentally active sitting, including working, reading, solving cross-words or sudoku etc.
______ hours/day ______ min/day
- Socialization, including having a meal, talking with friends or family etc.
______ hours/day ______ min/day
7. Choose the statement that best describes how you have felt the last week:
(A) My own health:
□ 1. I do not worry about my health
□ 2. I worry now and then about my health
□ 3. I spend a lot of time worrying about my health
□ 4. I spend most of the time worrying about my health
(B) The health of my relatives:
□ 1. I do not worry about the health of my relatives
□ 2. I worry now and then about the health of my relatives
□ 3. I spend a lot of time worrying about the health of my relatives
□ 4. I spend most of the time worrying about the health of my relatives
8. I am worried that I will have to leave my employment before I would like to
□ 1. Not at all
□ 2.
□ 3.
□ 4.
□ 5. A lot
9. I am worried about the economy of the household
□ 1. Not at all
□ 2.
□ 3.
□ 4.
□ 5. A lot
10. During the last 14 days, how often have the following troubled you?
(A) Not being able to stop worrying or control your worrying?
□ 1. Not at all
□ 2. Several days
□ 3. More than half of the days
□ 4. Almost every day
(B) Felt down, depressed or hopelessness?
□ 1. Not at all
□ 2. Several days
□ 3. More than half of the days
□ 4. Almost every day
Appendix B
Exercise habits
I exercise for the purpose of maintaining/improving my physical fitness, health and well-being…
□ Never
□ Sometimes
□ 1–2 times/week
□ 3–5 times/week 6 times/week
□ At least 6 times/week
Sitting in leisure time
I remain sedentary in my spare time…
□ All the time
□ 75% of the time
□ 50% of the time
□ 25% of the time
□ Almost no time
Sitting at work
I remain sedentary at work…
□ All the time
□ 75% of the time
□ 50% of the time
□ 25% of the time
□ Almost no time
Diet
I consider my diet, regarding both meal frequency and nutritional content to be…
□ Very poor
□ Poor
□ Neither good or bad
□ Good
□ Very good
Smoking habits
I smoke…
□ At least 20 cig/day
□ 11–19 cig/day
□ 1–10 cig/day
□ Occasionally
□ Never
Overall stress
I perceive stress in my life, both personally and at work…
□ Very often
□ Often
□ Sometime
□ Rarely
□ Never
Perceived symptoms of anxiety and depression
I experience worry, sadness or anxiety…
□ Very often
□ Often
□ Sometime
□ Rarely
□ Never
Percieved health
I perceive my physical and mental health as…
□ Very poor
□ Poor
□ Neither good or bad
□ Good
□ Very good
Table A1.
Characteristics of participants with COVID-data and/or Health profile assessment-data between 21 April and 2 December in year 2020 (n = 11,844) and participants with Health profile assessment-data during the same time period in year 2019 (n = 20,864).
Table A1.
Characteristics of participants with COVID-data and/or Health profile assessment-data between 21 April and 2 December in year 2020 (n = 11,844) and participants with Health profile assessment-data during the same time period in year 2019 (n = 20,864).
| HPA Year 2019 | HPA Year 2020 | Difference | |
|---|---|---|---|
| n | 20,864 | 11,844 | |
| Sex (women) | 39% | 41% | 0.005 |
| Age (year) | 44.4 (11.8) | 45.6 (11.4) | <0.001 |
| Estimated VO2max (ml/min/kg) | 35.9 (9.8) | 35.9 (9.8) | 0.781 |
| BMI (kg/m2) | 26.4 (4.6) | 26.5 (4.7) | 0.021 |
| Exercise (Never/irregular) | 30% | 26% | <0.001 |
| Sitting at work (All the time/75% of the time) | 38% | 36% | <0.001 |
| Sitting in leisure (All the time/75% of the time) | 10% | 9% | 0.174 |
| University degree | 28% | 29% | 0.036 |
| Occupation group (Blue collar) | 31% | 29% | 0.003 |
| Diet (Very poor/poor) | 5% | 4% | <0.001 |
| Alcohol risk consumption (AUDIT-C score >3 women, >4 men) | 34% | 34% | 0.220 |
| Daily smoker (≥1 cig/day) | 7% | 6% | 0.003 |
| Overall stress (Very often/often) | 13% | 12% | 0.001 |
| Perceived symptoms of anxiety and depression (Very often/often) | 8% | 8% | 0.623 |
| Data presented as mean (SD) or percentage |
Table A2.
Odds ratio (95% CI) for change (no change as reference) in alcohol intake in relation to sex, age-group, educational level, occupation group, baseline levels and wave of COVID-19.
Table A2.
Odds ratio (95% CI) for change (no change as reference) in alcohol intake in relation to sex, age-group, educational level, occupation group, baseline levels and wave of COVID-19.
| Alcohol Intake (n = 2790) | Decreased | Increased |
|---|---|---|
| Women vs. Men | 0.70 (0.45–1.09) | 1.13 (0.83–1.53) |
| 18–59 years vs. 60–78 years | 2.31 (0.93–5.79) | 2.00 (1.13–3.57) |
| University vs. non-university | 1.09 (0.69–1.72) | 1.12 (0.82–1.53) |
| White collar vs. Blue collar | 2.16 (1.06–4.40) | 0.99 (0.66–1.48) |
| April–June vs. July–September | 2.22 (1.36–3.63) | 1.08 (0.76–1.55) |
| October–December vs. July–September | 0.94 (0.53–1.67) | 1.10 (0.79–1.54) |
| No alcohol risk consumption vs. Alcohol risk consumption | 0.16 (0.08–0.31) | 0.92 (0.68–1.23) |
References
- Kesaniemi, Y.K.; Danforth, E., Jr.; Jensen, M.D.; Kopelman, P.G.; Lefèbvre, P.; A Reeder, B. Dose-response issues concerning physical activity and health: An evidence-based symposium. Med. Sci. Sports Exerc. 2001, 33 (Suppl. 6), S351–S358. [Google Scholar] [CrossRef]
- Klatsky, A.L. Alcohol and cardiovascular diseases: Where do we stand today? J. Intern. Med. 2015, 278, 238–250. [Google Scholar] [CrossRef]
- Mente, A.; De Koning, L.; Shannon, H.S.; Anand, S.S. A Systematic Review of the Evidence Supporting a Causal Link Between Dietary Factors and Coronary Heart Disease. Arch. Intern. Med. 2009, 169, 659–669. [Google Scholar] [CrossRef]
- Godtfredsen, N.S.; Prescott, E. Benefits of smoking cessation with focus on cardiovascular and respiratory comorbidities. Clin. Respir. J. 2011, 5, 187–194. [Google Scholar] [CrossRef]
- Ng, Q.X.; Ho, C.Y.X.; Chan, H.W.; Yong, B.Z.J.; Yeo, W.-S. Managing childhood and adolescent attention-deficit/hyperactivity disorder (ADHD) with exercise: A systematic review. Complement. Ther. Med. 2017, 34, 123–128. [Google Scholar] [CrossRef]
- Rodriguez-Ayllon, M.; Cadenas-Sánchez, C.; Estévez-López, F.; Muñoz, N.E.; Mora-Gonzalez, J.; Migueles, J.H.; Molina-García, P.; Henriksson, H.; Mena-Molina, A.; Martínez-Vizcaíno, V.; et al. Role of Physical Activity and Sedentary Behavior in the Mental Health of Preschoolers, Children and Adolescents: A Systematic Review and Meta-Analysis. Sports Med. 2019, 49, 1383–1410. [Google Scholar] [CrossRef] [PubMed]
- Cheval, B.; Sivaramakrishnan, H.; Maltagliati, S.; Fessler, L.; Forestier, C.; Sarrazin, P.; Orsholits, D.; Chalabaev, A.; Sander, D.; Ntoumanis, N.; et al. Relationships between changes in self-reported physical activity, sedentary behaviour and health during the coronavirus (COVID-19) pandemic in France and Switzerland. J. Sports Sci. 2020, 2020, 1–6. [Google Scholar] [CrossRef]
- Constandt, B.; Thibaut, E.; De Bosscher, V.; Scheerder, J.; Ricour, M.; Willem, A. Exercising in Times of Lockdown: An Analysis of the Impact of COVID-19 on Levels and Patterns of Exercise among Adults in Belgium. Int. J. Environ. Res. Public Health 2020, 17, 4144. [Google Scholar] [CrossRef]
- Maugeri, G.; Castrogiovanni, P.; Battaglia, G.; Pippi, R.; D’Agata, V.; Palma, A.; Di Rosa, M.; Musumeci, G. The impact of physical activity on psychological health during Covid-19 pandemic in Italy. Heliyon 2020, 6, e04315. [Google Scholar] [CrossRef] [PubMed]
- Bin Zarah, A.; Enriquez-Marulanda, J.; Andrade, J.M. Relationship between Dietary Habits, Food Attitudes and Food Security Status among Adults Living within the United States Three Months Post-Mandated Quarantine: A Cross-Sectional Study. Nutrients 2020, 12, 3468. [Google Scholar] [CrossRef] [PubMed]
- Flanagan, E.W.; Beyl, R.A.; Fearnbach, S.N.; Altazan, A.D.; Martin, C.K.; Redman, L.M. The impact of COVID-19 stay-at-home orders on health behaviors in adults. Obesity 2021, 29, 438–445. [Google Scholar] [CrossRef] [PubMed]
- Poelman, M.P.; Gillebaart, M.; Schlinkert, C.; Dijkstra, S.C.; Derksen, E.; Mensink, F.; Hermans, R.C.; Aardening, P.; de Ridder, D.; de Vet, E. Eating behavior and food purchases during the COVID-19 lockdown: A cross-sectional study among adults in the Netherlands. Appetite 2021, 157, 105002. [Google Scholar] [CrossRef]
- Ammar, A.; Brach, M.; Trabelsi, K.; Chtourou, H.; Boukhris, O.; Masmoudi, L.; Bouaziz, B.; Bentlage, E.; How, D.; Ahmed, M.; et al. Effects of COVID-19 Home Confinement on Eating Behaviour and Physical Activity: Results of the ECLB-COVID19 International Online Survey. Nutrients 2020, 12, 1583. [Google Scholar] [CrossRef]
- Błaszczyk-Bębenek, E.; Jagielski, P.; Bolesławska, I.; Jagielska, A.; Nitsch-Osuch, A.; Kawalec, P. Nutrition Behaviors in Polish Adults before and during COVID-19 Lockdown. Nutrients 2020, 12, 3084. [Google Scholar] [CrossRef]
- Zajacova, A.; Jehn, A.; Stackhouse, M.; Denice, P.; Ramos, H. Changes in health behaviours during early COVID-19 and socio-demographic disparities: A cross-sectional analysis. Can. J. Public Health 2020, 111, 953–962. [Google Scholar] [CrossRef] [PubMed]
- Di Renzo, L.; Gualtieri, P.; Pivari, F.; Soldati, L.; Attinà, A.; Cinelli, G.; Leggeri, C.; Caparello, G.; Barrea, L.; Scerbo, F.; et al. Eating habits and lifestyle changes during COVID-19 lockdown: An Italian survey. J. Transl. Med. 2020, 18, 229. [Google Scholar] [CrossRef]
- Stanton, R.; To, Q.G.; Khalesi, S.; Williams, S.L.; Alley, S.J.; Thwaite, T.L.; Fenning, A.S.; Vandelanotte, C. Depression, Anxiety and Stress during COVID-19: Associations with Changes in Physical Activity, Sleep, Tobacco and Alcohol Use in Australian Adults. Int. J. Environ. Res. Public Health 2020, 17, 4065. [Google Scholar] [CrossRef] [PubMed]
- Tran, T.D.; Hammarberg, K.; Kirkman, M.; Nguyen, H.T.M.; Fisher, J. Alcohol use and mental health status during the first months of COVID-19 pandemic in Australia. J. Affect. Disord. 2020, 277, 810–813. [Google Scholar] [CrossRef]
- Cancello, R.; Soranna, D.; Zambra, G.; Zambon, A.; Invitti, C. Determinants of the Lifestyle Changes during COVID-19 Pandemic in the Residents of Northern Italy. Int. J. Environ. Res. Public Health 2020, 17, 6287. [Google Scholar] [CrossRef]
- Elbay, R.Y.; Kurtulmuş, A.; Arpacıoğlu, S.; Karadere, E. Depression, anxiety, stress levels of physicians and associated factors in Covid-19 pandemics. Psychiatry Res. 2020, 290, 113130. [Google Scholar] [CrossRef]
- Duncan, G.E.; Avery, A.R.; Seto, E.; Tsang, S. Perceived change in physical activity levels and mental health during COVID-19: Findings among adult twin pairs. PLoS ONE 2020, 15, e0237695. [Google Scholar] [CrossRef]
- Jacob, L.; Tully, M.A.; Barnett, Y.; Lopez-Sanchez, G.F.; Butler, L.; Schuch, F.; López-Bueno, R.; McDermott, D.; Firth, J.; Grabovac, I.; et al. The relationship between physical activity and mental health in a sample of the UK public: A cross-sectional study during the implementation of COVID-19 social distancing measures. Ment. Health Phys. Act. 2020, 19, 100345. [Google Scholar] [CrossRef]
- Lesser, I.A.; Nienhuis, C.P. The Impact of COVID-19 on Physical Activity Behavior and Well-Being of Canadians. Int. J. Environ. Res. Public Health 2020, 17, 3899. [Google Scholar] [CrossRef]
- Hallgren, M.; Owen, N.; Stubbs, B.; Zeebari, Z.; Vancampfort, D.; Schuch, F.; Bellocco, R.; Dunstan, D.; Lagerros, Y.T. Passive and mentally-active sedentary behaviors and incident major depressive disorder: A 13-year cohort study. J. Affect. Disord. 2018, 241, 579–585. [Google Scholar] [CrossRef] [PubMed]
- Salkovskis, P.M.; A Rimes, K.; Warwick, H.M.C.; Clark, D.M. The Health Anxiety Inventory: Development and validation of scales for the measurement of health anxiety and hypochondriasis. Psychol. Med. 2002, 32, 843–853. [Google Scholar] [CrossRef]
- Vander Elst, T.D.W.H.; De Cuyper, N. The Job Insecurity Scale: A psychometric evaluation across five European countries. Eur. J. Work Organ. Psychol. 2014, 23, 364–380. [Google Scholar] [CrossRef]
- Statistics Sweden. Levnadsförhållanden 1980–2016—Ett Urval av Indikatorer Living [Conditions 1980–2016—A Selection of Indicators]. Available online: https://www.scb.se/publikation/33620 (accessed on 2 March 2018). (In Swedish)
- Spitzer, R.L.; Kroenke, K.; Williams, J.B.; Löwe, B. A brief measure for assessing generalized anxiety disorder: The GAD-7. Arch. Intern. Med. 2006, 166, 1092–1097. [Google Scholar] [CrossRef] [PubMed]
- Kroenke, K.; Spitzer, R.L.; Williams, J.B. The PHQ-9: Validity of a brief depression severity measure. J. Gen. Intern. Med. 2001, 16, 606–613. [Google Scholar] [CrossRef] [PubMed]
- Astrand, I. Aerobic work capacity in men and women with special reference to age. Acta Physiol. Scand. Suppl. 1960, 49, 1–92. [Google Scholar]
- Saunders, J.B.; Aasland, O.G.; Babor, T.F.; De La Fuente, J.R.; Grant, M. Development of the Alcohol Use Disorders Identification Test (AUDIT): WHO Collaborative Project on Early Detection of Persons with Harmful Alcohol Consumption-II. Addiction 1993, 88, 791–804. [Google Scholar] [CrossRef]
- Stastistics Sweden. Standard för Svensk Yrkesklassificering (SSYK) [Standard for Swedish Occupational Classification (SSYK)]. Available online: http://www.scb.se/dokumentation/klassifikationer-och-standarder/standard-for-svenskyrkesklassificering-ssyk/ (accessed on 18 March 2020). (In Swedish)
- Public health Agency of Sweden. Bekräftade fall i Sverige—Daglig Uppdatering [Confirmed Cases in Sweden -Daily Uppdate]. Available online: https://www.folkhalsomyndigheten.se/smittskydd-beredskap/utbrott/aktuella-utbrott/covid-19/statistik-och-analyser/bekraftade-fall-i-sverige/ (accessed on 3 December 2020). (In Swedish).
- Wickham, H.A.M.; Bryan, J.; Chang, W.; D’Agostino McGowan, L.; François, R.; Grolemund, G.; Hayes, A.; Henry, L.; Hester, J.; Kuhn, M.; et al. Welcome to the Tidyverse. J. Open Source Softw. 2019, 4, 43. [Google Scholar] [CrossRef]
- Public Health Agency of Sweden. Hälsorapport Maj 2020 [Health report May 2020]. Available online: https://halsorapport.se/sv/resultat/resultat-maj-2020/ (accessed on 4 January 2021). (In Swedish).
- Tison, G.H.; Avram, R.; Kuhar, P.; Abreau, S.; Marcus, G.M.; Pletcher, M.J.; Olgin, J.E. Worldwide Effect of COVID-19 on Physical Activity: A Descriptive Study. Ann. Intern. Med. 2020, 173, 767–770. [Google Scholar] [CrossRef]
- Hallgren, M.; Nguyen, T.-T.-D.; Owen, N.; Vancampfort, D.; Dunstan, D.W.; Wallin, P.; Andersson, G.; Ekblom-Bak, E. Associations of sedentary behavior in leisure and occupational contexts with symptoms of depression and anxiety. Prev. Med. 2020, 133, 106021. [Google Scholar] [CrossRef]
- Meyer, J.; McDowell, C.; Lansing, J.; Brower, C.; Smith, L.; Tully, M.; Herring, M. Changes in Physical Activity and Sedentary Behavior in Response to COVID-19 and Their Associations with Mental Health in 3052 US Adults. Int. J. Environ. Res. Public Health 2020, 17, 6469. [Google Scholar] [CrossRef]
- Stastistics Sweden. En Av Tre Jobbar Hemifrån [One out of Three Works from Home]. Available online: https://www.scb.se/om-scb/nyheter-och-pressmeddelanden/en-tre-av-jobbar-hemifran/ (accessed on 4 February 2021). (In Swedish)
- Jackson, S.E.; Garnett, C.; Shahab, L.; Oldham, M.; Brown, J. Association of the COVID-19 lockdown with smoking, drinking and attempts to quit in England: An analysis of 2019–2020 data. Addiction 2020. [Google Scholar] [CrossRef]
- Amarantou, V.; Kazakopoulou, S.; Chatzoudes, D.; Chatzoglou, P. Resistance to change: An em-pirical investigation of its antecedents. J. Organ. Chang. Manag. 2018, 31, 1. [Google Scholar]
- Abramson, J.L.; Vaccarino, V. Relationship Between Physical Activity and Inflammation Among Apparently Healthy Middle-aged and Older US Adults. Arch. Intern. Med. 2002, 162, 1286–1292. [Google Scholar] [CrossRef]
- Smith, L.; Jacob, L.; Yakkundi, A.; McDermott, D.; Armstrong, N.C.; Barnett, Y.; López-Sánchez, G.F.; Martin, S.; Butler, L.; A Tully, M. Correlates of symptoms of anxiety and depression and mental wellbeing associated with COVID-19: A cross-sectional study of UK-based respondents. Psychiatry Res. 2020, 291, 113138. [Google Scholar] [CrossRef]
- Ainsworth, B.; Cahalin, L.; Buman, M.; Ross, R. The Current State of Physical Activity Assessment Tools. Prog. Cardiovasc. Dis. 2015, 57, 387–395. [Google Scholar] [CrossRef]
- Olsson, S.J.G.; Ekblom, Ö.; Andersson, E.; Börjesson, M.; Kallings, L.V. Categorical answer modes provide superior validity to open answers when asking for level of physical activity: A cross-sectional study. Scand. J. Public Health 2016, 44, 70–76. [Google Scholar] [CrossRef] [PubMed]


Publisher’s Note: MDPI stays neutral with regard to jurisdictional claims in published maps and institutional affiliations. |
© 2021 by the authors. Licensee MDPI, Basel, Switzerland. This article is an open access article distributed under the terms and conditions of the Creative Commons Attribution (CC BY) license (http://creativecommons.org/licenses/by/4.0/).