Review

Automated Detection of Hypertension Using Physiological Signals: A Review

1
Department of Electrical and Computer Science Engineering, Institute of Infrastructure Technology Research and Management, Ahmedabad 380026, India
2
National Heart Centre, Singapore 639798, Singapore
3
Department of Electronics and Computer Engineering, Ngee Ann Polytechnic, Singapore 639798, Singapore
4
Department of Bioinformatics and Medical Engineering, Asia University, Taichung 41354, Taiwan
5
Department of Biomedical Engineering, School of Science and Technology, SUSS, Singapore 599494, Singapore
*
Author to whom correspondence should be addressed.
Int. J. Environ. Res. Public Health 2021, 18(11), 5838; https://doi.org/10.3390/ijerph18115838
Submission received: 9 April 2021 / Revised: 10 May 2021 / Accepted: 24 May 2021 / Published: 29 May 2021
(This article belongs to the Section Digital Health)

Abstract

:
Arterial hypertension (HT) is a chronic condition of elevated blood pressure (BP), which may cause increased incidence of cardiovascular disease, stroke, kidney failure and mortality. If the HT is diagnosed early, effective treatment can control the BP and avert adverse outcomes. Physiological signals like electrocardiography (ECG), photoplethysmography (PPG), heart rate variability (HRV), and ballistocardiography (BCG) can be used to monitor health status but are not directly correlated with BP measurements. The manual detection of HT using these physiological signals is time consuming and prone to human errors. Hence, many computer-aided diagnosis systems have been developed. This paper is a systematic review of studies conducted on the automated detection of HT using ECG, HRV, PPG and BCG signals. In this review, we have identified 23 studies out of 250 screened papers, which fulfilled our eligibility criteria. Details of the study methods, physiological signal studied, database used, various nonlinear techniques employed, feature extraction, and diagnostic performance parameters are discussed. The machine learning and deep learning based methods based on ECG and HRV signals have yielded the best performance and can be used for the development of computer-aided diagnosis of HT. This work provides insights that may be useful for the development of wearable for continuous cuffless remote monitoring of BP based on ECG and HRV signals.

1. Introduction

In adults, hypertension (HT) is diagnosed when repeated office measurement of systolic blood pressure (SBP) is ≥140 mmHg, or diastolic blood pressure (DBP) is ≥90 mmHg [1]. HT can be classified into different categories based on the office measurement (Table 1) [1]. HT increase the force exerted by by the blood against the inner walls of the arteries, which transport oxygen-rich blood pumped out of the heart to the rest of the body [2]. As such, chronic HT can inflict damage to various vital organs of the body, such as lung, brain, heart, and kidneys [2]. The World Health Organization estimates that nearly 1.3 billion people suffered from HT in 2015 globally, and less than 20% received management [2]. HT is largely asymptomatic, but symptoms can sometimes occur, including headaches, panic attacks and dizziness.

1.1. ECG Signals and Blood Pressure (BP) Measurements

The electrocardiogram (ECG) records the electrical potentials on the body surface that originate from heart, and the signals can provide information on the rhythm as well as structure and function of the heart [3,4,5,6]. Using advanced analysis, the ECG signals in HT subjects can be correlated to BP measurements and even discriminate for higher clinical risk [7,8,9,10]. In HT, the heart observes more force and over time becomes hypertrophied, which induces the ECG. 
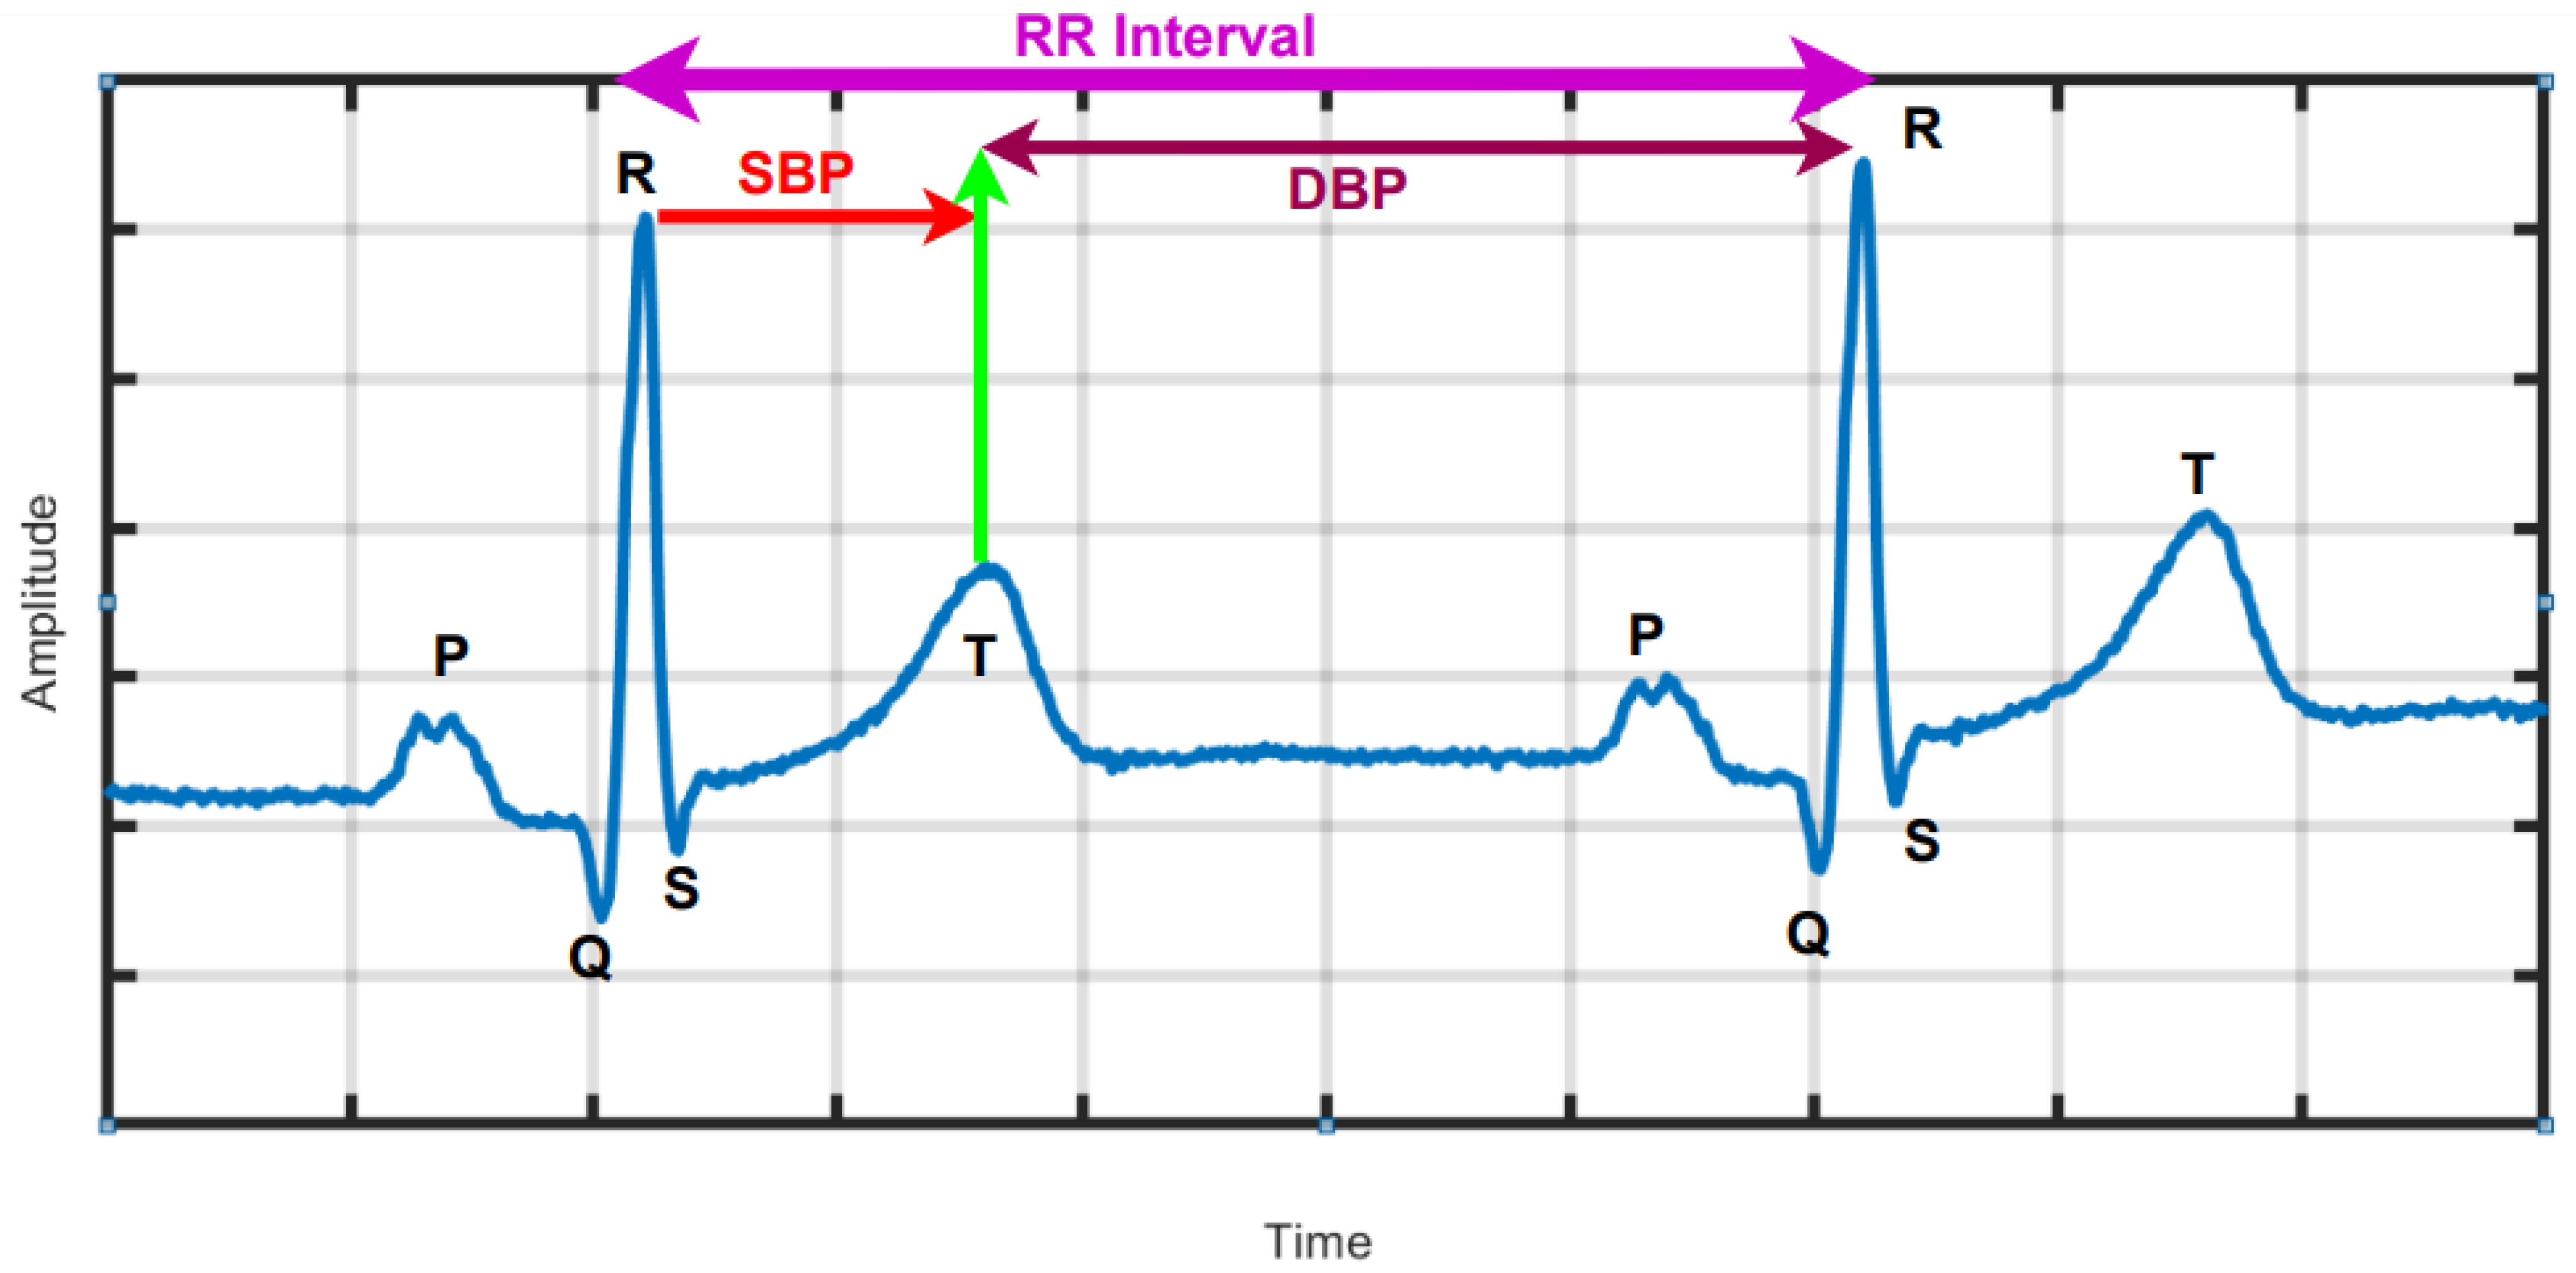
Figure 1 is a graphical depiction of a typical normal ECG waveform, which comprise the P wave, QRS complex and T wave representing atrial depolarization, ventricular depolarization and ventricular re-polarization, as well as standard ECG intervals, including RR interval, PR interval, QT interval and lengths of the PR and ST segments. In [7], associations were found between SBP and DBP and changes in the ECG at two intervals delineated by the peak of the R wave to the middle of the T wave and the mid of the T-wave to the peak of the R wave as indicated in Figure 1, respectively, using machine learning (ML) [11,12].

1.2. HRV Signal

The temporal variation of sequential heartbeats (RR intervals) is termed HRV [13]. From the ECG signal, R-peaks are first extracted and then HRV is deduced using computer programming based on the difference in RR intervals (Figure 1). HRV reflects the activity of automatic nervous system and provides a window into the cardiac sympathetic and parasympathetic activities, which have significant physiological impact on heart rate rhythm and contractile function [13]. HRV measurement is non-intrusive easy to perform and results are reproducible. Importantly, it confers both diagnostic and prognostic implications for wellness and cardiac disease [14,15]. High HRV is associated with normal subjects and reduced HRV may be pathological. HRV can be analyzed over either long or short durations [14]. Long duration analysis encompasses activity throughout the day and night (24 h analysis), where as short-duration analysis uses only five-minutes of HRV data. In HT patients, HRV is affected by the presence of cardiovascular risk factors. In depressed patients with HT, HRV is associated with vascular cardiac and renal target organ damage [13,16]. The long-term (24-h) HRV is useful in the diagnosis of severe HT conditions. An increased sympathetic activity saturate the ability to modulate heart rate, hence HRV is depressed. To identify severe HRV or high-risk HRV, standard deviation of NN intervals should be less than 50 to 70 msec and HRV triangular index is less than 20 units. Similarly, the NN interval duration is 7.8 msec [17]. In summary, HRV is a simple non-invasive method which can be used to assess the cardiovascular system [18].

1.3. Photoplethysmography (PPG Signal)

PPG uses low-intensity infrared (IR) light sensor to detect the amount of light absorbed by or reflected from tissues supplied by the blood vessels. It produces photo electric signal either transmissive or reflective, which reflect the pulsatile blood volume in the area covered by sensors [19,20]. The PPG signal contains information about the arterial and venous circulatory system [19,20]. The PPG is correlated with and has been applied to the measurement of heart rate, BP, and blood oxygenation there by providing clinically useful information for physiological monitoring.

1.4. Ballistocardiogram (BCG) Signal

BCG measures the whole body motion in terms of displacement, velocity, and acceleration in response to the cyclical ejection of blood from the heart [21]. It reflects the sum of factors linked to heart and blood vessel function, and used to diagnose various cardio vascular diseases [21].
In this paper, we reviewed PPG, BCG, ECG and HRV signals related computer-aided diagnosis systems developed for the arterial HT. To the best of our knowledge this is the first review to provide unique ranges for nonlinear features for healthy control (HC), low-risk hypertension (LRHT), and high-risk hypertension (HRHT) ECG classes.

2. Methods and Material Used in Article Searching

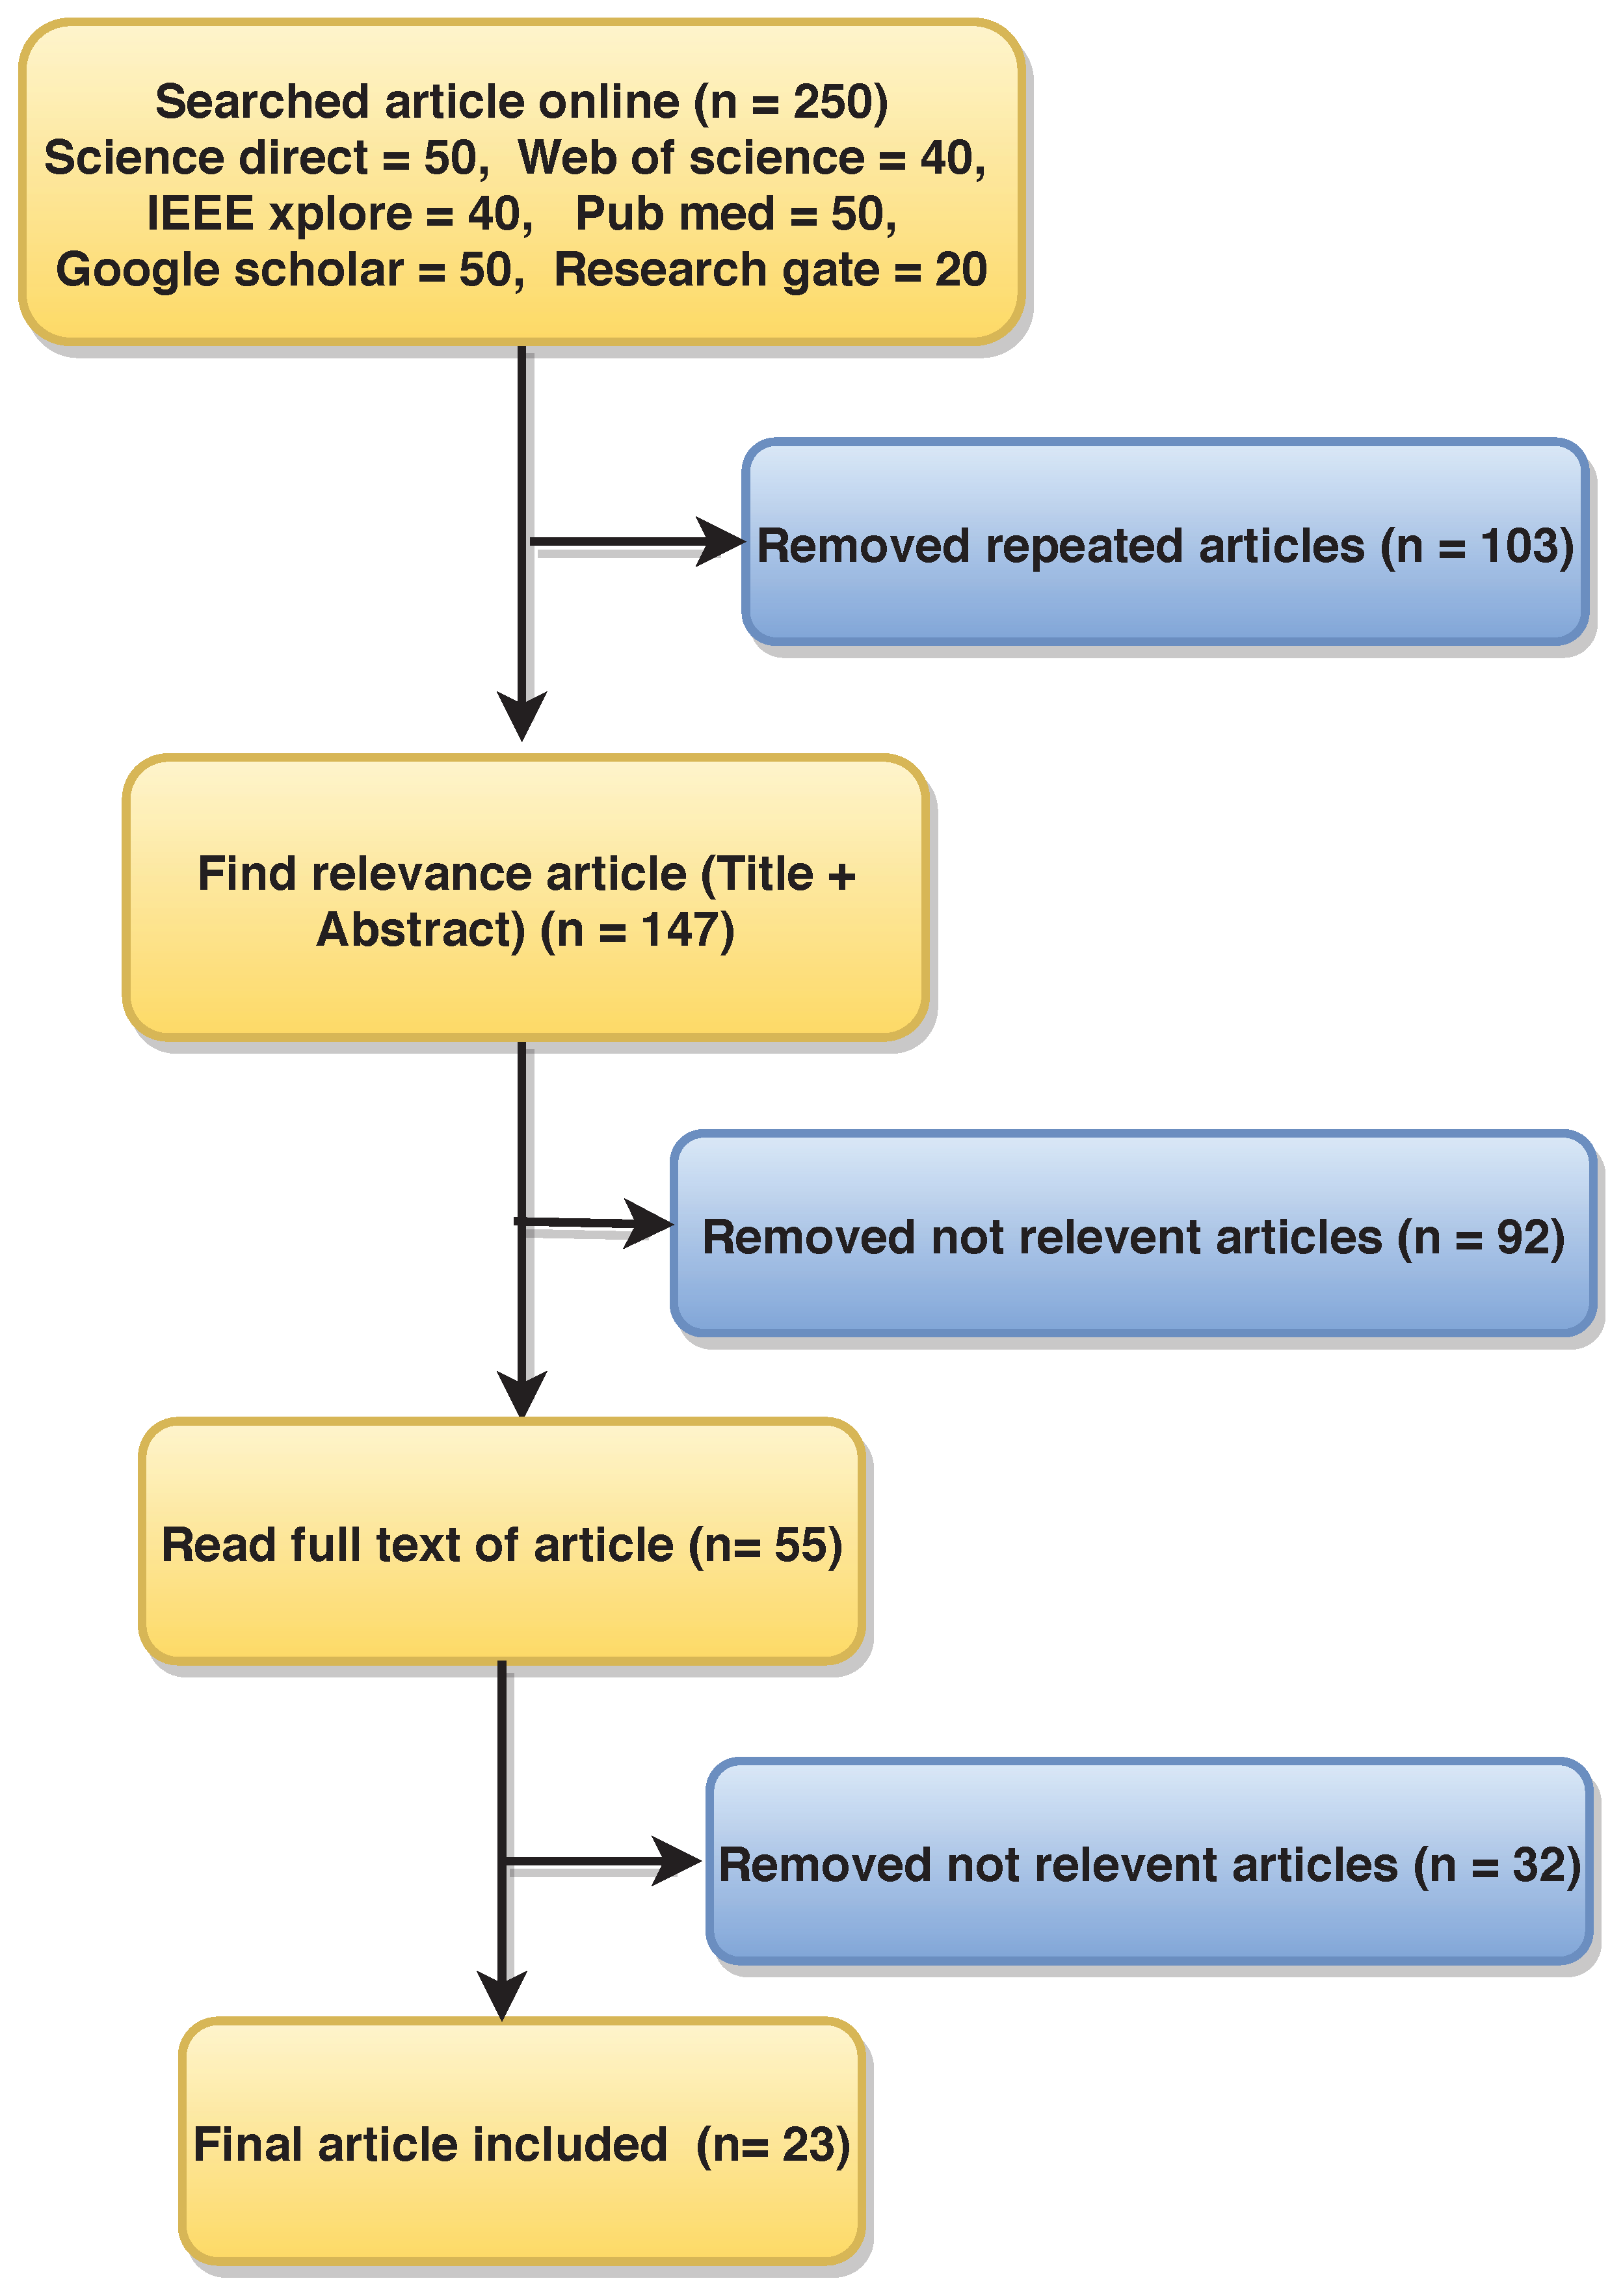
This review was carried out based on the PRISMA model for the period between 09 October 2008 and 31 March 2021 [22]. Science Direct, Web of Science, Google Scholar, PubMed, IEEE Explorer, and ResearchGate databases were systematically searched using the following keywords: (“hypertension”, “ECG and hypertension”, “HRV or hypertension”), “photoplethysmography (PPG) and hypertension”, “photoplethysmography (PPG) and ballistocardiogram (BCG)”, “unsupervised machine learning and hypertension”, “supervised machine learning and hypertension”, “detection of hypertension”, “convolution neural network (CNN)”, “Hypertension and Convolution neural network”, “machine learning and hypertension”, “hypertension and deep learning”, “recurrent neural network (RNN)”, “support vector machine (SVM)”, “automated detection of hypertension”, “detection of hypertension using ECG signal”, “hypertension or HRV signal”, “systolic blood pressure (SBP)”, “diastolic blood pressure (DBP)”, “electrocardiogram (ECG)”, “systolic blood pressure and hypertension”, “diastolic blood pressure and hypertension”, and “physiological signal and hypertension”. We identified 250 research articles containing these keywords on initial screening. Science Direct = 50, Web of Science = 40, Google Scholar = 40, PubMed = 50, IEEE Explorer = 50, and ResearchGate = 20. Among these, 103 duplicate articles were omitted.
We further excluded non-English articles and works that were not explicitly designed for diagnosis of HT.
Finally, 23 articles were selected for this review. Figure 2 shows the flow diagram of article selection, where n is the number of articles.

3. Databases

The ECG, HRV, BCG, and PPG databases are used to develop an automated HT systems and are summarized in Table 2, Table 3 and Table 4. The relative percentages of the different signals used are: ECG = 30.43%, PPG = 17.39%, BCG = 8.69%, and HRV = 43.47%. The most common databases are based on HRV and ECG signals.

3.1. ECG Signal Database

The open-source “Smart Health of Accessing the Risk of Events via ECG Signal” database (SHAREE) used by [2,8,23,24,25] comprised of 24-hour ECG recorded using three ECG leads (II,III, and V5) at 128 Hz sampling frequency.

3.2. ECG Derived HRV Signal Databases

HRV signals extracted from SHAREE were used in [13,16,26]. In [27], HRV signal derived from 10-min ECG recordings from 568 subjects were studied.
One group studied 113 HRV signals [28], and later an expanded 185-sample HRV dataset [29], derived from 7-min Lead II ECG recordings sampled at 500 Hz collected at the same center.
HRV signals were obtained from 7- to 9-hour ECG records (sampling frequency 200 Hz) from 24 subjects in [30]. In [18], a Kubios HRV analyzer was used to derive HRV from 5-min Lead II ECG recordings.
Seventy-one HRV signals derived from 300-s ECG recordings were studied in [31].
Ten minute 12-lead ECG signals sampled at 200-Hz in 97 subjects were used to derive the HRV dataset in [32].

3.3. BCG-Derived HRV Signals Database

BCG recordings sampled at 100 Hz were used to derive HRV signals for 18 subjects in [33]. In [21], HRV signals were extracted from 67 normal and 61 HT BCG signals sampled at 100 Hz with 16-bit resolution.

3.4. PPG Signal Database

In two different studies by the same group, 120-second PPG recordings (sampling frequency 125 Hz) from Multiparameter Intelligent Monitoring in Intensive Care Database (MIMIC) were used [34,35]. In [20], the same authors studied 124 180-second PPG signal recordings ( sampling frequency 1kHz) collected at the same hospital. In [15], HRV signals were extracted from 43 PPG recordings sampled at 64 Hz with 8-bit resolution. Twenty PPG signals encompassing 1536 hours of data in normal and HT subjects were used to derive HRV in [36].

4. Pre-Processing of ECG Signals

4.1. Normalization

Rajput et al. [8,23] used Z-score normalization method for amplitude scaling of ECG signal. The Z-score is the difference between the mean and actual ECG signal divided by the standard deviation of the ECG signal. Similarly, Liang et al. [20,34,35] and Liu et al. [21] used Z-score score normalization to normalize the amplitudes of PPG and BCG signals, respectively.

4.2. Segmentation

Segmentation is used to convert long-duration (e.g., 24-h) signals into short-duration ones requiring shorter computation time for downstream analysis. Soh et al. [2] also segmented the ECG signals of 139 HT subjects into 69,500 segments with, each sample size of 2000 samples.
In [8,23,26] 24-hour ECG signals from (SHAREE) were segmented into 5-and 2-min segments, respectively, for analysis.
In [13], 8-hour ECG signals from SHAREE were segmented into 4, 2, and 1-h as well as 30, 20, 10, and 5-minutes segments for analysis. The performance of 20 and 5-min ECG signals performed better than long-duration ECG signals. Melillo et al. [16] segmented 10-h ECG signals into 5min segments.

4.3. Signal Filtering

Low and high-frequency noise signals, generated during the recording of ECG signal, may affect the interpretation [39]. ECG signal noise can be induced by electrode contact noise, electromyogram, channel noise, baseline wander, and power line interference [39]. It is important to remove noise from the ECG signal to obtain higher classification performance for which various methods are available. Ni et al. [30] used Savitzky-Golay filtering to remove noise from the digitized ECG signal, while Soh et al. [2] used discrete wavelet transform (DWT). For the removal of noise from PPG signals, Liang et al. [20,34,35] applied Chebyshev II band-pass filter with a frequency range of 0.5–10 Hz.

4.4. Re-Sampling

Poddar et al. [28] employed BIOPAC 4.0 software to extract the RR tachographs from ECG signals. The tachographs contained samples that were unevenly placed due to beat-to-beat variation of RR intervals. Re-sampling at a frequency of 4 Hz was performed to preserve the uniformity across the entire length of tachograph data.

4.5. Discrete Wavelet Transform (DWT)

Liu et al. [21] applied DWT to decompose the BCG signal into multiple time-frequency resolutions, through which the details of the signal could be clearly described in time and frequency domains jointly [9,10,11,40,41,42]. DWT decomposes the BCG signal into detailed and approximate components, via iterative low and high-pass filtering [43,44,45,46,47].

4.6. Continuous Wavelet Transform (CWT) Used for PPG Signal Transformation

The PPG signals are converted into two dimensional images called scalograms and fed as input to the convolutional neural network (CNN) for automated detection of HT PPG signals [31,34].

5. Features Extracted in the Review Studies

5.1. HRV Features

5.1.1. HRV Time-Domain Parameters

HRV parameters are extracted from RR intervals and can be categorized into, short-term variation (STV) and long-term variation (LTV) in the time domain [14]. LTV exhibits slower, and STV faster fluctuation. RR intervals have the following intrinsic features: intervals between normal heart beats of ECG signal (NN); standard error of NN intervals (SENN); standard deviation of differences between adjacent NN intervals (SDSD); root mean square of successive differences between NN intervals (RMSSD); the number of successive NN intervals that differs from each other by >50 ms of the whole recording (NN50); and the percentage of successive NN intervals that differs by >50 ms of the whole recording (pNN50%) [14].

5.1.2. HRV Frequency-Domain Parameters

Fast Fourier transform (FFT) decomposes the RR intervals into their frequency constituents, which can be classified as very low frequency (VLF), low frequency (LF), and high frequency (HF). Total power (TP) is a short-term estimate of total power of power spectral density in the range of frequencies between 0 and 0.4 Hz. However, TP mainly reflects level of the autonomic nervous activities (both parasympathetic (PNS) and sympathetic (SNS)) and humoral (hormonal) effects and circadian rhythm as well as ANS’s activity. Generally decrease in TP is observed in individual under chronic stress or with disease [14,48]. HF (0.15 to 0.4 Hz) and LF (0.04 and 0.15 Hz) reflect the modulatory effects of parasympathetic and sympathetic activity, respectively, on the heart rate. Accordingly, the ratio of LF to HF represents the sympathovagal balance. VLF( 0 to 0.04 Hz ) reflects the vascular response associated with mechanisms caused by negative feelings [48,49].

5.2. Features of BCG Fluctuation

Cardiac mechanical operations modulate fluctuation pattern of the BCG signal, and cardiovascular disease such as HT can be identified by evaluating the pattern of fluctuation pattern [21]. As the BCG signal commonly includes noise from body motion and the signal acquisition system itself, it is important that BCG fluctuation features acquired be noise-sensitive. Four noise-insensitive features are used: zero-crossing rate (ZCR); average cumulative amplitude change (ACAC); average number of extreme points (ANEP); and average signal turns count(ASTC) [21].

5.3. Non-Linear Features Extracted from ECG and HRV Signal

The non-linear features that can be computed for ECG and HRV signals include: sample entropy (SeEn) [2,23], approximate entropy (ApEn) [2,27,28,30], renyi entropy (ReEn) [2,13], wavelet entropy (WlEn)[2,23], detrended fluctuation analysis (DFA) [13,16,21,33], correlation dimension (CD) [16,38], Lempel-Ziv complexity (LZ) [27], recurrence plot (RC) [16], Poincare plot (PP) [16,28], empirical mode decomposition (EMD) [24], signal fractal dimension (SLFD), Log energy (LOGE) [8], higher-order spectra (HOS), HOS cumulants, fuzzy entropy, Kolmogorov-Sinai entropy, modified multiscale entropy, Shannon entropy, permutation entropy, and Tsallis entropy [2].

5.4. Feature Selection, Reduction, and Ranking

Feature selection helps to select most relevant features which can be used to distinguish between normal versus HT classes. Various feature reduction techniques employed include principal component analysis (PCA) [13,31], marginal Fisher analysis (MFA), linear discriminant analysis (LDA), temporal pyramid pooling method (TPPM) [13], and independent component analysis.
The features are organized and presented to the given classifier based on their ranking one-by-one until the highest performance is obtained.
Student’s t-test [2,8,13,16,21], Bhattacharya, Wilcoxon, and receiver operating characteristics (ROC) are the mostly used feature-ranking techniques. Multi-factor analysis of variance (MANOVA) and the chi-square test [16] are utilized as the feature selection methods for choosing the highly discriminant features to the classifier.

6. Computer-Aided Diagnosis Methods

In Figure 3, an outline of methods based on artificial intelligence (AI) is presented. About 82.6%, 13.04% and 4.34% of authors used ML the statistical software SPSS, and other traditional methods, respectively to detect HT ECG signals automatically. ML-based techniques are robust and accurate.

Hypertension Diagnosis Index (HDI) [8]

Rajput et al. [8] developed an HDI using selected features to accurately discriminate low-risk HT (LRHT) and high-risk HT (HRHT) with a single numeric value.
The orthogonal wavelet filter bank is used for five-level wavelet decomposition. Signal fractal dimension (SLFD) and log energy (LOGE) features were then computed from the decomposed coefficients. All 12 sub-bands of ECG signal were ranked by the Student’s t-test ranking method. High-ranking feature sub-bands (SUB) were used to develop HDI (Equation (1)). In Equation (1), various composite features were experimentally merged to achieve the optimal difference between the two groups.
H D I = 6 ( 3 × L O G E S U B 2 + 4 × L O G E S U B 3 + S L F D S U B 6 ) 15 × ( S L F D S U B 2 + S L F D S U B 3 + S L F D S U B 4 ) ,
where L O G E S U B 2 , L O G E S U B 3 denoting sub-bands (second and third) of log energy, while S L F D S U B 2 , S L F D S U B 3 , S L F D S U B 4 , S L F D S U B 6 are sub-bands (second, third, fourth, and sixth) of signal fractal dimension feature.

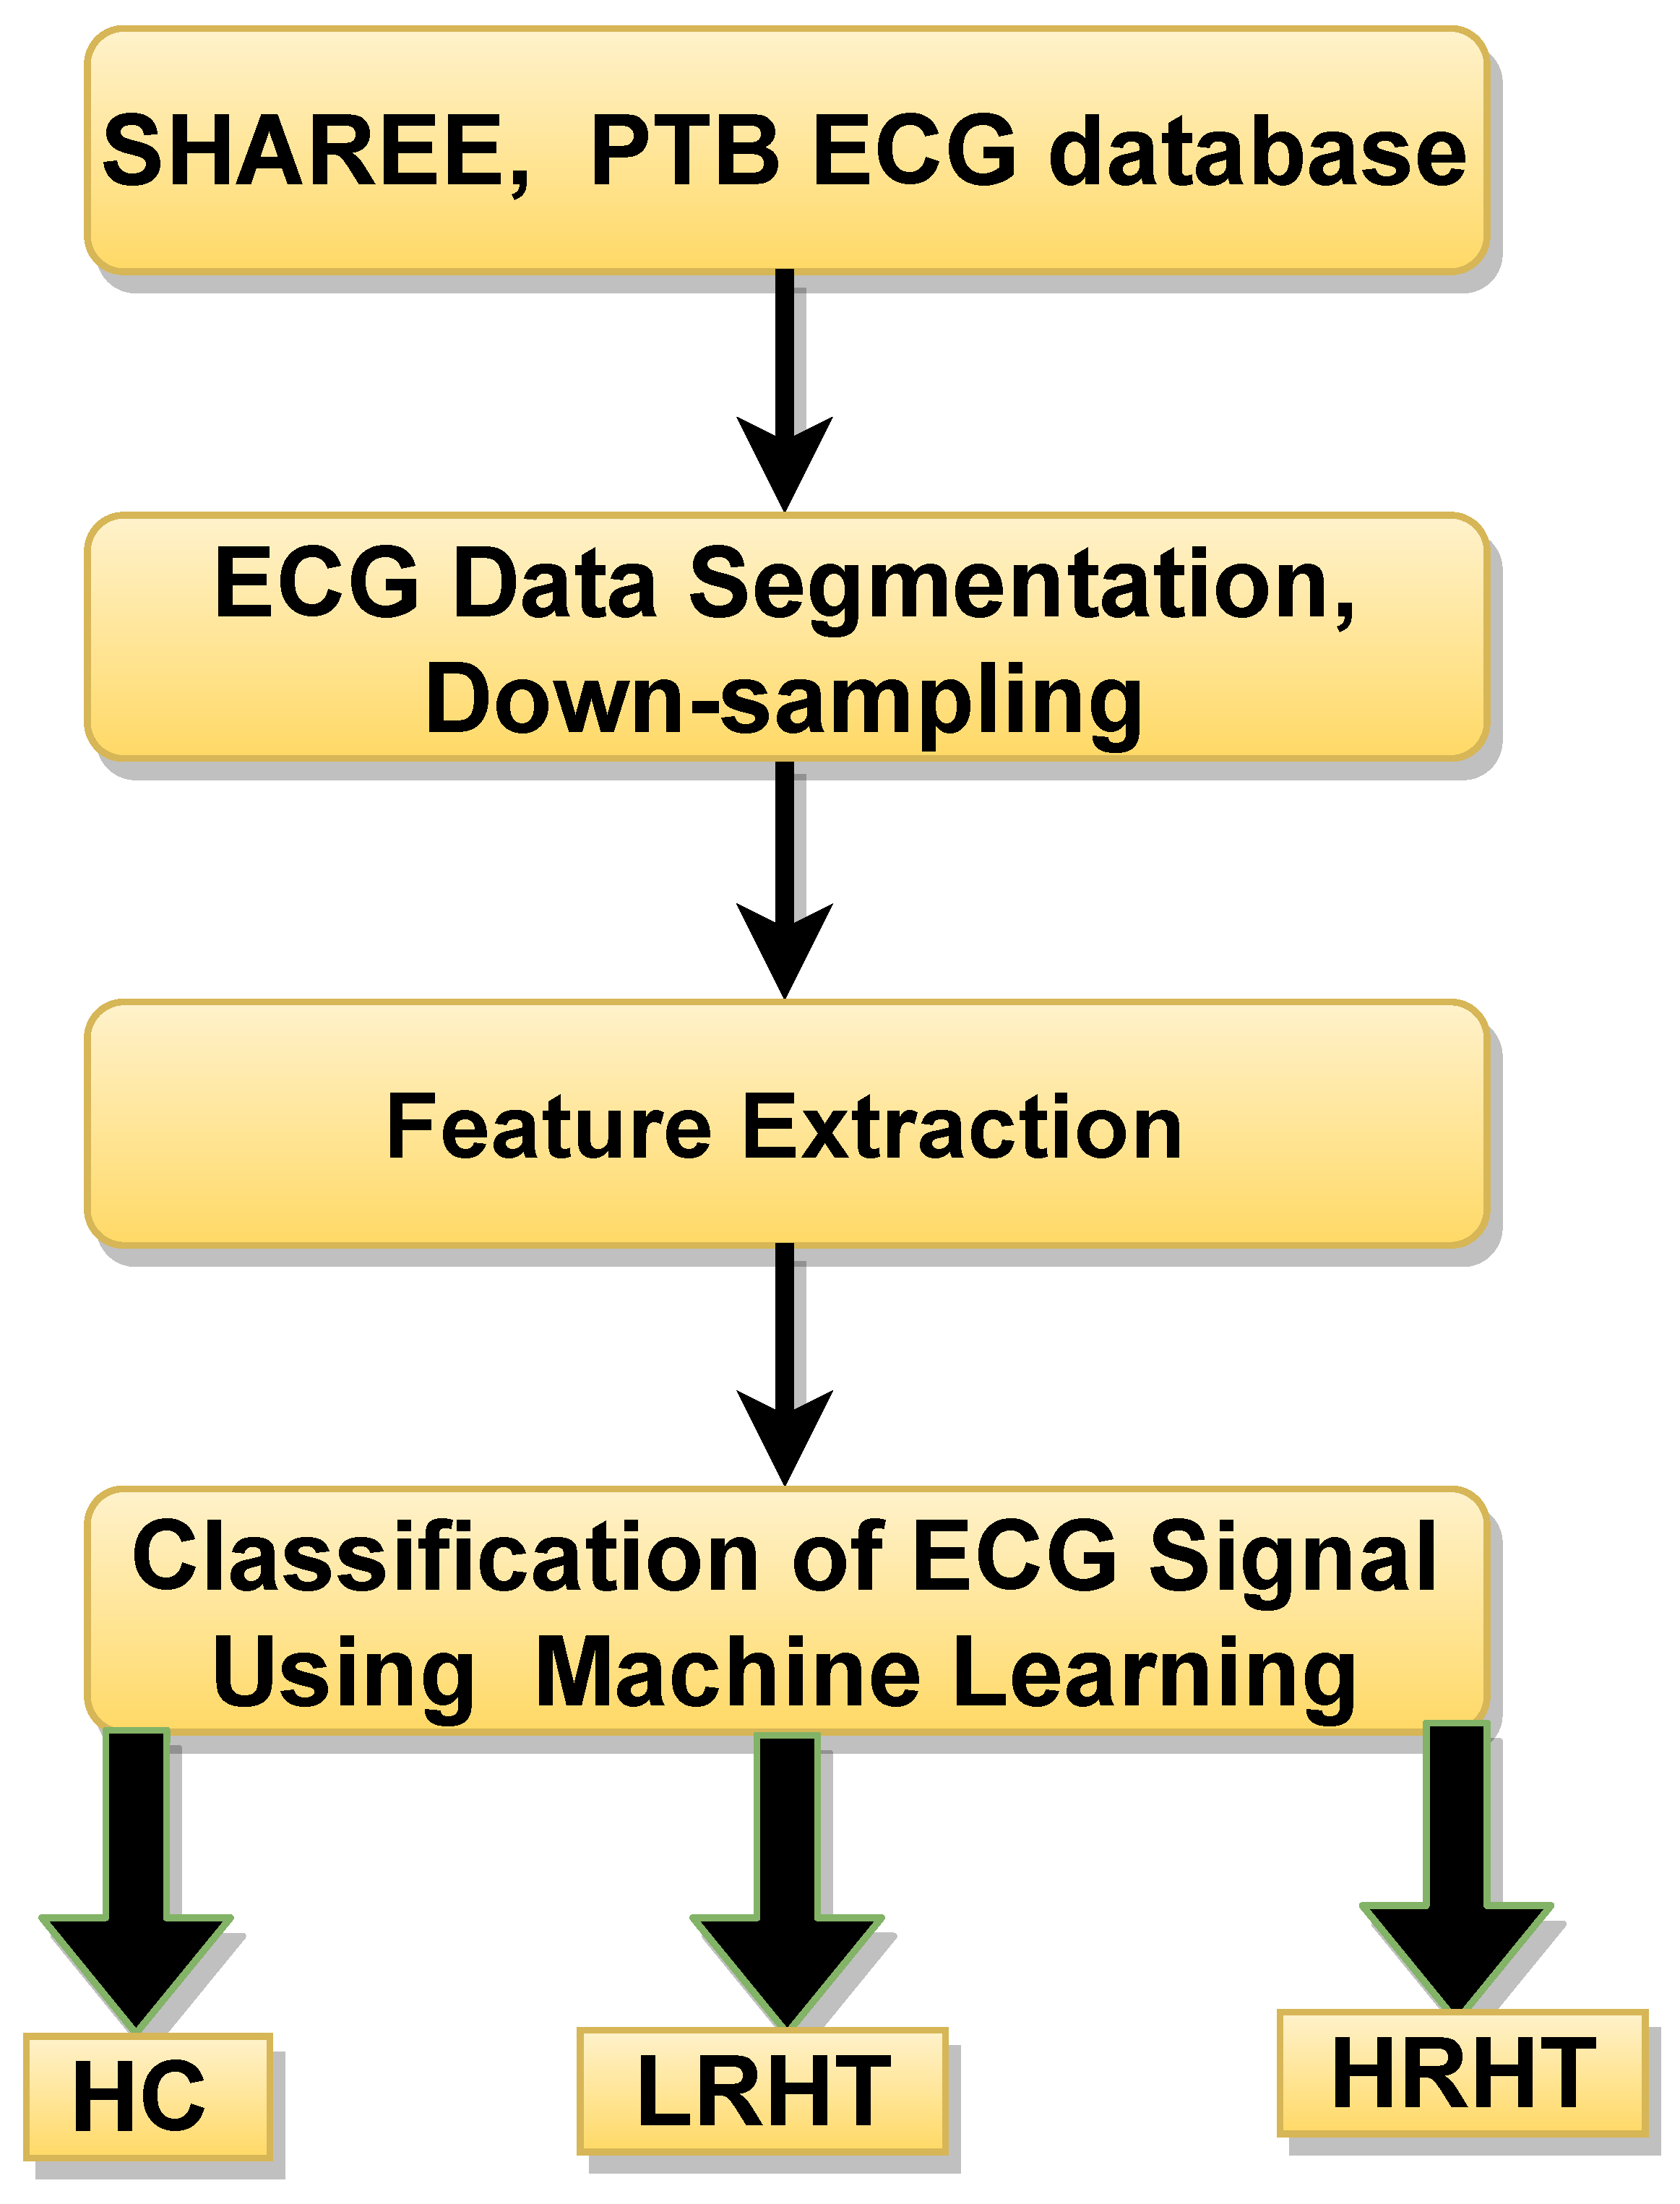
7. Proposed Work after Understanding Review Studies

An outline of the proposed work is shown in Figure 4. In this work, we used the public database used by authors in [23,24]. A total of 3694 ECG segments were obtained from (SHAREE, and PTB data base) [23,24]. The LRHT have 3172 (SHAREE database), HRHT (SHAREE database) have 442, and HC class have 80 (PTB database) ECG signals segmented in to 2 minute duration. A single ECG-lead V5 have been chosen from both databases. To match the sampling frequency of SHAREE and PTB database, we have down-sampled the data obtained from PTB database. The details of the extracted features are discussed below:

7.1. Features Extracted to the Proposed Work

7.1.1. Sample Entropy (SeEn)

It is a measure of uncertainty in the non-linear signal [2,23]. SeEn can be computed as;
S e E n = log ( a b ) ,
where a is the l + 1 length of vector, and b is the length l of vector with l = 2 [23].

7.1.2. Approximate Entropy (ApEn)

It is an approximation technique which is useful to measure homogeneity and complexities in time-series data containing noise because of its stability to distinguish closely linked stochastic processes. It is effective in short data intervals to differentiate between chaotic and noisy time-series data [2,27,28,30]. For finite length N, ApEn is computed as:
A p E n ( m , r ) = Φ ( r ) m Φ ( r ) m + 1 ,
Φ ( r ) is a vector, while m = 2. The tolerance value r = 0.20 lies between 0.15 to 0.25 [28].

7.1.3. Renyi Entropy (ReEn)

It is used to measure the spectral intricacy of time-series signals and generalized as the Shannon entropy [2,13]. ReEn is computed as :
R e E n ( K ) = α 1 α ( log p j α ) ,
where K = discrete random variable, α is order ( α 2 ) of ReEn, p j = denoted the total spectral-power [24,50].

7.1.4. Wavelet Entropy (WlEn)

It is used to calculate the degree of disorder in an ECG signals [2,23,40,51].
W l E n = i < 0 ( P i × ln ( P i ) ) ,
where i is a resolution level and P i is probabilities with respect to i [52].

7.1.5. Log Energy (LOGE)

It is the logarithm of an energy of the ECG signal. The mathematical expression of LOGE is given below [53].
L O G E r = l o g ( n m r ( n ) 2 ) ,
where L O G E r is define the log energy of rth time-series, and the amplitude of nth sample of rth time-series is m r ( n ) .

7.1.6. Signal Fractal Dimension (SLFD)

It is used to measure similarity and complexity in physiological signals. It is the ratio of fractal pattern with respect to which it is measured [53]. It is given by:
S L F D = l o g ( A l ) l o g ( 1 l ) .

7.1.7. Hurst Exponent (HE)

It is a measure of repeat-ability [54]. The generalize equation of HE is as follows:
H E = L o g ( A B ) L o g ( Y ) .
Here, Y represents the length of time-series data, while A B denoted the re-scaled range value. The difference of maximum and minimum value of mean is considered as A. However, B represents the standard deviation.

7.1.8. Largest Lyapunov Exponent (LLE)

LLE is used to identity chaos in the physiological signal [55].

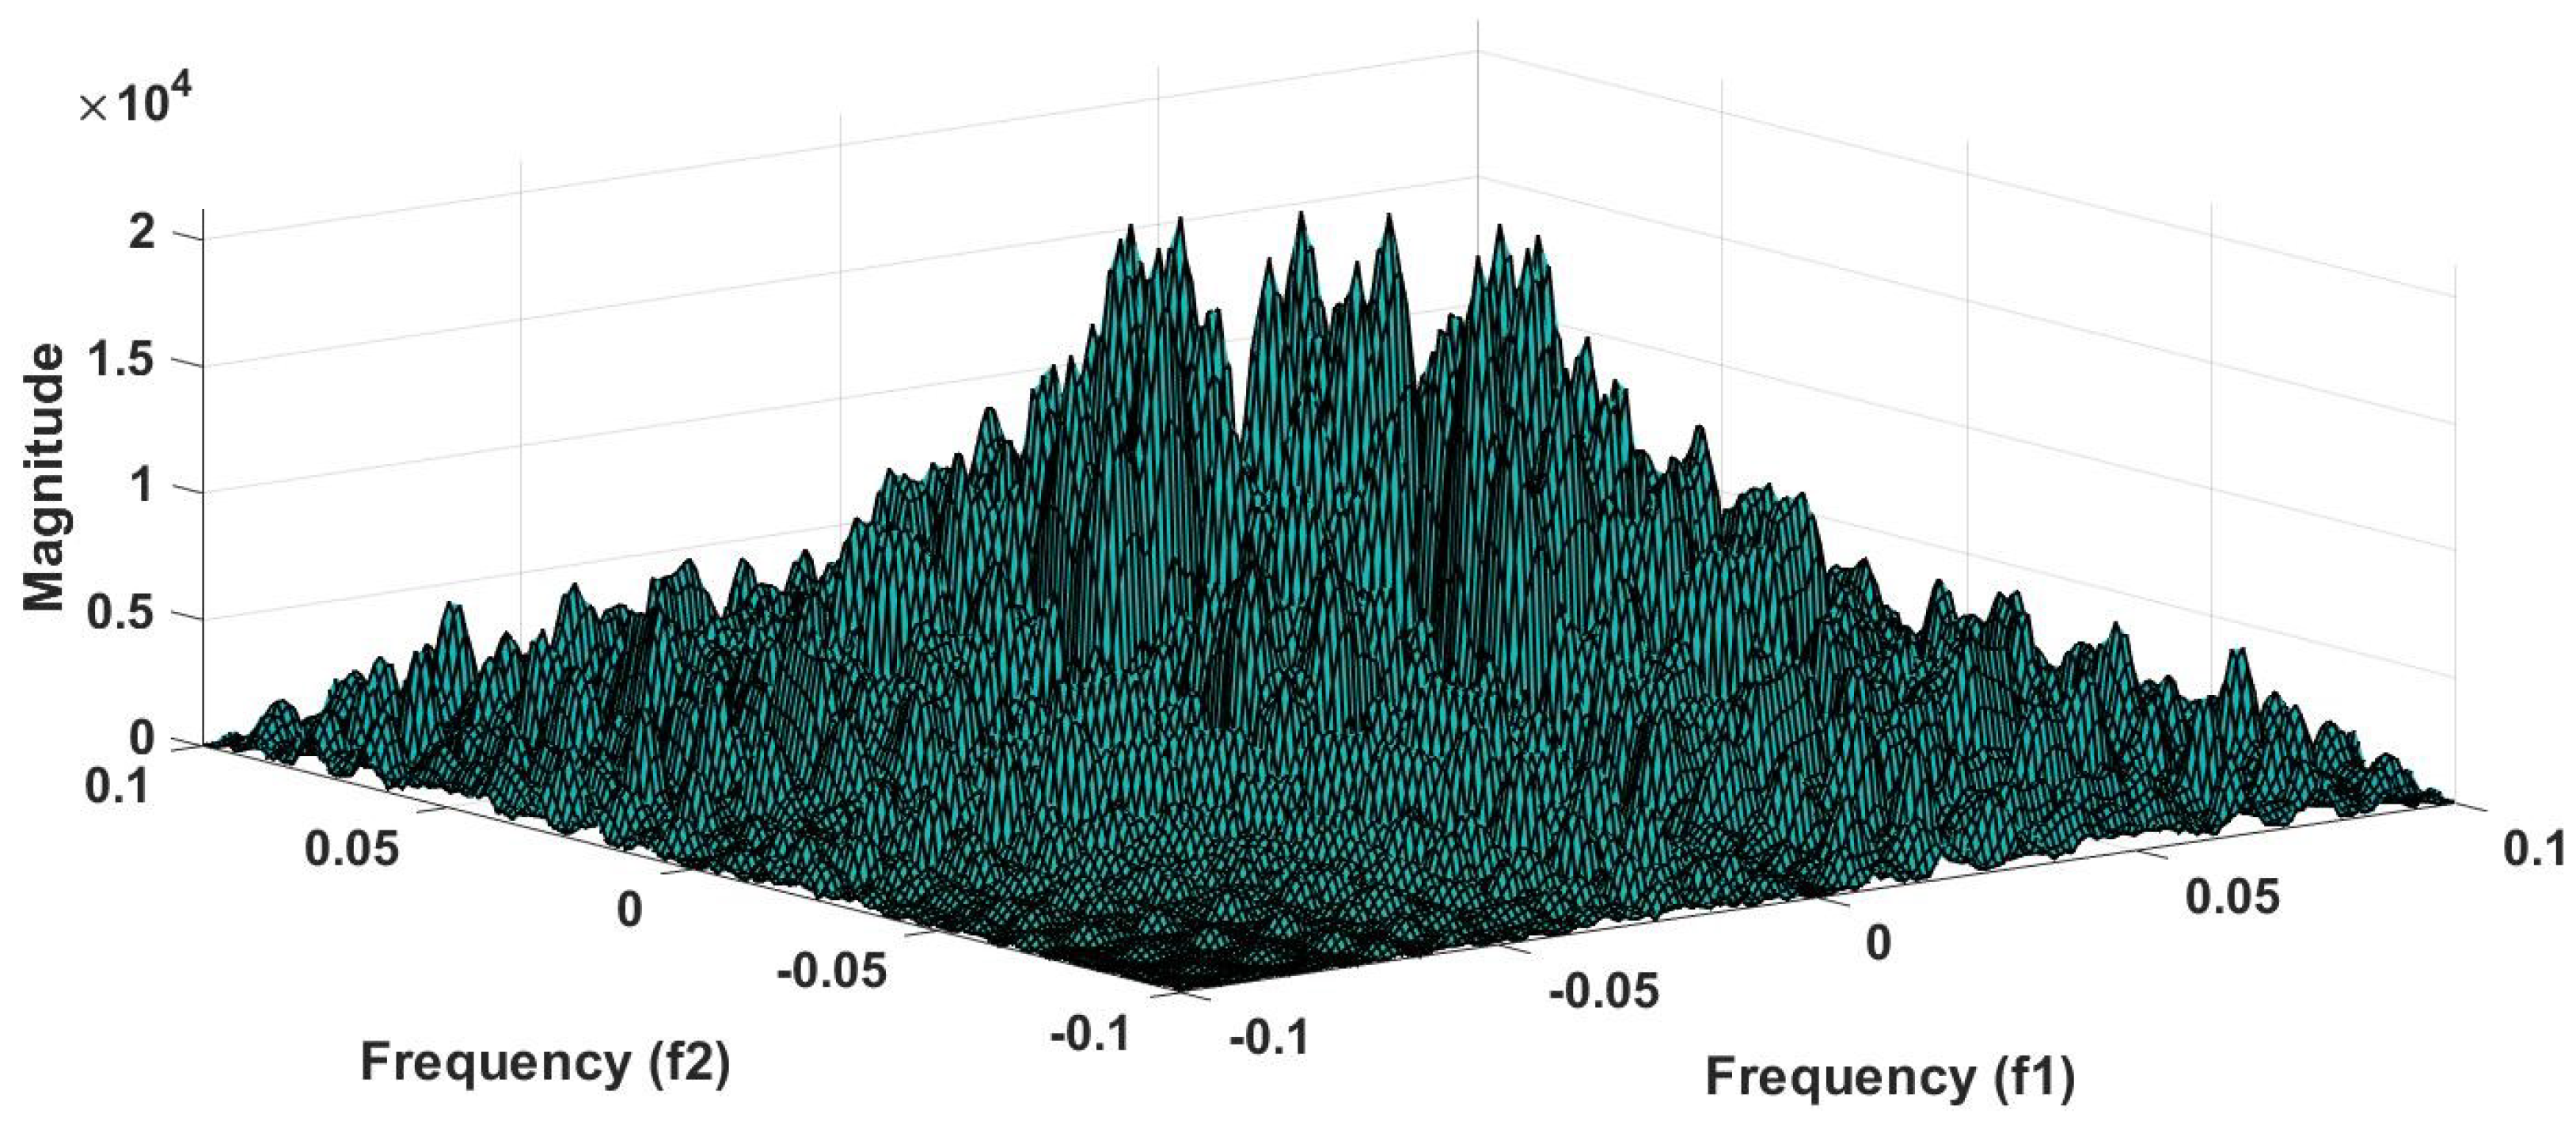
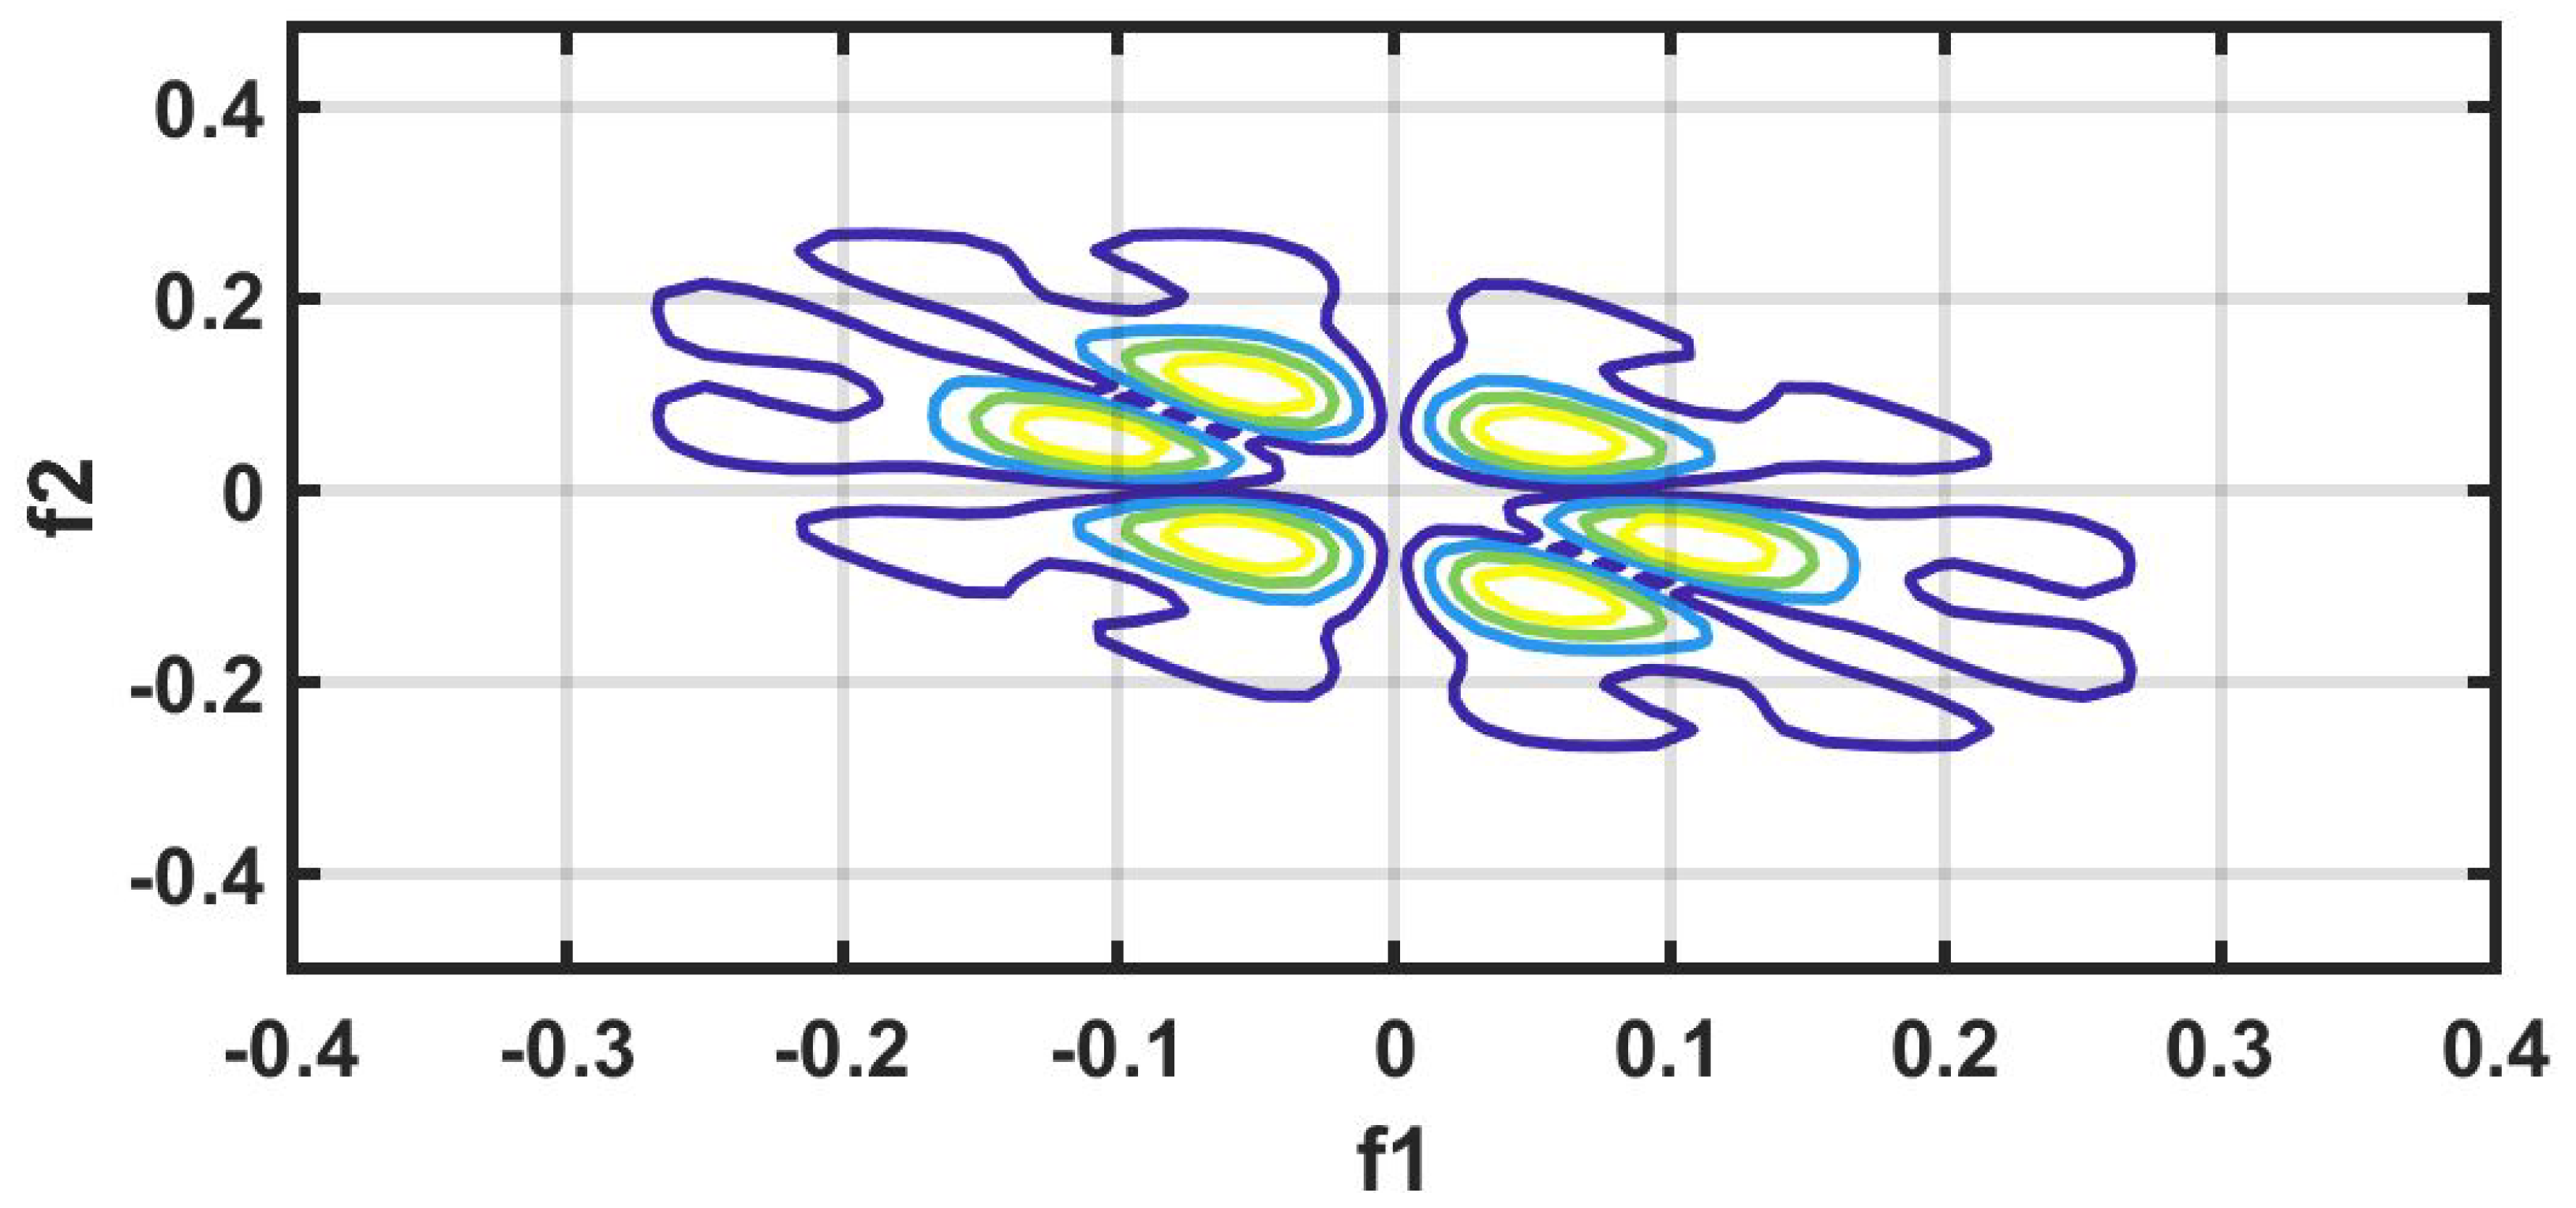
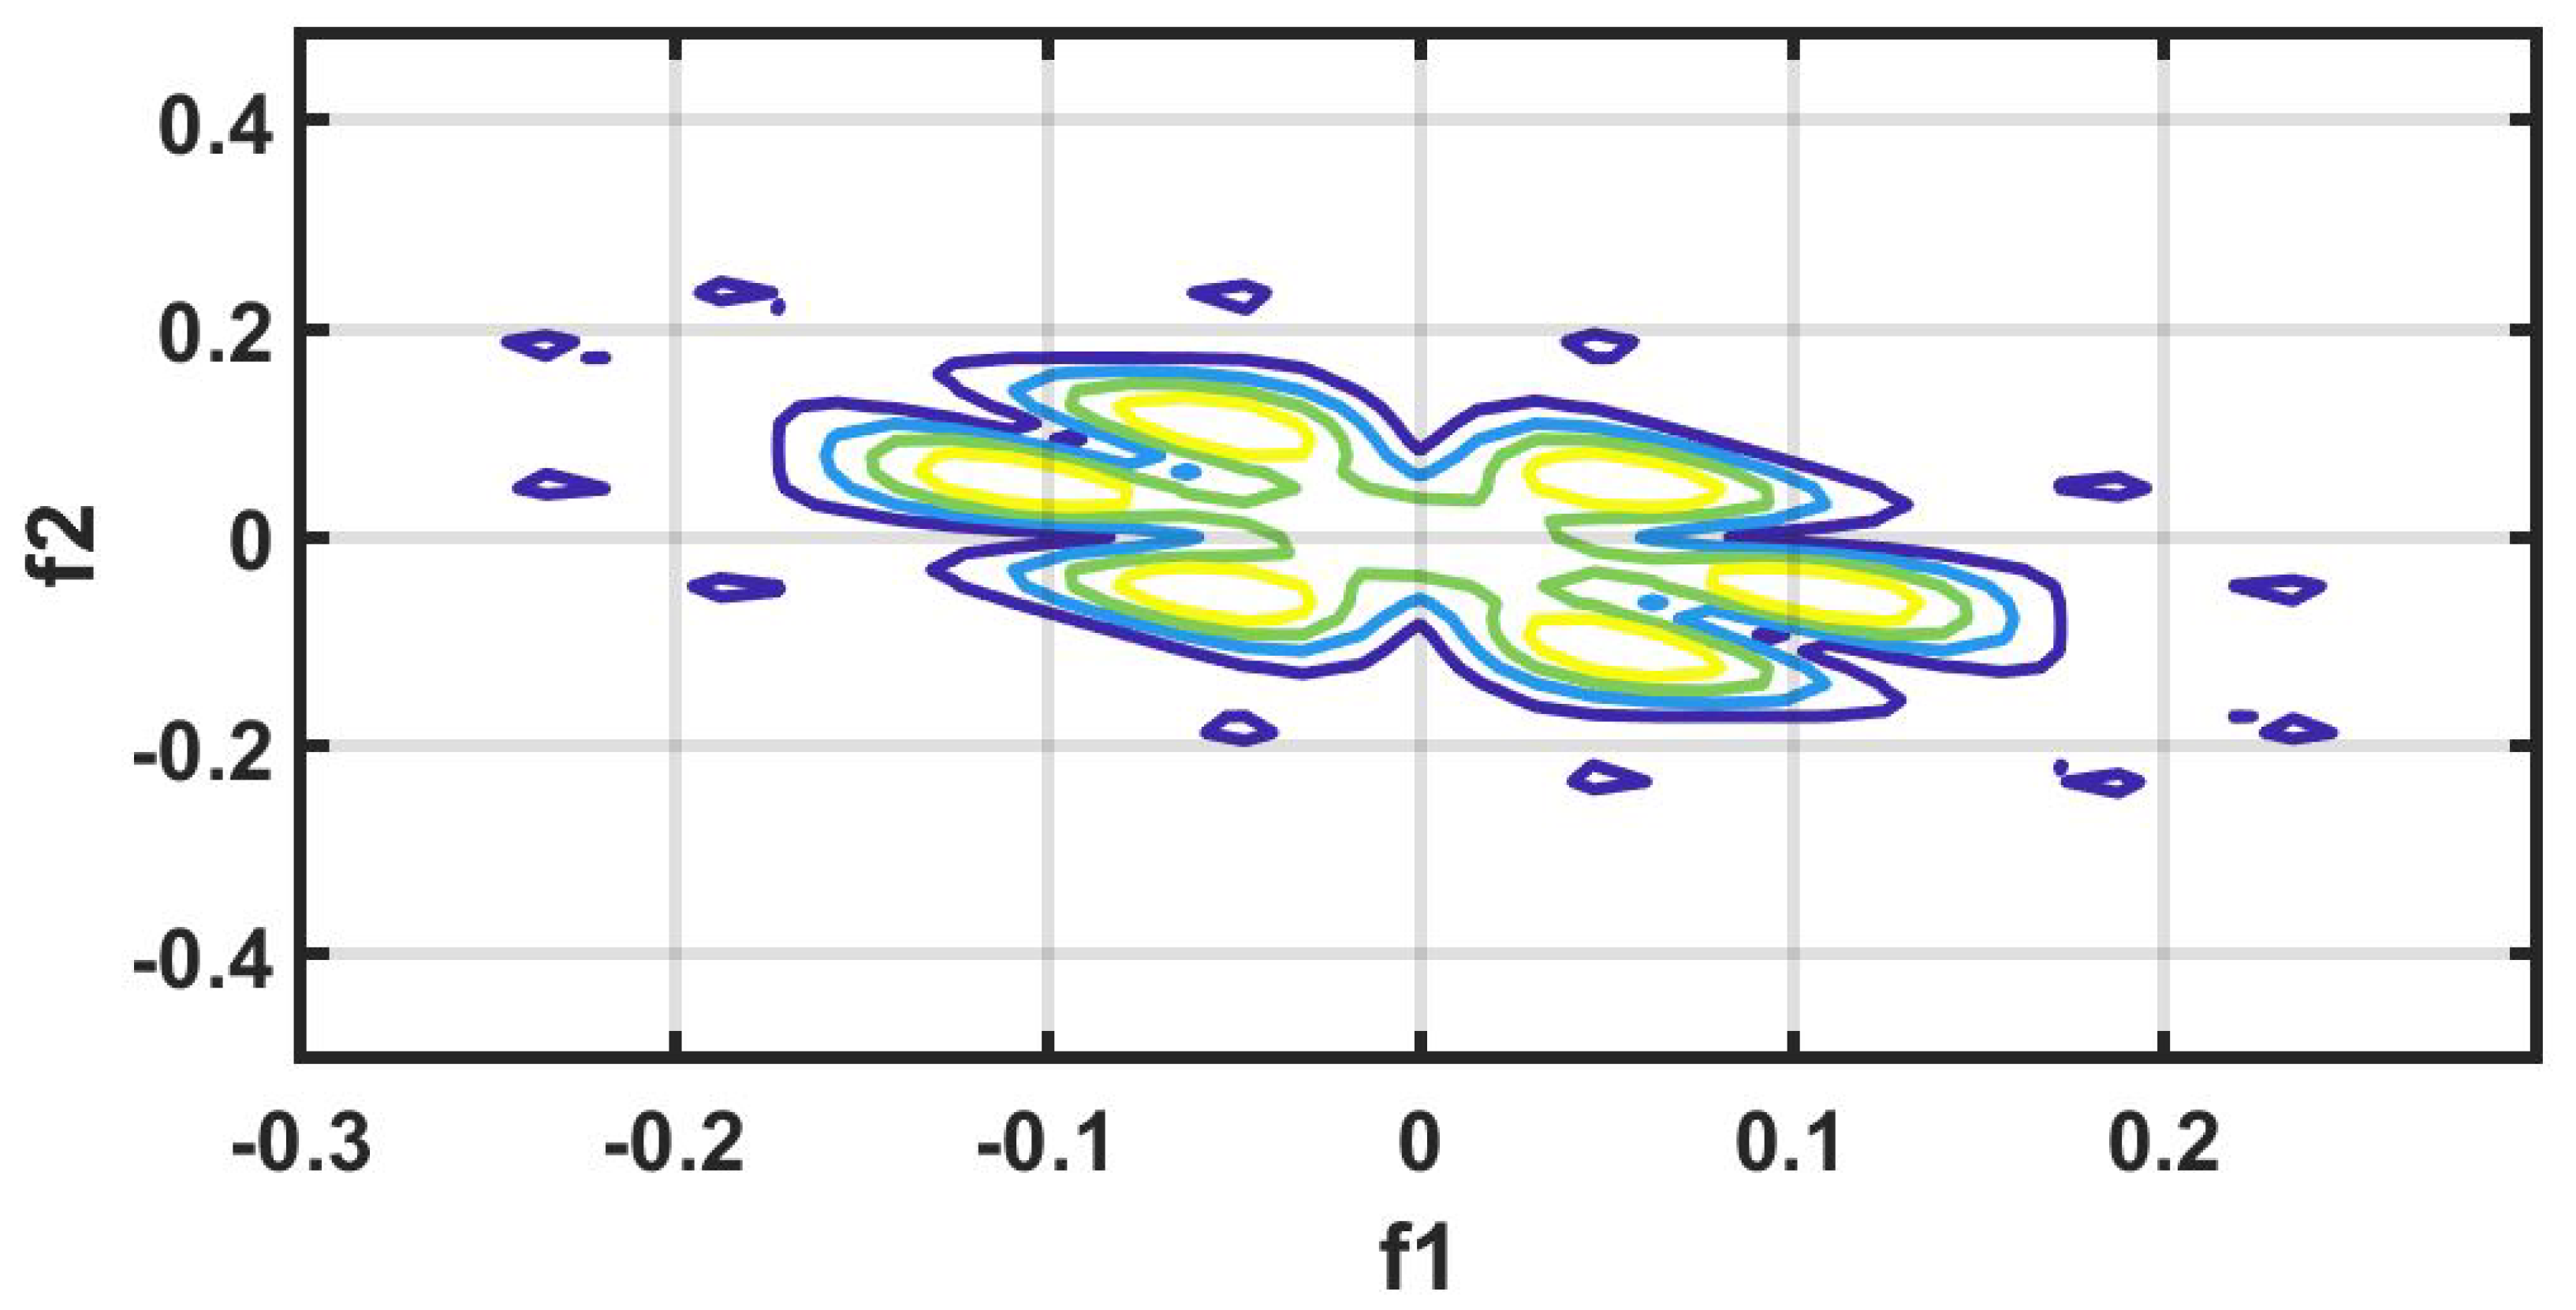
7.1.9. HOS Bispectrum (HOSB)

A third-order statistics computation is know as an HOS bispectrum [56]. The Fourier transform of third order cumulant is the bispectrum S 3 ( ω 1 , ω 2 ) of a signal [57]. In a two-dimensional frequency plot, the bispectrum shows the cross-correlation between frequency components. Hence, the HOSB is define as:
S 3 ( ω 1 , ω 2 ) = X ( ω 1 ) X ( ω 2 ) X * ( ω 1 + ω 2 ) .
However, HOSB represents the triple product of its two frequencies. To define principle region or non-redundant region sufficient condition ω 2 0, ω 2 ω 1 , ω 1 + ω 2 π must satisfied [56]. To analyze the bispectrum plots, different parameters namely moments, centroid, and entropies of the distribution may be extracted [56]. These features and parameters are as follows:
(a)
Normalized bispectral entropy (NBE) [56,58]:
N B E 1 = n q n log q n ,
where q n = | B ( f 1 , f 2 ) | Ω | B ( f 1 , f 2 ) | and Ω represents the principle region.
(b)
Normalized bispectral square entropy (NBSE) [58]:
N B S E = n q n log q n ,
where q n = | B ( f 1 , f 2 ) | 2 Ω | B ( f 1 , f 2 ) | 2 . Both entropies are computed for parameters which have values between 0 and 1.
(c)
A weighted center feature of bispectrum (WCOB) is described as [58]:
W C O B 1 m = Ω ( k B ( k , l ) ) Ω B ( k , l )
W C O B 2 m = Ω ( l B ( k , l ) ) Ω B ( k , l ) .
Here, k and l represents the frequency bin index in the principle region of bispectrum plot [58]. Similarly, some moments related features are given below:
(d)
Bispectrum logarithmic amplitude feature [58]:
M 1 = Ω log ( | B ( f 1 , f 2 ) | ) .
(e)
Bispectrum sum of logarithmic amplitude of diagonal elements feature [58]:
M 2 = Ω log ( | B ( f q , f q ) | ) .
(f)
Bispectrum first-order spectral moments of amplitude of diagonal elements feature [58]:
M 3 = q = 1 N k log ( | B ( f q , f q ) | ) .
(g)
Bispectrum mean magnitude feature [58]:
m A m p = 1 L Ω | b ( f 1 , f 2 ) | .
(h)
Bispectrum phase entropy feature [58] :
P h e = n p ( Φ n ) log p ( Φ n ) .
Here, the number of points is represented by L of the principle region, Φ is the phase angle, and Ω refer the space of the region [58].

7.1.10. Higher Order Spectral Cumulant (HOSC)

Obtaining the nonlinear dynamical characteristics of ECG signal using lower-order (first) of statistics is complex [57]. Therefore, higher order statistics, such as second, third and fourth, are widely used to analyze the ECG signal. Hence, HOS cumulant higher order statistics features are used in analysis of non-stationary ECG signals in various applications [57].
Let { r 1 , r 2 , r 3 . . . . , r q } is representing a zero mean random process for q dimensional multivariate. While m 1 r , m 2 r , m 3 r , and m 4 r are the order of moments from first to fourth [57]. As well as k , l represents the lag-parameters. Hence, using the non-linear combinations of the moments, cumulant can be computed.
C 1 r = m 1 r
C 2 r = m 2 r ( k )
C 3 r = m 3 r ( k , l )
C 4 r = m 4 r ( k , l , q ) m 2 r ( k ) m 2 r ( l q ) m 2 r ( q k ) m 2 r ( q ) m 2 r ( k l ) .
Here C 1 r , C 2 r , C 3 r , and C 4 r are the order of cumulants from first to fourth. In this work, we have computed second, third, and fourth order cumulants.

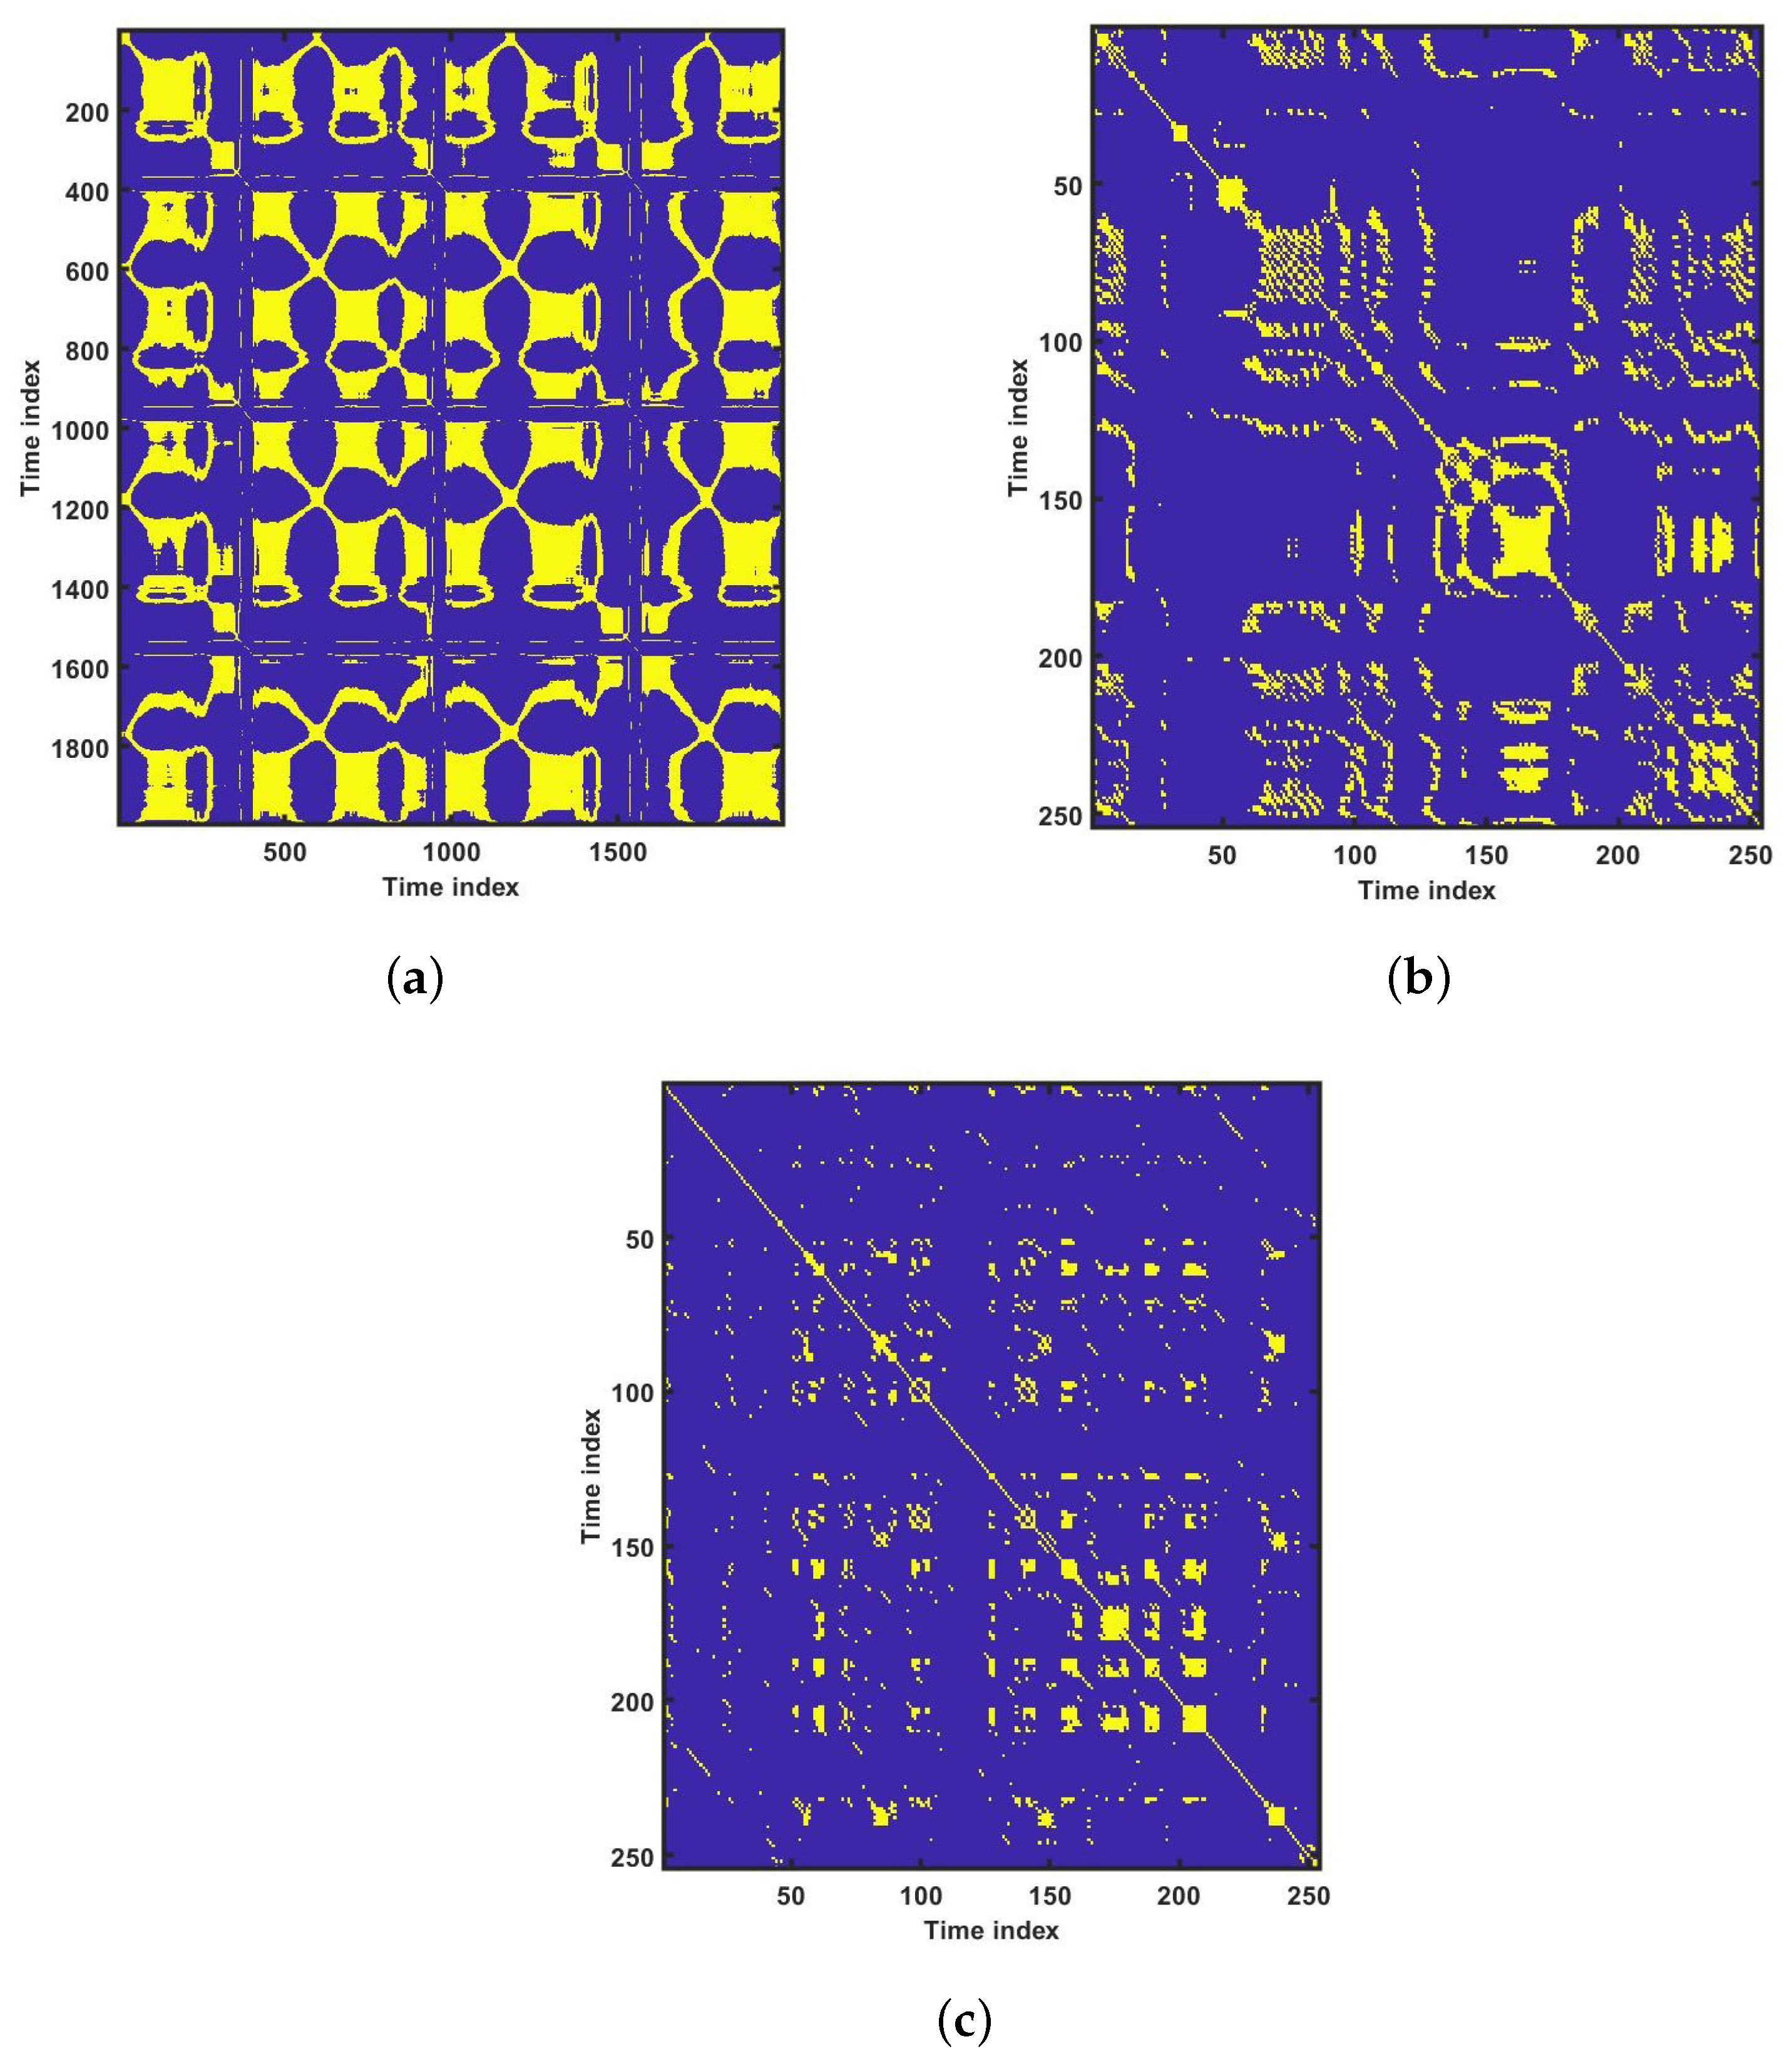
7.1.11. Recurrence Plot (RP)

For the physiological signal in the time domain, RP can find hidden patterns which are not clearly identifiable [57]. Recurrence can be defined as the value of k and l dropped below the threshold value ϵ is known as recurrence. Assuming r k in an L dimensional space be the k t h point. However, a dot is considered at ( k , l ) as the distance between the r k and r l is closer. When k = l , the recurrence plots are symmetric along the diagonal, as r k is close to r l , then r l is close to r k . Hence, a RP is R × R square of an array dots [57]. This may also be presented in time-related space as a R × R matrix. The yellow dot implies there has been a recurrence.

7.1.12. Recurrence Quantification Analysis (RQA)

RQA is better choice for dynamical system used to measure the number and duration of recurrence. It helps to measure and analyze the recurrence plot of non-stationary physiological signal [57]. In the time domain, RQA evaluates the non-stationary and hidden periodicity of signals. The following RQA features are used in this work:
(a) Recurrence rate (RR), (b) Determinism (DET), (c) Entropy (ENT), (d) Laminarity (LMR) [57].

7.2. Results

The proposed work is performed on LRHT, HRHT and HC subjects. A total of 3694 ECG segments were obtained from SHAREE and PTB databases. The LRHT have 3172, HRHT have 442, and HC class have 80 ECG signal segments of 2 min duration.
An experiment is performed on MATLAB 2016b version 9.1.10 (licensed) and work station (personal computer) with Intel i7 processor, 16GB RAM, 1TB HD, and 4 GB graphics card. We have tried several non-linear features to obtain the optimum results. However, higher order spectral cumulant, bispectrum and recurrence quantitative analysis (RQA) yielded optimum results.
In addition to this, the optimum performance were obtained using the combination of HOS bispectrum, cumulant and RQA feature. A total of 9 bispectrum-based features are extracted and shown in Table 5. The detailed of RQA and HOS cumulant features are presented in Table 6 and Table 7 respectively.
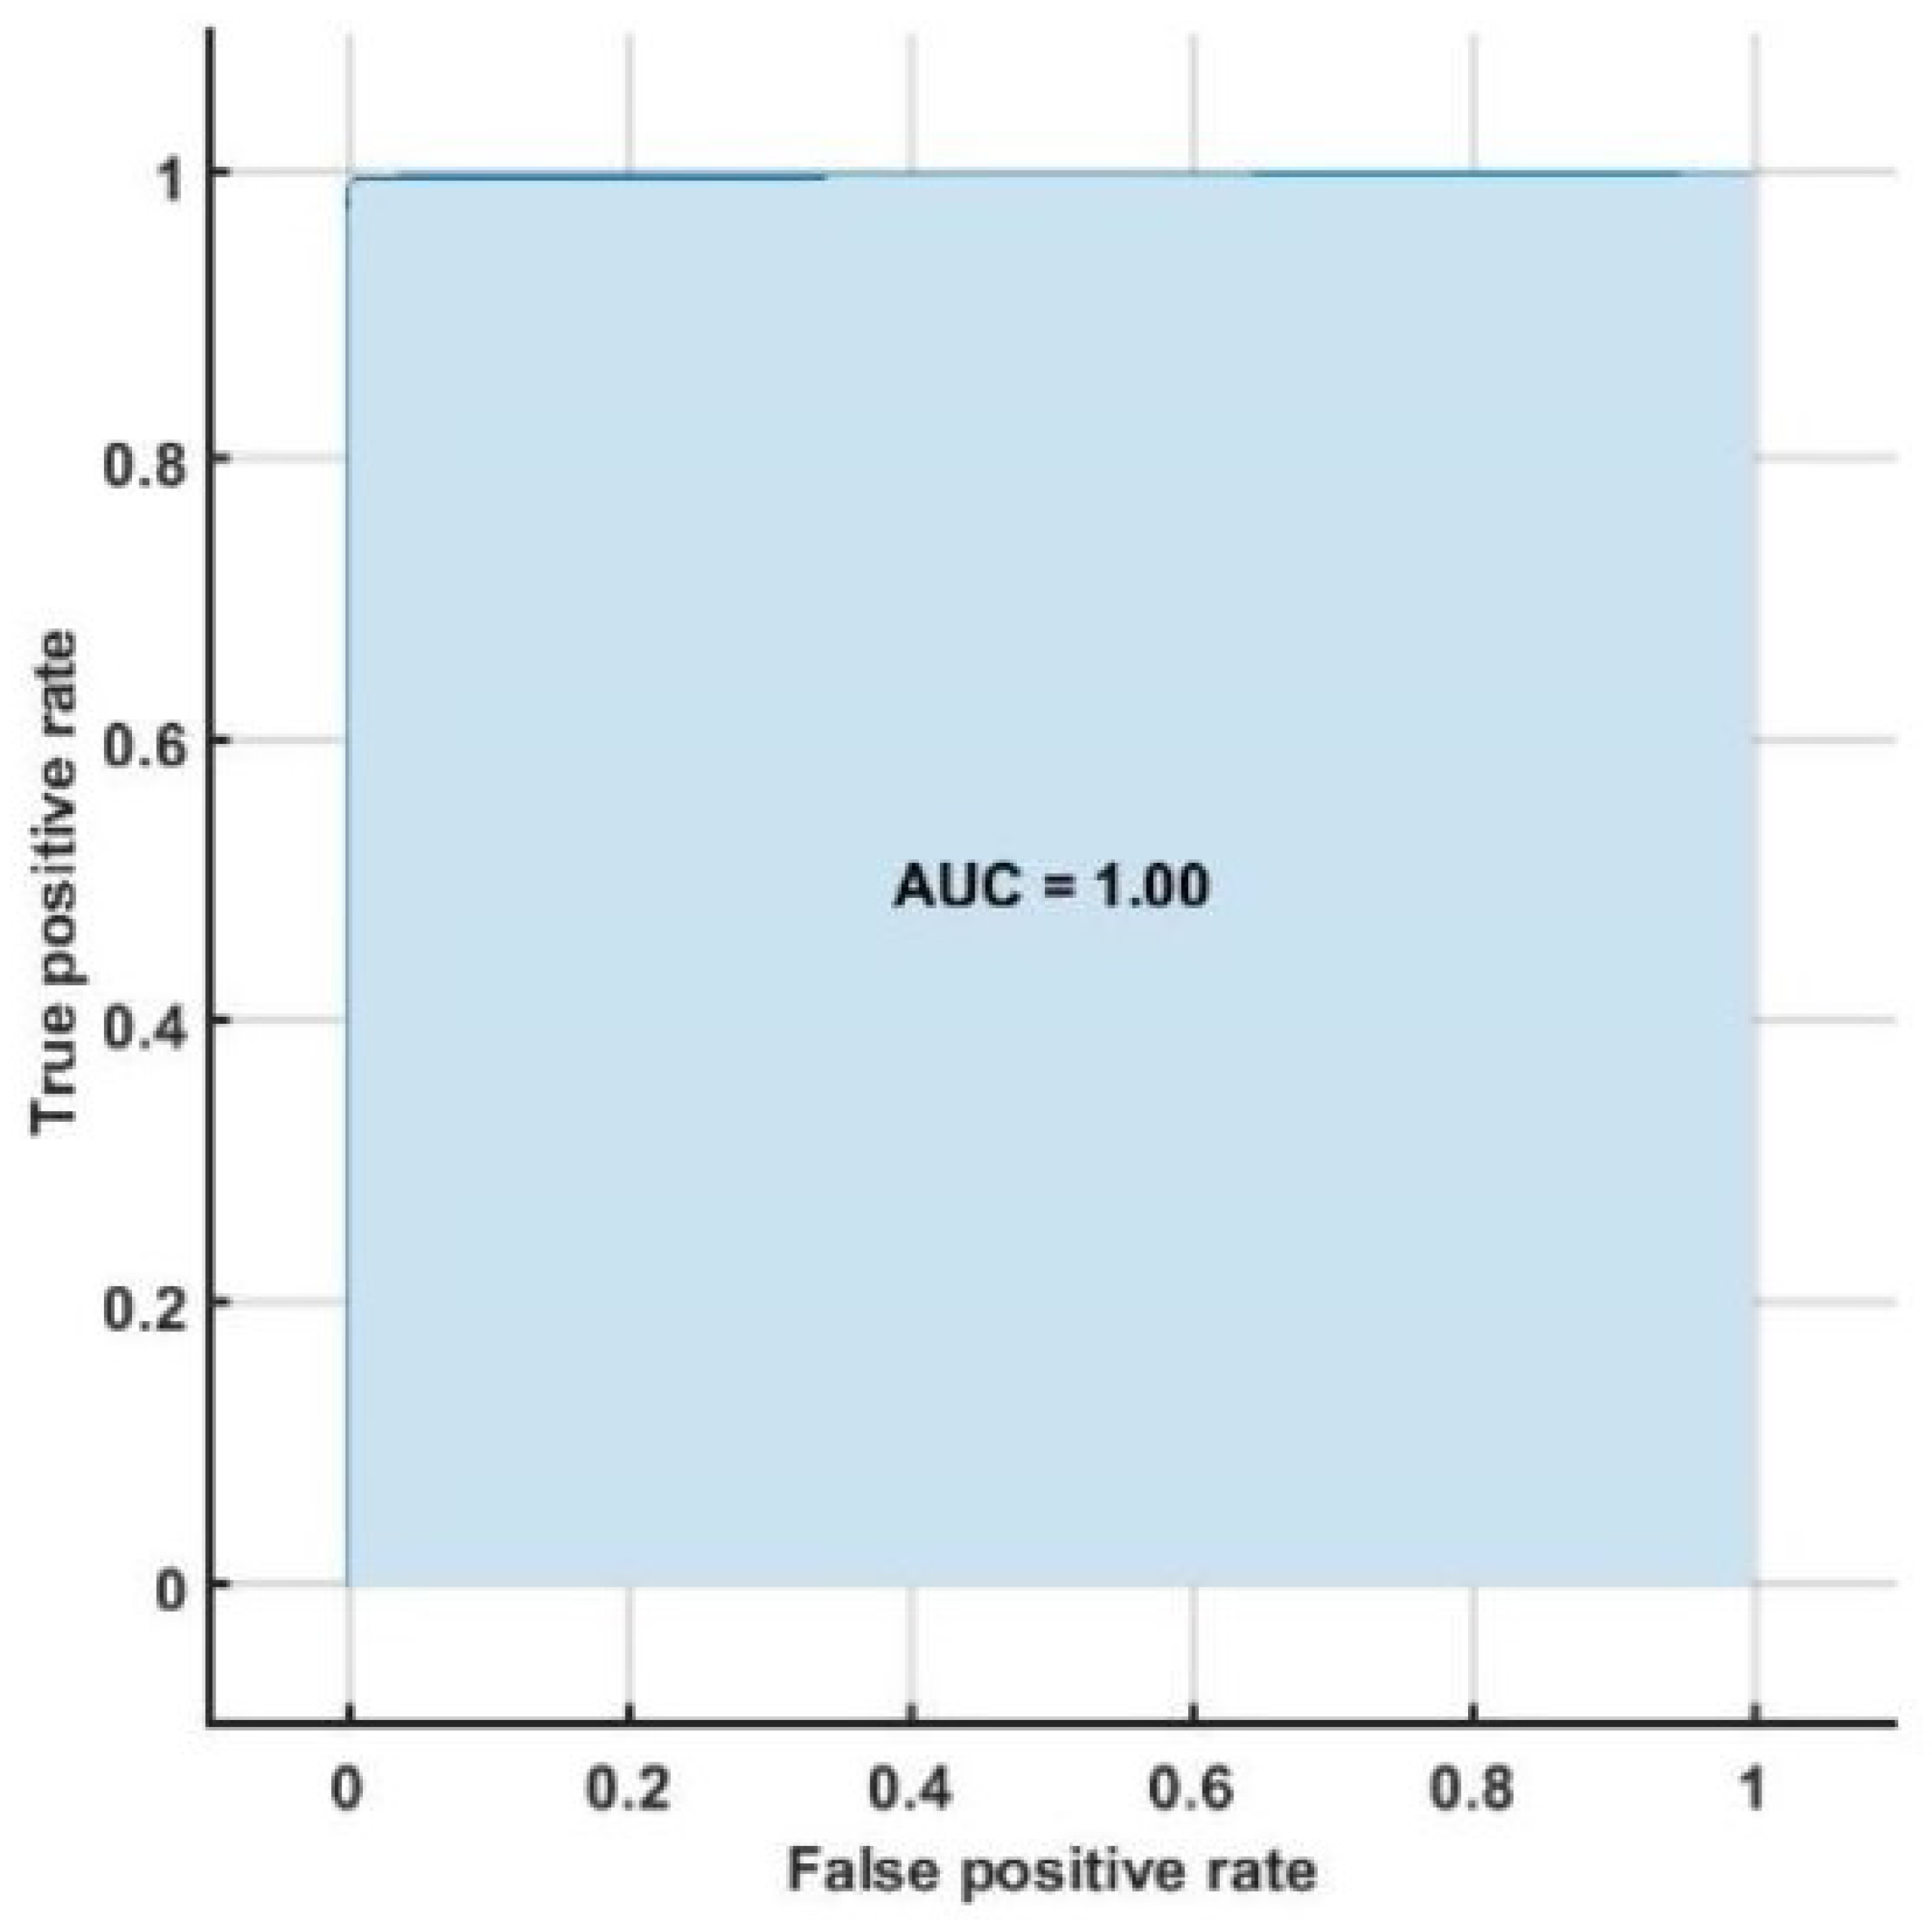
The highest classification accuracy, sensitivity and specificity of 98.05%, 95.66%, and 96.58%, respectively are obtained using support vector machine classifier with ten-fold cross-validation strategy. Table 8 represents the confusion matrix obtained for SVM classifier using all bispectrum, cumulant and RQA features. Table 9 shows the performance measures obtained for each class using HOS bispectrum, cumulants and RQA features with SVM classifier. The highest AUC of 1.00 is obtained using SVM classifier (Figure 5).
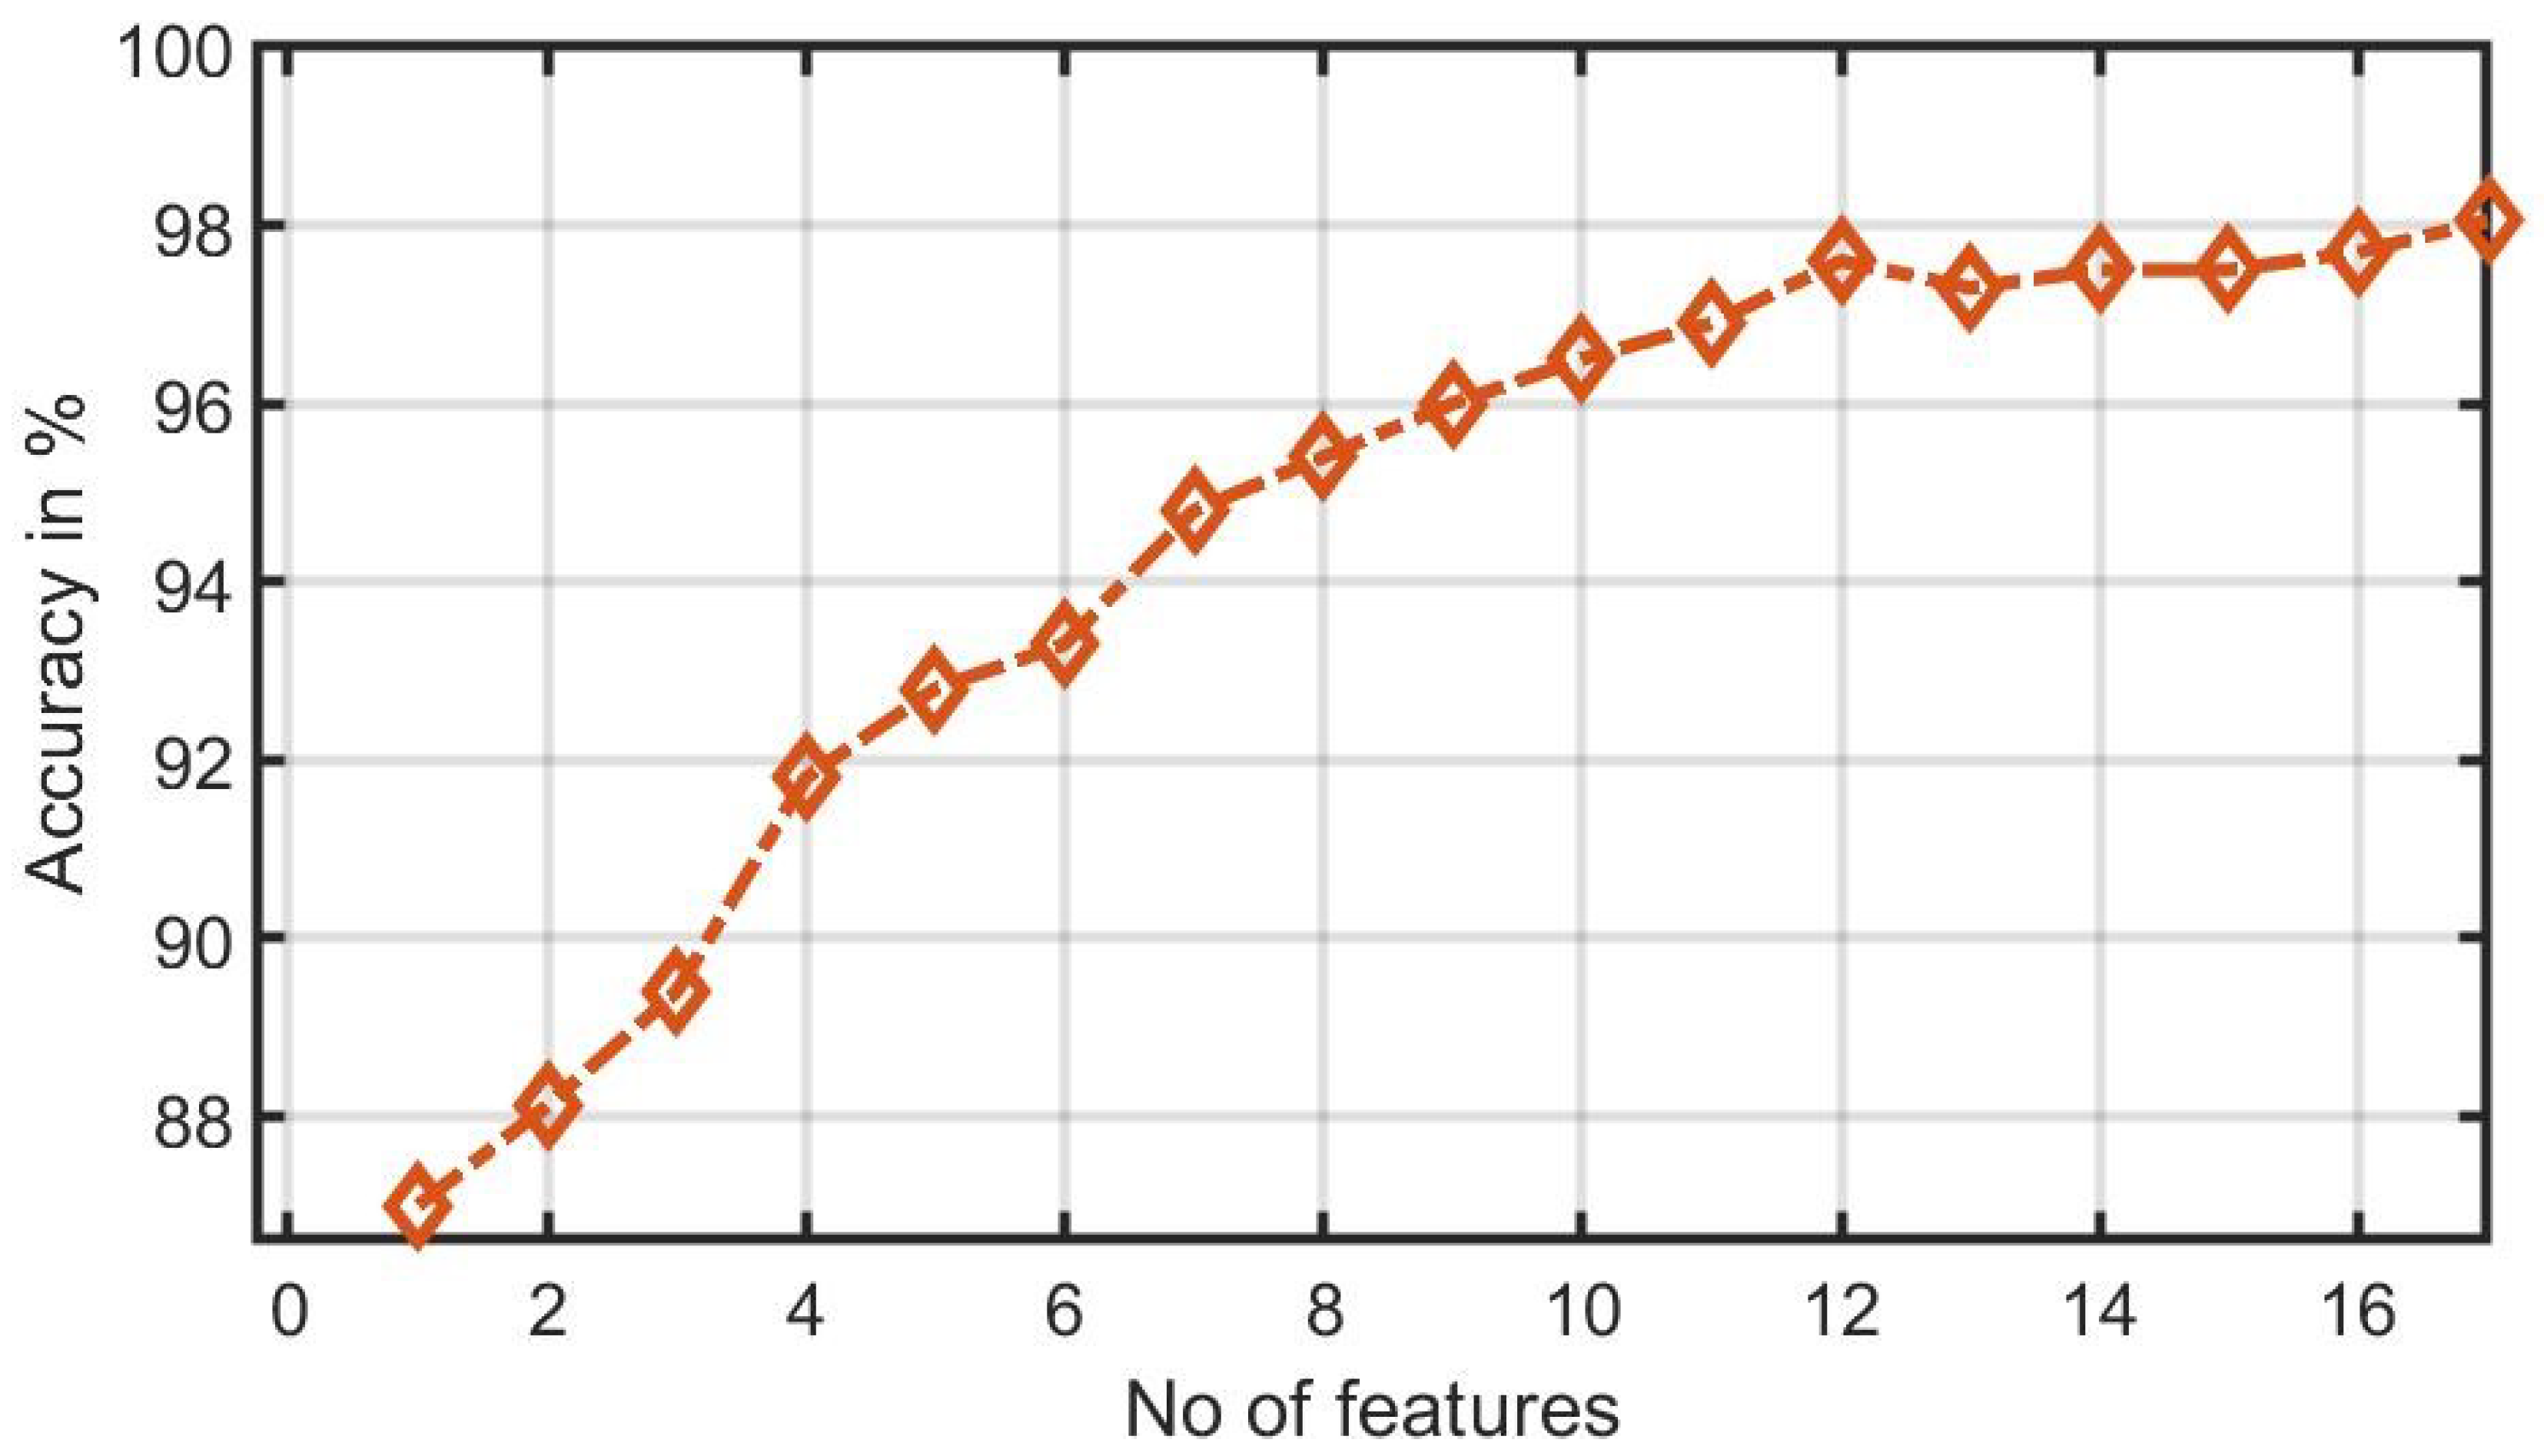
Figure 6 shows the plot of accuracy % versus the number of features. HOS bispectrum magnitude and contour plots for HC, LRHT and HRHT class are shown in the Figure 7, Figure 8, Figure 9, Figure 10, Figure 11 and Figure 12. Figure 13 shows the recurrence plots for HC, LRHT, and HRHT classes. Summary of classification performance obtained using various combination of features is shown in Table 10.

8. Discussion

Table 2, Table 3 and Table 4 summarizes all studies using ECG, BCG, PPG, and HRV signals. It is also evident from Table 2 that the ECG-based computed aided diagnosis system obtained the highest area under receiver operating characteristics (AUC=1.00) performance compared to rest of methods. Moreover, Table 2 represents the highest classification accuracy of 99.99% using ECG signals.
Table 11 lists the summary of artificial intelligence (AI) techniques used to classify HT based on ECG and HRV signals. On the other hand, Table 2, Table 3 and Table 4 summarize the methods, features, subjects, results and type of databases that have been used to diagnose HT using HRV, ECG, BCG, and PPG signals. In both ECG and HRV signal-based studies, authors have used transformational approaches, converted time-domain signals into the frequency domain, extracted non-linear features and classified using SVM and KNN classifiers. The summary of automated systems developed for HT are as follows:
  • Rajput et al. [8] developed an HDI accurately using ECG signals to stratify low-risk versus high-risk HT with a single numeric value.
  • Poddar et al. [28] used HRV signals to classify HT and normal subjects using SVM classifier with 100% accuracy using 20 features. They have used a balanced data set of 56 normal and 57 HT subjects in their study.
  • Rajput et al. [23] classified ECG signals into three classes (LRHT, HRHT, and HC) using features extracted from the five-level wavelet decomposition of ECG signals. They have obtained 99.95% classification accuracy using SeEn and WeEn features with unbalanced data set. Testing error is found to be only 3.26% with hold-out validation method.
  • Soh et al. [24] developed a CNN architecture for the classification of normal and HT ECG classes and achieved an accuracy of 99.99%, sensitivity of 100% and specificity of 99.97%.
In this work, bispectrum based features obtained the highest classification accuracy of 96.5% among the nonlinear features. The summary of classification performance obtained using various combination of features is shown in Table 10.
It can be noted from Table 5 that bispectrum features are clinically significant and show clear difference between three classes. On the other hand, Hos cumulant order-three mean and standard values yielded the large difference among three class as mentioned in Table 7, hence it is useful for 1-D signal features extraction. However, RQA RR feature also comprising distinct difference in all three class.
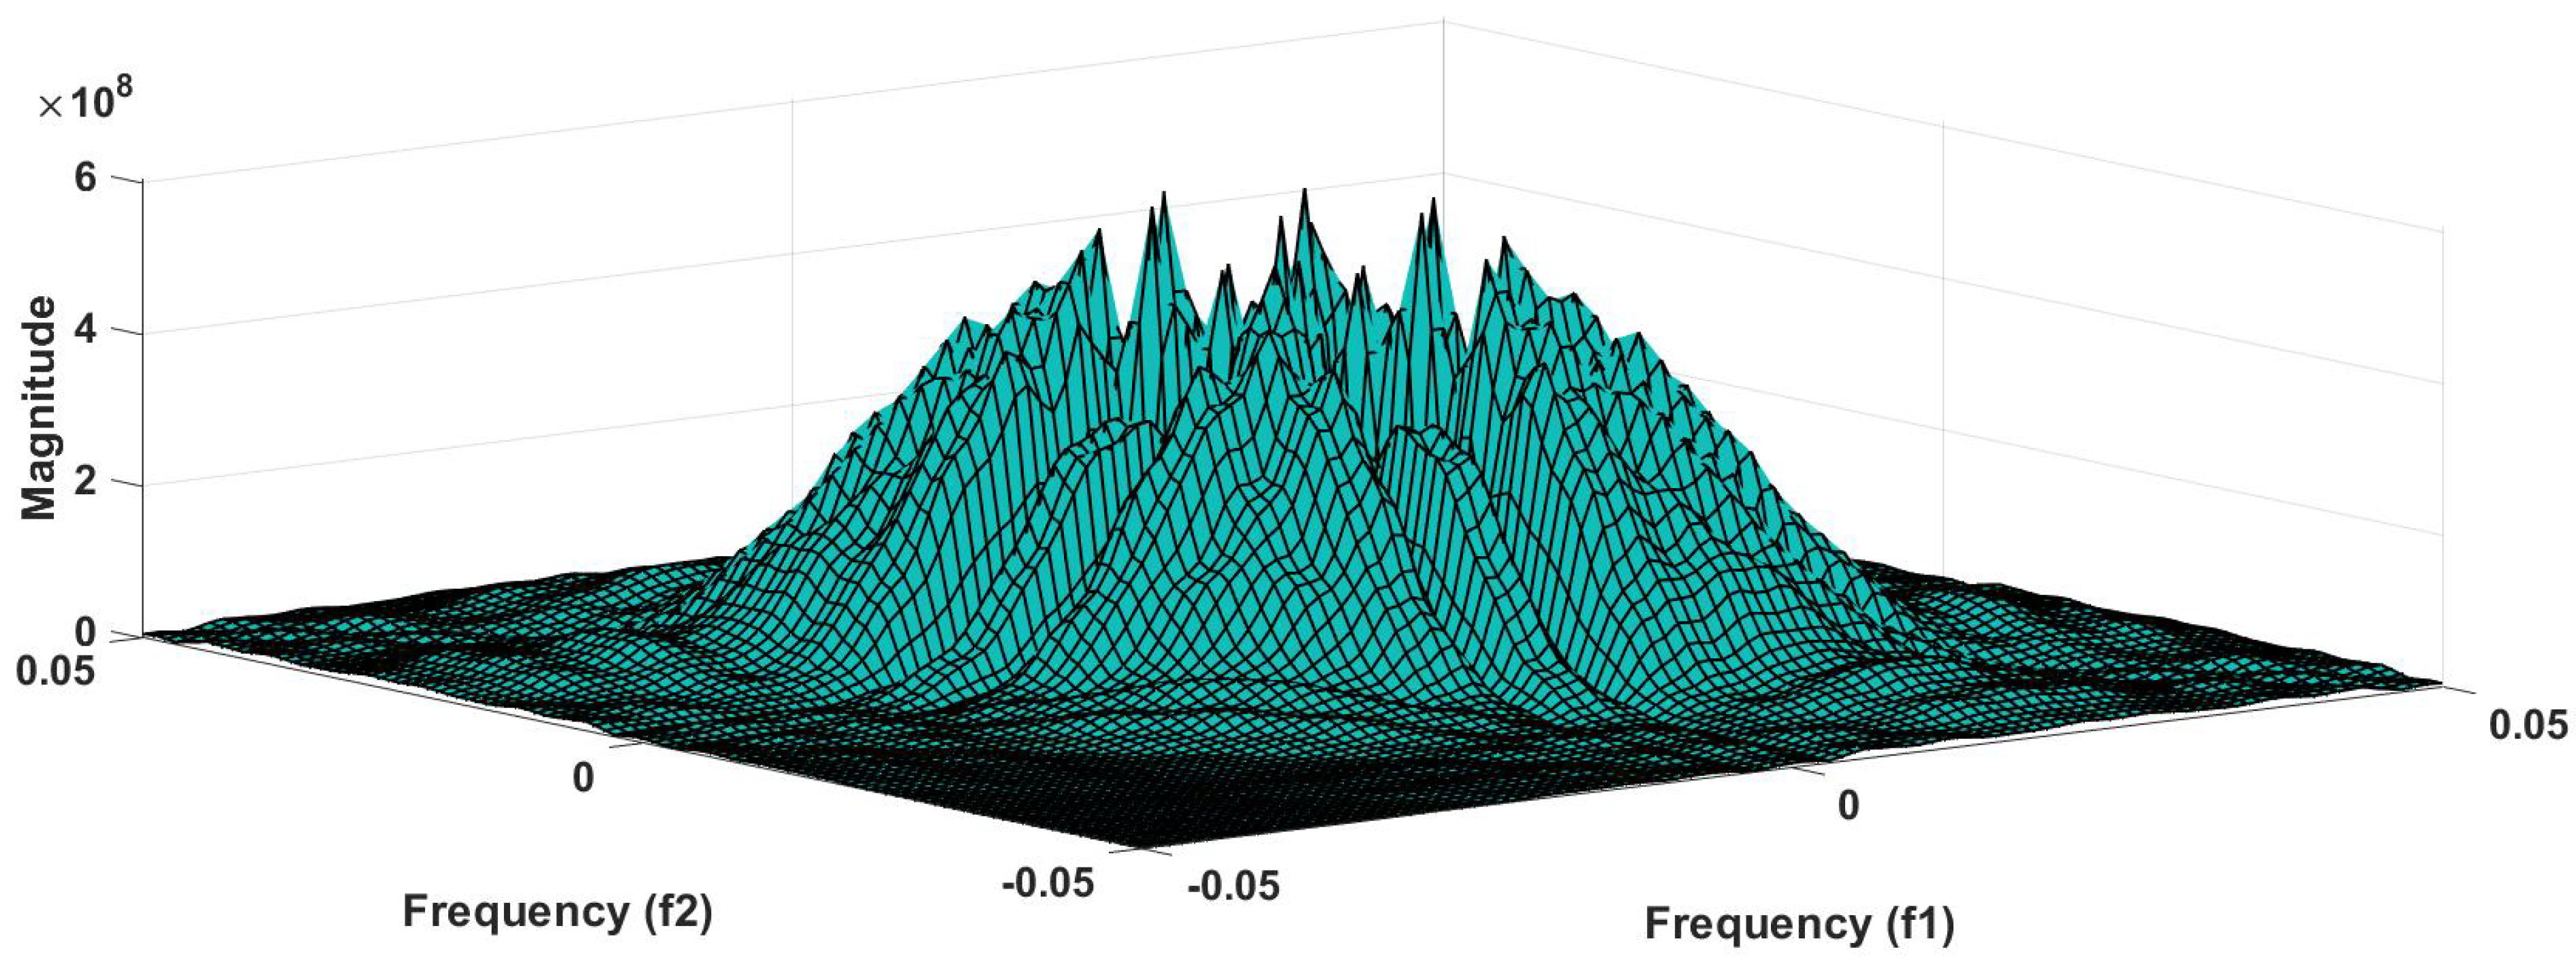
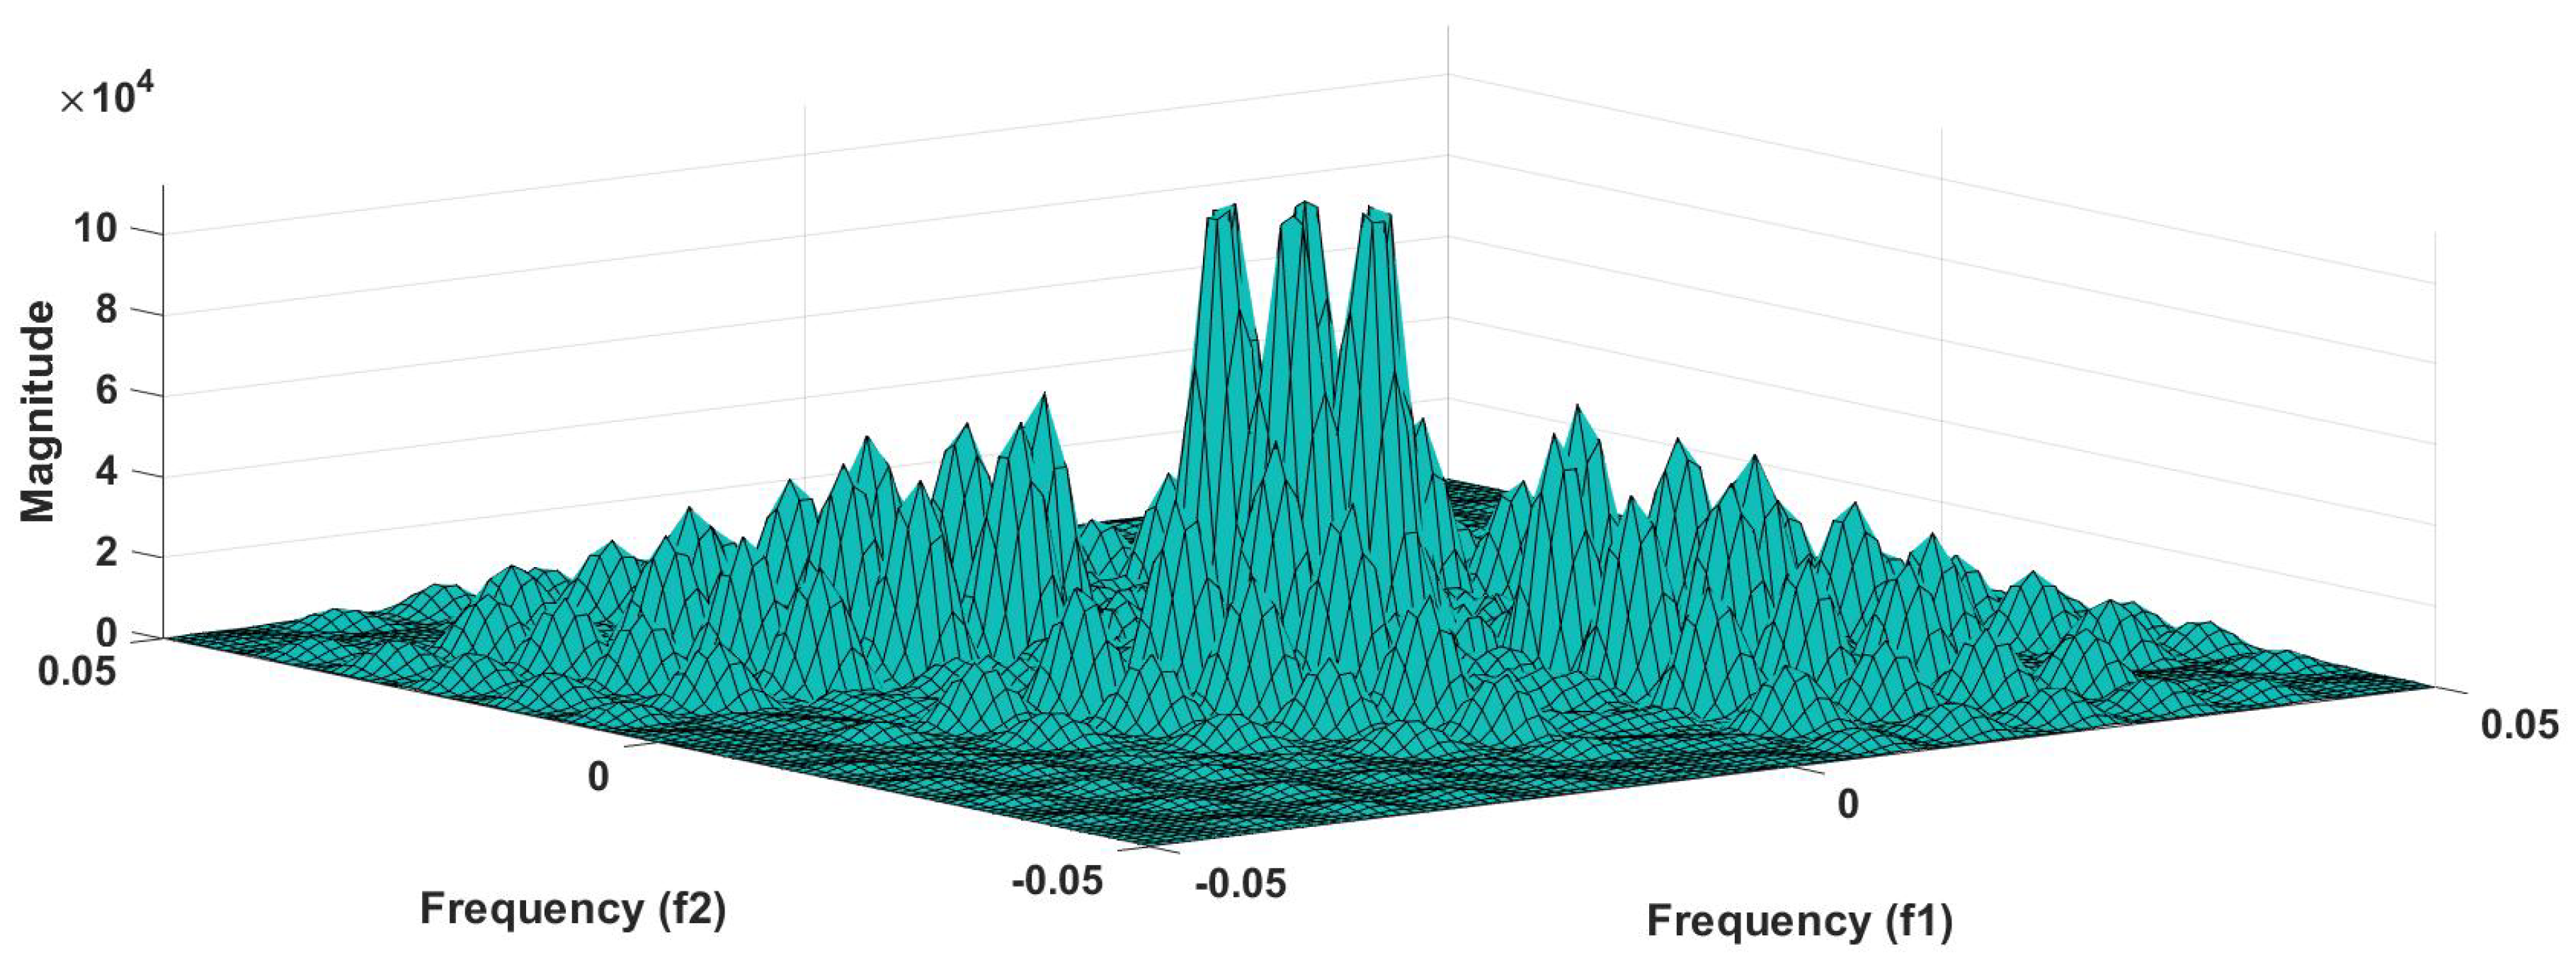
It is well recognized that the bispectrum conserves the phase information [57]. Because of this property, it is used to examine quadratic nonlinear differences between various frequency components of ECG signals. Such interactions have been observed between different frequencies of three classes of ECG signals. This analysis may be useful for detecting changes in ECG signals. For a normal, LRHT, and HRHT ECG signal, the magnitude and its contour representation are shown in the Figure 7, Figure 8, Figure 9, Figure 10, Figure 11 and Figure 12. It can be noted from Figure 7, Figure 8, Figure 9, Figure 10, Figure 11 and Figure 12 that, these plots are unique and can be used to discriminate the class of the ECG signal (HC, LRHT, or HRHT). Similarly, Figure 13 shows the recurrence plots for HC, LRHT and HRHT ECG signals. These plots are unique and can also be used to differentiate the three classes. We have obtained the highest classification performance only using HOS bispectrum features without transforming the ECG signals (Table 10). The advantages of proposed study are: (i) many nonlinear features are employed which can be used for the classification. (ii) Proposed unique HOS bispectrum and recurrence plots for three classes. (iii) HOS-based features are more robust to noise.
In general, works conducted using ML and DL coupled with ECG signals have yielded the highest and optimum performance. The works done in Table 2, Table 3 and Table 4,2,8,13,16,21,23,24,25,26,34,35,26] have used public (open source) databases, while the rest of the studies have used private databases. This underscores the importance of public databases for computer aided diagnosis systems development.
Liang et al. [20,34,35] detected HT using PPG signal in three separate studies using public and private databases. They achieved a best classification F-score of 94.84%.
Liu et al. [21] diagnosed HT from BCG-derived HRV signal, and achieved highest classification accuracy of 84.4% using ML.
Such results demonstrate the effectiveness of transformation methods that combine nonlinear and entropy-based features. ML methods work well with balanced and smaller databases. The performance of ML models also depends on the features extracted and classifiers used.
In the future, we intend to use deep learning architectures to detect the HT ECG signals using large database [59]. The biggest challenge for this study is the availability of the large public database.
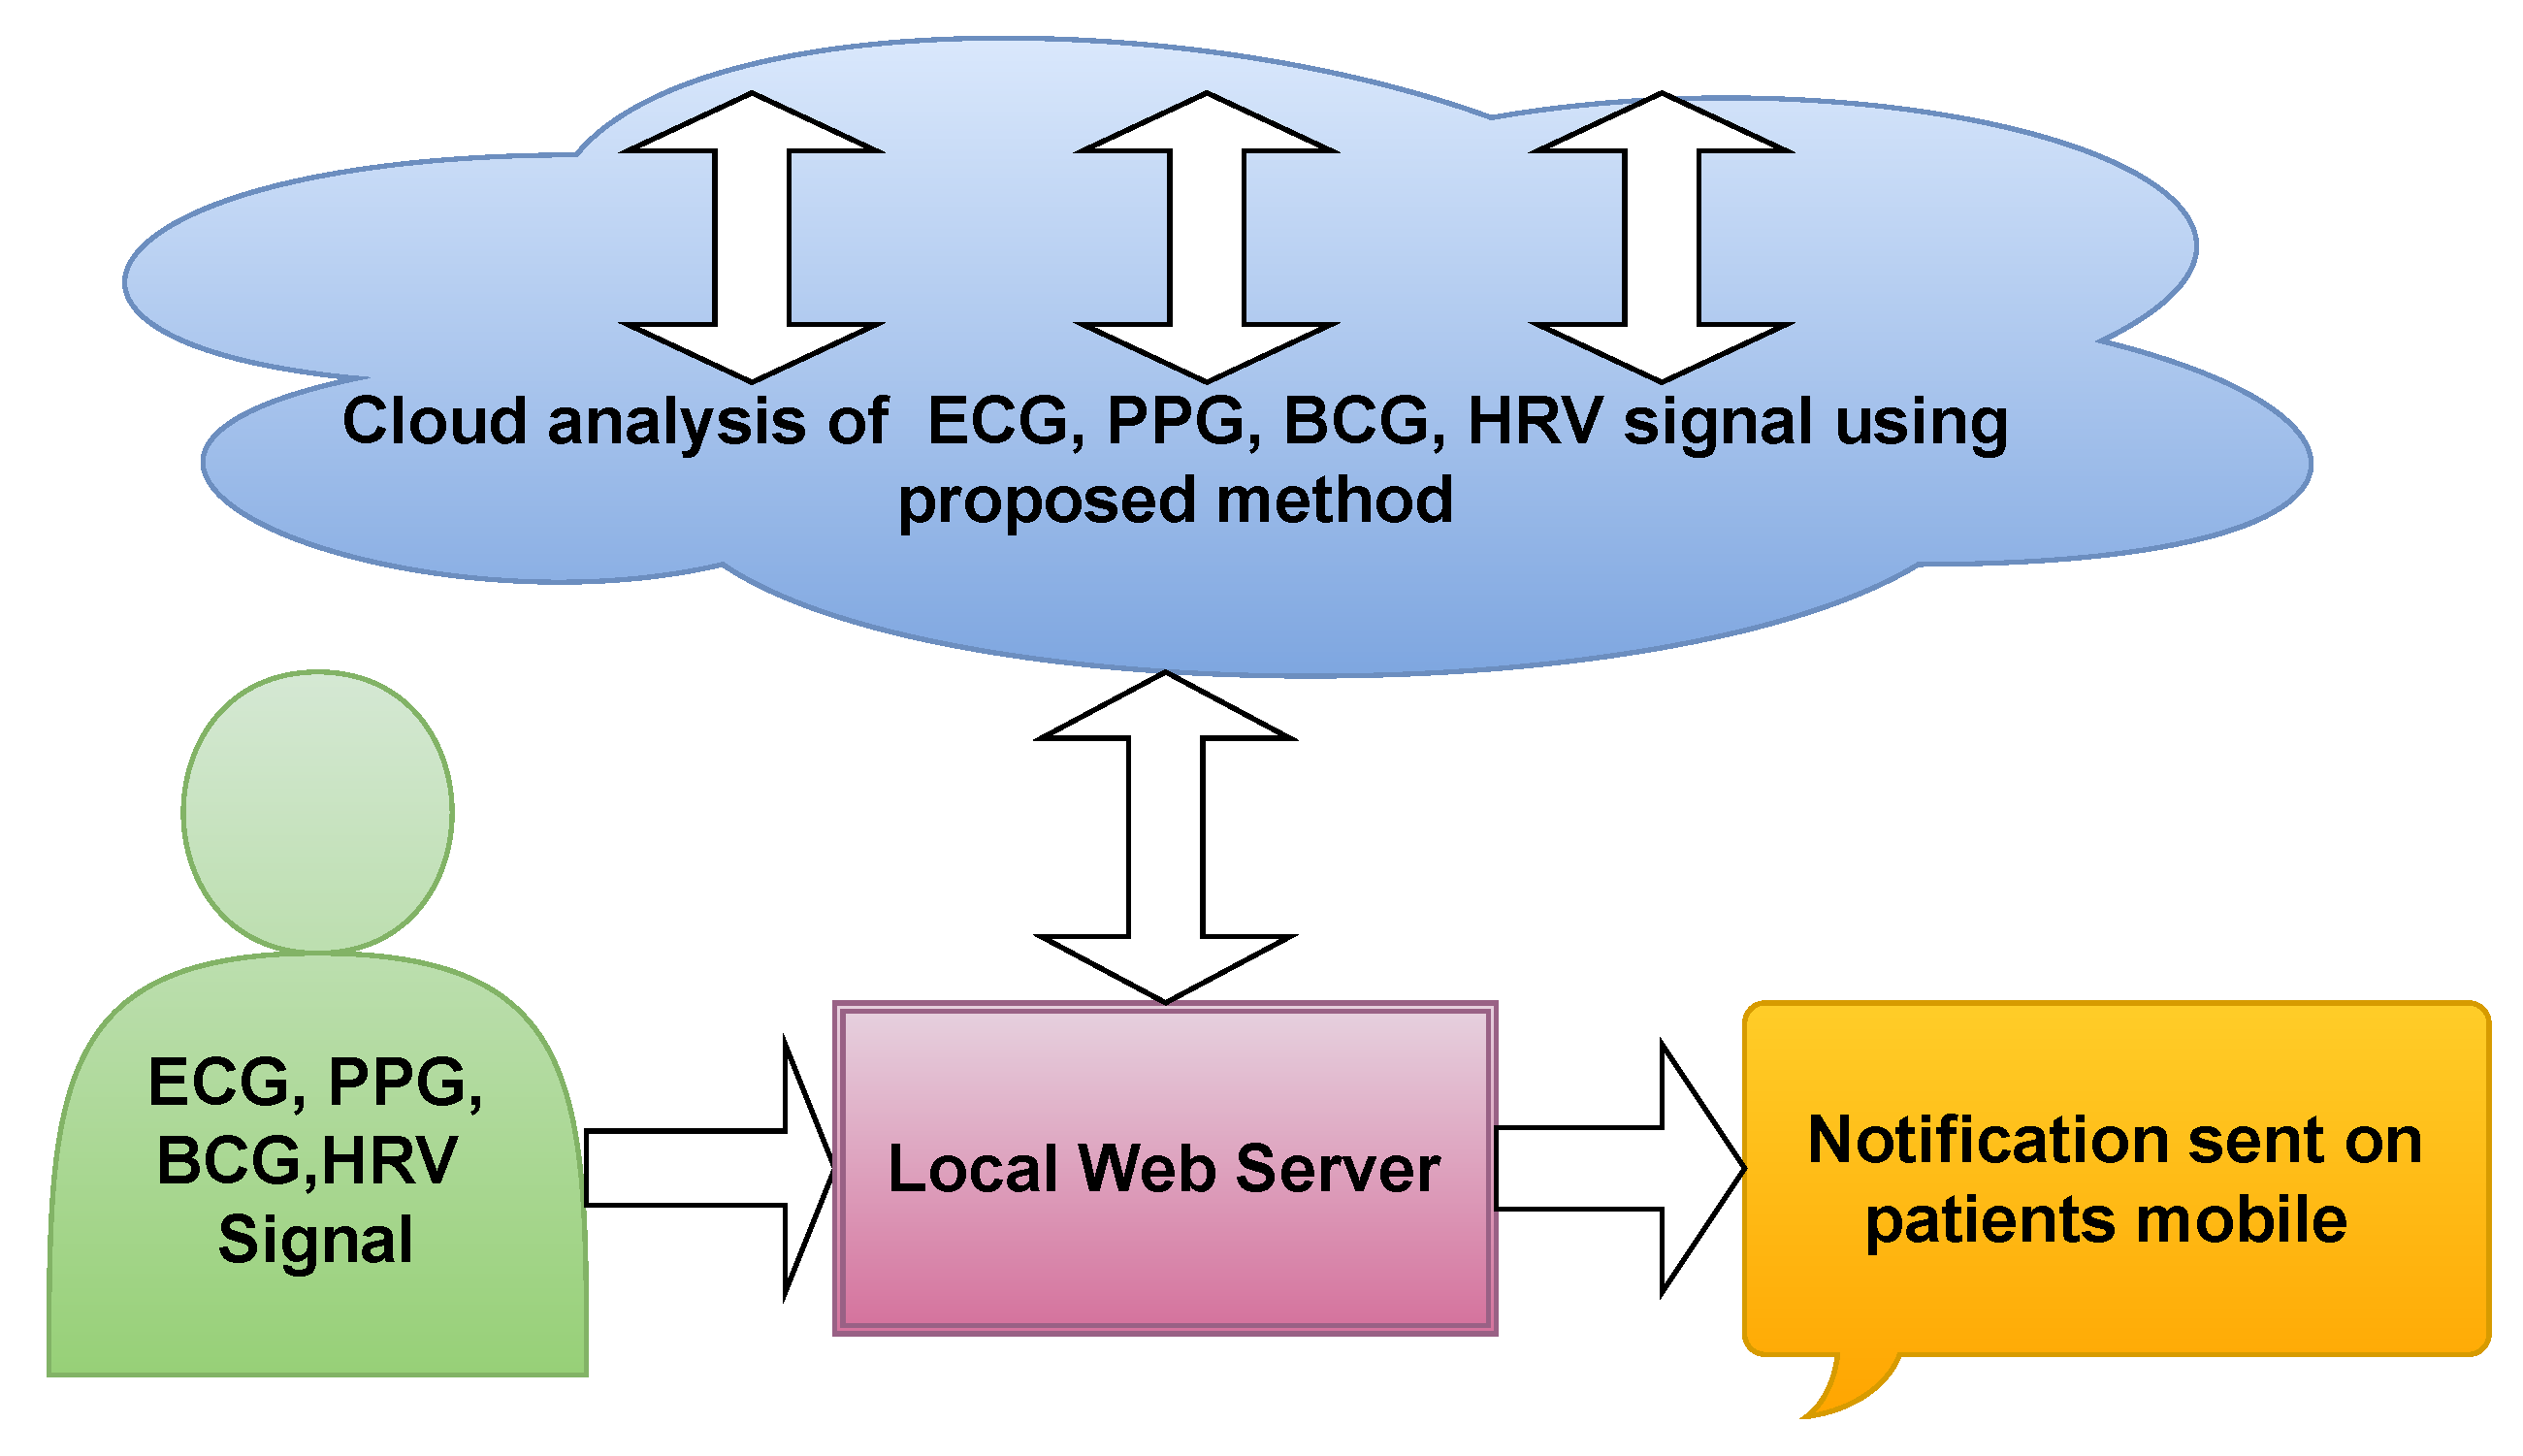
Figure 14 illustrate the cloud based proposed model. Initially, the ECG, PPG, BCG, and HRV signal recorded from patients and stored in hospital database. The stored signals were sent to the cloud based model, where it is installed. The cloud based model analyze the provided data and detect the hypertension accurately. To the same, the results were revert from cloud to hospital. Hence, the Doctors can compare the results obtained by cloud based model as well as manually finding. Table 12 have all the list of abbreviation used in the paper.

9. Conclusions

We have reviewed many automated HT diagnosis methods using ECG and other physiological signals. Many ML models have been developed using nonlinear features and various classifiers. Few DL architectures have been proposed to detect HT ECG signals. Combined with low-cost wearable devices, such methods have the potential to monitor for continuous, non-intrusive cuffless and wireless remote BP. Such automated systems are reliable, accurate and can also be used to detect other cardiac ailments. It can be used in hospital intensive care units (ICUs) to aid the staff to alert the sudden rise in the BP of patients immediately and provide accurate treatment.

Author Contributions

Conceptualization, M.S. and U.R.A.; methodology, J.S.R.; software, J.S.R.; validation, M.S., R.S.T. and U.R.A.;.; formal analysis, U.R.A., M.S.; investigation, R.S.T., U.R.A.; resources, J.S.R.; data curation, J.S.R.; writing— J.S.R.; review and editing, R.S.T., U.R.A.; visualization, M.S.; supervision, M.S. All authors have read and agreed to the published version of the manuscript.

Funding

We do not received funding for proposed review work.

Institutional Review Board Statement

Not applicable.

Informed Consent Statement

Not applicable.

Data Availability Statement

Data sharing not applicable.

Conflicts of Interest

The authors declare no conflict of interest.

References

  1. Unger, T.; Borghi, C.; Charchar, F.; Khan, N.; Poulter, N.; Dorairaj, P.; Ramirez, A.; Schlaich, M.; Stergiou, G.; Tomaszewski, M.; et al. 2020 International Society of Hypertension Global Hypertension Practice Guidelines. Hypertension 2020, 75. [Google Scholar] [CrossRef] [PubMed]
  2. Soh, D.; Ng, E.; Vicnesh, J.; Oh, S.L.; Tan, R.S.; Acharya, U.R. A computational intelligence tool for the detection of hypertension using empirical mode decomposition. Comput. Biol. Med. 2020, 118, 103630. [Google Scholar] [CrossRef] [PubMed]
  3. Da S. Luz, E.J.; Schwartz, W.R.; Camara-Chavez, G.; Menotti, D. ECG-based heartbeat classification for arrhythmia detection: A survey. Comput. Methods Programs Biomed. 2016, 127, 144–164. [Google Scholar] [CrossRef]
  4. Estrada, G.; Luis, M.; Mendoza, l.e.; Sc, M.; Molina, V. Relationship of blood pressure with the electrical signal of the heart using signal processing. Tecciencia 2014. [Google Scholar] [CrossRef] [Green Version]
  5. Sharma, M.; Dhiman, H.S.; Acharya, U.R. Automatic identification of insomnia using optimal antisymmetric biorthogonal wavelet filter bank with ECG signals. Comput. Biol. Med. 2021, 104246. [Google Scholar] [CrossRef]
  6. Sharma, M.; Tan, R.S.; Acharya, U.R. Automated heartbeat classification and detection of arrhythmia using optimal orthogonal wavelet filters. Inform. Med. Unlocked 2019, 100221. [Google Scholar] [CrossRef]
  7. Simjanoska, M.; Gjoreski, M.; Madevska Bogdanova, A.; Koteska, B.; Gams, M.; Tasic, J. ECG-derived Blood Pressure Classification using Complexity Analysis-based Machine Learning. In Proceedings of the 11th International Joint Conference on Biomedical Engineering Systems and Technologies—HEALTHINF, Madeira, Portugal, 19-21 January 2018; pp. 282–292. [Google Scholar] [CrossRef]
  8. Rajput, J.S.; Sharma, M.; Acharya, U.R. Hypertension Diagnosis Index for Discrimination of High-Risk Hypertension ECG Signals Using Optimal Orthogonal Wavelet Filter Bank. Int. J. Environ. Res. Public Health 2019, 16, 4068. [Google Scholar] [CrossRef] [Green Version]
  9. Sharma, M.; Singh, S.; Kumar, A.; Tan, R.S.; Acharya, U.R. Automated detection of shockable and non-shockable arrhythmia using novel wavelet-based ECG features. Comput. Biol. Med. 2019, 103446. [Google Scholar] [CrossRef]
  10. Sharma, M.; Acharya, U.R. A new method to identify coronary artery disease with ECG signals and time-Frequency concentrated antisymmetric biorthogonal wavelet filter bank. Pattern Recognit. Lett. 2019, 125, 235–240. [Google Scholar] [CrossRef]
  11. Sharma, M.; Tan, R.S.; Acharya, U.R. A novel automated diagnostic system for classification of myocardial infarction ECG signals using an optimal biorthogonal filter bank. Comput. Biol. Med. 2018. [Google Scholar] [CrossRef]
  12. Sharma, M.; Agarwal, S.; Acharya, U.R. Application of an optimal class of antisymmetric wavelet filter banks for obstructive sleep apnea diagnosis using ECG signals. Comput. Biol. Med. 2018, 100, 100–113. [Google Scholar] [CrossRef]
  13. Ni, H.; Wang, Y.; Xu, G.; Shao, Z.; Zhang, W.; Zhou, X. Multiscale Fine-Grained Heart Rate Variability Analysis for Recognizing the Severity of Hypertension. Comput. Math. Methods Med. 2019, 2019, 1–9. [Google Scholar] [CrossRef] [Green Version]
  14. Acharya, U.R.; Ae, A.; Paul, K.; Ae, J.; Kannathal, N.; Choo, A.; Lim, M.; Jasjit, A.; Suri, S. Heart rate variability: A review. Med. Biol. Eng. Comput. 2014, 44, 1031–1051. [Google Scholar] [CrossRef]
  15. Lan, K.C.; Raknim, P.; Kao, W.F.; Huang, J.H. Toward Hypertension Prediction Based on PPG-Derived HRV Signals: A Feasibility Study. J. Med Syst. 2018, 42. [Google Scholar] [CrossRef]
  16. Melillo, P.; Izzo, R.; Orrico, A.; Scala, P.; Attanasio, M.; Mirra, M.; Luca, N.; Pecchia, L. Automatic Prediction of Cardiovascular and Cerebrovascular Events Using HRV Analysis. PLoS ONE 2015, 10, e0118504. [Google Scholar] [CrossRef]
  17. Malik, M. Chapter 89 - Heart Rate Variability and Baroreflex Sensitivity. In Cardiac Electrophysiology, 4th ed.; Zipes, D.P., Jalife, J., Eds.; W.B. Saunders Elsevier: Amsterdam, The Netherlands, 2004; pp. 823–830. [Google Scholar] [CrossRef]
  18. Natarajan, N.; Balakrishnan, A.; Ukkirapandian, K. A study on analysis of Heart Rate Variability in hypertensive individuals. Int. J. Biomed. Adv. Res. 2014, 5, 109. [Google Scholar] [CrossRef] [Green Version]
  19. Elgendi, M.; Fletcher, R.; Liang, Y.; Howard, N.; Lovell, N.; Abbott, D.; Lim, K.; Ward, R. The use of photoplethysmography for assessing hypertension. Nat. Med. 2019, 2. [Google Scholar] [CrossRef] [Green Version]
  20. Liang, Y.; Chen, Z.; Ward, R.; Elgendi, M. Hypertension Assessment Using Photoplethysmography: A Risk Stratification Approach. J. Clin. Med. 2018, 8, 12. [Google Scholar] [CrossRef] [Green Version]
  21. Liu, F.; Zhou, X.; Wang, Z.; Cao, J.; Wang, H.; Zhang, Y. Unobtrusive Mattress-Based Identification of Hypertension by Integrating Classification and Association Rule Mining. Sensors 2019, 19, 1489. [Google Scholar] [CrossRef] [Green Version]
  22. Moher, D.; Liberati, A.; Tetzlaff, J.; Altman, D.; Antes, G.; Atkins, D.; Barbour, V.; Barrowman, N.; Berlin, J.; Clark, J.; et al. Preferred Reporting Items for Systematic Reviews and Meta-Analyses: The PRISMA Statement. Rev. Esp. De Nutr. Humana Y Diet. 2014, 18, 172–181. [Google Scholar] [CrossRef]
  23. Rajput, J.S.; Sharma, M.; Tan, R.S.; Acharya, U.R. Automated detection of severity of hypertension ECG signals using an optimal bi-orthogonal wavelet filter bank. Comput. Biol. Med. 2020, 103924. [Google Scholar] [CrossRef] [PubMed]
  24. Soh, D.; Ng, E.; Vicnesh, J.; Oh, S.L.; Tan, R.S.; Acharya, U.R. Automated diagnostic tool for hypertension using convolutional neural network. Comput. Biol. Med. 2020. [Google Scholar] [CrossRef] [PubMed]
  25. Jain, P.; Gajbhiye, P.; Tripathy, R.; Acharya, U.R. A two-stage Deep CNN Architecture for the Classification of Low-risk and High-risk Hypertension Classes using Multi-lead ECG Signals. Inform. Med. Unlocked 2020. [Google Scholar] [CrossRef]
  26. Alkhodari, M.; Islayem, D.; Alskafi, F.; Khandoker, A. Predicting hypertensive patients with higher risk of developing vascular events using heart rate variability and machine learning. IEEE Access 2020. [Google Scholar] [CrossRef]
  27. Tejera, E.; Areias, M.; Rodrigues, A.; Ramõa, A.; Nieto-villar, J.; Rebelo, I. Artificial neural network for normal, hypertensive, and preeclamptic pregnancy classification using maternal heart rate variability indexes. J. Matern.-Fetal Neonatal Med. Off. J. Eur. Assoc. Perinat. Med. Fed. Asia Ocean. Perinat. Soc. Int. Soc. Perinat. Obstet. 2011, 24, 1147–1151. [Google Scholar] [CrossRef]
  28. Poddar, M.; Kumar, V.; Sharma, Y.P. HRV based Classification of Normal and Hypertension Cases by Linear-nonlinear Method. Def. Sci. J. 2014, 64, 542–548. [Google Scholar] [CrossRef]
  29. Poddar, M.; Birajdar, A.; Virmani, J.K. Automated Classification of Hypertension and Coronary Artery Disease Patients by PNN, KNN, and SVM Classifiers Using HRV Analysis. In Machine Learning in Bio-Signal Analysis and Diagnostic Imaging; Academic Press: Amsterdam, The Netherlands, 2019; pp. 99–125. [Google Scholar] [CrossRef]
  30. Ni, H.; Cho, S.; Mankoff, J.; Yang, J.; Dey, A. Automated recognition of hypertension through overnight continuous HRV monitoring. J. Ambient Intell. Humaniz. Comput. 2017, 9. [Google Scholar] [CrossRef]
  31. Kublanov, V.; Dolganov, A.; Belo, D.; Gamboa, H. Comparison of Machine Learning Methods for the Arterial Hypertension Diagnostics. Appl. Bionics Biomech. 2017, 2017, 1–13. [Google Scholar] [CrossRef] [Green Version]
  32. Mussalo, H.; Vanninen, E.; Ikäheimo, R.; Laitinen, T.; Laakso, M.; Länsimies, E.; Hartikainen, J. Heart rate variability and its determinants in patients with severe or mild essential hypertension. Clin. Physiol. 2008, 21, 594–604. [Google Scholar] [CrossRef]
  33. Song, Y.; Ni, H.; Zhou, X.; Zhao, W.; Wang, T. Extracting Features for Cardiovascular Disease Classification Based on Ballistocardiography. In 2015 IEEE 12th Intl Conf on Ubiquitous Intelligence and Computing and 2015 IEEE 12th Intl Conf on Autonomic and Trusted Computing and 2015 IEEE 15th Intl Conf on Scalable Computing and Communications and Its Associated Workshops (UIC-ATC-ScalCom); IEEE: Beijing, China, 2015; pp. 1230–1235. [Google Scholar] [CrossRef]
  34. Liang, Y.; Chen, Z.; Ward, R.; Elgendi, M. Photoplethysmography and Deep Learning: Enhancing Hypertension Risk Stratification. Biosensors 2018, 8, 101. [Google Scholar] [CrossRef] [Green Version]
  35. Liang, Y.; Chen, Z.; Ward, R.; Elgendi, M. Hypertension Assessment via ECG and PPG Signals: An Evaluation Using MIMIC Database. Diagnostics 2018, 8, 65. [Google Scholar] [CrossRef] [Green Version]
  36. Ghosh, A.; Mayor Torres, J.; Danieli, M.; Riccardi, G. Detection of Essential Hypertension with Physiological Signals from Wearable Devices. In Proceedings of the 2015 37th Annual International Conference of the IEEE Engineering in Medicine and Biology Society (EMBC), Milan, Italy, 25–29 August 2015. [Google Scholar] [CrossRef]
  37. Poddar, M.; Kumar, V.; Sharma, Y. Linear-nonlinear heart rate variability analysis and SVM based classification of normal and hypertensive subjects. J. Electrocardiol. 2013, 46, e25. [Google Scholar] [CrossRef]
  38. Koichubekov, B.; Sorokina, M.; Laryushina, Y.; Luydmila, T.; Korshukov, I. Nonlinear analyses of heart rate variability in hypertension. Ann. De Cardiol. Et D’Angéiologie 2018, 67. [Google Scholar] [CrossRef]
  39. Satija, U.; Ramkumar, B.; Manikandan, M. Automated ECG Noise Detection and Classification System for Unsupervised Healthcare Monitoring. IEEE J. Biomed. Health Informatics 2017, PP. [Google Scholar] [CrossRef]
  40. Sharma, M.; Patel, V.; Acharya, U.R. Automated identification of insomnia using optimal bi-orthogonal wavelet transform technique with single-channel EEG signals. Knowl. Based Syst. 2021, 107078. [Google Scholar] [CrossRef]
  41. Sharma, M.; Patel, S.; Acharya, U.R. Automated detection of abnormal EEG signals using localized wavelet filter banks. Pattern Recognit. Lett. 2020, 133, 188–194. [Google Scholar] [CrossRef]
  42. Sharma, M.; Tan, R.S.; Acharya, U.R. Detection of shockable ventricular arrhythmia using optimal orthogonal wavelet filters. Neural Comput. Appl. 2019. [Google Scholar] [CrossRef]
  43. Sharma, M.; Acharya, U.R. Automated detection of schizophrenia using optimal wavelet-based l1 norm features extracted from single-channel EEG. Cogn. Neurodynamics 2021, 1–14. [Google Scholar] [CrossRef]
  44. Sharma, M.; Patel, S.; Choudhary, S.; Acharya, U.R. Automated Detection of Sleep Stages Using Energy-Localized Orthogonal Wavelet Filter Banks. Arab. J. Sci. Eng. 2019. [Google Scholar] [CrossRef]
  45. Sharma, M.; Acharya, U.R. Analysis of knee-joint vibroarthographic signals using bandwidth-duration localized three-channel filter bank. Comput. Electr. Eng. 2018, 72, 191–202. [Google Scholar] [CrossRef]
  46. Zala, J.; Sharma, M.; Bhalerao, R. Tunable Q - wavelet transform based features for automated screening of knee-joint vibroarthrographic signals. In Proceedings of the 2018 International Conference on Signal Processing and Integrated Networks (SPIN), Noida, India, 22–23 February 2018. [Google Scholar] [CrossRef]
  47. Sharma, M.; Bhurane, A.A.; Acharya, U.R. MMSFL-OWFB: A novel class of orthogonal wavelet filters for epileptic seizure detection. Knowl.-Based Syst. 2018, 160, 265–277. [Google Scholar] [CrossRef]
  48. Kamath, M.; Watanabe, M.; Upton, A. Heart Rate Variability (HRV) Signal Analysis: Clinical Applications; CRC Press: Boca Raton, FL, USA, 2016; pp. 1–502. [Google Scholar]
  49. Garcia Martinez, C.; Otero, A.; Vila, X.; Tourino, M.; Rodriguez-Linares, L.; Presedo, J.; Mendez, A. Heart Rate Variability Analysis with the R Package RHRV; Springer: Cham, Switzerland, 2017. [Google Scholar] [CrossRef]
  50. Renyi, A. On measures of entropy and information. Proc. 4th Berkeley Symp. Math. Stat. Prob. 1961, 1, 547–561. [Google Scholar]
  51. Sharma, M.; Tiwari, J.; Acharya, U.R. Automatic Sleep-Stage Scoring in Healthy and Sleep Disorder Patients Using Optimal Wavelet Filter Bank Technique with EEG Signals. Int. J. Environ. Res. Public Health 2021, 18. [Google Scholar] [CrossRef]
  52. Rosso, O.; Blanco, S.; Yordanova, J.; Figliola, A.; Schürmann, M.; Basar, E. Wavelet entropy: A new tool for analysis of short duration brain electrical signals. J. Neurosci. Methods 2001, 105, 65–75. [Google Scholar] [CrossRef]
  53. Sharma, M.; Raval, M.; Acharya, U.R. A new approach to identify obstructive sleep apnea using an optimal orthogonal wavelet filter bank with ECG signals. Informatics Med. Unlocked 2019, 16, 100170. [Google Scholar] [CrossRef]
  54. Acharya, U.R.; Subbhuraam, V.S.; Ang, P.; Yanti, R.; Suri, J. Application of non-linear and wavelet based features for the automated identification of epileptic EEG signals. Int. J. Neural Syst. 2012, 22, 1250002. [Google Scholar] [CrossRef]
  55. Acharya, U.R.; Fujita, H.; K Sudarshan, V.; Oh, S.L.; Adam, M.; Koh, J.E.W.; Tan, J.H.; Ghista, D.; Martis, R.; Chua, K.; et al. Automated Detection and Localization of Myocardial Infarction Using Electrocardiogram: A Comparative Study of Different Leads. Knowl. Based Syst. 2016, 99. [Google Scholar] [CrossRef]
  56. Martis, R.; Acharya, U.R.; Mandana, K.; Ray, A.; Chakraborty, C. Cardiac decision making using higher order spectra. Biomed. Signal Process. Control 2013, 8, 193–203. [Google Scholar] [CrossRef]
  57. Acharya, U.R.; Subbhuraam, V.S.; Goutham, S.; Martis, R.; Suri, J. Automated EEG analysis of epilepsy: A review. Knowl. Based Syst. 2013, 45, 147–165. [Google Scholar] [CrossRef]
  58. Chua, K.; Chandran, V.; Acharya, U.R.; Lim, C. Application of higher order statistics/spectra in biomedical signals—A review. Med. Eng. Phys. 2010, 32, 679–689. [Google Scholar] [CrossRef] [PubMed] [Green Version]
  59. Oh, S.L.; Vicnesh, J.; Tan, R.S.; Ciaccio, E.; Yamakawa, T.; Tanabe, M.; Kobayashi, M.; Faust, O.; Acharya, U.R. Comprehensive electrocardiographic diagnosis based on deep learning. Artif. Intell. Med. 2020, 103. [Google Scholar] [CrossRef]
Figure 1. ECG waveform with standard intervals. Correlations have been found between systolic (SBP) and diastolic blood pressure (DBP) measurements and morphological data in the corresponding indicated epochs. The Figure is generated from PTB database (subject no. 14).
Ijerph 18 05838 g001
Figure 2. Flow diagram of the article selection process using PRISMA methodology.
Ijerph 18 05838 g002
Figure 3. Proposed automated system to detect HT ECG signals.
Ijerph 18 05838 g003
Figure 4. Workflow of proposed methods for HT diagnosis using ECG signals. HC represents healthy control, LRHT, low-risk hypertension, and HRHT is high-risk hypertension.
Ijerph 18 05838 g004
Figure 5. ROC plot obtained with SVM classifier.
Ijerph 18 05838 g005
Figure 6. Graph of accuracy (%) versus combined features (bispectrum, cumulants and RQA).
Ijerph 18 05838 g006
Figure 7. HC-bispectrum plot.
Ijerph 18 05838 g007
Figure 8. HRHT-bispectrum plot.
Ijerph 18 05838 g008
Figure 9. LRHT-bispectrum plot.
Ijerph 18 05838 g009
Figure 10. HC-contour plot.
Ijerph 18 05838 g010
Figure 11. HRHT-contour plot.
Ijerph 18 05838 g011
Figure 12. LRHT-contour plot.
Ijerph 18 05838 g012
Figure 13. Recurrence plots for various groups: (a) healthy controls, (b) HRHT, and (c) LRHT.
Ijerph 18 05838 g013
Figure 14. Proposed cloud based model.
Ijerph 18 05838 g014
Table 1. Classification of HT based on office blood pressure measurement [1].
CategorySystolic (mm Hg) Diastolic (mm Hg)
Normal BP<130and<85
High-normal BP130–139and/or85–89
Grade 1 hypertension140–149and/or90–99
Grade 2 hypertension≥160and/or≥100
Table 2. All details used in HT diagnosis from ECG signal.
S No.Author/YearSignalFeatureMethodSubjectDatabaseResults
1Rajput et al. [2019] [8]ECGSignal fractal dimension and Log energyWavelet decomposition using FB, feature extraction, student-t test, developed index139SHAREE100 % discrimination of LRHT, HRHT
2Soh et al. [2020] [2]ECG18, non-linearEMD is used to decomposed ECG signal up-to 5 level using IMF, feature extraction, student t-test and then used supervised KNN classifier157SHAREE, MIT-BIHACC = 97.70% , SEN =  98.90%, SPE =  89.10%
3Rajput et al. [2020] [23]ECGSeEn and WlEnWavelet decomposition using FB, feature extraction, used EBT classifier to classify severity of HT191SHAREE, PTBACC = 99.95%, SEN = 98.64%, SPE = 99.91%, F1 = 97.3% AUC = 1
4Liang et al. [2018] [35]ECG, PPGRatio, Slope, Power area, waveform area, VPG and APG, Time span, PPG amplitude, PAT FeatureClassification of HT121MIMICSEN = 94.26%, SPE = 96.17%, F1 = 94.84%
5Soh et al. [2020] [24]ECGTotal 1507Classification using CNN, DL model157SHAREE, MIT-BIHACC = 99.99%, SEN = 100%, SPE = 99.97%
6Jain et al. [2020] [25]ECG11 layer CNNClassification using CNN, DL model191SHAREEACC = 99.68%
7Present studyECGHOS, bispectrum, Cumulant, RQADirect feature extraction and classification191SHAREE, PTBACC = 98.05%, SEN = 95.66%, SPE = 96.58%
Table 3. All details used in HT diagnosis from HRV and BCG signals.
S No.Author/YearSignalFeatureMethodSubjectDatabaseResults
1Melillo et al. [2015] [16]HRVPP ( SD1 and SD2), CD, DFA (features: Alpha1,Alpha2), and RP and HRVStatistical analysis139SHAREEACC = 85.7%, SEN = 71.4%, SPE = 87.8%
2Ni et al. [2019] [13]HRV18 HRV multidimensional featuresWavelet transform,139SHAREEAUC = 0.95
3Y.song et al. [2015] [33]HRV, BCGHRV time and frequency domain feature and DFAEEMD, data-mining, DFA18PrivateACC = 92.3%
4Poddar et al. [2014] [37]HRVNonlinear parameters of PP, ApEn and SeEn and HRV time and frequency domain featureClassification of HRV113PrivateACC = 100%, SEN = 100%, SPE = 100%
5Natrajan et al.[2014] [18]HRVHRV featureStatistical analysis using SPSS60PrivateHRV reduce in HT subjects
6Ni et al. [2017] [30]HRVApEn and SeEn and HRV time and frequency domain featureClassification of HRV signal24PrivateACC = 93.3%
7Poddar et al. [2019] [29]HRVHRV time and frequency domain featureClassification of HRV185PrivateACC = 96.7%
8Koichub et al. [2018] [38]HRVHRV time and frequency domain feature, CDStatistical analysis56PrivateHRV decreased in HT group
9Tejera et al. [2011] [27]HRVLZ, and SeEn, HRV time and frequency domain featureANN568PrivateSPE = 90% , AUC = 0.98
10Mussalo et al. [2008] [32]HRVHRV time and frequency domain featureStatistical analysis using SPSS97PrivateLF, HF power decrease in SEHT group
11Liu et al. [2019] [21]HRV, BCGHRV time and frequency domain feature, SeEn, DFA, BCG fluctuation featuresClassification, feature extraction, selection, identification of HT128Open sourceACC = 84.4%, PRE = 82.5%, REC = 85.3%
12Kublanov et al. [2017] [31]HRV, ECGCWT, HRV featureClassification of HT71PrivateScore = 91.33% ± 1.73
13Alkhodari et al. [2020] [26]HRVHRV featureLow and high-risk HT139SHAREEACC = 97.08%
Table 4. All details used in HT diagnosis from PPG signal.
S No.Author/YearSignalFeatureMethodSubjectDatabaseResults
1Liang et al. [2018] [34]PPGCWTClassification using Pre-trained CNN (GoogLeNet, 144 layer)121MIMICF1-score = 92.55%
2Liang et al. [2018] [20]PPGRatio, Slope, Power area, waveform area, VPG and APG, Time span, PPG amplitudeClassification of HT124PrivatePP = 100%, SE = 85.71%, F1-score = 92.31%
3Lan et al. [2018] [15]PPG, HRVHRV time and frequency domain featureData mining43PrivateACC = 85.47%, SPE = 83.33%, PRE = 92.11%
4Ghose et al. [36]PPG , HRVMean, SD, min and max, HRV time and frequency domain featureClassification of HT20PrivateF1-score = 83%
Table 5. Summary of bispectrum features (mean ± standard deviation) values obtained for three classes.
BispectrumLRHTHRHTHC
N B E 1 0.927 ± 0.0440.866 ± 0.0760.582 ± 0.237
N B S E 0.707 ± 0.1610.538 ± 0.1810.097 ± 0.11
W C O B 1 m 3324 ± 13692297 ± 1170714 ± 820
W C O B 2 m 1524 ± 733846 ± 620333 ± 387
M 1 1.9 × 10 8 ± 1.4× 10 7 1.8 × 10 8 ± 1.3 × 10 7 10 8 ± 1.4× 10 7
M 2 40,873 ± 294638,718 ± 274363,642 ± 2803
M 3 9.7× 10 7 ± 7× 10 6 8.9× 10 7 ± 6× 10 6 1.5× 10 8 ± 7× 10 6
mAmp4.3× 10 9 ± 4× 10 10 9.6× 10 9 ± 3.5× 10 9 7.7× 10 14 ± 1.8× 10 15
P h e 3.58 ± 0.000283.58 ± 0.000483.56 ± 0.063
Table 6. Summary of RQA features (mean ± standard deviation) values obtained for three classes.
RQALRHTHRHTHC
RR 10 4 ± 7× 10 5 10 4 ± 8 × 10 5 10 4 ± 1× 10 5
DET0.375 ± 0.09280.483 ± 0.1380.508 ± 0.0972
ENT0.486 ± 0.1120.628 ± 0.1900.662 ± 0.143
LMR2.448 ± 0.4072.685 ± 0.8682.748 ± 0.289
Table 7. HOS cumulant second, third, and fourth order features computed (mean ± standard deviation) values obtained for three classes.
HOS FeatureLRHTHRHTHC
Cumulant 2 125.23 ± 432.9193.42 ± 176.32 10 5 ± 2× 10 6
Cumulant 3 17.232 ± 4269.5−1111.3 ± 4534−8 × 10 8 ± 7× 10 9
Cumulant 4 92,476 ± 1 × 10 6 10 5 ± 5 × 10 5 10 12 ± 6 × 10 13
Table 8. Confusion matrix with SVM classifier using HOS bispectrum, cumulant and RQA features.
HCHRHTLRHT
HC7901
HRHT039349
LRHT0223150
Table 9. Performance parameters obtained using HOS bispectrum, cumulants and RQA features with SVM classifier.
ClassAccuracy%Sensitivity%Specificity%F1-Score%
HC99.9798.7510099.37
HRHT98.0788.8799.3291.71
LRHT98.0599.3090.4298.87
Table 10. Summary of classification performance obtained using various combination of features.
S.NoFeatureAccuracy %AUCClassifier
1HOS cumulant order2,3,490.20.99EBT
2HOS bispectrum96.30.99KNN
3RQA91.01.00EBT
4bispectrum, Cumulant, RQA98.051.00SVM
4SeEn84.30.74TREE
5WeEn88.00.96TREE
6ApEn81.80.94EBT
7ReEn78.90.88EBT
8SeEn, WeEn, ApEN, ReEn89.10.97EBT
9SLFD87.10.96SVM
10HE87.80.92SVM
11LLE82.40.86NB
13SLFD, HE, LLE,88.10.97EBT
15LOGE86.40.94TREE
16SeEn, WeEn, ApEN, ReEn, SLFD, HE, LLE, LOGE95.50.99EBT
Table 11. Summary of works carried out on automated detection of HT diagnosis.
S No.Author/YearType of MLClassifier
1Soh et al. [2020] [2]Supervised MLKNN
2Melillo et al. [2015] [16]Supervised MLAB, NB, RF, SVM
3Ni et al. [2019] [13]Supervised MLSVM,RF,NB
4Song et al. [2015] [33]Supervised MLSVM, RF, KNN
5Poddar et al. [2014] [37]Supervised MLSVM
6Ni et al. [2017] [30]Supervised MLLinear SVM
7Poddar et al. [2019] [29]Supervised MLSVM, KNN
8Tejera et al. [2011] [27]ANNANN
9Rajput et al. [2020] [23]Supervised MLKNN, SVM, TREE, and EBT
10Liu et al. [2019] [21]Supervised MLSVM, DT, NB
11Liang et al. [2018] [34]DLCNN, GoogLeNet
12Liang et al. [2018] [20]Supervised MLLDA, SVM, KNN, LR
13Liang et al. [2018] [35]Supervised MLAB, KNN, EBT, LR
14Lan et al. [2018] [15]Semi-supervised learning-
15Ghose et al. [36]Supervised MLAB, KNN, EBT, DT, RF, NB, SVM
16Kublanov et al. [31]Supervised MLLDA, SVM, KNN, NB, DT
17Soh et al. [2020] [24]DL modelCNN
18Jain et al. [2020] [25]DL model
19Alkhodari et al. [2020] [26]MLRUSBOOST, TREE, SVM
20Present studySupervised MLKNN, EBT, SVM
Table 12. Abbreviation used in the review study.
AbbreviationFull FormAbbreviationFull Form
SLFDSignal fractal dimensionsLOGELog energy
LLELargest Lyapunov ExponentHOSHigher order spectral
OGWBOrthogonal wavelet filter bank
HTHypertensionSBPSystolic blood pressure
HRVHeart rate variabilityDBPDiastolic blood pressure
ECGElectrocardiographyDWTDiscrete Wavelet Transform
PPGPhotoplethysmographyBCGBallistocardiogram
LVHleft ventricular hypertrophyVGventricular gradient
PPGPhotoplethysmographyHDIHypertension diagnosis index
MLMachine learning
DLDeep LearningANNArtificial Neural Network
CNNConvolution neural networkRNNRecurrent Nural Network
SVMSupport vector machineKNNK-nearest neighbour
CWTContinuous Wavelet TransformFFTFast Fourier transform
ANOVAAnalysis of varianceROCReceiver operating characteristics
EBTEnsemble Bagged TreeABAda boost
LRLogistic RegressionNBNavy Bayes
RFRandom ForrestLRALinear Regression Analysis
SeEnSample entropyApEnApproximate entropy
ReEnReny entropyWlEnWavelet entropy
DFADetrended fluctuation analysisCDCorrelation Dimension
LZLempel-Ziv complexityRCRecurrence Plot
PPPoincare plotEMDEmpirical Mode Decomposition
VPGVelocity plethysmogramAPGAcceleration plethysmogram
PATPulse arrival timeINVDInverse dower
ACCAccuracySPESpecificity
SENSensitivityPREPrecision
RECRecallAUCArea under the curve
PPVPositive predictive valueNPVNegative Predictive Value
SPSSStatistical Package for the Social SciencesMANOVAMultivariate analysis of variance MANOVA
PRISMAPreferred reporting items for systematic reviews and meta-analysesHRHTHigh-risk hypertension
RUSBOOSTrandom under-sampling boostingKNNK-nearest neighbour
HCHealthy controlLRHTLow-risk hypertension
DTDecision treeLDALinear Discriminate analysis
Publisher’s Note: MDPI stays neutral with regard to jurisdictional claims in published maps and institutional affiliations.

