A Combined Model of SARIMA and Prophet Models in Forecasting AIDS Incidence in Henan Province, China
Abstract
:1. Introduction
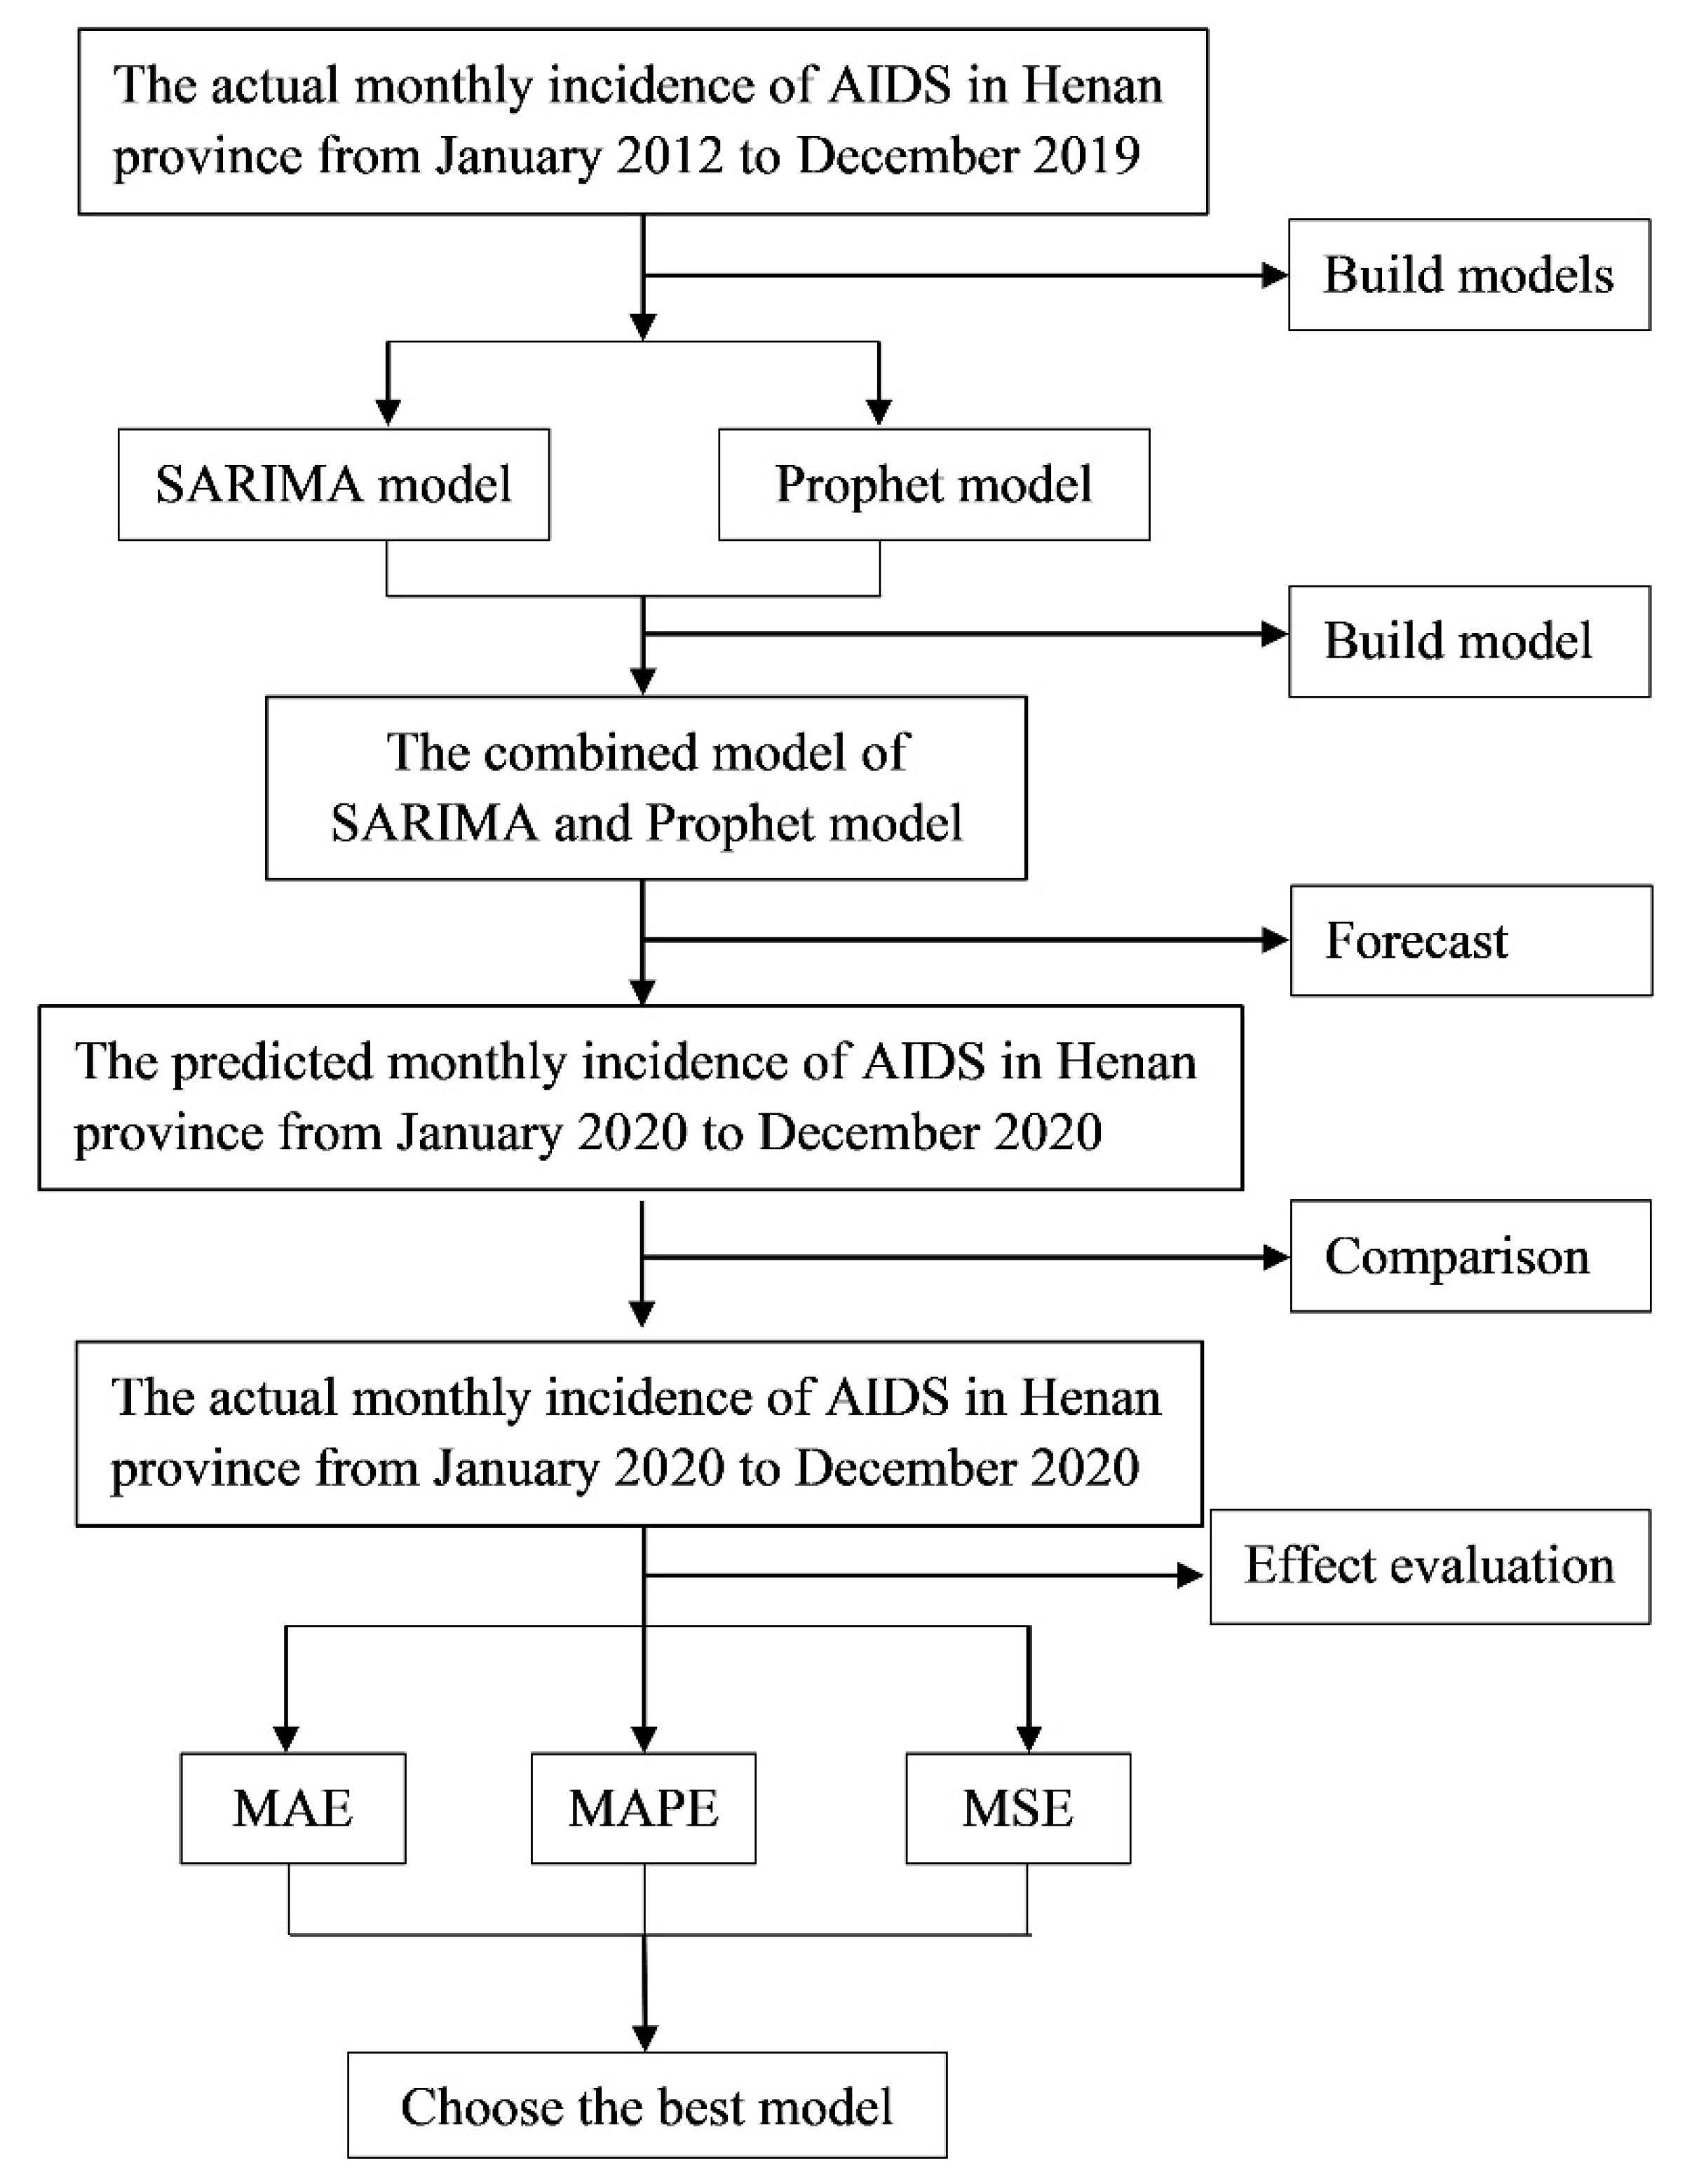
2. Methods
2.1. Data Sources
2.2. SARIMA Model
2.3. Prophet Model
2.4. The Combined Model Based on L1-Norm
2.5. Model Evaluation
2.6. Data Processing and Analysis
3. Results
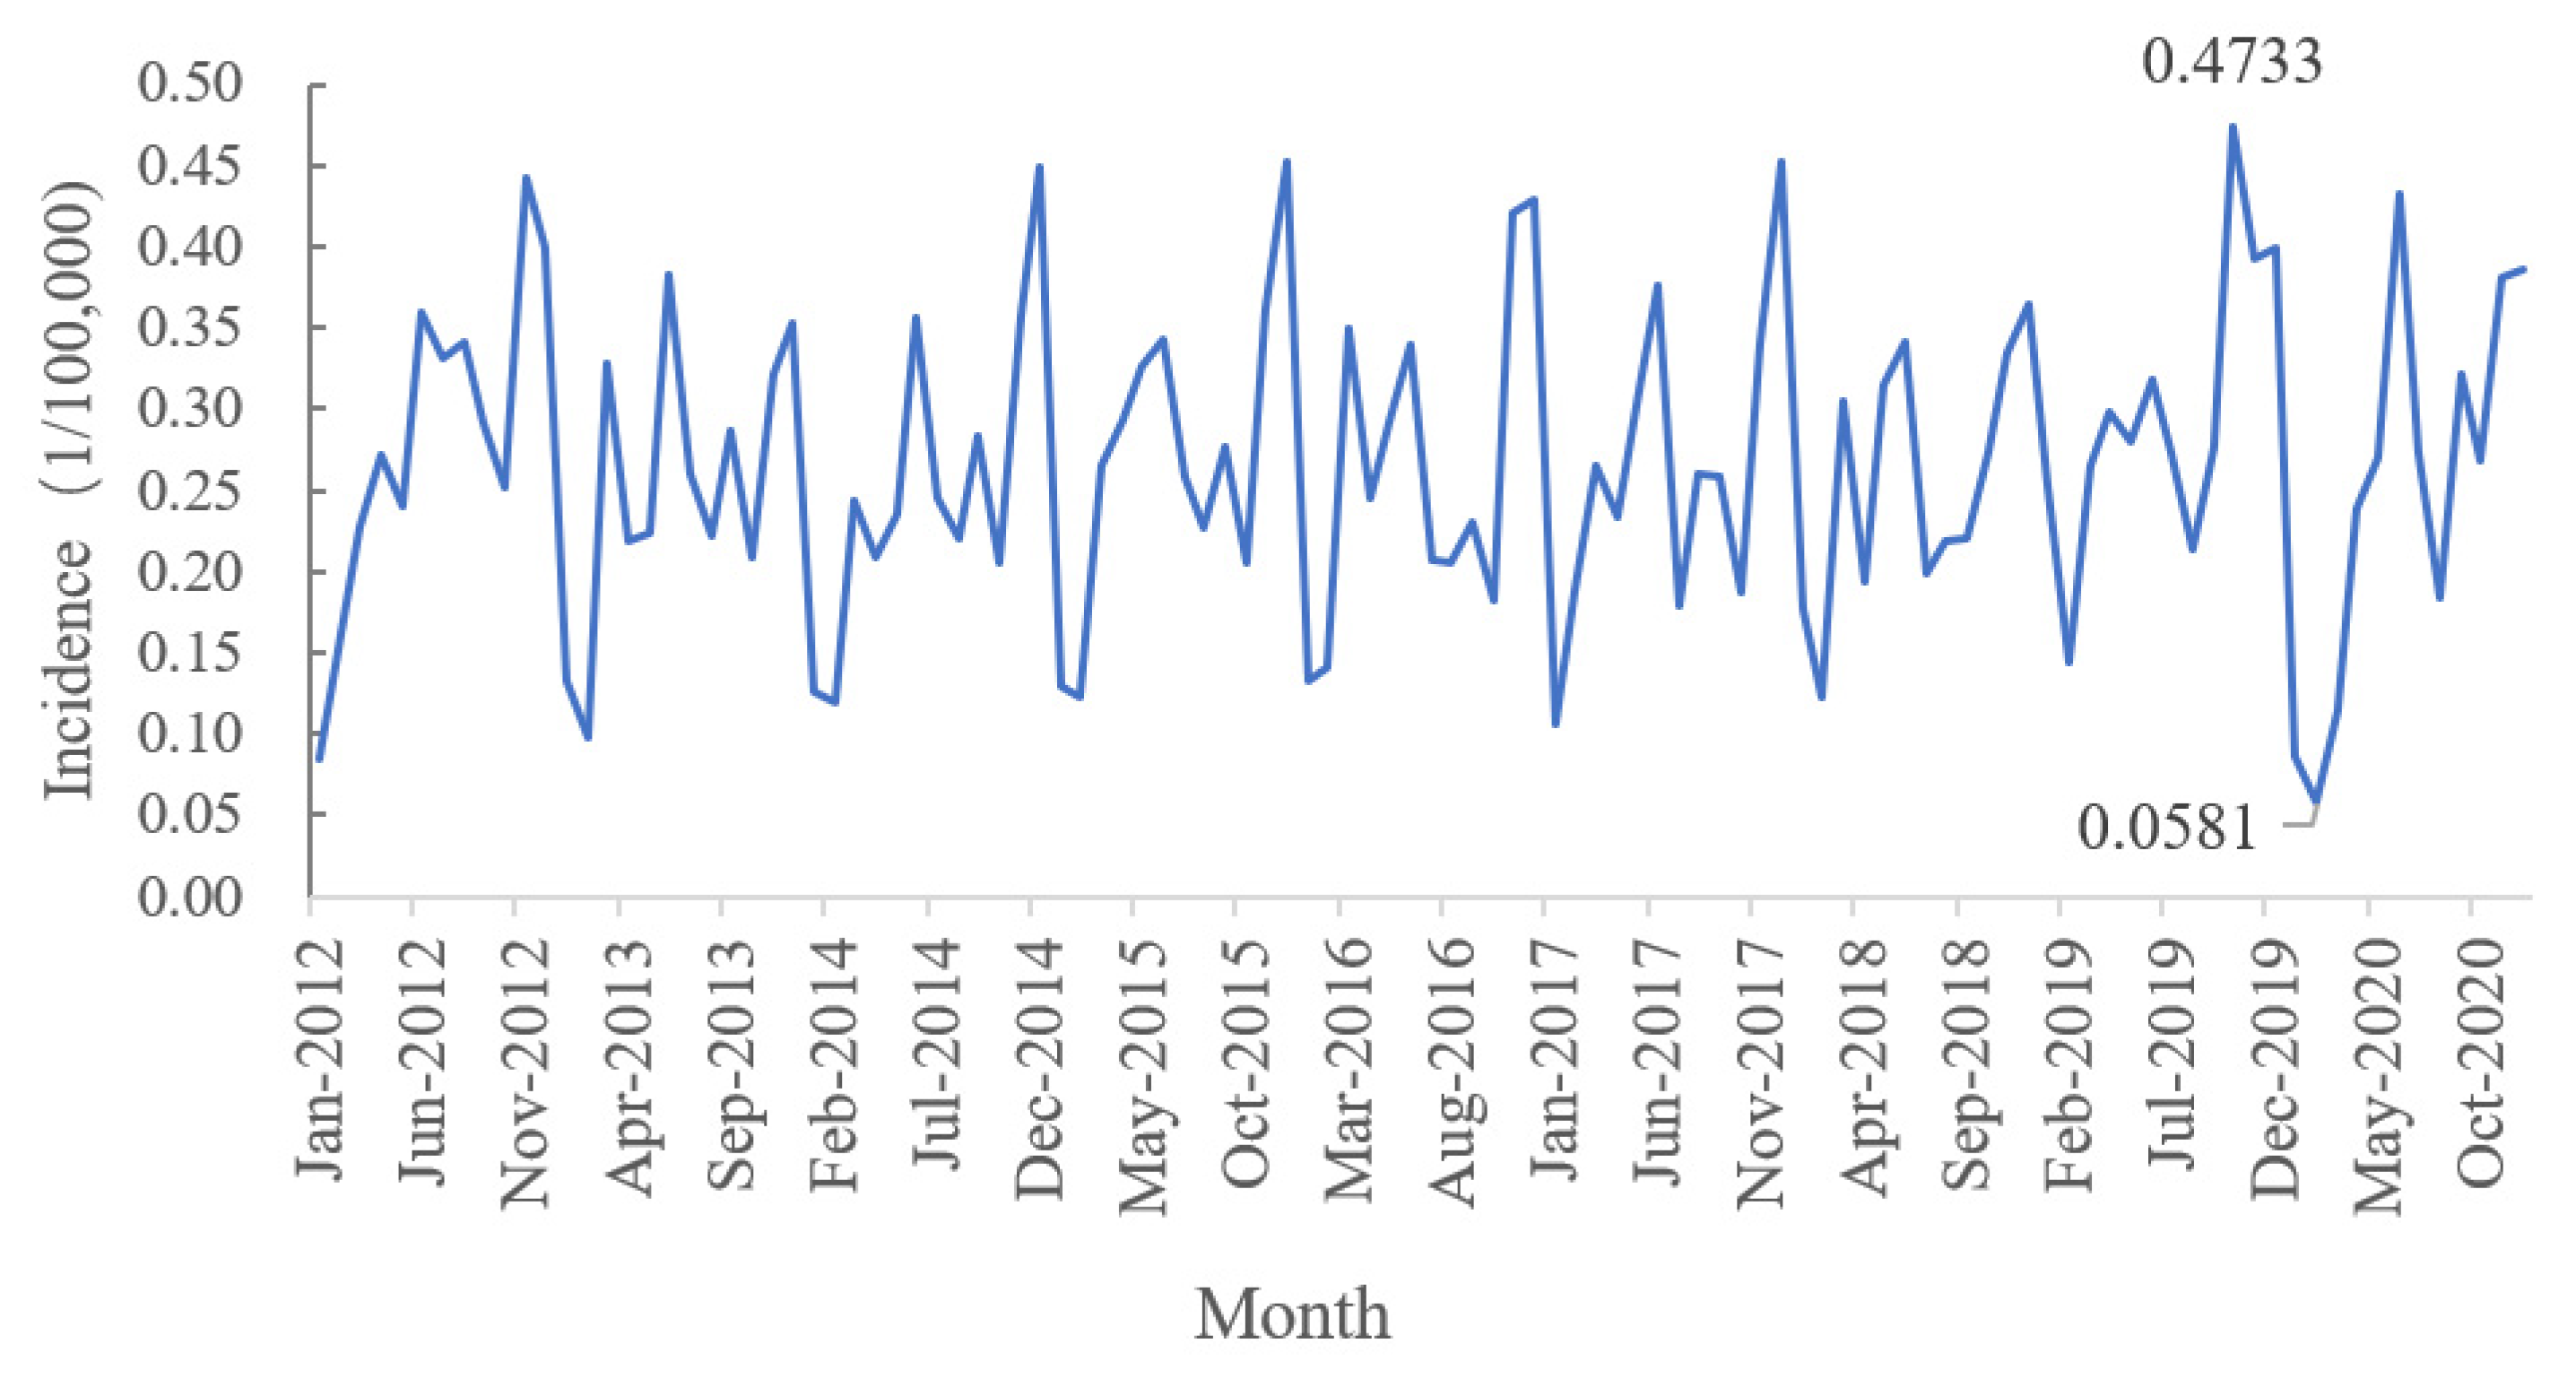
3.1. Trends of AIDS in Henan Province
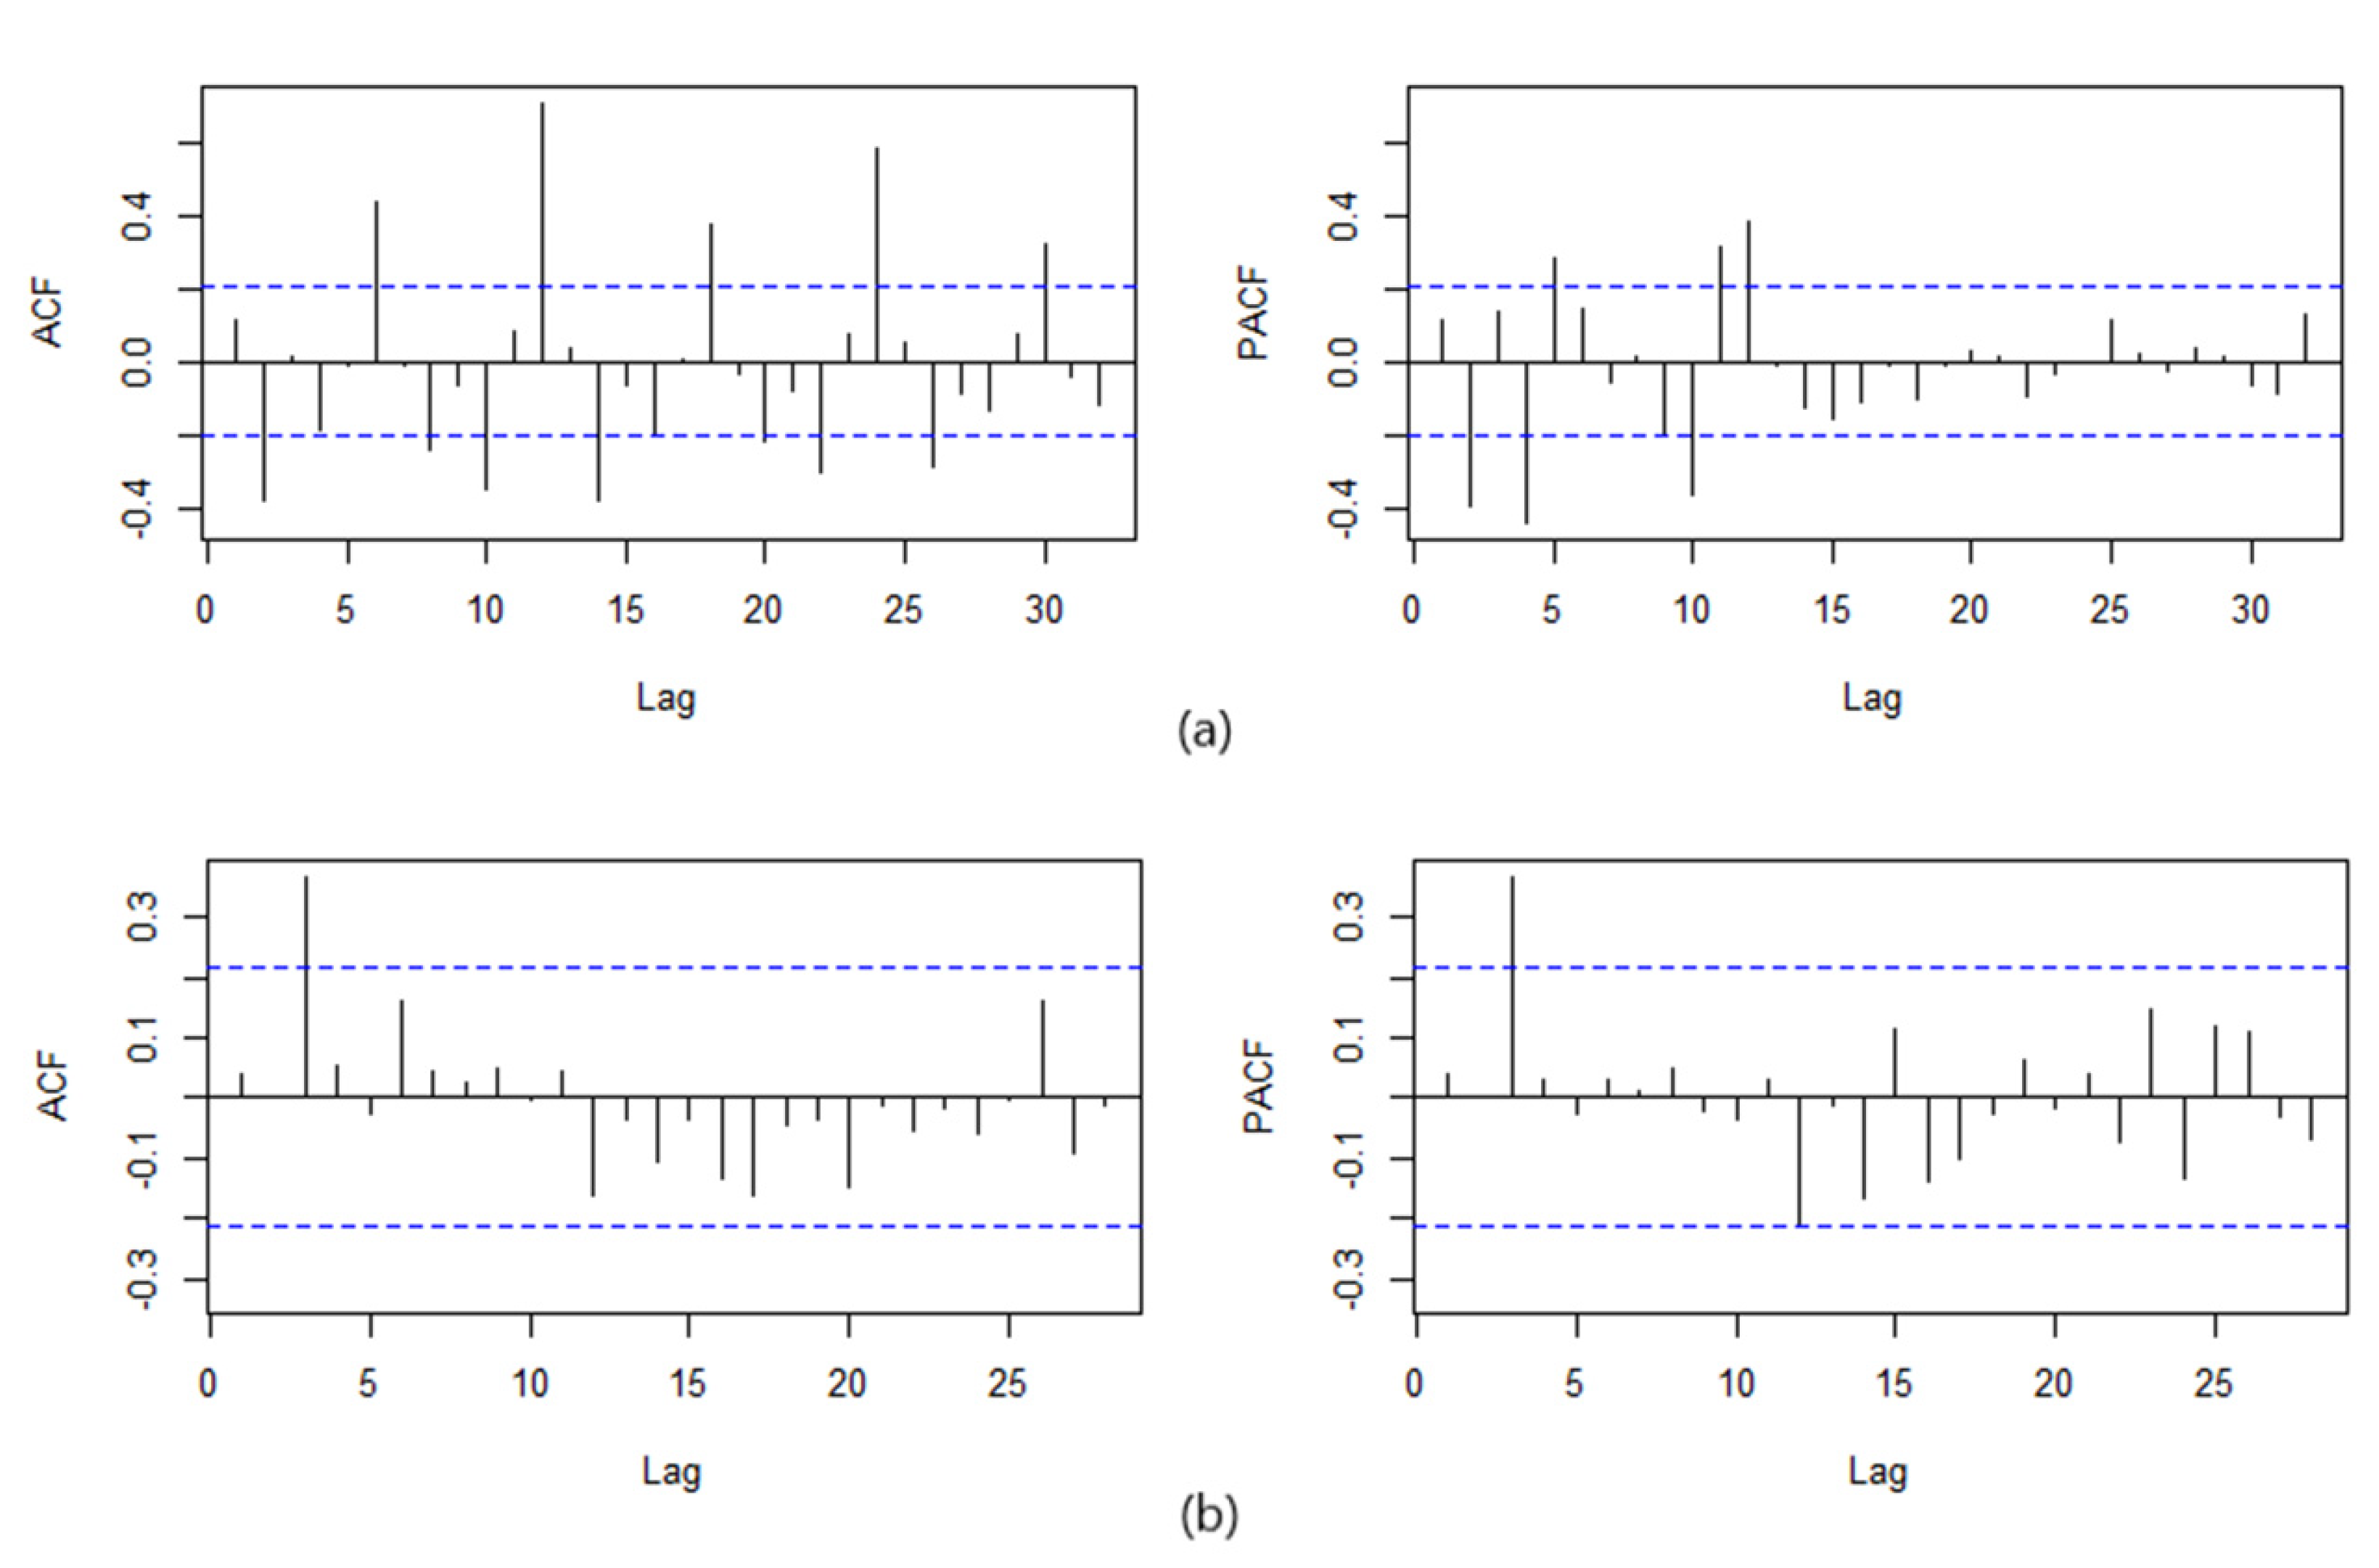
3.2. SARIMA Models
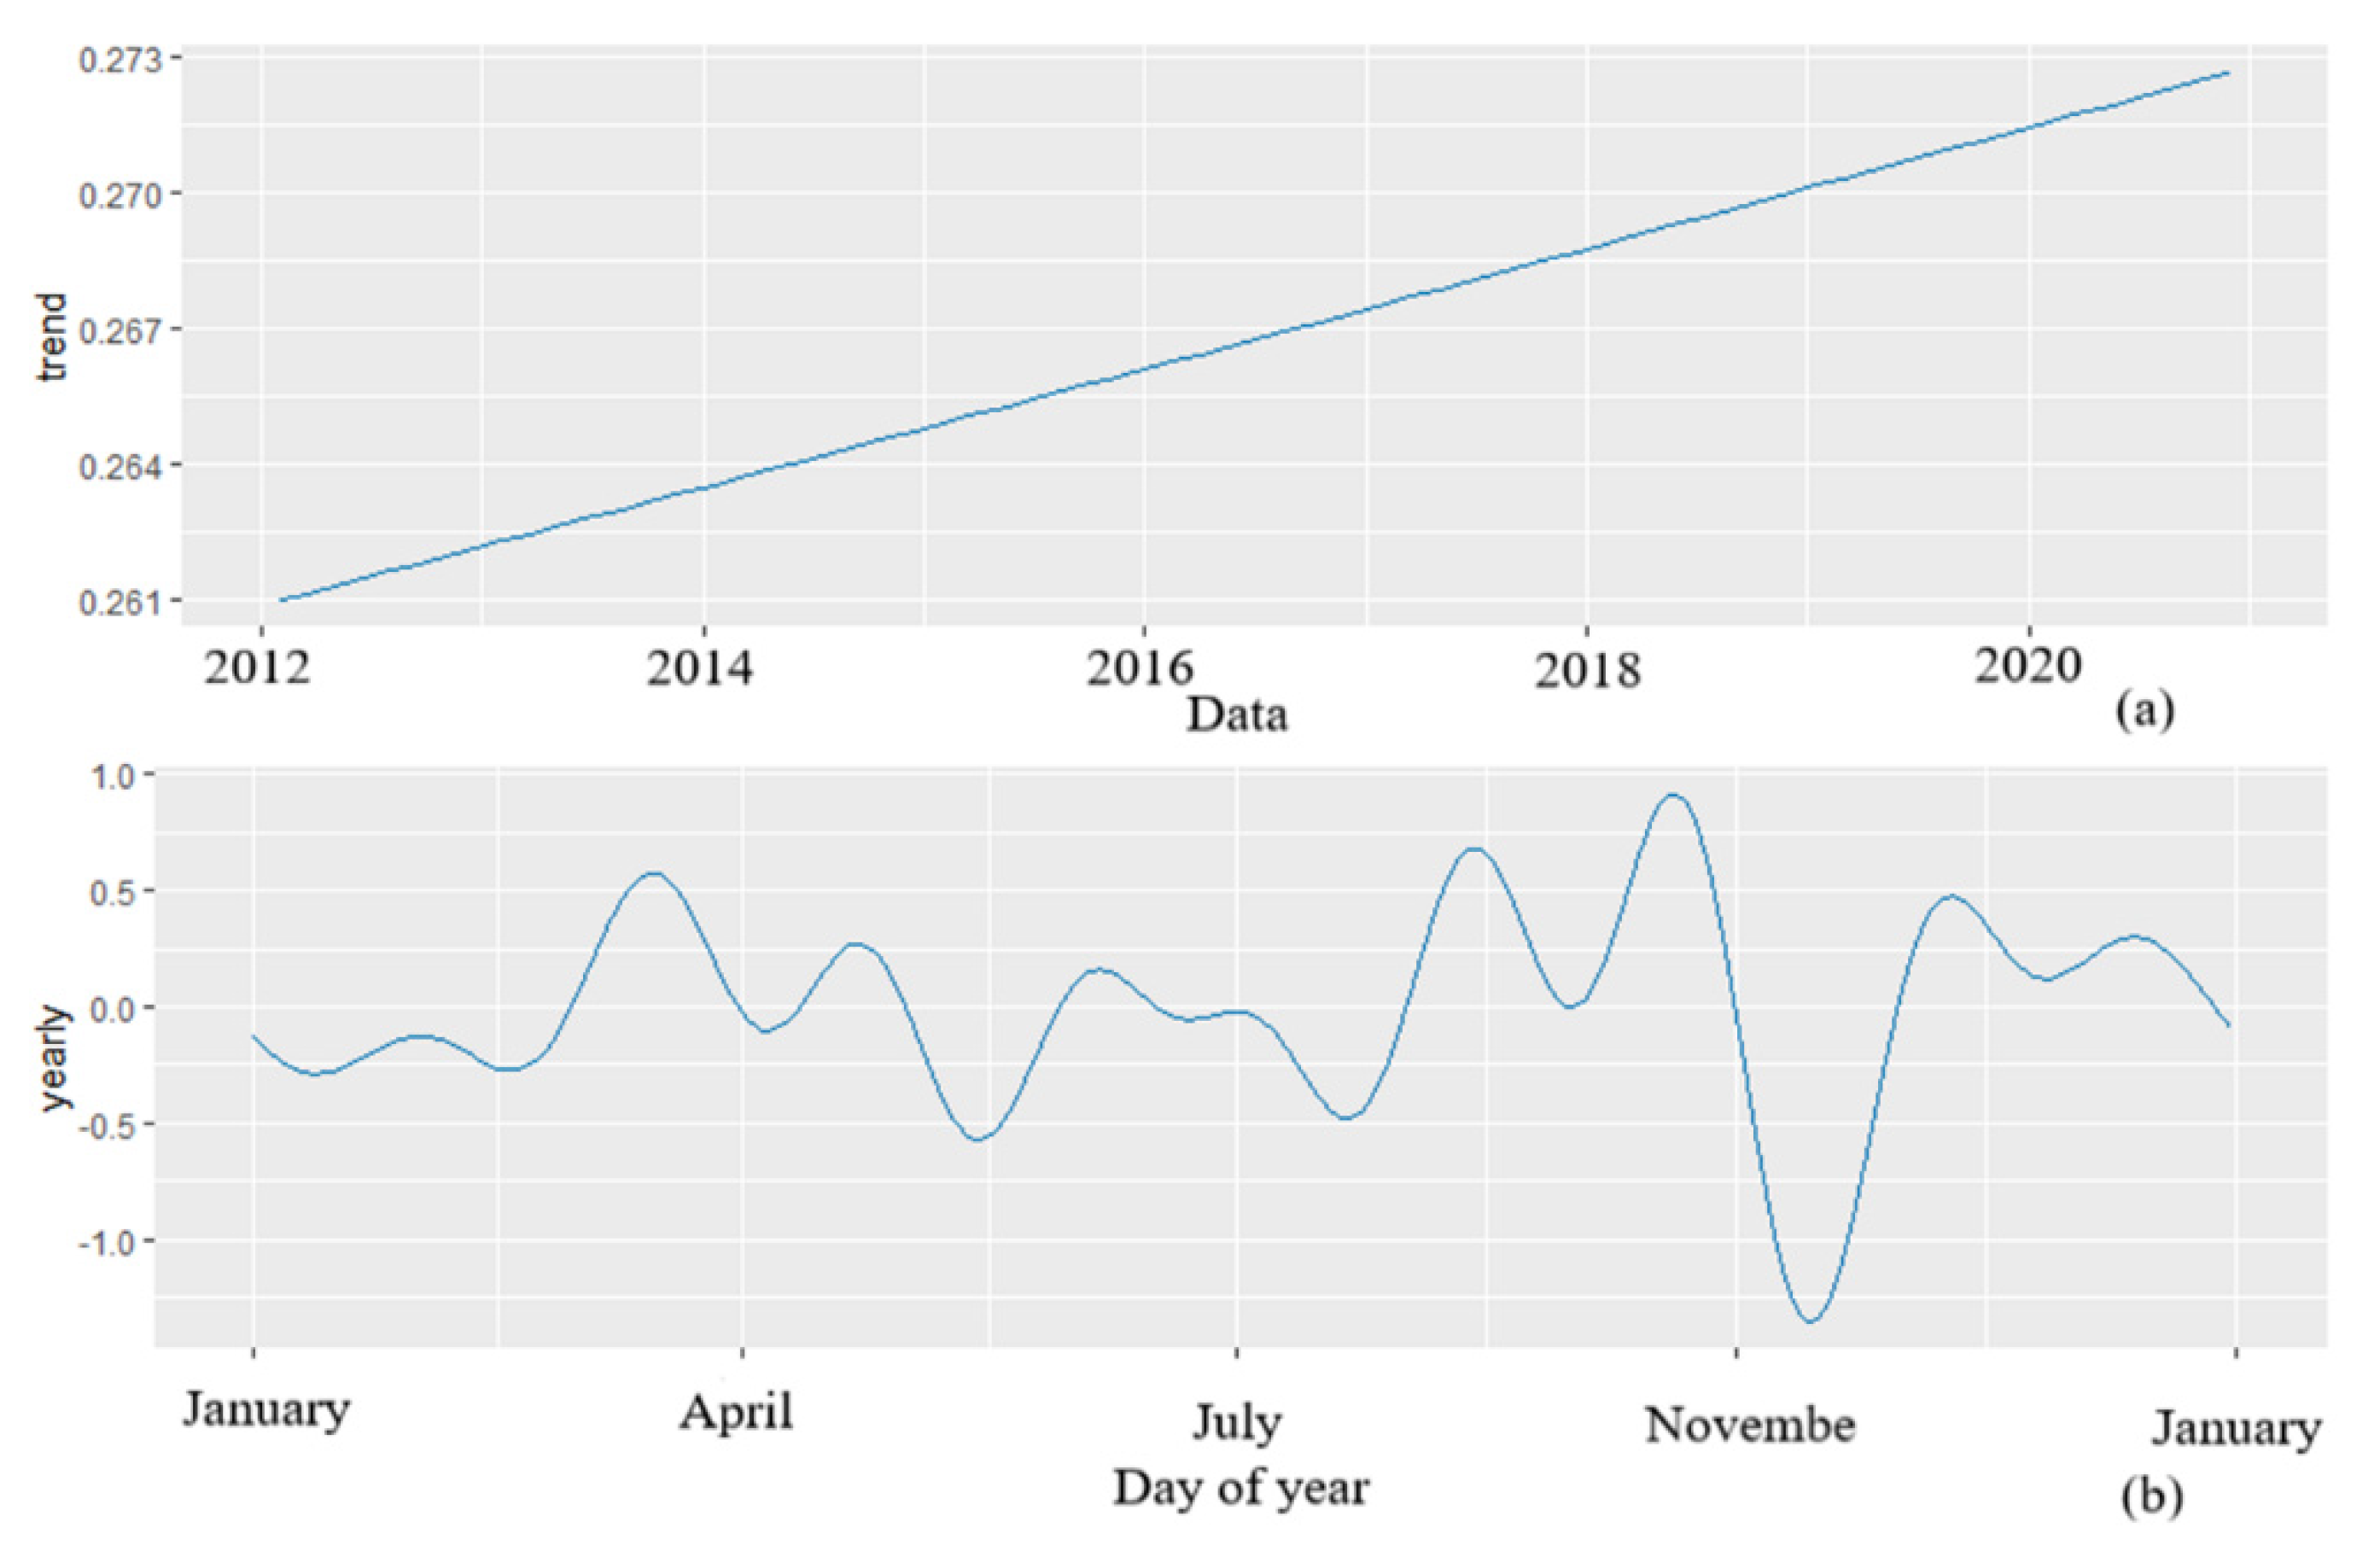
3.3. Prophet Model
3.4. The Combined Model
3.5. Model Evaluation
4. Discussion
5. Conclusions
Author Contributions
Funding
Institutional Review Board Statement
Informed Consent Statement
Data Availability Statement
Acknowledgments
Conflicts of Interest
References
- Joint United Nations Programme on HIV/AIDS. Available online: https://www.unaids.org/en (accessed on 1 April 2021).
- Cao, W.; Hsieh, E.; Li, T. Optimizing Treatment for Adults with HIV/AIDS in China: Successes over Two Decades and Remaining Challenges. Curr. HIV AIDS Rep. 2020, 17, 26–34. [Google Scholar] [CrossRef] [PubMed] [Green Version]
- Beach, M.V. “Blood heads” and AIDS haunt China’s countryside. Lancet 2001, 357, 49. [Google Scholar] [CrossRef]
- Wu, Z.; Liu, Z.; Detels, R. HIV-1 infection in commercial plasma donors in China. Lancet 1995, 346, 61–62. [Google Scholar] [CrossRef]
- Zhang, F.J.; Pan, J.; Yu, L.; Wen, Y.; Zhao, Y. Current progress of China’s free ART program. Cell Res. 2005, 15, 877–882. [Google Scholar] [CrossRef]
- Qiao, Y.C.; Xu, Y.; Jiang, D.X.; Wang, X.; Wang, F.; Yang, J.; Wei, Y.S. Epidemiological analyses of regional and age differences of HIV/AIDS prevalence in China, 2004–2016. Int. J. Infect. Dis. 2019, 81, 215–220. [Google Scholar] [CrossRef] [Green Version]
- Health Commission of Henan Province. Available online: http://wsjkw.henan.gov.cn/ (accessed on 1 April 2021).
- Zang, X.; Krebs, E.; Wang, L.; Marshall, B.D.; Granich, R.; Schackman, B.R.; Montaner, J.S.; Nosyk, B. Structural Design and Data Requirements for Simulation Modelling in HIV/AIDS: A Narrative Review. PharmacoEconomics 2019, 37, 1219–1239. [Google Scholar] [CrossRef]
- Wang, G.; Wei, W.; Jiang, J.; Ning, C.; Chen, H.; Huang, J.; Liang, B.; Zang, N.; Liao, Y.; Chen, R.; et al. Application of a long short-term memory neural network: A burgeoning method of deep learning in forecasting HIV incidence in Guangxi, China. Epidemiol. Infect. 2019, 147, e194. [Google Scholar] [CrossRef] [Green Version]
- Li, Z.; Li, Y. A comparative study on the prediction of the BP artificial neural network model and the ARIMA model in the incidence of AIDS. BMC Med. Inform. Decis. Mak. 2020, 20, 143. [Google Scholar] [CrossRef]
- Cao, L.T.; Liu, H.H.; Li, J.; Yin, X.D.; Duan, Y.; Wang, J. Relationship of meteorological factors and human brucellosis in Hebei province, China. Sci. Total Environ. 2020, 703, 135491. [Google Scholar] [CrossRef]
- Malki, Z.; Atlam, E.S.; Ewis, A.; Dagnew, G.; Alzighaibi, A.R.; Elmarhomy, G.; Elhosseini, M.A.; Hassanien, A.E.; Gad, I. ARIMA models for predicting the end of COVID-19 pandemic and the risk of second rebound. Neural Comput. Appl. 2020, 33, 2929–2948. [Google Scholar] [CrossRef]
- Elsheikh, A.H.; Saba, A.I.; Abd Elaziz, M.; Lu, S.; Shanmugan, S.; Muthuramalingam, T.; Kumar, R.; Mosleh, A.O.; Essa, F.A.; Shehabeldeen, T.A. Deep learning-based forecasting model for COVID-19 outbreak in Saudi Arabia. Process Saf. Environ. Prot. Trans. Inst. Chem. Eng. Part B 2021, 149, 223–233. [Google Scholar] [CrossRef] [PubMed]
- Taylor, S.J.; Letham, B. Forecasting at Scale. Am. Stat. 2018, 72, 37–45. [Google Scholar] [CrossRef]
- Talkhi, N.; Akhavan Fatemi, N.; Ataei, Z.; Jabbari Nooghabi, M. Modeling and forecasting number of confirmed and death caused COVID-19 in IRAN: A comparison of time series forecasting methods. Biomed. Signal Process. Control 2021, 66, 102494. [Google Scholar] [CrossRef] [PubMed]
- Tulshyan, V.; Sharma, D.; Mittal, M. An Eye on the Future of COVID-19: Prediction of Likely Positive Cases and Fatality in India over a 30-Day Horizon Using the Prophet Model. Disaster Med. Public Health Prep. 2020, 18, 1–7. [Google Scholar] [CrossRef] [PubMed]
- Reich, N.G.; McGowan, C.J.; Yamana, T.K.; Tushar, A.; Ray, E.L.; Osthus, D.; Kandula, S.; Brooks, L.C.; Crawford-Crudell, W.; Gibson, G.C.; et al. Accuracy of real-time multi-model ensemble forecasts for seasonal influenza in the U.S. PLoS Comput. Biol. 2019, 15, e1007486. [Google Scholar] [CrossRef] [Green Version]
- English, T.M. Stacked generalization and simulated evolution. Bio Syst. 1996, 39, 3–18. [Google Scholar] [CrossRef]
- Zhu, S.; Yang, L.; Wang, W.; Liu, X.; Lu, M.; Shen, X. Optimal-combined model for air quality index forecasting: 5 cities in North China. Environ. Pollut. 2018, 243, 842–850. [Google Scholar] [CrossRef]
- Yamana, T.K.; Kandula, S.; Shaman, J. Individual versus superensemble forecasts of seasonal influenza outbreaks in the United States. PLoS Comput. Biol. 2017, 13, e1005801. [Google Scholar] [CrossRef] [Green Version]
- Kwak, N. Principal component analysis based on l1-norm maximization. IEEE Trans. Pattern Anal. Mach. Intell. 2008, 30, 1672–1680. [Google Scholar] [CrossRef]
- Wang, C.; Ye, Q.; Luo, P.; Ye, N.; Fu, L. Robust capped L1-norm twin support vector machine. Neural Netw. Off. J. Int. Neural Netw. Soc. 2019, 114, 47–59. [Google Scholar] [CrossRef]
- Wu, D.; Shang, M.; Luo, X.; Wang, Z. An L₁-and-L₂-Norm-Oriented Latent Factor Model for Recommender Systems. IEEE Trans. Neural Netw. Learn. Syst. 2021, 22, 1–14. [Google Scholar] [CrossRef] [PubMed]
- Wang, B.; Jiang, Q.; Jiang, P. A combined forecasting structure based on the L(1) norm: Application to the air quality. J. Environ. Manag. 2019, 246, 299–313. [Google Scholar] [CrossRef] [PubMed]
- Tobias, A.; Díaz, J.; Saez, M.; Alberdi, J.C. Use of poisson regression and box-jenkins models to evaluate the short-term effects of environmental noise levels on daily emergency admissions in Madrid, Spain. Eur. J. Epidemiol. 2001, 17, 765–771. [Google Scholar] [CrossRef] [PubMed]
- Bas, M.D.; Ortiz, J.; Ballesteros, L.; Martorell, S. Evaluation of a multiple linear regression model and SARIMA model in forecasting (7)Be air concentrations. Chemosphere 2017, 177, 326–333. [Google Scholar] [CrossRef] [PubMed]
- Xia, Y.; Liao, C.; Wu, D.; Liu, Y. Dynamic Analysis and Prediction of Food Nitrogen Footprint of Urban and Rural Residents in Shanghai. Int. J. Environ. Res. Public Health 2020, 17, 1760. [Google Scholar] [CrossRef] [PubMed] [Green Version]
- Devaraj, J.; Elavarasan, R.M.; Pugazhendhi, R.; Shafiullah, G.M.; Ganesan, S.; Jeysree, A.K.; Khan, I.A.; Hossain, E. Forecasting of COVID-19 cases using deep learning models: Is it reliable and practically significant? Results Phys. 2021, 21, 103817. [Google Scholar] [CrossRef]
- Brown, L.B.; Spinelli, M.A.; Gandhi, M. The interplay between HIV and COVID-19: Summary of the data and responses to date. Curr. Opin. HIV AIDS 2021, 16, 63–73. [Google Scholar] [CrossRef]
- Anonymous. How to stop COVID-19 fuelling a resurgence of AIDS, malaria and tuberculosis. Nature 2020, 584, 169. [Google Scholar] [CrossRef]
- Xu, B.; Li, J.; Wang, M. Epidemiological and time series analysis on the incidence and death of AIDS and HIV in China. BMC Public Health 2020, 20, 1906. [Google Scholar] [CrossRef]
- Mao, Q.; Zhang, K.; Yan, W.; Cheng, C. Forecasting the incidence of tuberculosis in China using the seasonal auto-regressive integrated moving average (SARIMA) model. J. Infect. Public Health 2018, 11, 707–712. [Google Scholar] [CrossRef]
- Lu, J.; Meyer, S. Forecasting Flu Activity in the United States: Benchmarking an Endemic-Epidemic Beta Model. Int. J. Environ. Res. Public Health 2020, 17, 1381. [Google Scholar] [CrossRef] [PubMed] [Green Version]
- Adesoye Idowu Abioye, M.D.U.; Peter, O.J.; Edogbanya, H.O.; Oguntolu, F.A.; Kayode, O.; Amadiegwu, S. Forecasting of COVID-19 pandemic in Nigeria using real statistical data. Commun. Math. Biol. Neurosci. 2021, 2021, 2052–2541. [Google Scholar] [CrossRef]
- Dudek, G.; Pelka, P.; Smyl, S. A Hybrid Residual Dilated LSTM and Exponential Smoothing Model for Midterm Electric Load Forecasting. IEEE Trans. Neural Netw. Learn. Syst. 2021, 8, 1–13. [Google Scholar] [CrossRef] [PubMed]
- Shuyu, L.; Xuan, Y.L.R. Forecasting coal consumption in India by 2030: Using linear modified linear (MGM-ARIMA) and linear modified nonlinear (BP-ARIMA) combined models. Sustainability 2019, 11, 695. [Google Scholar] [CrossRef] [Green Version]
- Oshinubi, K.; Rachdi, M.; Demongeot, J. Modeling of COVID-19 Pandemic vis-à-vis Some Socio-Economic Factors. Front. Appl. Math. Stat. 2022, 7, 786983. [Google Scholar] [CrossRef]
- Oshinubi, K.; Rachdi, M.; Demongeot, J. Analysis of Reproduction Number R0 of COVID-19 Using Current Health Expenditure as Gross Domestic Product Percentage (CHE/GDP) across Countries. Healthcare 2021, 9, 1247. [Google Scholar] [CrossRef]


| Model | Estimate | p-Value | Ljung–Box Q Test | AIC | BIC | RMSE | MAPE | ||
|---|---|---|---|---|---|---|---|---|---|
| Statistics | DF | p-Value | |||||||
| SARIMA(0,1,1)(0,1,0)[12] | 19.42 | 17 | 0.305 | −240.68 | −235.87 | 0.050 | 14.008 | ||
| MA1 | −0.868 | <0.001 | |||||||
| SARIMA(0,1,1)(1,1,2)[12] | 14.96 | 15 | 0.454 | −240.51 | −228.48 | 0.046 | 12.249 | ||
| MA1 | −0.882 | <0.001 | |||||||
| SAR1 | −0.780 | <0.001 | |||||||
| SMA1 | 0.567 | 0.046 | |||||||
| SMA2 | −0.433 | 0.044 | |||||||
| SARIMA(1,0,1)(0,1,0)[12] | 19.40 | 16 | 0.249 | −249.89 | −242.63 | 0.048 | 12.411 | ||
| AR1 | −0.777 | <0.001 | |||||||
| MA1 | 1.000 | <0.001 | |||||||
| SARIMA(1,0,1)(0,1,1)[12] | 15.45 | 15 | 0.420 | −253.67 | −244.00 | 0.045 | 11.888 | ||
| AR1 | −0.751 | <0.001 | |||||||
| MA1 | 1.000 | <0.001 | |||||||
| SMA1 | −0.398 | 0.019 | |||||||
| SARIMA(1,0,1)(1,1,0)[12] | 16.85 | 15 | 0.328 | −252.53 | −242.85 | 0.046 | 12.178 | ||
| AR1 | −0.746 | <0.001 | |||||||
| MA1 | 1.000 | <0.001 | |||||||
| SAR1 | −0.297 | 0.025 | |||||||
| SARIMA(1,0,1)(1,1,1)[12] | 13.26 | 14 | 0.506 | −252.07 | −239.98 | 0.045 | 11.754 | ||
| AR1 | −0.759 | <0.001 | |||||||
| MA1 | 1.000 | <0.001 | |||||||
| SAR1 | 0.289 | 0.477 | |||||||
| SMA1 | −0.688 | 0.084 | |||||||
| SARIMA(2,0,2)(0,1,0)[12] | 18.18 | 16 | 0.313 | −247.64 | −235.55 | 0.047 | 12.780 | ||
| AR1 | −1.435 | <0.001 | |||||||
| AR2 | −0.925 | <0.001 | |||||||
| MA1 | 1.581 | <0.001 | |||||||
| MA2 | 1.000 | <0.001 | |||||||
| SARIMA(2,0,2)(0,1,1)[12] | 16.67 | 15 | 0.339 | −251.68 | −237.17 | 0.045 | 12.266 | ||
| AR1 | −1.067 | <0.001 | |||||||
| AR2 | 0.950 | <0.001 | |||||||
| MA1 | 1.907 | <0.001 | |||||||
| MA2 | 0.830 | <0.001 | |||||||
| SMA1 | −0.500 | <0.001 | |||||||
| SARIMA(3,0,0)(0,1,0)[12] | 15.10 | 17 | 0.588 | −256.66 | −246.98 | 0.045 | 12.564 | ||
| AR1 | 0.062 | 0.536 | |||||||
| AR2 | −0.018 | 0.859 | |||||||
| AR3 | 0.469 | <0.001 | |||||||
| Time | Actual Value | Predicted Value | |||
|---|---|---|---|---|---|
| SARIMA(1,0,1)(0,1,1)[12] | Prophet Model | Combined Model Based on L2-Norm | Combined Model Based on L1-Norm | ||
| January-2020 | 0.087 | 0.235 | 0.168 | 0.205 | 0.199 |
| February-2020 | 0.058 | 0.126 | 0.142 | 0.133 | 0.135 |
| March-2020 | 0.114 | 0.289 | 0.305 | 0.296 | 0.298 |
| April-2020 | 0.238 | 0.255 | 0.239 | 0.248 | 0.246 |
| May-2020 | 0.270 | 0.298 | 0.262 | 0.282 | 0.279 |
| June-2020 | 0.432 | 0.326 | 0.369 | 0.345 | 0.349 |
| July-2020 | 0.273 | 0.247 | 0.250 | 0.249 | 0.249 |
| August-2020 | 0.183 | 0.217 | 0.274 | 0.243 | 0.248 |
| September-2020 | 0.322 | 0.262 | 0.273 | 0.267 | 0.268 |
| October-2020 | 0.269 | 0.379 | 0.201 | 0.299 | 0.283 |
| November-2020 | 0.382 | 0.375 | 0.409 | 0.390 | 0.393 |
| December-2020 | 0.387 | 0.397 | 0.423 | 0.409 | 0.411 |
| Model | MSE | MAE | MAPE |
|---|---|---|---|
| SARIMA(1,0,1)(0,1,1)[12] | 0.0073 | 0.0657 | 47.8470 |
| Prophet Model | 0.0060 | 0.0602 | 44.8336 |
| Combined Model based on L2-norm | 0.0060 | 0.057 | 44.1950 |
| Combined Model based on L1-norm | 0.0056 | 0.0553 | 43.5337 |
Publisher’s Note: MDPI stays neutral with regard to jurisdictional claims in published maps and institutional affiliations. |
© 2022 by the authors. Licensee MDPI, Basel, Switzerland. This article is an open access article distributed under the terms and conditions of the Creative Commons Attribution (CC BY) license (https://creativecommons.org/licenses/by/4.0/).
Share and Cite
Luo, Z.; Jia, X.; Bao, J.; Song, Z.; Zhu, H.; Liu, M.; Yang, Y.; Shi, X. A Combined Model of SARIMA and Prophet Models in Forecasting AIDS Incidence in Henan Province, China. Int. J. Environ. Res. Public Health 2022, 19, 5910. https://doi.org/10.3390/ijerph19105910
Luo Z, Jia X, Bao J, Song Z, Zhu H, Liu M, Yang Y, Shi X. A Combined Model of SARIMA and Prophet Models in Forecasting AIDS Incidence in Henan Province, China. International Journal of Environmental Research and Public Health. 2022; 19(10):5910. https://doi.org/10.3390/ijerph19105910
Chicago/Turabian StyleLuo, Zixiao, Xiaocan Jia, Junzhe Bao, Zhijuan Song, Huili Zhu, Mengying Liu, Yongli Yang, and Xuezhong Shi. 2022. "A Combined Model of SARIMA and Prophet Models in Forecasting AIDS Incidence in Henan Province, China" International Journal of Environmental Research and Public Health 19, no. 10: 5910. https://doi.org/10.3390/ijerph19105910
APA StyleLuo, Z., Jia, X., Bao, J., Song, Z., Zhu, H., Liu, M., Yang, Y., & Shi, X. (2022). A Combined Model of SARIMA and Prophet Models in Forecasting AIDS Incidence in Henan Province, China. International Journal of Environmental Research and Public Health, 19(10), 5910. https://doi.org/10.3390/ijerph19105910


