
Forecasting and Surveillance of COVID-19 Spread Using Google Trends: Literature Review

Abstract
:1. Introduction
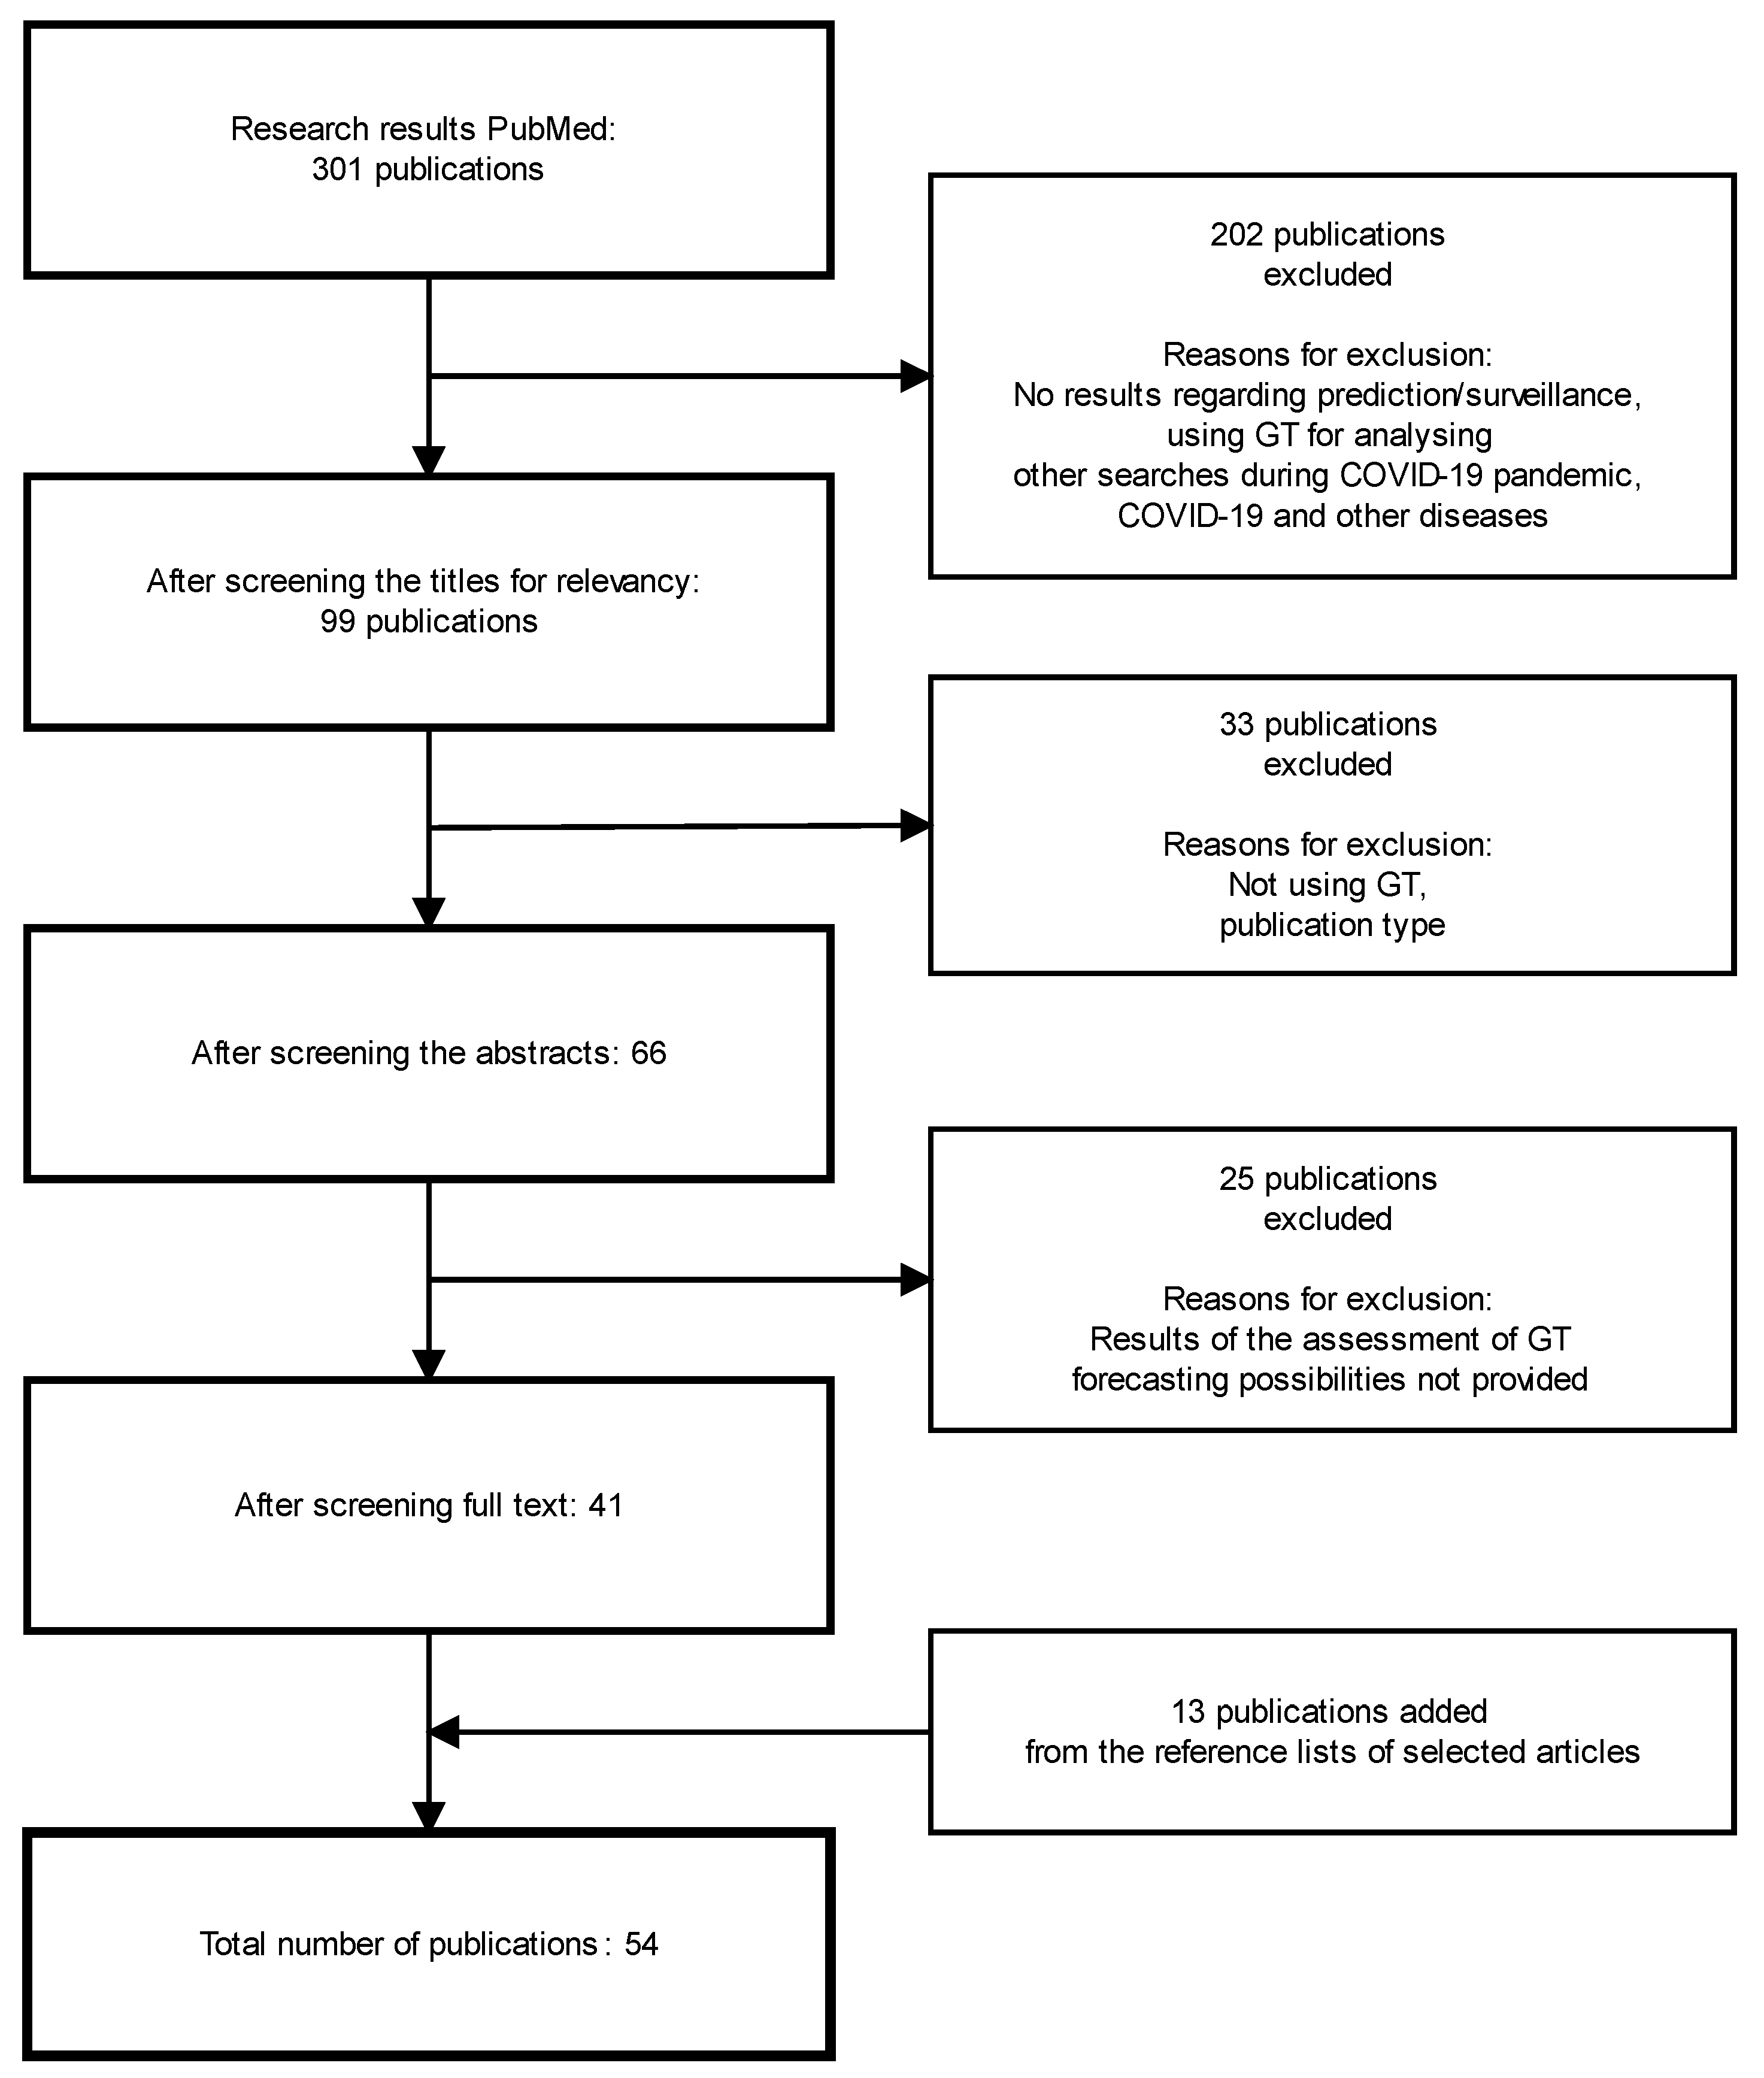
2. Materials and Methods
Inclusion and Exclusion Criteria
3. Results
3.1. Differences between Countries
3.2. Time Periods
3.3. Keywords
3.4. More Complex Analysis Methods of GT Data
3.5. Negative Results of GT Use for COVID-19 Prediction and Surveillance
4. Discussion
4.1. Differences between Countries
4.2. Time Periods
4.3. Risk Communication
4.4. Language
4.5. Complex Analysis Methods of GT Data
4.6. Negative Findings
4.7. Strengths
4.8. Limitations of the Possible Use of GT
4.9. Limitations of the Review
5. Conclusions
Author Contributions
Funding
Institutional Review Board Statement
Informed Consent Statement
Data Availability Statement
Conflicts of Interest
Appendix A
Appendix B
Appendix C
Appendix D
Appendix E
Appendix F
Appendix G
Appendix H
References
- WHO Coronavirus. Available online: https://www.who.int/health-topics/coronavirus#tab=tab_1 (accessed on 6 July 2021).
- Wang, C.; Horby, P.W.; Hayden, F.G.; Gao, G.F. A Novel Coronavirus Outbreak of Global Health Concern. Lancet 2020, 395, 470–473. [Google Scholar] [CrossRef]
- Tang, D.; Tou, J.; Wang, J.; Chen, Q.; Wang, W.; Huang, J.; Zhao, H.; Wei, J.; Xu, Z.; Zhao, D.; et al. Prevention and Control Strategies for Emergency, Limited-Term, and Elective Operations in Pediatric Surgery during the Epidemic Period of COVID-19. World J. Pediatr. Surg. 2020, 3, e000122. [Google Scholar] [CrossRef]
- Heymann, D.L.; Shindo, N. COVID-19: What Is next for Public Health? Lancet 2020, 395, 542–545. [Google Scholar] [CrossRef]
- Cousins, H.C.; Cousins, C.C.; Harris, A.; Pasquale, L.R. Regional Infoveillance of COVID-19 Case Rates: Analysis of Search-Engine Query Patterns. J. Med. Internet Res. 2020, 22, e19483. [Google Scholar] [CrossRef]
- Majumder, M.S.; Santillana, M.; Mekaru, S.R.; McGinnis, D.P.; Khan, K.; Brownstein, J.S. Utilizing Nontraditional Data Sources for Near Real-Time Estimation of Transmission Dynamics During the 2015-2016 Colombian Zika Virus Disease Outbreak. JMIR Public Health Surveill. 2016, 2, e30. [Google Scholar] [CrossRef]
- Kurian, S.J.; Bhatti, A.u.R.; Alvi, M.A.; Ting, H.H.; Storlie, C.; Wilson, P.M.; Shah, N.D.; Liu, H.; Bydon, M. Correlations Between COVID-19 Cases and Google Trends Data in the United States: A State-by-State Analysis. Mayo Clin. Proc. 2020, 95, 2370. [Google Scholar] [CrossRef]
- Effenberger, M.; Kronbichler, A.; Shin, J.I.; Mayer, G.; Tilg, H.; Perco, P. Association of the COVID-19 Pandemic with Internet Search Volumes: A Google TrendsTM Analysis. Int. J. Infect. Dis. 2020, 95, 192. [Google Scholar] [CrossRef]
- Schneider, P.P.; van Gool, C.J.; Spreeuwenberg, P.; Hooiveld, M.; Donker, G.A.; Barnett, D.J.; Paget, J. Using Web Search Queries to Monitor Influenza-like Illness: An Exploratory Retrospective Analysis, Netherlands, 2017/18 Influenza Season. Euro Surveill. 2020, 25, 1900221. [Google Scholar] [CrossRef] [PubMed]
- Strauss, R.; Lorenz, E.; Kristensen, K.; Eibach, D.; Torres, J.; May, J.; Castro, J. Investigating the Utility of Google Trends for Zika and Chikungunya Surveillance in Venezuela. BMC Public Health 2020, 20, 947. [Google Scholar] [CrossRef]
- Shin, S.Y.; Seo, D.W.; An, J.; Kwak, H.; Kim, S.H.; Gwack, J.; Jo, M.W. High Correlation of Middle East Respiratory Syndrome Spread with Google Search and Twitter Trends in Korea. Sci. Rep. 2016, 6, 32920. [Google Scholar] [CrossRef]
- Ocampo, A.J.; Chunara, R.; Brownstein, J.S. Using Search Queries for Malaria Surveillance, Thailand. Malar. J. 2013, 12, 390. [Google Scholar] [CrossRef] [PubMed]
- Walker, A.; Hopkins, C.; Surda, P. Use of Google Trends to Investigate Loss-of-Smell-Related Searches during the COVID-19 Outbreak. Int. Forum Allergy Rhinol. 2020, 10, 839–847. [Google Scholar] [CrossRef] [PubMed]
- Badell-Grau, R.A.; Cuff, J.P.; Kelly, B.P.; Waller-Evans, H.; Lloyd-Evans, E. Investigating the Prevalence of Reactive Online Searching in the COVID-19 Pandemic: Infoveillance Study. J. Med. Internet Res. 2020, 22, e19791. [Google Scholar] [CrossRef] [PubMed]
- Brunori, P.; Resce, G. Dipartimento Di Economia e Finanza Searching for the Peak Google Trends and the Covid-19 Outbreak in Italy. Available online: https://ideas.repec.org/p/frz/wpaper/wp2020_05.rdf.html (accessed on 30 January 2022).
- Sulyok, M.; Ferenci, T.; Walker, M. Google Trends Data and COVID-19 in Europe: Correlations and Model Enhancement Are European Wide. Transbound. Emerg. Dis. 2021, 68, 2610–2615. [Google Scholar] [CrossRef]
- Pellegrini, M.; Ferrucci, E.; Guaraldi, F.; Bernabei, F.; Scorcia, V.; Giannaccare, G. Emerging Application of Google Trends Searches on “Conjunctivitis” for Tracing the Course of COVID-19 Pandemic. Eur. J. Ophthalmol. 2021, 32, 1947–1952. [Google Scholar] [CrossRef]
- Cinarka, H.; Uysal, M.A.; Cifter, A.; Niksarlioglu, E.Y.; Çarkoğlu, A. The Relationship between Google Search Interest for Pulmonary Symptoms and COVID-19 Cases Using Dynamic Conditional Correlation Analysis. Sci. Rep. 2021, 11, 14387. [Google Scholar] [CrossRef]
- Kristensen, K.; Lorenz, E.; May, J.; Strauss, R. Exploring the Use of Web Searches for Risk Communication during COVID-19 in Germany. Sci. Rep. 2021, 11, 6419. [Google Scholar] [CrossRef]
- Prasanth, S.; Singh, U.; Kumar, A.; Tikkiwal, V.A.; Chong, P.H.J. Forecasting Spread of COVID-19 Using Google Trends: A Hybrid GWO-Deep Learning Approach. Chaos. Solitons. Fractals 2021, 142, 110336. [Google Scholar] [CrossRef]
- Niu, B.; Liang, R.; Zhang, S.; Zhang, H.; Qu, X.; Su, Q.; Zheng, L.; Chen, Q. Epidemic Analysis of COVID-19 in Italy Based on Spatiotemporal Geographic Information and Google Trends. Transbound. Emerg. Dis. 2021, 68, 2384–2400. [Google Scholar] [CrossRef]
- Peng, Y.; Li, C.; Rong, Y.; Chen, X.; Chen, H. Retrospective Analysis of the Accuracy of Predicting the Alert Level of COVID-19 in 202 Countries Using Google Trends and Machine Learning. J. Glob. Health 2020, 10, 020511. [Google Scholar] [CrossRef]
- Rabiolo, A.; Alladio, E.; Morales, E.; McNaught, A.I.; Bandello, F.; Afifi, A.A.; Marchese, A. Forecasting the COVID-19 Epidemic by Integrating Symptom Search Behavior Into Predictive Models: Infoveillance Study. J. Med. Internet Res. 2021, 23, e28876. [Google Scholar] [CrossRef] [PubMed]
- Mavragani, A. Tracking COVID-19 in Europe: Infodemiology Approach. JMIR Public Health Surveill. 2020, 6, e18941. [Google Scholar] [CrossRef] [PubMed]
- Peng, Y.; Li, C.; Rong, Y.; Pang, C.P.; Chen, X.; Chen, H. Real-Time Prediction of the Daily Incidence of COVID-19 in 215 Countries and Territories Using Machine Learning: Model Development and Validation. J. Med. Internet Res. 2021, 23, e24285. [Google Scholar] [CrossRef]
- Szmuda, T.; Ali, S.; Hetzger, T.V.; Rosvall, P.; Słoniewski, P. Are Online Searches for the Novel Coronavirus (COVID-19) Related to Media or Epidemiology? A Cross-Sectional Study. Int. J. Infect. Dis. 2020, 97, 386–390. [Google Scholar] [CrossRef] [PubMed]
- Asseo, K.; Fierro, F.; Slavutsky, Y.; Frasnelli, J.; Niv, M.Y. Tracking COVID-19 Using Taste and Smell Loss Google Searches Is Not a Reliable Strategy. Sci. Rep. 2020, 10, 20527. [Google Scholar] [CrossRef]
- Muselli, M.; Cofini, V.; Desideri, G.; Necozione, S. Coronavirus (Covid-19) Pandemic: How May Communication Strategies Influence Our Behaviours? Int. J. Disaster Risk Reduct. IJDRR 2021, 53, 101982. [Google Scholar] [CrossRef]
- Rovetta, A. Reliability of Google Trends: Analysis of the Limits and Potential of Web Infoveillance During COVID-19 Pandemic and for Future Research. Front. Res. Metrics Anal. 2021, 6, 670226. [Google Scholar] [CrossRef]
- Sato, K.; Mano, T.; Iwata, A.; Toda, T. Need of Care in Interpreting Google Trends-Based COVID-19 Infodemiological Study Results: Potential Risk of False-Positivity. BMC Med. Res. Methodol. 2021, 21, 147. [Google Scholar] [CrossRef]
- Dagher, S.H.; Lamé, G.; Hubiche, T.; Ezzedine, K.; Duong, T.A. The Influence of Media Coverage and Governmental Policies on Google Queries Related to COVID-19 Cutaneous Symptoms: Infodemiology Study. JMIR Public Health Surveill. 2021, 7, e25651. [Google Scholar] [CrossRef]
- Walker, M.D.; Sulyok, M. Online Behavioural Patterns for Coronavirus Disease 2019 (COVID-19) in the United Kingdom. Epidemiol. Infect. 2020, 148, e110. [Google Scholar] [CrossRef]
- Schuster, B.; Tizek, L.; Schielein, M.C.; Ziehfreund, S.; Rothe, K.; Spinner, C.D.; Biedermann, T.; Zink, A. Retracing the COVID-19 Pandemic in Germany from a Public Perspective Using Google Search Queries Related to “Coronavirus”. Gesundheitswesen 2021, 83, E9–E14. [Google Scholar] [CrossRef] [PubMed]
- Hu, D.; Lou, X.; Xu, Z.; Meng, N.; Xie, Q.; Zhang, M.; Zou, Y.; Liu, J.; Sun, G.P.; Wang, F. More Effective Strategies Are Required to Strengthen Public Awareness of COVID-19: Evidence from Google Trends. J. Glob. Health 2020, 10, 011003. [Google Scholar] [CrossRef] [PubMed]
- Higgins, T.S.; Wu, A.W.; Sharma, D.; Illing, E.A.; Rubel, K.; Ting, J.Y.; Alliance, S.F. Correlations of Online Search Engine Trends With Coronavirus Disease (COVID-19) Incidence: Infodemiology Study. JMIR Public Health Surveill. 2020, 6, e19702. [Google Scholar] [CrossRef] [PubMed]
- Cherry, G.; Rocke, J.; Chu, M.; Liu, J.; Lechner, M.; Lund, V.J.; Kumar, B.N. Loss of Smell and Taste: A New Marker of COVID-19? Tracking Reduced Sense of Smell during the Coronavirus Pandemic Using Search Trends. Expert Rev. Anti. Infect. Ther. 2020, 18, 1165–1170. [Google Scholar] [CrossRef] [PubMed]
- Sharma, M.; Sharma, S. The Rising Number of COVID-19 Cases Reflecting Growing Search Trend and Concern of People: A Google Trend Analysis of Eight Major Countries. J. Med. Syst. 2020, 44, 117. [Google Scholar] [CrossRef] [PubMed]
- Schnoell, J.; Besser, G.; Jank, B.J.; Bartosik, T.J.; Parzefall, T.; Riss, D.; Mueller, C.A.; Liu, D.T. The Association between COVID-19 Cases and Deaths and Web-Based Public Inquiries. Infect. Dis. 2021, 53, 176–183. [Google Scholar] [CrossRef]
- Jimenez, A.J.; Estevez-Reboredo, R.M.; Santed, M.A.; Ramos, V. COVID-19 Symptom-Related Google Searches and Local COVID-19 Incidence in Spain: Correlational Study. J. Med. Internet Res. 2020, 22, e23518. [Google Scholar] [CrossRef]
- Lippi, G.; Mattiuzzi, C.; Cervellin, G. Google Search Volume Predicts the Emergence of COVID-19 Outbreaks. Acta Biomed. 2020, 91, e2020006. [Google Scholar] [CrossRef]
- Strzelecki, A.; Azevedo, A.; Albuquerque, A. Correlation between the Spread of COVID-19 and the Interest in Personal Protective Measures in Poland and Portugal. Healthcare 2020, 8, 203. [Google Scholar] [CrossRef]
- Panuganti, B.A.; Jafari, A.; MacDonald, B.; DeConde, A.S. Predicting COVID-19 Incidence Using Anosmia and Other COVID-19 Symptomatology: Preliminary Analysis Using Google and Twitter. Otolaryngol. Head. Neck Surg. 2020, 163, 491–497. [Google Scholar] [CrossRef]
- Mavragani, A.; Gkillas, K. COVID-19 Predictability in the United States Using Google Trends Time Series. Sci. Rep. 2020, 10, 20693. [Google Scholar] [CrossRef] [PubMed]
- Ahmad, I.; Flanagan, R.; Staller, K. Increased Internet Search Interest for GI Symptoms May Predict COVID-19 Cases in US Hotspots. Clin. Gastroenterol. Hepatol. 2020, 18, 2833–2834.e3. [Google Scholar] [CrossRef] [PubMed]
- Rajan, A.; Sharaf, R.; Brown, R.S.; Sharaiha, R.Z.; Lebwohl, B.; Mahadev, S.H. Association of Search Query Interest in Gastrointestinal Symptoms With COVID-19 Diagnosis in the United States: Infodemiology Study. JMIR Public Health Surveill. 2020, 6, e19354. [Google Scholar] [CrossRef]
- Hartwell, M.; Greiner, B.; Kilburn, Z.; Ottwell, R. Association of Public Interest in Preventive Measures and Increased COVID-19 Cases After the Expiration of Stay-at-Home Orders: A Cross-Sectional Study. Disaster Med. Public Health Prep. 2020, 16, 55–59. [Google Scholar] [CrossRef] [PubMed]
- Abbas, M.; Morland, T.B.; Hall, E.S.; El-Manzalawy, Y. Associations between Google Search Trends for Symptoms and COVID-19 Confirmed and Death Cases in the United States. Int. J. Environ. Res. Public Health 2021, 18, 4560. [Google Scholar] [CrossRef]
- Yousefinaghani, S.; Dara, R.; Mubareka, S.; Sharif, S. Prediction of COVID-19 Waves Using Social Media and Google Search: A Case Study of the US and Canada. Front. public Health 2021, 9, 656635. [Google Scholar] [CrossRef]
- Husnayain, A.; Chuang, T.W.; Fuad, A.; Su, E.C.Y. High Variability in Model Performance of Google Relative Search Volumes in Spatially Clustered COVID-19 Areas of the USA. Int. J. Infect. Dis. 2021, 109, 269–278. [Google Scholar] [CrossRef]
- Turk, P.J.; Tran, T.P.; Rose, G.A.; McWilliams, A. A Predictive Internet-Based Model for COVID-19 Hospitalization Census. Sci. Rep. 2021, 11, 5106. [Google Scholar] [CrossRef]
- Yuan, X.; Xu, J.; Hussain, S.; Wang, H.; Gao, N.; Zhang, L. Trends and Prediction in Daily New Cases and Deaths of COVID-19 in the United States: An Internet Search-Interest Based Model. Explor. Res. Hypothesis Med. 2020, 5, 1–6. [Google Scholar] [CrossRef]
- Madden, K.M.; Feldman, B. Anosmia-Related Internet Search and the Course of the First Wave of the COVID-19 Pandemic in the United States. Heliyon 2021, 7, e08499. [Google Scholar] [CrossRef]
- Ayyoubzadeh, S.M.; Ayyoubzadeh, S.M.; Zahedi, H.; Ahmadi, M.; Niakan Kalhori, S.R. Predicting COVID-19 Incidence Through Analysis of Google Trends Data in Iran: Data Mining and Deep Learning Pilot Study. JMIR Public Health Surveill. 2020, 6, e18828. [Google Scholar] [CrossRef] [PubMed]
- Ahmed, S.; Abid, M.A.; de Oliveira, M.H.S.; Ahmed, Z.A.; Siddiqui, A.; Siddiqui, I.; Jafri, L.; Lippi, G. Ups and Downs of COVID-19: Can We Predict the Future? Local Analysis with Google Trends for Forecasting the Burden of COVID-19 in Pakistan. EJIFCC 2021, 32, 421. [Google Scholar] [PubMed]
- Samadbeik, M.; Garavand, A.; Aslani, N.; Ebrahimzadeh, F.; Fatehi, F. Assessing the Online Search Behavior for COVID-19 Outbreak: Evidence from Iran. PLoS ONE 2022, 17, e0267818. [Google Scholar] [CrossRef]
- Venkatesh, U.; Gandhi, P.A. Prediction of COVID-19 Outbreaks Using Google Trends in India: A Retrospective Analysis. Healthc. Inform. Res. 2020, 26, 175–184. [Google Scholar] [CrossRef] [PubMed]
- Satpathy, P.; Kumar, S.; Prasad, P. Suitability of Google TrendsTM for Digital Surveillance During Ongoing COVID-19 Epidemic: A Case Study from India. Disaster Med. Public Health Prep. 2021, 1–10. [Google Scholar] [CrossRef]
- Xie, T.; Tan, T.; Li, J. An Extensive Search Trends-Based Analysis of Public Attention on Social Media in the Early Outbreak of COVID-19 in China. Risk Manag. Healthc. Policy 2020, 13, 1353–1364. [Google Scholar] [CrossRef]
- Li, C.; Chen, L.J.; Chen, X.; Zhang, M.; Pang, C.P.; Chen, H. Retrospective Analysis of the Possibility of Predicting the COVID-19 Outbreak from Internet Searches and Social Media Data, China, 2020. Eurosurveillance 2020, 25, 1. [Google Scholar] [CrossRef]
- Husnayain, A.; Fuad, A.; Su, E.C.Y. Applications of Google Search Trends for Risk Communication in Infectious Disease Management: A Case Study of the COVID-19 Outbreak in Taiwan. Int. J. Infect. Dis. 2020, 95, 221–223. [Google Scholar] [CrossRef] [PubMed]
- Lin, Y.H.; Liu, C.H.; Chiu, Y.C. Google Searches for the Keywords of “Wash Hands” Predict the Speed of National Spread of COVID-19 Outbreak among 21 Countries. Brain. Behav. Immun. 2020, 87, 30. [Google Scholar] [CrossRef]
- Sousa-Pinto, B.; Anto, A.; Czarlewski, W.; Anto, J.M.; Fonseca, J.A.; Bousquet, J. Assessment of the Impact of Media Coverage on COVID-19–Related Google Trends Data: Infodemiology Study. J. Med. Internet Res. 2020, 22, e19611. [Google Scholar] [CrossRef]
- Individuals Using the Internet (% of Population)–Low & Middle Income|Data. Available online: https://data.worldbank.org/indicator/IT.NET.USER.ZS?locations=XO (accessed on 30 January 2022).
- Individuals Using the Internet (% of Population)–High Income|Data. Available online: https://data.worldbank.org/indicator/IT.NET.USER.ZS?locations=XD (accessed on 30 January 2022).
- India Has Second Highest Number of Internet Users after China: Report–The Economic Times. Available online: https://economictimes.indiatimes.com/tech/internet/india-has-second-highest-number-of-internet-users-after-china-report/articleshow/71311705.cms?from=mdr (accessed on 30 January 2022).
- United States Population (2022)–Worldometer. Available online: https://www.worldometers.info/world-population/us-population/ (accessed on 30 January 2022).
- • U.S: Number of Internet Users 2025|Statista. Available online: https://www.statista.com/statistics/325645/usa-number-of-internet-users/ (accessed on 30 January 2022).
- Digital Economy and Society Statistics–Households and Individuals–Statistics Explained. Available online: https://ec.europa.eu/eurostat/statistics-explained/index.php?title=Digital_economy_and_society_statistics_-_households_and_individuals (accessed on 30 January 2022).
- Buneviciene, I.; Bunevicius, R.; Bagdonas, S.; Bunevicius, A. COVID-19 Media Fatigue: Predictors of Decreasing Interest and Avoidance of COVID-19–Related News. Public Health 2021, 196, 124–128. [Google Scholar] [CrossRef] [PubMed]
- Husnayain, A.; Shim, E.; Fuad, A.; Su, E.C.Y. Understanding the Community Risk Perceptions of the COVID-19 Outbreak in South Korea: Infodemiology Study. J. Med. Internet Res. 2020, 22, e19788. [Google Scholar] [CrossRef]
- Bento, A.I.; Nguyen, T.; Wing, C.; Lozano-Rojas, F.; Ahn, Y.Y.; Simon, K. Evidence from Internet Search Data Shows Information-Seeking Responses to News of Local COVID-19 Cases. Proc. Natl. Acad. Sci. USA 2020, 117, 11220–11222. [Google Scholar] [CrossRef] [PubMed]
- Khan, T.; Khan, R.; Fatima, S.; Sunesara, S.; Masud, F.; Ratnani, I. TP011 use of health services and medical education research to evaluate the effect of COVID-19/Thematic Poster Session COVID-19 News Fatigue: Are People Tired of Hearing About the Pandemic? Am. J. Respir. Crit. Care Med. 2021, 203, A1476. [Google Scholar]
- Aragón-Ayala, C.J.; Copa-Uscamayta, J.; Herrera, L.; Zela-Coila, F.; Quispe-Juli, C.U. Interest in COVID-19 in Latin America and the Caribbean: An Infodemiological Study Using Google Trends. Cad. Saude Publica 2021, 37, e00270720. [Google Scholar] [CrossRef]

| Author and Year | The Main Findings about Google Trends | Country | Period | Keywords |
|---|---|---|---|---|
| Husnayain, Fuad, Su (2020) [60] | GT can be used for public restlessness monitoring towards COVID-19 pandemic 1–3 days before the increase in confirmed cases. | TW | 12 2019–02 2020 | Coronavirus, hand wash, face masks |
| Walker, Hopkins, Surda (2020) [13] | Strong correlation between smell-related information search frequency and onset of COVID-19 infection. | IT, ES, UK, US, DE, FR, NL, IR | 12 2019–03 2020 | Smell, loss of smell, anosmia, hyposmia, olfaction, taste, loss of taste, dysgeusia. The keywords were automatically translated to national languages of study countries. |
| Mavragani (2020) [24] | Significant correlations between online interest of coronavirus and COVID-19 cases and deaths. | IT, ES, FR, DE, UK | 01 2020–03 2020 | Coronavirus |
| Venkatesh and Gandhi (2020) [56] | Google Web, together with other internet-based tools might be useful in predicting COVID-19 outbreaks 2–3 weeks earlier than conventional disease surveillance. | IN | 01 2020–04 2020 | Coronavirus, COVID, COVID-19, corona, virus |
| Kurian, Bhatti, Alvi, Ting, Storlie, Wilson, Shah, Liu, Bydon (2020) [7] | The information obtained from GT precedes COVID-19 outbreaks. This information could allow better preparation and planning of health care systems. | US | 01 2020–04 2020 | COVID symptoms, coronavirus symptoms, sore throat + shortness of breath + fatigue + cough, coronavirus testing center, loss of smell, Lysol (sanitizer), antibody, face mask, coronavirus vaccine, COVID stimulus check |
| Panuganti, Jafari, MacDonald, DeConde (2020) [42] | Google search of fever and shortness of breath are better indicators of COVID-19 incidence than anosmia. | US | 01 2020–04 2020 (excluding a short timeframe (March 22 to March 24)) | COVID, coronavirus, COVID-19, SARS-CoV-2, and COVID19, nonsmell symptoms of COVID-19 (shortness of breath, fatigue, cough, and fever) loss of smell, anosmia, lose smell, sense of smell, cannot smell, can’t smell and hyposmia, nasal irrigation and sinus rinse, (dysgeusia, taste change and taste loss, COVID, coronavirus, COVID-19, SARS-CoV-2, and COVID19), (shortness of breath, fatigue, cough, and fever), and smell loss anosmia, loss of smell, reduced smell, decreased smell, lose your sense of smell, lost sense of smell, decreased sense of smell, decrease your sense of smell, decreased my sense of smell, reduce your sense of smell, reduced my sense of smell, reduced sense of smell, loss of sense of smell, loss of smell, hyposmia |
| Mavragani and Gkillas (2020) [43] | Significant correlation found between GT search queries and COVID-19 incidence. | US | 03 2020–04 2020 | coronavirus (virus) and coronavirus (search term) |
| Higgins, Wu, Sharma, Illing, Rubel, Ting, Alliance (2020) [35] | Many search terms showed significant correlations with COVID-19 cases and mortality rate. | CN, US, IT, ES | 01 2020–04 2020 | Real world deaths, Coronavirus, COVID-19, Fever, SOB, Cough, Sputum, Anosmia, Dys/ageusia, Nasal congestion, Rhinorrhea, Sneezing, Sore throat, Headache, Myalgia, Chest pain, Eye pain, Diarrhea |
| Ahmad, Flanagan, Staller (2020) [44] | Google searches for gastrointestinal symptoms preceded the increase in COVID-19 cases in a predictable manner. | US | 01 2020–04 2020 | ageusia, abdominal pain, loss of appetite, anorexia, diarrhea, and vomiting |
| Cherry, Rocke, Chu, Liu, Lechner, Lund, Kumar (2020) [36] | GT data containing searches related to loss of smell could potentially identify COVID-19 outbreaks. | IT, ES, FR, BR, US | 02 2020–05 2020 | loss of sense of smell, loss of sense of taste, sense of smell, sense of taste |
| Cousins, Cousins, Harris, Pasquale (2020) [5] | Identifiable patterns in internet searches could predict COVID-19 outbreaks, although stochastic changes in search intensity can alter these predictions. | US | 01 2020–04 2020 | 463 unique search queries. Appendix A. |
| Sharma and Sharma (2020) [37] | A positive correlation between COVID-19 cases and GT values has been recorded. | US, ES, IT, FR, UK, CN, IR, IN | 03 2020–04 2020 | COVID-19 |
| Schnoell, Besser, Jank, Bartosik, Parzefall, Riss, Mueller, Liu (2021) [38] | Clear correlation found between GT data and COVID-19 incidence. GT data might be useful in selecting the best timing for web-based COVID-19-specific information and prevention measures. | AU, BR, CA, DE, IT, ZA, ROK, ES, UK, US | 01 2020–06 2020 | Coronavirus, corona |
| Jimenez, Estevez-Rebored, Santed, Ramos (2020) [39] | Significant correlation found between the rise of COVID-19 incidences and GT search queries with a lag of 11 days. | ES | 02 2020–05 2020 | cansancio, which translates as fatigue; coronavirus, COVID 19, covid 19, and COVID19; diarrea, which translates as diarrhea; dolor de garganta, which translates as sore throat; fiebre, which translates as fever; neumonia, which translates as pneumonia and was searched without an accent due to being more relevant; perdida de olfato, which translates as lost sense of smell and was also searched without an accent; tos, which translates as cough |
| Lippi, Mattiuzzi, Cervellin (2020) [40] | Significant correlations found between GT search data and newly diagnosed COVID-19 cases with a 3-week lag. | IT | 02 2020–05 2020 | tosse (i.e., cough), febbre (i.e., fever), and dispnea (i.e., dyspnea) |
| Strzelecki, Azevedo, Albuquerque (2020) [41] | There was a correlation between COVID-19 spread and GT search data for personal protective gear and hand hygiene. | PL, PT | 01 2020–06 2020 | máscara cirúrgica (face mask), desinfetante (sanitizer), and álcool (alcohol) |
| Badell-Grau, Cuff, Kelly, Waller-Evans, Lloyd-Evans (2020) [14] | Strong correlations found between COVID-19-related search terms and cases and mortality rates from COVID-19. | AU, DE, IT, ES, UK, US | 11 2019–04 2020 | keywords used in three categories and four languages: Government Policy, Medical Interventions, and Misinformation |
| Rajan, Sharaf, Brown, Sharaiha, Lebwohl, Mahadev (2020) [45] | GT data could be used to identify active disease transmission areas in the beginning of new outbreaks. | US | 10 2019–05 2020 | diarrhea, nausea, vomiting, and abdominal pain. The terms fever and cough were included as positive controls. The term constipation was included as a negative control. |
| Xie, Tan, Li (2020) [58] | Monitoring internet search activity could prevent and control the epidemic and rumors around it. | CN | 01 2020–02 2020 | Coronavirus |
| Hartwell, Greiner, Kilburn, Ottwell (2020) [46] | GT data relating to the public interest of COVID-19 preventative measures correlated with stay-at-home expiration dates and decreased new COVID-19 cases after that expiration. In addition, states with higher interest in preventative measures had higher COVID-19-related deaths per capita and higher case-fatality rates. | US | 05 2020 | hand sanitizer, social distancing, COVID testing, contact tracing |
| Effenberger, Kronbichler, Shin, Mayer, Tilg, Perco (2020) [8] | Significant correlations were found between GT data relating to coronavirus and new COVID-19 cases across studied countries. The time lag was 11.5 days. | KR, JP, IR, IT, AT, DE, UK, US, EG, AU, BR, CN | 12 2019–04 2020 | Coronavirus (virus) |
| Lin, Liu, Chiu (2020) [61] | Google searches for “wash hands” from January to February correlated with lower COVID-19 spread from February to March in 21 countries. | IT, IR, KR, FR, ES, DE, US, CH, NL, SE, NO, AT, AU, CA, JP, UK, BE, SG, HK, TW, TH | 01 2020–02 2020 | wash hands, face mask |
| Brunori and Resce (2020) [15] | Significant positive correlation found between google search queries of COVID-19 symptoms and reported COVID-19 deaths. | IT | 02 2020–03 2020 | ‘fever’, ‘dry cough’, ‘cough’, ‘sore throat’, ‘loss of sense of smell’, and ‘loss of sense of taste’ |
| Sulyok, Ferenci, Walker (2021) [16] | Strong positive correlation found between Google search queries for coronavirus and COVID-19 cases in Europe. | BE, FE, DE, HU, IE, IT, NL, NO, ES, SE, CH, UK | 01 2020–03 2020 | Coronavirus |
| Abbas, Morland, Hall, El-Manzalawy (2021) [47] | The dynamics of the correlations found between GT data COVID-19 cases and deaths suggest that it would be possible to make predictions of COVID-19 cases and mortality rates up to 3 weeks in advance. | US | Dataset released 09 2020, accessed 11 2020 | 422 symptoms and conditions dataset. Appendix B. |
| Pellegrini, Ferrucci, Guaraldi, Bernabei, Scorcia, Giannaccare (2021) [17] | GT data on conjunctivitis reveals significant correlations with COVID-19 new cases with a lag of 14–18 days. | IT, FR, UK, US | 01 2020–04 2020 | “conjunctivitis” and the translation in Italian (“congiuntivite”) and French (“conjonctivite”) |
| Yousefinaghani, Dara, Mubareka, Sharif (2021) [48] | GT data allowed to identify starts and peaks of COVID-19 waves 1 and 3 weeks earlier, respectively. Strong correlation was found between Twitter/GT data and the number of COVID-19 cases in Canada with 3–5-week lags. | CA, US | 01 2020–09 2020 | Shortness of breath, cough, fever, sore throat, loss of smell, loss of taste, face mask, quarantine, wearing mask, wash hand, COVID-19 vaccine, COVID-19 vaccine, covid vaccine, corona vaccine, coronavirus vaccine, physical distancing, social distancing |
| Cinarka, Uysal, Cifter, Niksarlioglu, Çarkoğlu (2021) [18] | Online interest shown in COVID-19 pulmonary symptoms can reliably predict later reported cases of the first COVID-19 wave. | TR, IT, ES, FR, UK | 01 2020–08 2020 | fever, cough, dyspnea |
| Husnayain, Chuang, Fuad, Su (2021) [49] | Significant correlations between COVID-19 and GT data reached their highest point in June and decreased as the outbreak progressed. | US | 01 2020–12 2020 | Data retrieved for COVID-19-related terms, topics, and disease; the top related queries; most-searched COVID-19 terms in 2020 with a lag of 7 days |
| Kristensen, Lorenz, May, Strauss, (2021) [19] | Significant correlations found between term “RKI” and increase in COVID-19 cases (2–12-day lag). Similar pattern was observed for the term “corona”. Searches for “protective mask” peaked 6–12 days after the peak of COVID-19 cases. | DE | 02 2020–04 2020 | ‘RKI’ (Robert Koch Institut), ‘Mundschutz’ (protective mask), and ‘corona’ |
| Hu, Lou, Xu, Meng, Xie, Zhang, Zou, Liu, Sun, Wang (2020) [34] | Slightly positive significant correlation found between GT data regarding COVID-19 and daily confirmed COVID-19 cases. | US, UK, CA, IE, AU, NZ | 12 2019–02 2020 | 2019-nCoV + SARS-CoV-2 + novel coronavirus + new coronavirus + COVID-19 + Corona Virus Disease 2019 |
| Schuster, Tizek, Schielein, Ziehfreund, Rothe, Spinner, Biedermann, Zink (2021) [33] | Moderate correlation found between GT data and confirmed new COVID-19 cases over the study period. | DE | 01 2020–07 2020 | coronavirus |
| Li, Chen, Chen, Zhang, Pang, Chen (2020) [59] | Internet search terms had high correlation with daily COVID-19 cases. | CN | 01 2020–02 2020 | coronavirus, pneumonia |
| Walker, Sulyok (2020) [32] | Search terms related to coronavirus had a significant correlation with confirmed COVID-19 cases. | UK | 01 2020–04 2020 | Coronavirus (virus), hand washing (search term), and face mask (search term) |
| Samadbeik, Garavand, Aslani, Ebrahimzadeh, Fatehi (2022) [55] | Terms related to COVID, COVID-19, and coronavirus had a significant correlation with confirmed weekly COVID-19 cases. | IR | 02 2020–01 2021 | corona [Persian], Covid [Persian], COVID-19, corona, and coronavirus |
| Ahmed, Abid, de Oliveira, Ahmed, Siddiqui, Siddiqui, Jafri, Lippi (2021) [54] | ‘Loss of smell’ was the best predictor for positive weekly COVID-19 cases. | PK | 03 2021–06 2021 | Fever, cough, headache, shortness of breath, taste loss, and hearing loss, COVID-19, coronavirus, virus, COVID |
| Yuan, Xu, Hussain, Wang, Gao, Zhang (2020) [51] | COVID-19 search terms had a strong correlation with confirmed COVID-19 cases and deaths in the USA. | US | 03 2020–04 2020 | COVID-19, COVID, coronavirus, SARS-CoV-2, pneumonia, high temperature, cough, COVID heart, COVID pneumonia, and COVID diabetes |
| Aragón-Ayala, Copa-Uscamayta, Herrera, Zela-Coila, Cender Udai Quispe-Juli (2021) [62] | Most countries showed a moderate to strong significant correlation between COVID-19 searches and daily new cases. | AR, BO, BR, CL, CO, CR, CU, EC, SV, GT, HN, MX NI, PA, PY, PE, PR, DO, UY, VE | 12 2019–04 2020 | “coronavirus + COVID-19 + SARS-CoV2 + nuevo coronavirus + 2019-nCoV”, “coronavirus + coronavírus + COVID-19 + SARS-CoV2 + novo coronavirus + novo coronavírus + 2019-nCoV” |
| Author and Year | The Main Findings about Google Trends | Country | Period | Keywords |
|---|---|---|---|---|
| Ayyoubzadeh, Zahedi, Ahmadi, Niakan Kalhori (2020) [53] | Data mining algorithms (linear regression and long short-term memory) can predict COVID-19 outbreak trends. | IR | 02 2020–03 2020 | Corona, COVID-19, Coronavirus, Antiseptic selling, Antiseptic buying, Hand washing, Hand sanitizer, Ethanol, Antiseptic |
| Prasanth, Singh, Kumar, Tikkiwal, Chong (2021) [63] | Data obtained from GT significantly improved deep learning model (long short-term memory optimized with Grey Wolf optimization) for forecasting COVID-19 numbers. | IN, US, UK | 02 2020–05 2020 | Coronavirus symptoms, Coronavirus, Covid, Hand wash, Healthcenter, Mask, Positive cases, Sanitizer, Coronavirus vaccine |
| Niu, Liang, Zhang, Zhang, Qu, Su, Zheng, Chen et al. (2021) [21] | GT data combined with Adaboost algorithm had strong predictive ability of COVID-19 infection with hopes to further enhance the online prediction system. | IT | 02 2020–03 2020 | 40 keywords. Appendix C. |
| Peng, Li, Rong, Chen, Chen (2020) [22] | A model with GT data and Random Forest Classification, developed from 20 countries worldwide, can be used for epidemic alert level prediction. | 202 countries. Appendix D. | 01 2020–04 2020 | Coronavirus, Pneumonia, Cough, Diarrhea, Fatigue, Fever, Nasal congestion and Rhinorrhea |
| Rabiolo, Alladio, Morales, McNaught, Bandello, Afifi, Marchese et al. (2021) [23] | GT data could improve statistical models (ERS, ARIMA, and NNA models fitted on the first two principal components) of nowcasting and forecasting COVID-19 incidence with a 15-day time lag and could be used as one of surveillance systems for this disease. | AU, BR, FR, IN, IR, ZA, UK, US | 01 2015–07 2020 (weekly data) and 01 2020–12 2020 (daily data) | 20 topics: abdominal pain, ageusia, anorexia, anosmia, bone pain, chills, conjunctivitis, cough, diarrhea, eye pain, fatigue, fever, headache, myalgia, nasal congestion, nausea, rhinorrhea, shortness of breath, sore throat, and tearing |
| Turk, Tran, Rose, McWilliams (2021) [50] | GT data were incorporated in a vector error correction model, which showed very good results in forecasting regional COVID-19 hospital census. | US | 02 2020–08 2020 | Coronavirus, covid testing + covid test + covid19 Testing + covid19 test + covid 19 Testing + covid 19 test, headache, pneumonia, “shortness of breath” + “trouble breathing” + “difficulty breathing”, CDC |
| Peng, Li, Rong, Pang, Chen, Chen (2021) [25] | Random forest regression algorithm with integrated previous incidence and GT data was able to accurately predict increase in COVID-19 cases in most countries 7 days in advance. | 215 countries. Appendix E. | 01 2020–07 2020 | Fourteen terms, including coronavirus, pneumonia, and COVID-19; six symptom-related terms (cough, diarrhea, fatigue, fever, nasal congestion, and rhinorrhea); five prevention-related terms (hand washing, hand sanitizer, mask, social distance, and social isolation) |
| Author and Year | The Main Findings about Google Trends | Country | Period | Keywords |
|---|---|---|---|---|
| Szmuda, Ali, Hetzger, Rosvall, Słoniewski (2020) [26] | GT data did not correlate with COVID-19 incidence and mortality; however, they had a strong correlation with international WHO announcements. | 40 European countries. Appendix F. | 12 2019–04 2020 | Coronavirus |
| Asseo, Fierro, Slavutsky, Frasnelli, Niv (2020) [27] | The correlation between internet searches for symptoms and new COVID-19 cases varied significantly over time. High fluctuations show that relying only on GT data to monitor the spread of COVID-19 is not a viable strategy. | IT, US | 03 2020–04 2020 | taste loss, smell loss, sight loss (control), hearing loss (control), COVID symptoms (and the same in Italian) |
| Muselli, Cofini, Desideri, Necozione (2021) [28] | The volume of Google searches did not reflect the actual epidemiological situation. It has been seen that official communications and government activity has more impact on public interest in the disease. | IT | 12 2019–03 2020 | coronavirus, coronavirus symptoms (in Italian), coronavirus news (in Italian), and coronavirus Italy (in Italian) |
| Rovetta (2021) [29] | Big number of anomalies seen in multiple cities’ relative search volumes (RSVs) made these data unusable for statistical inference. Furthermore, correlations varied greatly depending on the day RSVs were collected. | IT | 02 2020–12 2020 and 02 2020–05 2020 | coronavirus + covid |
| Satpathy, Kumar, Prasad (2021) [57] | Correlations found between GT queries and COVID-19 cases maybe either because of media-coverage-induced curiosity or health-seeking curiosity. | IN | 01 2020–05 2020 | 88 terms in Hindi and English. Appendix G. |
| Sato, Mano, Iwata, Toda (2021) [30] | Results suggest that search keywords, previously identified as candidates for COVID-19 prediction, might be unreliable. | JP, AU, CA, UK, IE, IN, SG, US, ZA | 10 2017–10 2020 | 54 English keywords and the corresponding 60 Japanese keywords. Appendix H. |
| Dagher, Lamé, Hubiche, Ezzedine, Duong (2021) [31] | Google searches for chilblain were influenced by media coverage and government policies during the COVID-19 pandemic, showing that GT, as a monitoring tool for emerging infectious diseases, should be used with caution. | US, UK, FR, IT, ES, DE | 01 2020–05 2020 | (1) toe or chilblains and (2) coronavirus, |
| Madden, Feldman (2021) [52] | Search terms do not give any evidences suggesting earlier COVID-19 spread. | US | 09 2015–03 2020 | Can’t smell OR can’t taste or smell OR why can’t i smell or taste OR why can’t i taste or smell anything |
| Sousa-Pinto, Anto, Czarlewski, Anto, Fonseca, Bousquet (2020) [62] | COVID-19-related searches are more closely related to media coverage than to ongoing COVID-19 epidemic. | RA, AU, BE, BR, CA, CL, FR, DE, IT, PT, RU, ES, SE, CH, NL, UK, US | 2015 04–2020 05 | coronavirus, cough, anosmia, ageusia |
Publisher’s Note: MDPI stays neutral with regard to jurisdictional claims in published maps and institutional affiliations. |
© 2022 by the authors. Licensee MDPI, Basel, Switzerland. This article is an open access article distributed under the terms and conditions of the Creative Commons Attribution (CC BY) license (https://creativecommons.org/licenses/by/4.0/).
Share and Cite
Saegner, T.; Austys, D. Forecasting and Surveillance of COVID-19 Spread Using Google Trends: Literature Review. Int. J. Environ. Res. Public Health 2022, 19, 12394. https://doi.org/10.3390/ijerph191912394
Saegner T, Austys D. Forecasting and Surveillance of COVID-19 Spread Using Google Trends: Literature Review. International Journal of Environmental Research and Public Health. 2022; 19(19):12394. https://doi.org/10.3390/ijerph191912394
Chicago/Turabian StyleSaegner, Tobias, and Donatas Austys. 2022. "Forecasting and Surveillance of COVID-19 Spread Using Google Trends: Literature Review" International Journal of Environmental Research and Public Health 19, no. 19: 12394. https://doi.org/10.3390/ijerph191912394