
Profiling of Fatty Acids Composition in Suet Oil Based on GC–EI-qMS and Chemometrics Analysis

Abstract
:1. Introduction
2. Results and Discussion
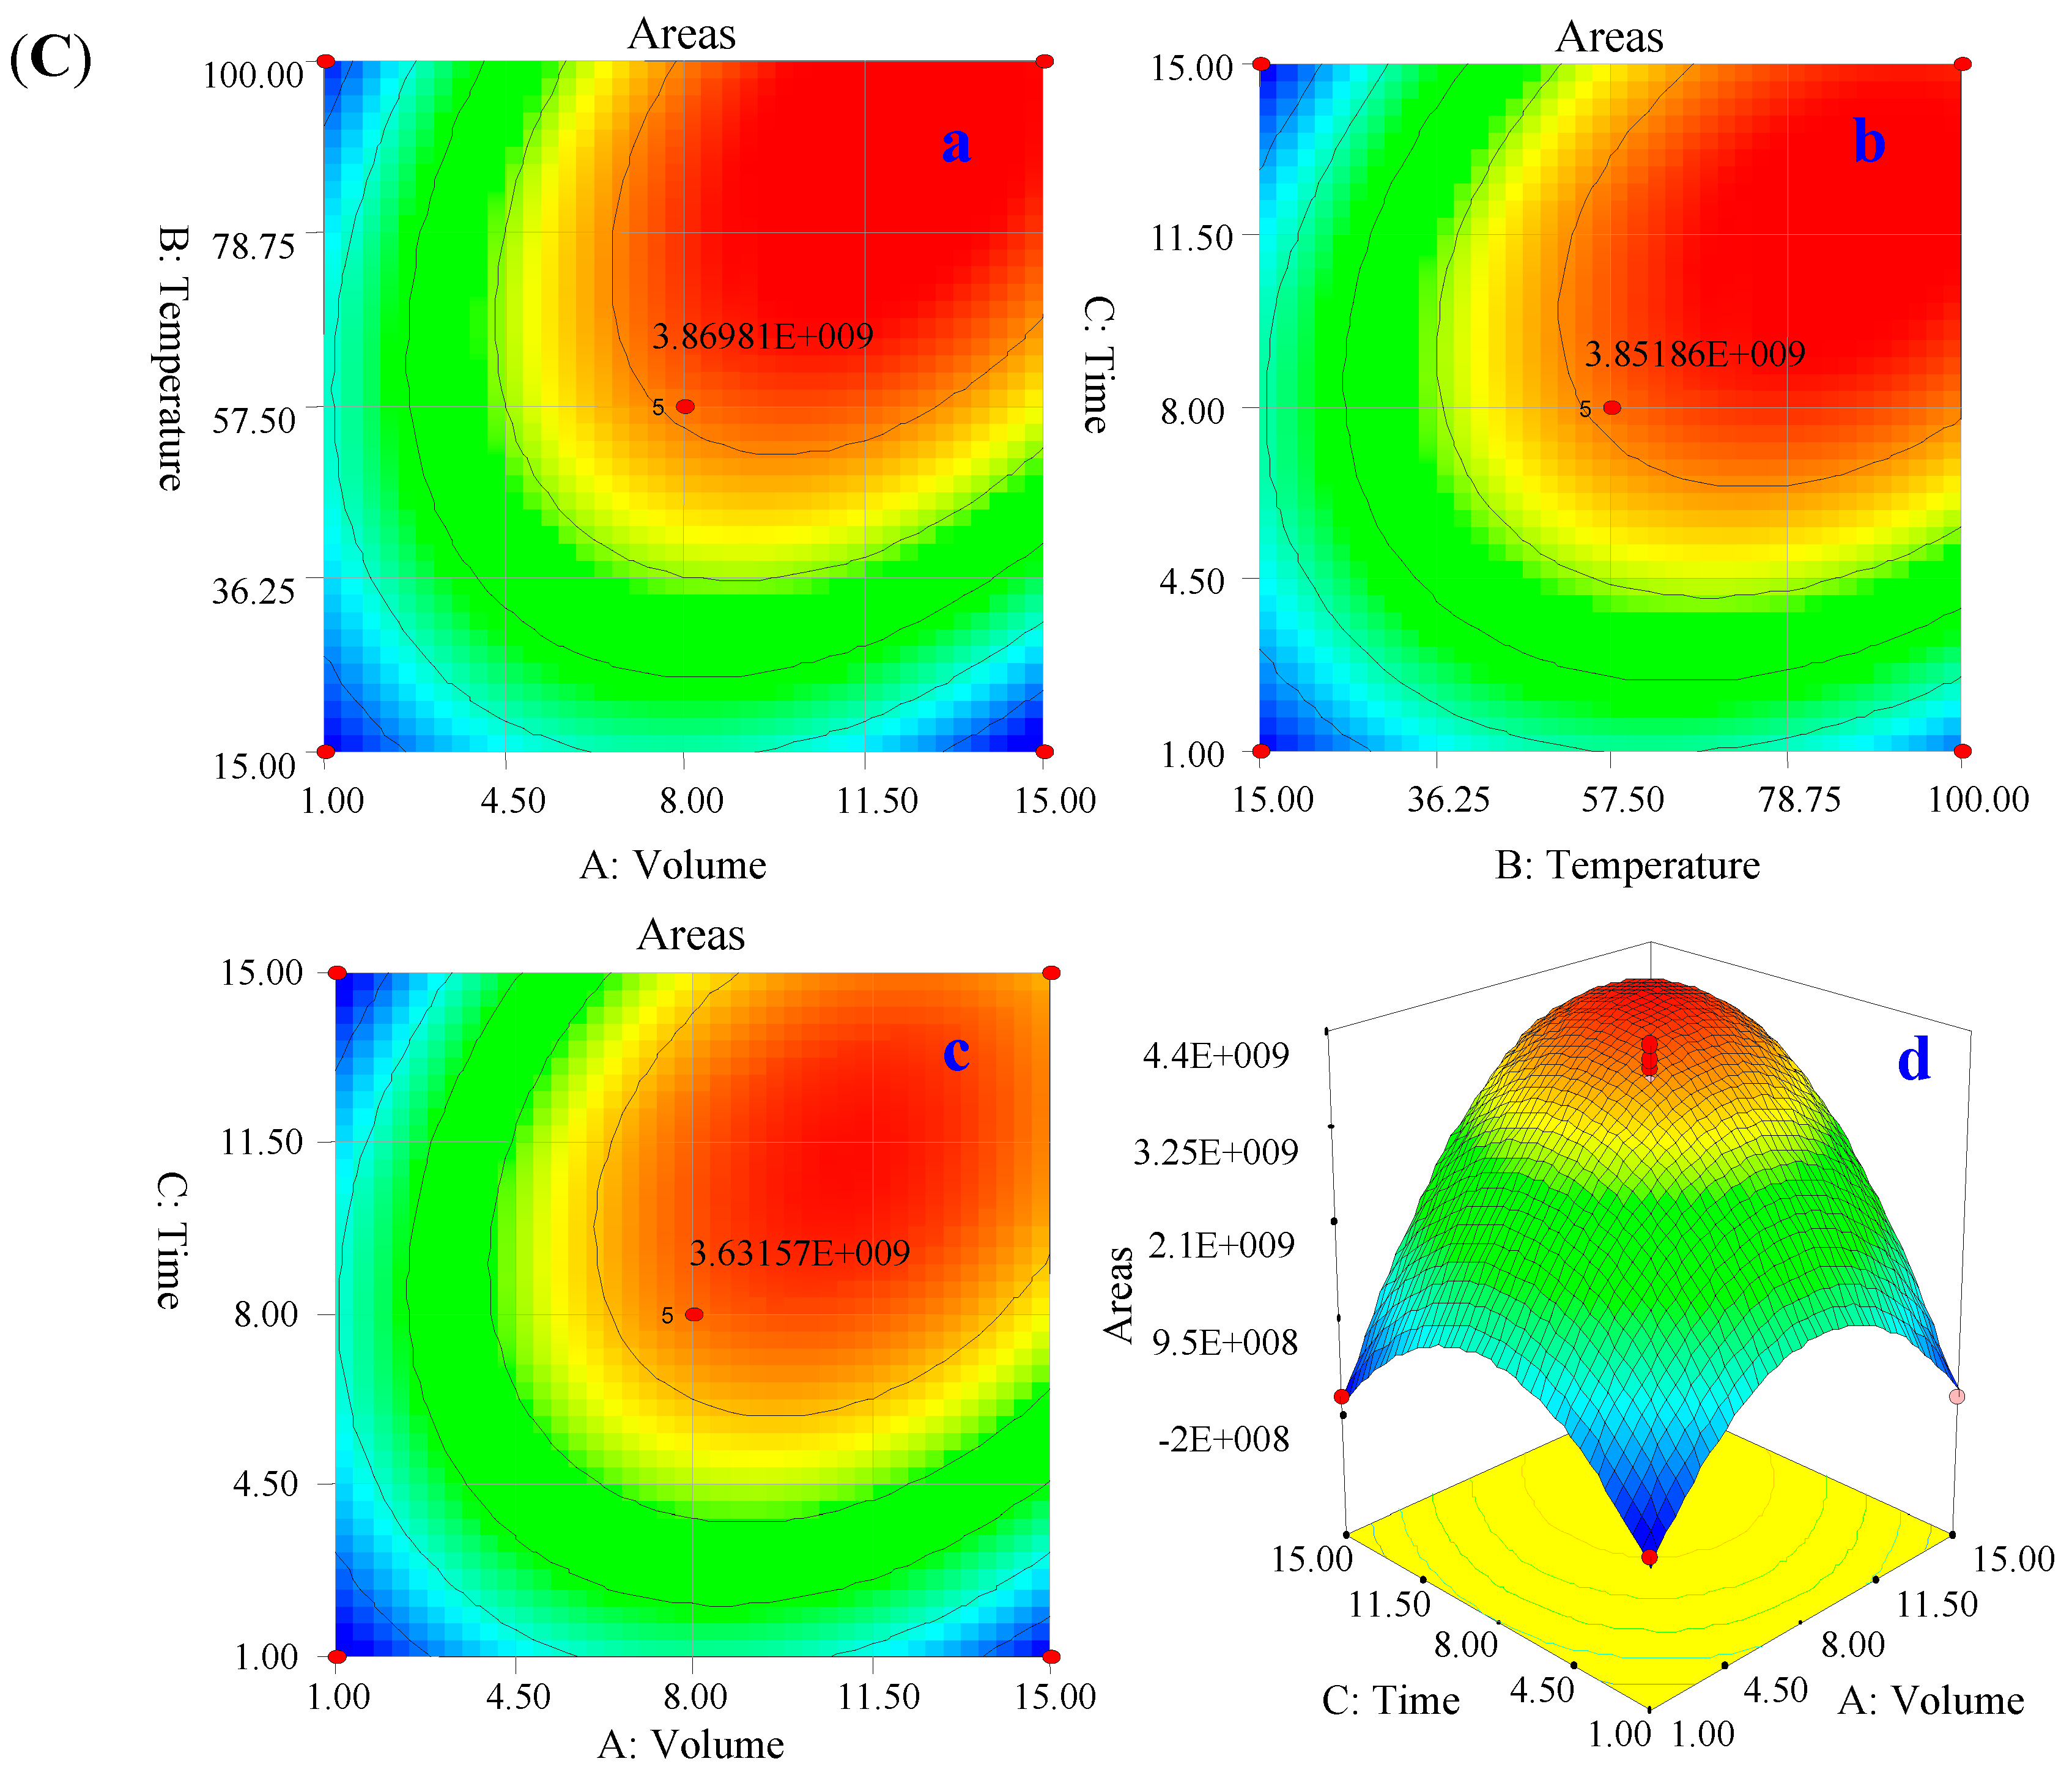
2.1. Optimal Results and Statistical Analysis of Precolumn Methylesterified (PME)


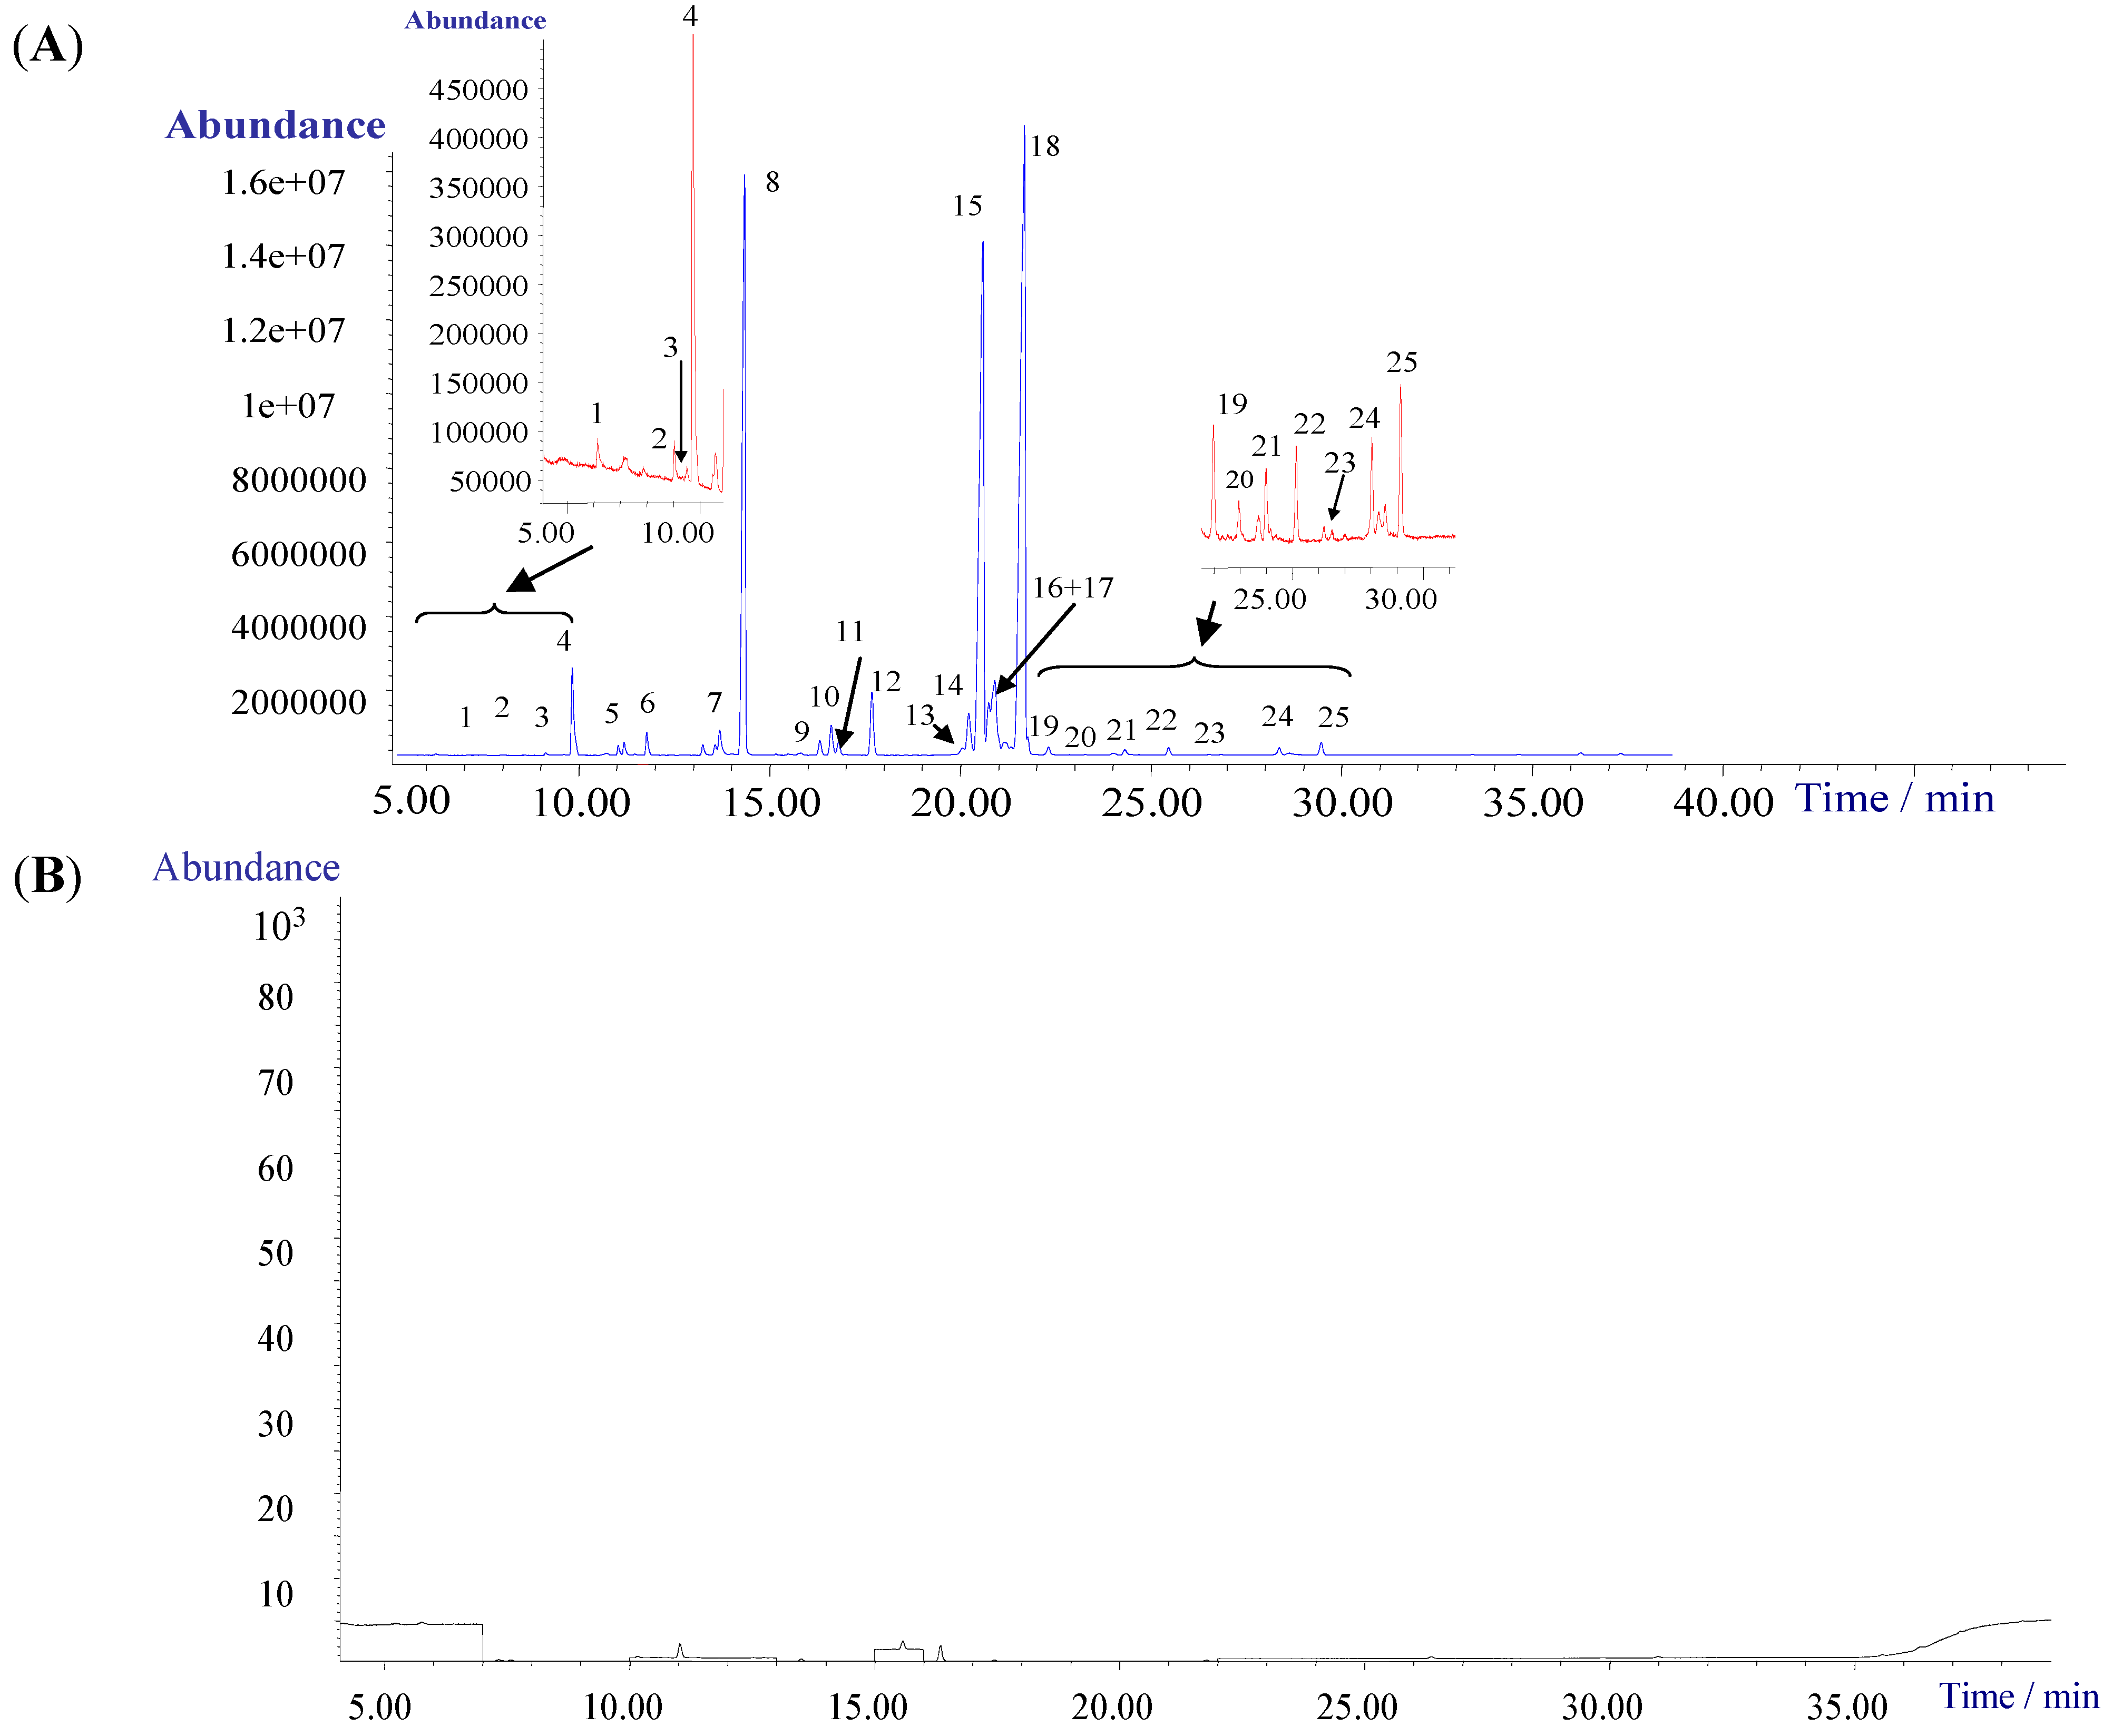
2.2. Fatty Acids (FAs) Composition in Suet Oil (SO)
2.3. Validation of Quantitative Analysis

| No. | RT (min) | Compounds Name | CAS No. | Mw a | Formula | Match (%) | RC b (%) |
|---|---|---|---|---|---|---|---|
| 1 | 6.142 | Dodecanoic acid, methyl ester | 000111-82-0 | 214 | C13H26O2 | 98 | 0.11 |
| 2 | 9.016 | Methyl myristoleate | 056219-06-8 | 240 | C15H28O2 | 96 | 0.19 |
| 3 | 9.504 | Methyl 12-methyl-tridecanoate | 1000336-46-9 | 242 | C15H30O2 | 98 | 0.087 |
| 4 | 9.739 | Tridecanoic acid, 12-methyl-, methyl ester | 005129-58-8 | 242 | C15H30O2 | 94 | 0.25 |
| 5 | 11.071 | Methyl tetradecanoate | 000124-10-7 | 242 | C15H30O2 | 98 | 2.52 |
| 6 | 11.663 | Pentadecanoic acid, methyl ester | 007132-64-1 | 256 | C16H32O2 | 99 | 0.29 |
| 7 | 13.614 | 9-Hexadecenoic acid, methyl ester, (Z)- | 001120-25-8 | 268 | C17H32O2 | 99 | 2.51 |
| 8 | 14.311 | Hexadecanoic acid, methyl ester | 000112-39-0 | 270 | C17H34O2 | 98 | 16.46 |
| 9 | 16.253 | Methyl 15-methylhexadecanoate | 1000336-34-2 | 284 | C18H36O2 | 99 | 0.64 |
| 10 | 16.531 | cis-10-Heptadecenoic acid, methyl ester | 1000333-62-1 | 282 | C18H34O2 | 99 | 0.98 |
| 11 | 16.723 | Heptadecanoic acid, methyl ester | 001731-92-6 | 284 | C18H36O2 | 99 | 1.06 |
| 12 | 17.507 | 9,12-Octadecadienoic acid (Z,Z)-, methyl ester | 000112-63-0 | 294 | C19H34O2 | 99 | 1.61 |
| 13 | 19.492 | Methyl 9-cis,11-trans-octadecadienoate | 1000336-44-0 | 294 | C19H34O2 | 95 | 1.29 |
| 14 | 19.919 | Methyl 10-trans,12-cis-octadecadienoate | 1000336-44-2 | 294 | C19H34O2 | 96 | 0.10 |
| 15 | 20.119 | 9-Octadecenoic acid (E)-, methyl ester | 001937-62-8 | 296 | C19H36O2 | 99 | 37.96 |
| 16 | 20.546 | 9-Octadecenoic acid (Z)-, methyl ester | 000112-62-9 | 296 | C19H36O2 | 99 | 1.97 |
| 17 | 20.955 | 11-Octadecenoic acid, methyl ester | 052380-33-3 | 296 | C19H36O2 | 99 | 2.05 |
| 18 | 21.992 | Octadecanoic acid, methyl ester | 000112-61-8 | 298 | C19H38O2 | 99 | 19.47 |
| 19 | 22.166 | cis-10-Nonadecenoic acid, methyl ester | 1000333-64-4 | 310 | C20H38O2 | 98 | 0.065 |
| 20 | 23.316 | 10-Nonadecenoic acid, methyl ester | 056599-83-8 | 310 | C20H38O2 | 93 | 0.24 |
| 21 | 24.308 | Cyclopropaneoctanoic acid, 2-octyl-, methyl ester | 3971-54-8 | 310 | C20H38O2 | 99 | 0.42 |
| 22 | 25.287 | Nonadecanoic acid, methyl ester | 001731-94-8 | 312 | C20H40O2 | 99 | 0.26 |
| 23 | 26.829 | Methyl 8,11,14-eicosatrienoate | 1000336-38-1 | 320 | C21H36O2 | 97 | 0.034 |
| 24 | 28.262 | cis-11-Eicosenoic acid, methyl ester | 1000333-63-8 | 324 | C21H40O2 | 99 | 0.12 |
| 25 | 29.653 | Eicosanoic acid, methyl ester | 001120-28-1 | 326 | C21H42O2 | 99 | 0.20 |
| NO. of Identified Fatty Acids | Compounds | Linear Regression Equations | Coefficient of Determination/r2 | Linear Range μg/mL | Qualitative/Quantitative Ions | Abundance Ratio (%) | 0.5 Times Spiked (n = 3) | 1.0 Times Spiked (n = 3) | 2.0 Times Spiked (n = 3) | LOQ (μg/mL, ×10−3) | |||
|---|---|---|---|---|---|---|---|---|---|---|---|---|---|
| Recovery (%) | RSDs (%) | Recovery (%) | RSDs (%) | Recovery (%) | RSDs (%) | ||||||||
| 1 | DODME | Y = 1.56 × 10⁴ X − 1.79 × 10³ | 0.999 | 0.010–10.0 | 74 *:28:87:214 | 100:8:64:6 | 85.3 | 4.3 | 92.4 | 4.8 | 93.2 | 2.2 | 1.25 |
| 5 | MTEME | Y = 1.54 × 10⁴ X − 1.48 × 10³ | 0.999 | 0.013–12.8 | 74 *:87:143:199 | 100:68:24:16 | 95.2 | 4.1 | 97.2 | 3.3 | 98.7 | 4.5 | 1.60 |
| 6 | PENME | Y = 1.86 × 10⁴ X − 4.74 × 10³ | 0.999 | 0.011–12.0 | 74 *:87:143:213 | 100:68:20:18 | 91.3 | 6.2 | 92.8 | 4.5 | 95.8 | 4.2 | 1.40 |
| 7 | 9-HEXME | Y = 3.10 × 10³ X − 1.13 × 10³ | 0.999 | 0.020–20.0 | 55 *:74:87:236 | 100:68:50:23 | 83.6 | 4.8 | 94.6 | 3.5 | 96.6 | 2.4 | 2.50 |
| 8 | HEXME | Y = 2.62 × 10⁴ X − 1.579 × 10⁴ | 0.999 | 0.048–50.0 | 74 *:87:143:227 | 100:70:20:14 | 87.5 | 5.2 | 95.4 | 5.4 | 96.9 | 3.8 | 5.95 |
| 11 | HEPME | Y = 2.93 × 10⁴ X − 6.54 × 10³ | 0.999 | 0.013–13.0 | 74 *:87:143:241 | 100:70:22:15 | 87.6 | 6.8 | 90.8 | 5.0 | 92.7 | 4.1 | 1.63 |
| 12 | 9,12-OCME | Y = 7.71 × 10³ X − 1.15 × 10² | 0.999 | 0.020–20.0 | 67 *:81:95:294 | 100:92:66:16 | 91.7 | 4.4 | 91.7 | 2.8 | 93.9 | 3.6 | 2.50 |
| 15 | 9-OCME | Y = 5.02 × 10³ X − 3.62 × 10² | 0.999 | 0.020–20.0 | 55 *:41:81:222 | 100:62:40:24 | 84.8 | 5.1 | 88.4 | 4.2 | 97.2 | 4.4 | 2.50 |
| 18 | OCTME | Y = 3.31 × 10⁴ X − 1.24 × 10⁴ | 0.999 | 0.030–32.0 | 74 *:87:143:255 | 100:72:23:14 | 85.5 | 4.3 | 86.7 | 5.2 | 88.8 | 5.1 | 3.75 |
| 25 | EICME | Y = 3.18 × 10⁴ X − 4.78 × 10³ | 0.999 | 0.010–10.8 | 74 *:87:143:255 | 100:76:26:18 | 82.1 | 3.9 | 90.1 | 4.7 | 89.4 | 3.7 | 1.25 |

2.4. Quantitative Results
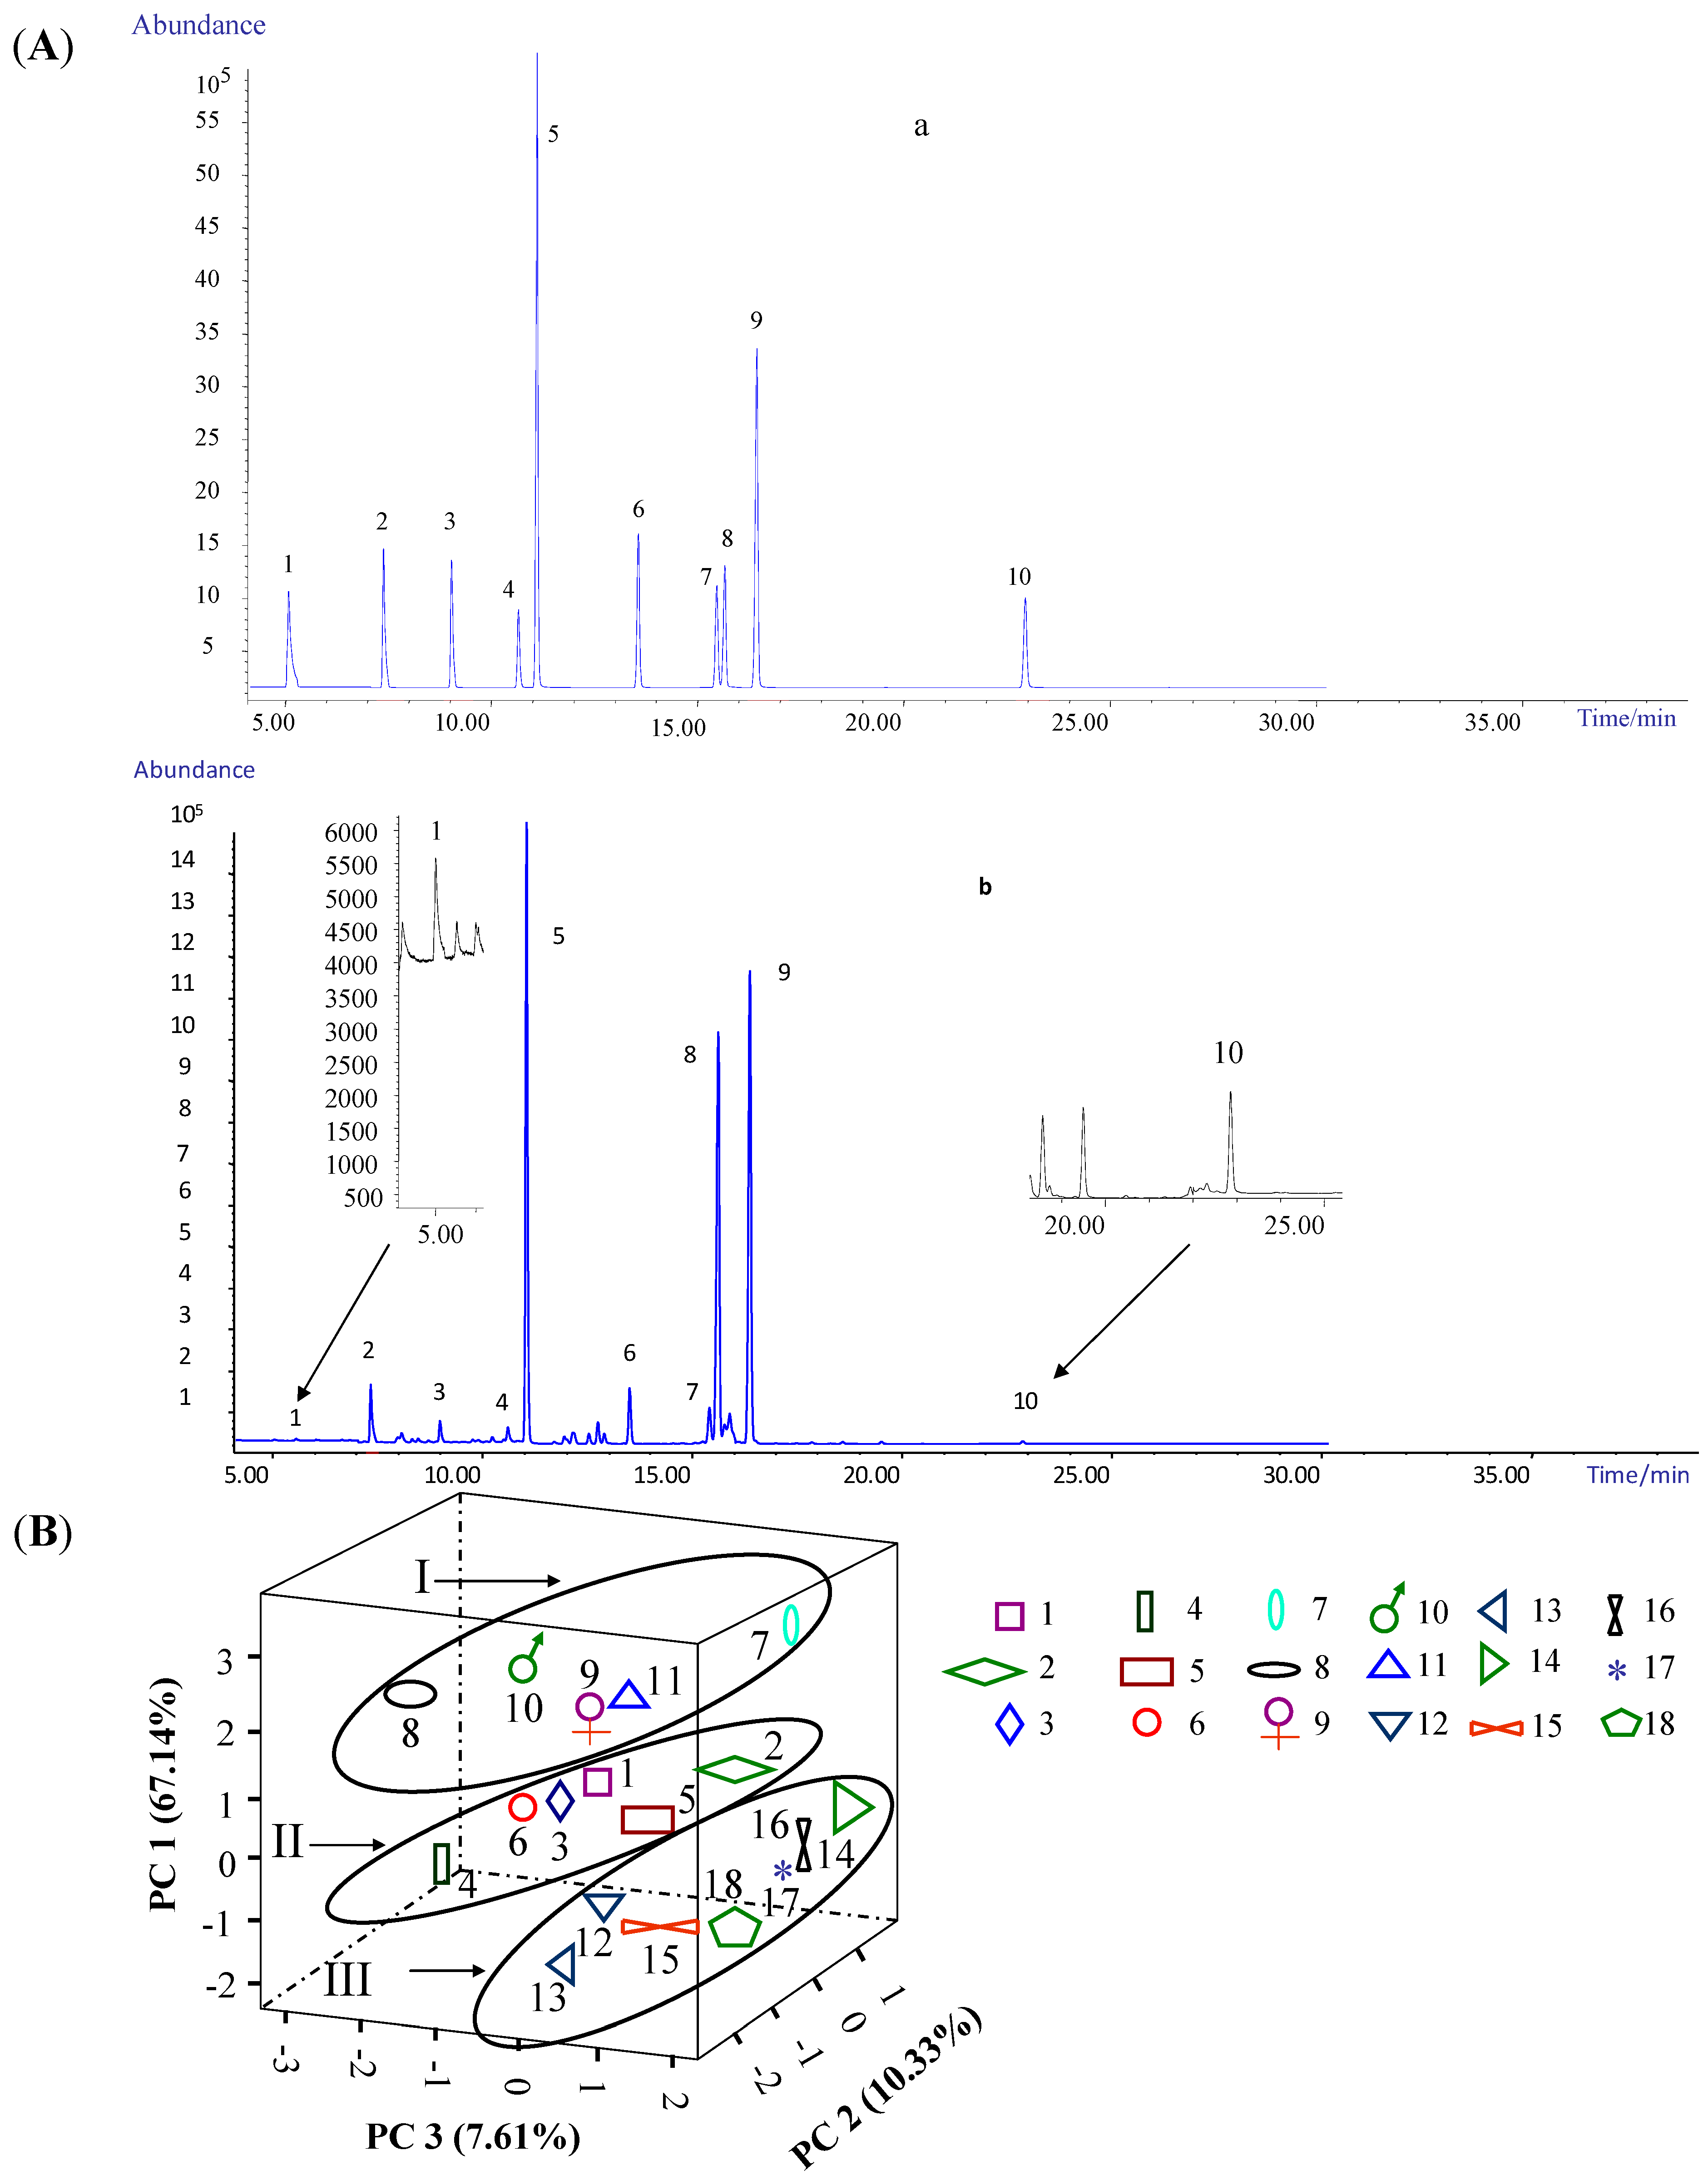
2.5. Principal Component Analysis (PCA) of the SO Samples
| FAs Compounds | DODME | MTEME | PENME | 9-HEXME | HEXME | HEPME | 9,12-OCME | 9-OCME | OCTME | EICME |
|---|---|---|---|---|---|---|---|---|---|---|
| Coefficient “A” a | 0.9348 | 0.9414 | 0.9454 | 0.9478 | 0.9482 | 0.9508 | 0.9524 | 0.9527 | 0.9531 | 0.9571 |
| Batch | Content (g/100 g, %) b | |||||||||
| 1 | 0.0240 ± 0.0014 | 1.1476 ± 0.0014 | 0.2124 ± 0.0002 | 0.5716 ± 0.0012 | 8.9067 ± 0.1483 | 0.4996 ± 0.0006 | 0.8667 ± 0.0015 | Nd | 12.5609 ± 0.1614 | 0.0933 ± 0.0021 |
| 2 | 0.0284 ± 0.0010 | 1.0827 ± 0.0012 | 0.1787 ± 0.0015 | 0.4596 ± 0.0029 | 7.6098 ± 0.0040 | 0.5022 ± 0.0011 | 1.1867 ± 0.0023 | Nd | 11.0827 ± 0.0011 | 0.1040 ± 0.0023 |
| 3 | 0.0284 ± 0.0009 | 0.8684 ± 0.0010 | 0.2009 ± 0.0028 | 0.4044 ± 0.0025 | 6.2578 ± 0.0157 | 0.5289 ± 0.0053 | 1.1218 ± 0.0102 | Nd | 8.7600 ± 0.3606 | 0.0942 ± 0.0013 |
| 4 | 0.0196 ± 0.0004 | 0.4862 ± 0.0015 | 0.2098 ± 0.0039 | 0.4204 ± 0.0023 | 4.4382 ± 0.0011 | 0.4551 ± 0.0022 | 0.6587 ± 0.0065 | Nd | 4.0124 ± 0.0017 | 0.0471 ± 0.0008 |
| 5 | 0.0231 ± 0.0023 | 0.7707 ± 0.0083 | 0.1991 ± 0.0017 | 0.3191 ± 0.0017 | 5.8071 ± 0.0045 | 0.5707 ± 0.0015 | 0.6604 ± 0.0024 | 4.5991 ± 0.0053 | 10.2213 ± 0.0163 | 0.1467 ± 0.0032 |
| 6 | 0.0418 ± 0.0012 | 1.1912 ± 0.0034 | 0.2844 ± 0.0012 | 1.3378 ± 0.0051 | 7.5067 ± 0.0074 | 0.6187 ± 0.0052 | 0.9227 ± 0.0008 | Nd | 8.3093 ± 0.0297 | 0.0978 ± 0.0017 |
| 7 | 0.0400 ± 0.0031 | 1.9422 ± 0.0068 | 0.3040 ± 0.0108 | 1.1564 ± 0.0020 | 13.2151 ± 0.0241 | 0.7956 ± 0.0023 | 1.4640 ± 0.0028 | Nd | 18.1129 ± 0.0028 | 0.1662 ± 0.0035 |
| 8 | 0.0328 ± 0.0017 | 1.1182 ± 0.0037 | 0.2729 ± 0.0017 | 0.7662 ± 0.0026 | 7.9458 ± 0.0026 | 0.7218 ± 0.0017 | 0.9048 ± 0.0033 | Nd | 12.1111 ± 0.0015 | 0.1582 ± 0.0001 |
| 9 | 0.0400 ± 0.0031 | 1.4516 ± 0.0012 | 0.3902 ± 0.0035 | 0.8649 ± 0.0033 | 10.8133 ± 0.0034 | 1.1004 ± 0.0001 | 1.4924 ± 0.0035 | Nd | 12.9360 ± 0.0275 | 0.1111 ± 0.0016 |
| 10 | 0.0280 ± 0.0046 | 1.0978 ± 0.0045 | 0.2516 ± 0.0024 | 0.4222 ± 0.0029 | 8.264 ± 0.0394 | 0.6960 ± 0.0027 | 1.0480 ± 0.0042 | Nd | 13.0320 ± 0.0337 | 0.1467 ± 0.0040 |
| 11 | 0.0373 ± 0.0035 | 1.1991 ± 0.0031 | 0.4791 ± 0.0033 | 0.4764 ± 0.0040 | 10.0676 ± 0.0045 | 0.9218 ± 0.0017 | 0.8107 ± 0.0059 | Nd | 14.2569 ± 0.0029 | 0.1040 ± 0.0016 |
| 12 | 0.0356 ± 0.0039 | 1.0196 ± 0.0041 | 0.2658 ± 0.0039 | 0.7564 ± 0.0031 | 6.7449 ± 0.0017 | 0.4942 ± 0.0033 | 0.7787 ± 0.0041 | 6.2764 ± 0.0023 | 6.0773 ± 0.0036 | 0.0560 ± 0.0034 |
| 13 | 0.0178 ± 0.0040 | 0.4080 ± 0.0046 | 0.1769 ± 0.0034 | 0.3396 ± 0.0044 | 3.7902 ± 0.0047 | 0.3804 ± 0.0018 | 0.5449 ± 0.0039 | 5.4489 ± 0.0048 | 3.4080 ± 0.0051 | 0.0382 ± 0.0012 |
| 14 | 0.0322 ± 0.0035 | 1.1831 ± 0.0040 | 0.2391 ± 0.0045 | 0.4276 ± 0.0046 | 8.3760 ± 0.0164 | 0.5822 ± 0.0029 | 1.2240 ± 0.0167 | 5.2880 ± 0.0282 | 11.2276 ± 0.0060 | 0.087 ± 0.0045 |
| 15 | 0.0240 ± 0.0023 | 0.6462 ± 0.0034 | 0.1458 ± 0.0028 | 0.4587 ± 0.0013 | 4.6827 ± 0.0034 | 0.3671 ± 0.0035 | 0.6240 ± 0.0293 | 5.0649 ± 0.0034 | 6.6560 ± 0.0220 | 0.0773 ± 0.0038 |
| 16 | 0.0267 ± 0.0029 | 0.8071 ± 0.0039 | 0.1636 ± 0.0032 | 0.3363 ± 0.0032 | 5.8738 ± 0.0015 | 0.4747 ± 0.0038 | 1.0738 ± 0.0028 | 4.8996 ± 0.0044 | 9.0898 ± 0.0042 | 0.0969 ± 0.0023 |
| 17 | 0.0267 ± 0.0034 | 0.7911 ± 0.0061 | 0.1564 ± 0.0028 | 0.3209 ± 0.0078 | 5.4720 ± 0.0406 | 0.4329 ± 0.0030 | 1.0169 ± 0.0033 | 4.6578 ± 0.0046 | 8.1529 ± 0.0040 | 0.0862 ± 0.0039 |
| 18 | 0.0160 ± 0.0051 | 0.6969 ± 0.0034 | 0.0907 ± 0.0064 | 0.3413 ± 0.0031 | 5.5209 ± 0.0071 | 0.2480 ± 0.0046 | 0.5013 ± 0.0034 | 4.4756 ± 0.0034 | 7.9644 ± 0.0033 | 0.0622 ± 0.0042 |
3. Experimental Section
3.1. Materials
3.2. Sample Material
3.3. Box–Behnken Design for Optimization of PME Parameters
3.4. PME Procedure
3.5. Sample Pretreatment for Quantitative Analysis
3.6. Preparation of Standard Solutions
3.7. GC–EI-qMS Analysis Conditions
3.8. Method for PCA of Samples
4. Conclusions
Supplementary Materials
Acknowledgments
Author Contributions
Conflicts of Interest
References
- Thurnhofer, S.; Hottinger, G.; Vetter, W. Enantioselective determination of anteiso fatty acids in food samples. Anal. Chem. 2007, 79, 4696–4701. [Google Scholar] [CrossRef] [PubMed]
- Mattacks, C.A.; Sadler, D.; Pond, C.M. Site-specific differences in the action of NRTI drugs on adipose tissue incubated in vitro with lymphoid cells, and their interaction with dietary lipids. Comp. Biochem. Phys. 2003, 135, 11–29. [Google Scholar]
- Thurnhofer, S.; Vetter, W. A gas chromatography/electron ionization-mass spectrometry-selected ion monitoring method for determining the fatty acid pattern in food after formation of fatty acid methyl esters. J. Agric. Food Chem. 2005, 53, 8896–8903. [Google Scholar] [CrossRef] [PubMed]
- Barzanti, V.; Maranesi, M.; Cornia, G.L.; Malavolti, M.; Mordenti, T.; Pregnolato, P. Effect of dietary oils containing different amounts of precursor and derivative fatty acids on prostaglandin E2 synthesis in liver, kidney and lung of rats. Prostag. Leukotr. Essent. 1999, 60, 49–54. [Google Scholar] [CrossRef]
- Cui, L.; Sun, E.; Zhang, Z.H.; Tan, X.B.; Wei, Y.J.; Jin, X. Enhancement of epimedium fried with suet oil based on in vivo formation of self-assembled flavonoid compound nanomicelles. Molecules 2012, 17, 12984–12996. [Google Scholar] [CrossRef] [PubMed]
- Ansorena, D.; Raes, K.; de Smet, S.; Demeyer, D. Analysis of fatty acid isomers in ruminant tissues by silver thin layer chromatography followed by gas chromatography. Meded. Rijksuniv. Gent Fak. Landbouwkd. Toegep. Biol. Wet. 2001, 66, 365–372. [Google Scholar] [PubMed]
- Zhang, S.; Sun, Y.; Sun, Z.; Wang, X.; You, J.; Suo, Y. Determination of triterpenic acids in fruits by a novel high performance liquid chromatography method with high sensitivity and specificity. Food Chem. 2014, 146, 264–269. [Google Scholar] [CrossRef] [PubMed]
- Wang, A.; Li, G.; You, J.; Ji, Z. A new fluorescent derivatization reagent and its application to free fatty acid analysis in pomegranate samples using HPLC with fluorescence detection. J. Sep. Sci. 2013, 36, 3853–3859. [Google Scholar] [CrossRef] [PubMed]
- Bielawska, K.; Dziakowska, I.; Roszkowska-Jakimiec, W. Chromatographic determination of fatty acids in biological material. Toxicol. Mech. Methods 2010, 20, 526–537. [Google Scholar] [CrossRef] [PubMed]
- Li, A.; Ha, Y.; Wang, F.; Li, W.; Li, Q. Determination of thermally induced trans-fatty acids in soybean oil by attenuated total reflectance fourier transform infrared spectroscopy and gas chromatography analysis. J. Agric. Food Chem. 2012, 60, 10709–10713. [Google Scholar] [CrossRef] [PubMed]
- Bogusz, S.J.; Hantao, L.W.; Braga, S.C.; de Matos França, V.C.; da Costa, M.F. Solid-phase microextraction combined with comprehensive two dimensional gas chromatography for fatty acid profiling of cell wall phospholipids. J. Sep. Sci. 2012, 35, 2438–2444. [Google Scholar] [CrossRef] [PubMed]
- Hori, K.; Matsubara, A.; Uchikata, T.; Tsumura, K.; Fukusaki, E.; Bamba, T. High-throughput and sensitive analysis of 3-monochloropropane-1,2-diol fatty acid esters in edible oils by supercritical fluid chromatography/tandem mass spectrometry. J. Chromatogr. A 2012, 1250, 99–104. [Google Scholar] [CrossRef] [PubMed]
- Aslan, M.; Ozcan, F.; Aslan, B.; Yücel, G. LC–MS/MS analysis of plasma polyunsaturated fatty acids in type 2 diabetic patients after insulin analog initiation therapy. Lipidis Health Dis. 2013, 12, 169. [Google Scholar] [CrossRef]
- Derogis, P.B.; Freitas, F.P.; Marques, A.S.; Cunha, D.; Appolinário, P.P.; de Paula, F. Detection and quantification of Hydroperoxy and Hydroxydo-cosahexaenoic acids as a tool for lipidomic analysis. PLoS One 2013, 8, e77561. [Google Scholar] [CrossRef] [PubMed]
- Le Faouder, P.; Baillif, V.; Spreadbury, I.; Motta, J.P.; Rousset, P.; Chêne, G. LC–MS/MS method for rapid and concomitant quantification of pro-inflammatory and pro-resolving polyunsaturated fatty acid metabolites. J. Chromatogr. B 2013, 932, 123–133. [Google Scholar] [CrossRef]
- Takahashi, H.; Suzuki, H.; Suda, K.; Yamazaki, Y.; Takino, A.; Kim, Y.I. Long-chain free fatty acid profiling analysis by liquid chromatography–mass spectrometry in mouse treated with peroxisome proliferator-activated receptor α agonist. Biosci. Biotechnol. Biochem. 2013, 77, 2288–2293. [Google Scholar] [CrossRef] [PubMed]
- Zeng, A.X.; Chin, S.T.; Nolvachai, Y.; Kulsing, C.; Sidisky, L.M.; Marriott, P.J. Characterisation of capillary ionic liquid columns for gas chromatography mass spectrometry analysis of fatty acid methyl esters. Anal. Chim. Acta 2013, 803, 166–173. [Google Scholar] [CrossRef] [PubMed]
- Valianpour, F.; Selhorst, J.J.; van Lint, L.E.; van Gennip, A.H.; Wanders, R.J.; Kemp, S. Analysis of very long-chain fatty acids using electrospray ionization mass spectrometry. Mol. Genet. Metab. 2003, 79, 189–196. [Google Scholar] [CrossRef] [PubMed]
- Byss, M.; Tríska, J.; Elhottová, D. GC–MS–MS analysis of bacterial fatty acids in heavily creosote-contaminated soil samples. Anal. Bioanal. Chem. 2007, 387, 1573–1577. [Google Scholar] [CrossRef] [PubMed]
- Oursel, D.; Loutelier-Bourhis, C.; Orange, N.; Chevalier, S.; Norris, V.; Lange, C.M. Identification and relative quantification of fatty acids in Escherichia coli membranes by gas chromatography/mass spectrometry. Rapid Commun. Mass Spectrom. 2007, 21, 3229–3233. [Google Scholar] [CrossRef] [PubMed]
- Catarina, L.S.; José, S.C. Profiling of volatiles in the leaves of Lamiaceae species based on headspace solid phase microextraction and mass spectrometry. Food Res. Int. 2013, 51, 378–387. [Google Scholar] [CrossRef]
- Mahinda, W.; Thava, V.; Feral, T.; Kevin, S. Volatile flavour composition of cooked by-product blends of chicken, beef and pork: A quantitative GC–MS investigation. Food Res. Int. 2001, 34, 149–158. [Google Scholar] [CrossRef]
- Diana, A.; Olga, G.; Iciar, A.; José, B. Analysis of volatile compounds by GC–MS of a dry fermented sausage: Chorizo de Pamplona. Food Res. Int. 2001, 34, 67–75. [Google Scholar] [CrossRef]
- Dodds, E.D.; McCoy, M.R.; Rea, L.D.; Kennish, J.M. Gas chromatographic quantification of fatty acid methyl esters: Flame ionization detection vs. electron impact mass spectrometry. Lipids 2005, 40, 419–428. [Google Scholar] [CrossRef] [PubMed]
- Saliu, F.; Orlandi, M. In situ alcoholysis of triacylglycerols by application of switchable-polarity solvents. A new derivatization procedure for the gas chromatographic analysis of vegetable oils. Anal. Bioanal. Chem. 2013, 405, 8677–8684. [Google Scholar] [CrossRef] [PubMed]
- Igarashi, M.; Tsuzuki, T.; Kambe, T.; Miyazawa, T. Recommended methods of fatty acid methylester preparation for conjugated dienes and trienes in food and biological samples. J. Nutr. Sci. Vitaminol. 2004, 50, 121–128. [Google Scholar] [CrossRef] [PubMed]
- Box, G.E.P.; Wlson, K.B. On the experimental attainment of optimum conditions. J. R. Stat. Soc. 1951, 13, 1–45. [Google Scholar]
- Luo, C.; Chen, Y.S. Optimization of extraction technology of Se-enriched Hericium erinaceum polysaccharides by Box–Behnken statistical design and its inhibition against metal elements loss in skull. Carbohydr. Polym. 2010, 82, 845–860. [Google Scholar]
- Jiang, J.; Feng, L.; Li, J.; Sun, E.; Ding, S.M.; Jia, X.B. Multielemental composition of suet oil based on quantification by ultrawave/ICP-MS coupled with chemometric analysis. Molecules 2014, 19, 4452–4465. [Google Scholar] [CrossRef] [PubMed]
© 2015 by the authors; licensee MDPI, Basel, Switzerland. This article is an open access article distributed under the terms and conditions of the Creative Commons Attribution license (http://creativecommons.org/licenses/by/4.0/).
Share and Cite
Jiang, J.; Jia, X. Profiling of Fatty Acids Composition in Suet Oil Based on GC–EI-qMS and Chemometrics Analysis. Int. J. Mol. Sci. 2015, 16, 2864-2878. https://doi.org/10.3390/ijms16022864
Jiang J, Jia X. Profiling of Fatty Acids Composition in Suet Oil Based on GC–EI-qMS and Chemometrics Analysis. International Journal of Molecular Sciences. 2015; 16(2):2864-2878. https://doi.org/10.3390/ijms16022864
Chicago/Turabian StyleJiang, Jun, and Xiaobin Jia. 2015. "Profiling of Fatty Acids Composition in Suet Oil Based on GC–EI-qMS and Chemometrics Analysis" International Journal of Molecular Sciences 16, no. 2: 2864-2878. https://doi.org/10.3390/ijms16022864
APA StyleJiang, J., & Jia, X. (2015). Profiling of Fatty Acids Composition in Suet Oil Based on GC–EI-qMS and Chemometrics Analysis. International Journal of Molecular Sciences, 16(2), 2864-2878. https://doi.org/10.3390/ijms16022864