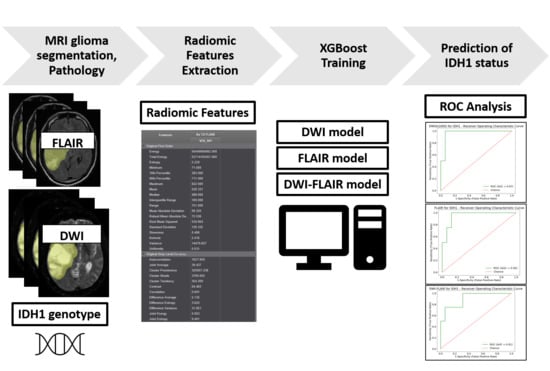
MRI Radiomic Features to Predict IDH1 Mutation Status in Gliomas: A Machine Learning Approach using Gradient Tree Boosting

 , ,
, ,
Abstract
1. Introduction
2. Results
2.1. Patient Characteristics
2.2. Prediction of IDH1 Mutation Status Using XGBoost Models
3. Discussion
4. Materials and Methods
4.1. Patient Population
4.2. Histopathological Data
4.3. NGS Analysis
4.4. Image Acquisition
4.5. Volume Acquisition and Texture Analysis
4.6. Statistical Analysis and ML
4.6.1. Radiomic Features Analysis
4.6.2. ML Classifier Procedure
Author Contributions
Funding
Conflicts of Interest
Abbreviations
| AUC | Area Under the Curve |
| ADC | Apparent Diffusion Coefficient |
| DWI | Diffusion-Weighted-Imaging |
| FLAIR | Fluid-Attenuated Inversion Recovery |
| GB | Gradient Boosting |
| H&E | Hematoxylin and eosin |
| IDH1 | Isocitrate Dehydrogenase 1 |
| IHC | Immunohistochemistry |
| MRI | Magnetic Resonance Imaging |
| NGS | Next Generation Sequencing |
| RF | Random Forest |
| ROC | Receiver Operating Characteristic curve |
| SMOTE | Synthetic Minority Oversampling Technique |
| SVM | Support Vector Machine |
| T1c+ | Post-contrast T1 |
| XGBoost | eXtreme Gradient Boosting |
Appendix A

| Radiomic Feature | p-Value | IDH1 Wildtype Mean ± SD | IDH1 Mutant Mean ± SD |
|---|---|---|---|
| FLAIR_Original Gray Level Run Length Matrix Short Run High Gray Level Emphasis | <0.001 | 1093.41 ± 372.49 | 1456.95 ± 376.78 |
| FLAIR_Original Gray Level Size Zone Matrix Small Area High Gray Level Emphasis | <0.001 | 635.48 ± 187.18 | 824.98 ± 1 91.8 |
| FLAIR_Original Gray Level Run Length Matrix High Gray Level Run Emphasis | <0.001 | 1201.22 ± 405.95 | 1602.17 ± 426.86 |
| FLAIR_Original Gray Level Dependence Matrix High Gray Level Emphasis | <0.001 | 1209.73 ± 412.96 | 1613.11 ± 433.94 |
| FLAIR_Original Gray Level Co-occurrence Matrix Cluster Shade | 0.001 | −167.45 ± 1997.12 | −2819.29 ± 5053.17 |
| FLAIR_Original Gray Level Co-occurrence Matrix Autocorrelation | 0.001 | 1228.14 ± 426.63 | 1619.82 ± 455.56 |
| FLAIR_Original Gray Level Co-occurrence Matrix Joint Average | 0.002 | 33.81 ± 6.42 | 39.06 ± 5.76 |
| FLAIR_Original Gray Level Co-occurrence Matrix Sum Average | 0.002 | 67.62 ± 12.85 | 78.12 ± 11.52 |
| FLAIR_Original First Order Skewness | 0.003 | −0.02 ± 0.57 | −56 ± 0.67 |
| DWI_Original Gray Level Size Zone Matrix Small Area High Gray Level Emphasis | 0.005 | 546.7 ± 250.71 | 743.57 ± 287.76 |
| FLAIR_Original Gray Level Run Length Matrix Long Run High Gray Level Emphasis | 0.006 | 1997.25 ± 716.52 | 2621.33 ± 982.83 |
| DWI_Original Gray Level Run Length Matrix High Gray Level Run Emphasis | 0.007 | 831.51 ± 457.59 | 1205.94 ± 547.74 |
| DWI_Original Gray Level Run Length Matrix Short Run High Gray Level Emphasis | 0.007 | 769.52 ± 434.1 | 1119.01 ± 509.77 |
| DWI_Original Gray Level Dependence Matrix High Gray Level Emphasis | 0.007 | 825.3 ± 462.6 | 1201.58 ± 553.71 |
| FLAIR_Original Gray Level Dependence Matrix Small Dependence High Gray Level Emphasis | 0.007 | 241.62 ± 118.86 | 316.36 ± 117.92 |
| DWI_Original First Order Skewness | 0.008 | 0.46 ± 1.06 | −0.32 ± 0.9 |
| FLAIR_Original First Order Range | 0.010 | 1214.54 ± 671.87 | 989.59 ± 882 |
| DWI_Original Gray Level Run Length Matrix Long Run High Gray Level Emphasis | 0.010 | 1211.61 ± 574.88 | 1710.77 ± 768.55 |
| DWI_Original Gray Level Dependence Matrix Small Dependence High Gray Level Emphasis | 0.012 | 213.92 ± 161.61 | 312.42 ± 172.48 |
| DWI_Original Gray Level Co-occurrence Matrix Autocorrelation | 0.012 | 821.63 ± 471.38 | 1184.7 ± 570.82 |
| DWI_Original Neighboring Gray Tone Difference Matrix Busyness | 0.013 | 1.23 ± 1.02 | 0.68 ± 0.53 |
| DWI_Original First Order Maximum | 0.014 | 1174.11 ± 596.34 | 835.35 ± 453.04 |
| FLAIR_Original Neighboring Gray Tone Difference Matrix Busyness | 0.014 | 4.04 ± 3.16 | 2.17 ± 1.59 |
| DWI_Original Gray Level Co-occurrence Matrix Joint Average | 0.015 | 26.59 ± 8.64 | 32.68 ± 8.43 |
| DWI_Original Gray Level Co-occurrence Matrix Sum Average | 0.015 | 53.18 ± 17.29 | 65.35 ± 16.86 |
| DWI_Original First Order Uniformity | 0.022 | 0.05 ± 0.02 | 0.04 ± 0.01 |
| DWI_Original First Order Range | 0.023 | 1101.2 ± 596.03 | 775.94 ± 454.76 |
| DWI_Original Gray Level Dependence Matrix Gray Level Variance | 0.024 | 62.83 ± 36.88 | 78.73 ± 30.73 |
| DWI_Original Gray Level Run Length Matrix Gray Level Non Uniformity Normalized | 0.024 | 0.05 ± 0.02 | 0.04 ± 0.01 |
| DWI_Original Gray Level Run Length Matrix Gray Level Variance | 0.024 | 64.79 ± 36.43 | 80.37 ± 30.18 |
| DWI_Original Gray Level Run Length Matrix Gray Level Non Uniformity | 0.027 | 1106.8 ± 928.02 | 619.32 ± 481.82 |
| DWI_Original Gray Level Dependence Matrix Gray Level Non Uniformity | 0.031 | 1403.34 ± 1300.29 | 728.69 ± 584.29 |
| DWI_Original Neighboring Gray Tone Difference Matrix Contrast | 0.032 | 0.1 ± 0.1 | 0.14 ± 0.11 |
| DWI_Original Neighboring Gray Tone Difference Matrix Coarseness | 0.034 | 0.00 ± 0.0015 | 0.0013 ± 0.0016 |
| DWI_Original Gray Level Dependence Matrix Large Dependence High Gray Level Emphasis | 0.034 | 15,902.19 ± 7204.39 | 21,277.99 ± 11,907.81 |
| FLAIR_Original First Order Maximum | 0.036 | 1461.66 ± 783.13 | 1223.18 ± 953.74 |
| DWI_Original Gray Level Size Zone Matrix Small Area Emphasis | 0.037 | 0.59 ± 0.05 | 0.62 ± 0.05 |
| FLAIR_Original Gray Level Co-occurrence Matrix Informal Measure of Correlation 2 | 0.037 | 0.77 ± 0.09 | 0.82 ± 0.09 |
| FLAIR_Original Neighboring Gray Tone Difference Matrix Strength | 0.038 | 0.53 ± 1.08 | 0.51 ± 0.42 |
| DWI_Original Gray Level Size Zone Matrix Size Zone Non Uniformity Normalized | 0.039 | 0.33 ± 0.05 | 0.36 ± 0.05 |
| FLAIR_Original Neighboring Gray Tone Difference Matrix Coarseness | 0.039 | 0.0003 ± 0.0005 | 0.0003 ± 0.0002 |
| FLAIR_Original First Order Standard Deviation | 0.045 | 151.45 ± 77.39 | 132.06 ± 109.62 |
| FLAIR_Original First Order Variance | 0.045 | 28,850.28 ± 32,282.11 | 28,910.57 ± 43,752.27 |
| FLAIR_Original First Order Total Energy | 0.046 | 73,306,599,504.28 ± 90,074,867,196.59 | 78,905,231,446.5 ± 128,228,405,390.59 |
| DWI_Original First Order Entropy | 0.047 | 4.7 ± 0.49 | 4.95 ± 0.29 |
| DWI_Original Gray Level Size Zone Matrix Gray Level Non Uniformity Normalized | 0.047 | 0.03 ± 0.01 | 0.03 ± 0.005 |
| Radiomic Feature | p-Value | Glioblastoma Mean ± SD | Non-glioblastoma Mean ± SD |
|---|---|---|---|
| FLAIR_Original Gray Level Run Length Matrix Short Run High Gray Level Emphasis | <0.001 | 1079.74 ± 349.33 | 1572.62 ± 367.53 |
| FLAIR_Original Gray Level Size Zone Matrix Small Area High Gray Level Emphasis | <0.001 | 628.91 ± 172.61 | 882.89 ± 198.65 |
| FLAIR_Original Gray Level Run Length Matrix High Gray Level Run Emphasis | <0.001 | 1187.83 ± 380.14 | 1722.54 ± 429.06 |
| FLAIR_Original Gray Level Dependence Matrix High Gray Level Emphasis | <0.001 | 1195.65 ± 386.56 | 1736.83 ± 435.68 |
| FLAIR_Original Gray Level Co-occurrence Matrix Autocorrelation | <0.001 | 1212.08 ± 398.97 | 1750.11 ± 460.47 |
| FLAIR_Original Gray Level Dependence Matrix Small Dependence High Gray Level Emphasis | <0.001 | 233.31 ± 109.06 | 363.58 ± 120.84 |
| FLAIR_Original Gray Level Co-occurrence Matrix Joint Average | <0.001 | 33.62 ± 6.08 | 40.72 ± 5.82 |
| FLAIR_Original Gray Level Co-occurrence Matrix Sum Average | <0.001 | 67.23 ± 12.17 | 81.43 ± 11.65 |
| FLAIR_Original First Order Skewness | <0.001 | −0.01 ± 0.57 | −0.67 ± 0.63 |
| FLAIR_Original First Order Range | <0.001 | 1265.91 ± 713.65 | 735.05 ± 618.31 |
| FLAIR_Original Gray Level Co-occurrence Matrix Cluster Shade | <0.001 | −219.28 ± 2123.23 | −3017.05 ± 5179.56 |
| FLAIR_Original Neighboring Gray Tone Difference Matrix Busyness | <0.001 | 4.1 ± 3.09 | 1.62 ± 1.13 |
| FLAIR_Original First Order Standard Deviation | 0.001 | 158.12 ± 82.19 | 100.57 ± 84.5 |
| FLAIR_Original First Order Variance | 0.001 | 31,674.63 ± 34,622.28 | 16,879.46 ± 34,301.7 |
| FLAIR_Original First Order Mean Absolute Deviation | 0.001 | 126.23 ± 67.02 | 78.74 ± 63.44 |
| DWI_Original Gray Level Size Zone Matrix Small Area High Gray Level Emphasis | 0.001 | 544.01 ± 249.55 | 786.15 ± 274.83 |
| FLAIR_Original First Order Interquartile Range | 0.001 | 216.27 ± 124.42 | 128.84 ± 97.67 |
| FLAIR_Original First Order Robust Mean Absolute Deviation | 0.001 | 89.61 ± 50 | 54.64 ± 41.84 |
| FLAIR_Original Gray Level Run Length Matrix Long Run Low Gray Level Emphasis | 0.001 | 0.0031 ± 0.0049 | 0.0022 ± 0.0031 |
| DWI_Original Gray Level Run Length Matrix Short Run High Gray Level Emphasis | 0.001 | 764 ± 428.7 | 1197.72 ± 498.08 |
| DWI_Original Gray Level Dependence Matrix High Gray Level Emphasis | 0.001 | 819.66 ± 457.07 | 1285.02 ± 542.64 |
| DWI_Original Neighboring Gray Tone Difference Matrix Busyness | 0.001 | 1.24 ± 1.01 | 0.55 ± 0.42 |
| DWI_Original Gray Level Run Length Matrix High Gray Level Run Emphasis | 0.001 | 826.14 ± 452.35 | 1287.92 ± 536.33 |
| FLAIR_Original Neighboring Gray Tone Difference Matrix Strength | 0.001 | 0.5 ± 1.05 | 0.64 ± 0.48 |
| DWI_Original Gray Level Dependence Matrix Small Dependence High Gray Level Emphasis | 0.001 | 210.01 ± 158.21 | 344.64 ± 170.11 |
| DWI_Original First Order Skewness | 0.002 | 0.46 ± 1.04 | −0.46 ± 0.88 |
| DWI_Original Gray Level Run Length Matrix Long Run High Gray Level Emphasis | 0.002 | 1206.58 ± 570.58 | 1811.05 ± 762.28 |
| FLAIR_Original First Order Maximum | 0.002 | 1510.64 ± 821.7 | 976.74 ± 703.15 |
| DWI_Original Gray Level Co-occurrence Matrix Autocorrelation | 0.002 | 814.72 ± 465.16 | 1271.48 ± 562.39 |
| FLAIR_Original First Order Total Energy | 0.002 | 78,837,906,831.01 ± 92,307,518,260.86 | 56,208,389,465.53 ± 124,951,899,957.93 |
| FLAIR_Original First Order Energy | 0.002 | 121,143,113,125.22 ± 174,604,200,352.47 | 93,788,946,398.58 ± 241,864,772,843.25 |
| DWI_Original Gray Level Co-occurrence Matrix Joint Average | 0.002 | 26.49 ± 8.51 | 34.04 ± 8.2 |
| DWI_Original Gray Level Co-occurrence Matrix Sum Average | 0.002 | 52.99 ± 17.02 | 68.07 ± 16.4 |
| FLAIR_Original Neighboring Gray Tone Difference Matrix Coarseness | 0.003 | 0.0002 ± 0.0004 | 0.0004 ± 0.0003 |
| DWI_Original Gray Level Run Length Matrix Gray Level Non Uniformity | 0.003 | 1119.88 ± 914.66 | 486.56 ± 346.9 |
| DWI_Original Neighboring Gray Tone Difference Matrix Coarseness | 0.003 | 0.001 ± 0.0015 | 0.0015 ± 0.0017 |
| FLAIR_Original Gray Level Dependence Matrix Large Dependence Low Gray Level Emphasis | 0.003 | 0.04 ± 0.04 | 0.02 ± 0.02 |
| DWI_Original Gray Level Dependence Matrix Gray Level Non Uniformity | 0.003 | 1415.7 ± 1279.42 | 569.48 ± 421.22 |
| DWI_Original Neighboring Gray Tone Difference Matrix Contrast | 0.004 | 0.1 ± 0.1 | 0.16 ± 0.11 |
| FLAIR_Original Gray Level Run Length Matrix Long Run High Gray Level Emphasis | 0.006 | 1989.38 ± 660.24 | 2753.4 ± 1121.6 |
| DWI_Original Gray Level Size Zone Matrix Large Area Low Gray Level Emphasis | 0.006 | 48.74 ± 148.12 | 1.35 ± 3.01 |
| FLAIR_Original Gray Level Run Length Matrix Run Length Non Uniformity | 0.006 | 78,567.04 ± 57,195.07 | 41,756.66 ± 37,247.69 |
| FLAIR_Original Gray Level Size Zone Matrix Gray Level Non Uniformity | 0.006 | 719.94 ± 511.92 | 400.45 ± 299.7 |
| DWI_Original Gray Level Run Length Matrix Gray Level Variance | 0.007 | 64.37 ± 36.15 | 84.64 ± 28.49 |
| FLAIR_Original Gray Level Dependence Matrix Low Gray Level Emphasis | 0.007 | 0.002 ± 0.0037 | 0.0016 ± 0.0026 |
| DWI_Original Gray Level Dependence Matrix Gray Level Variance | 0.007 | 62.45 ± 36.62 | 82.85 ± 29.07 |
| FLAIR_Original Gray Level Run Length Matrix Low Gray Level Run Emphasis | 0.007 | 0.002 ± 0.0039 | 0.0016 ± 0.0026 |
| FLAIR_Original Gray Level Dependence Matrix Dependence Non Uniformity | 0.007 | 13,941.11 ± 9449.91 | 7721.06 ± 5691.44 |
| DWI_Original First Order Uniformity | 0.009 | 0.05 ± 0.02 | 0.04 ± 0.01 |
| DWI_Original Gray Level Co-occurrence Matrix Contrast | 0.009 | 41.76 ± 29.66 | 56.34 ± 27.96 |
| DWI_Original Gray Level Size Zone Matrix Small Area Emphasis | 0.009 | 0.59 ± 0.05 | 0.62 ± 0.05 |
| FLAIR_Original Gray Level Size Zone Matrix Low Gray Level Zone Emphasis | 0.009 | 0.0025 ± 0.0059 | 0.0019 ± 0.0025 |
| DWI_Original Gray Level Run Length Matrix Gray Level Non Uniformity Normalized | 0.009 | 0.05 ± 0.02 | 0.04 ± 0.01 |
| DWI_Original Gray Level Size Zone Matrix Gray Level Non Uniformity Normalized | 0.010 | 0.03 ± 0.01 | 0.03 ± 0.004 |
| DWI_Original Gray Level Size Zone Matrix Size Zone Non Uniformity Normalized | 0.010 | 0.33 ± 0.05 | 0.36 ± 0.05 |
| FLAIR_Original Gray Level Run Length Matrix Short Run Low Gray Level Emphasis | 0.011 | 0.0019 ± 0.0038 | 0.0015 ± 0.0025 |
| FLAIR_Original Gray Level Run Length Matrix Gray Level Non Uniformity | 0.011 | 3783.52 ± 3124.39 | 2072.1 ± 2363.18 |
| DWI_Original Gray Level Co-occurrence Matrix Difference Variance | 0.012 | 20.13 ± 12.63 | 26.75 ± 11.87 |
| DWI_Original Gray Level Co-occurrence Matrix Inverse Difference Moment Normalized | 0.012 | 0.99 ± 0.01 | 0.99 ± 0.01 |
| FLAIR_Original Gray Level Run Length Matrix Run Variance | 0.012 | 0.29 ± 0.15 | 0.22 ± 0.14 |
| FLAIR_Original Gray Level Size Zone Matrix Size Zone Non Uniformity | 0.012 | 6324.41 ± 4176.75 | 4061.53 ± 2756.39 |
| DWI_Original Gray Level Size Zone Matrix Gray Level Variance | 0.013 | 91.84 ± 27.92 | 111.61 ± 32.95 |
| DWI_Original Gray Level Run Length Matrix Run Length Non Uniformity | 0.013 | 16,416.98 ± 10,512.48 | 10,095.05 ± 6915.17 |
| FLAIR_Original Gray Level Dependence Matrix Gray Level Non Uniformity | 0.014 | 4533.69 ± 3896.27 | 2487.02 ± 3005.24 |
| DWI_Original Gray Level Size Zone Matrix Large Area Emphasis | 0.015 | 5713.84 ± 17,261.49 | 559.63 ± 1038.73 |
| DWI_Original Gray Level Size Zone Matrix Zone Variance | 0.015 | 5669.15 ± 17,179.37 | 543.05 ± 1027.67 |
| DWI_Original Gray Level Co-occurrence Matrix Cluster Shade | 0.017 | 657.55 ± 2804.84 | −1369.51 ± 3597.59 |
| DWI_Original First Order Maximum | 0.018 | 1161.89 ± 588.37 | 833.97 ± 489.5 |
| DWI_Original First Order Entropy | 0.019 | 4.7 ± 0.48 | 5 ± 0.27 |
| FLAIR_Original Gray Level Run Length Matrix Long Run Emphasis | 0.020 | 1.67 ± 0.3 | 1.52 ± 0.3 |
| DWI_Original Gray Level Dependence Matrix Dependence Non Uniformity | 0.022 | 2986.94 ± 1884.99 | 1937.84 ± 1175.1 |
| DWI_Original Gray Level Dependence Matrix Small Dependence Emphasis | 0.022 | 0.21 ± 0.09 | 0.26 ± 0.09 |
| DWI_Original Gray Level Size Zone Matrix Gray Level Non Uniformity | 0.024 | 158.2 ± 101.68 | 101.38 ± 57.73 |
| DWI_Original Gray Level Co-occurrence Matrix Cluster Prominence | 0.027 | 203,134.01 ± 165,799.16 | 285,344.44 ± 193,348.11 |
| DWI_Original Gray Level Co-occurrence Matrix Maximum Probability | 0.028 | 0.02 ± 0.02 | 0.01 ± 0.01 |
| DWI_Original First Order Range | 0.029 | 1089.95 ± 588.32 | 772.8 ± 487.35 |
| DWI_Original Gray Level Co-occurrence Matrix Joint Energy | 0.030 | 0.01 ± 0.01 | 0.0038 ± 0.0017 |
| DWI_Original Gray Level Run Length Matrix Run Variance | 0.030 | 0.28 ± 0.22 | 0.18 ± 0.1 |
| DWI_Original Gray Level Co-occurrence Matrix Difference Average | 0.031 | 4.08 ± 1.49 | 4.86 ± 1.48 |
| DWI_Original Gray Level Size Zone Matrix Zone Percentage | 0.031 | 0.24 ± 0.11 | 0.3 ± 0.11 |
| FLAIR_Original Gray Level Size Zone Matrix Small Area Low Gray Level Emphasis | 0.031 | 0.0016 ± 0.0041 | 0.0012 ± 0.0017 |
| DWI_Original Gray Level Run Length Matrix Long Run Emphasis | 0.032 | 1.68 ± 0.47 | 1.45 ± 0.21 |
| FLAIR_Original Gray Level Size Zone Matrix Zone Entropy | 0.032 | 7.64 ± 0.27 | 7.5 ± 0.28 |
| DWI_Original Gray Level Co-occurrence Matrix Sum of Squares | 0.033 | 62.05 ± 36.14 | 77.43 ± 30.25 |
| FLAIR_Original First Order 90th Percentile | 0.034 | 1067.34 ± 552.14 | 837.61 ± 620.08 |
| DWI_Original Gray Level Run Length Matrix Short Run Emphasis | 0.035 | 0.91 ± 0.04 | 0.93 ± 0.02 |
| DWI_Original Gray Level Co-occurrence Matrix Inverse Difference Normalized | 0.036 | 0.95 ± 0.02 | 0.94 ± 0.02 |
| DWI_Original Gray Level Run Length Matrix Run Percentage | 0.036 | 0.87 ± 0.05 | 0.9 ± 0.03 |
| DWI_Original Gray Level Run Length Matrix Run Entropy | 0.036 | 5.34 ± 0.31 | 5.51 ± 0.19 |
| DWI_Original First Order Energy | 0.038 | 52,082,170,32.98 ± 39,247,896,40.04 | 34,436,543,32.49 ± 34,586,473,38.81 |
| DWI_Original Gray Level Dependence Matrix Large Dependence Emphasis | 0.038 | 28.71 ± 19.21 | 19.22 ± 9.25 |
| DWI_Original Gray Level Dependence Matrix Large Dependence Low Gray Level Emphasis | 0.038 | 0.36 ± 0.98 | 0.07 ± 0.1 |
| DWI_Original Gray Level Run Length Matrix Run Length Non Uniformity Normalized | 0.039 | 0.79 ± 0.07 | 0.83 ± 0.05 |
| DWI_Original Gray Level Dependence Matrix Large Dependence High Gray Level Emphasis | 0.041 | 15,954.41 ± 7160.01 | 21,904.17 ± 12,525.77 |
| DWI_Original Neighboring Gray Tone Difference Matrix Complexity | 0.042 | 4919.68 ± 1476.01 | 5651.97 ± 1458.46 |
| DWI_Original Gray Level Dependence Matrix Dependence Non Uniformity Normalized | 0.043 | 0.14 ± 0.04 | 0.16 ± 0.05 |
| DWI_Original Gray Level Co-occurrence Matrix Sum Entropy | 0.046 | 5.55 ± 0.48 | 5.8 ± 0.3 |
| DWI_Original Gray Level Co-occurrence Matrix Difference Entropy | 0.049 | 3.36 ± 0.45 | 3.58 ± 0.35 |
| Radiomic Features (n = 88) |
|---|
| DWI_Original First Order Total Energy |
| DWI_Original First Order Mean Absolute Deviation |
| FLAIR_Original First Order 90th Percentile |
| FLAIR_Original Gray Level Dependence Matrix Small Dependence High Gray Level Emphasis |
| FLAIR_Original Gray Level Run Length Matrix High Gray Level Run Emphasis |
| FLAIR_Original Gray Level Size Zone Matrix Gray Level Non Uniformity |
| DWI_Original First Order Maximum |
| DWI_Original Gray Level Run Length Matrix Run Entropy |
| DWI_Original First Order Skewness |
| DWI_Original First Order 10th Percentile |
| DWI_Original First Order 90th Percentile |
| FLAIR_Original First Order Total Energy |
| DWI_Original Gray Level Size Zone Matrix Large Area Emphasis |
| DWI_Original Gray Level Size Zone Matrix Zone Variance |
| DWI_Original Gray Level Co-occurrence Matrix Informal Measure of Correlation 2 |
| FLAIR_Original Gray Level Co-occurrence Matrix Joint Entropy |
| DWI_Original Gray Level Co-occurrence Matrix Correlation |
| DWI_Original Gray Level Co-occurrence Matrix Contrast |
| FLAIR_Original Gray Level Run Length Matrix Long Run Low Gray Level Emphasis |
| DWI_Original Gray Level Co-occurrence Matrix Cluster Shade |
| FLAIR_Original Gray Level Co-occurrence Matrix Cluster Shade |
| DWI_Original Gray Level Co-occurrence Matrix Joint Entropy |
| DWI_Original Gray Level Size Zone Matrix Small Area High Gray Level Emphasis |
| DWI_Original Neighboring Gray Tone Difference Matrix Complexity |
| FLAIR_Original Gray Level Co-occurrence Matrix Joint Average |
| DWI_Original Gray Level Dependence Matrix Small Dependence Emphasis |
| FLAIR_Original Gray Level Co-occurrence Matrix Informal Measure of Correlation 1 |
| DWI_Original Gray Level Size Zone Matrix Zone Entropy |
| FLAIR_Original First Order Energy |
| DWI_Original First Order Kurtosis |
| FLAIR_Original Gray Level Co-occurrence Matrix Sum Average |
| DWI_Original Gray Level Dependence Matrix Small Dependence High Gray Level Emphasis |
| FLAIR_Original First Order 10th Percentile |
| DWI_Original First Order Variance |
| FLAIR_Original Gray Level Size Zone Matrix Size Zone Non Uniformity |
| FLAIR_Original Gray Level Size Zone Matrix Gray Level Variance |
| FLAIR_Original First Order Skewness |
| FLAIR_Original Gray Level Dependence Matrix Dependence Non Uniformity |
| FLAIR_Original Gray Level Size Zone Matrix Small Area High Gray Level Emphasis |
| FLAIR_Original Gray Level Co-occurrence Matrix Informal Measure of Correlation 2 |
| FLAIR_Original First Order Standard Deviation |
| FLAIR_Original Gray Level Size Zone Matrix Large Area Low Gray Level Emphasis |
| FLAIR_Original Gray Level Co-occurrence Matrix Sum of Squares |
| DWI_Original First Order Energy |
| FLAIR_Original Gray Level Co-occurrence Matrix Maximum Probability |
| FLAIR_Original Gray Level Co-occurrence Matrix Correlation |
| DWI_Original Gray Level Dependence Matrix Gray Level Non Uniformity |
| FLAIR_Original First Order Range |
| FLAIR_Original Gray Level Co-occurrence Matrix Cluster Tendency |
| FLAIR_Original Gray Level Dependence Matrix Large Dependence Low Gray Level Emphasis |
| DWI_Original First Order Entropy |
| DWI_Original First Order Uniformity |
| FLAIR_Original First Order Interquartile Range |
| DWI_Original Gray Level Dependence Matrix Dependence Entropy |
| FLAIR_Original Gray Level Dependence Matrix Large Dependence High Gray Level Emphasis |
| DWI_Original Gray Level Dependence Matrix Gray Level Variance |
| FLAIR_Original Gray Level Dependence Matrix Dependence Entropy |
| DWI_Original Gray Level Run Length Matrix Gray Level Variance |
| DWI_Original First Order Robust Mean Absolute Deviation |
| DWI_Original First Order Median |
| FLAIR_Original Gray Level Co-occurrence Matrix Difference Variance |
| FLAIR_Original Gray Level Run Length Matrix Gray Level Variance |
| FLAIR_Original First Order Minimum |
| FLAIR_Original Gray Level Run Length Matrix Long Run High Gray Level Emphasis |
| DWI_Original First Order Standard Deviation |
| DWI_Original Gray Level Size Zone Matrix Gray Level Non Uniformity Normalized |
| DWI_Original Gray Level Run Length Matrix Low Gray Level Run Emphasis |
| FLAIR_Original Gray Level Dependence Matrix Dependence Variance |
| DWI_Original Neighboring Gray Tone Difference Matrix Contrast |
| DWI_Original Gray Level Co-occurrence Matrix Inverse Difference |
| DWI_Original Gray Level Dependence Matrix Large Dependence Low Gray Level Emphasis |
| FLAIR_Original Gray Level Size Zone Matrix Gray Level Non Uniformity Normalized |
| DWI_Original Gray Level Run Length Matrix Run Variance |
| DWI_Original Gray Level Dependence Matrix Low Gray Level Emphasis |
| FLAIR_Original Gray Level Size Zone Matrix Zone Percentage |
| FLAIR_Original Gray Level Size Zone Matrix Small Area Low Gray Level Emphasis |
| DWI_Original Gray Level Co-occurrence Matrix Inverse Variance |
| DWI_Original First Order Minimum |
| DWI_Original Gray Level Co-occurrence Matrix Maximum Probability |
| DWI_Original Gray Level Size Zone Matrix Large Area Low Gray Level Emphasis |
| DWI_Original Gray Level Co-occurrence Matrix Joint Energy |
| FLAIR_Original Neighboring Gray Tone Difference Matrix Complexity |
| FLAIR_Original Gray Level Co-occurrence Matrix Contrast |
| FLAIR_Original Gray Level Run Length Matrix Run Entropy |
| FLAIR_Original Gray Level Co-occurrence Matrix Joint Energy |
| DWI_Original Gray Level Run Length Matrix Run Percentage |
| DWI_Original Gray Level Co-occurrence Matrix Joint Average |
| FLAIR_Original First Order Mean Absolute Deviation |
| Radiomic Features (n = 71) |
|---|
| Original Gray Level Co-occurrence Matrix Autocorrelation |
| Original Gray Level Run Length Matrix Run Entropy |
| Original Gray Level Dependence Matrix Dependence Non Uniformity Normalized |
| Original Gray Level Dependence Matrix Gray Level Variance |
| Original Gray Level Co-occurrence Matrix Maximum Probability |
| Original Gray Level Run Length Matrix Long Run High Gray Level Emphasis |
| Original Gray Level Run Length Matrix Gray Level Non Uniformity |
| Original Gray Level Size Zone Matrix Small Area High Gray Level Emphasis |
| Original First Order Total Energy |
| Original Gray Level Co-occurrence Matrix Informal Measure of Correlation 2 |
| Original Gray Level Size Zone Matrix Large Area High Gray Level Emphasis |
| Original Gray Level Size Zone Matrix Size Zone Non Uniformity |
| Original First Order 10th Percentile |
| Original First Order Root Mean Squared |
| Original Gray Level Co-occurrence Matrix Cluster Shade |
| Original First Order Kurtosis |
| Original Gray Level Size Zone Matrix Low Gray Level Zone Emphasis |
| Original Gray Level Run Length Matrix Run Length Non Uniformity |
| Original Neighboring Gray Tone Difference Matrix Coarseness |
| Original First Order Mean Absolute Deviation |
| Original First Order Skewness |
| Original Gray Level Run Length Matrix Short Run Low Gray Level Emphasis |
| Original Gray Level Co-occurrence Matrix Sum Average |
| Original First Order Robust Mean Absolute Deviation |
| Original Gray Level Dependence Matrix Dependence Non Uniformity |
| Original First Order Range |
| Original Neighboring Gray Tone Difference Matrix Busyness |
| Original First Order Maximum |
| Original Gray Level Co-occurrence Matrix Sum of Squares |
| Original Gray Level Co-occurrence Matrix Inverse Difference Normalized |
| Original First Order Standard Deviation |
| Original Gray Level Dependence Matrix Gray Level Non Uniformity |
| Original Neighboring Gray Tone Difference Matrix Strength |
| Original Gray Level Size Zone Matrix Size Zone Non Uniformity Normalized |
| Original Gray Level Dependence Matrix Dependence Entropy |
| Original Gray Level Size Zone Matrix Zone Entropy |
| Original Gray Level Dependence Matrix Low Gray Level Emphasis |
| Original Gray Level Co-occurrence Matrix Sum Entropy |
| Original Gray Level Size Zone Matrix Gray Level Non Uniformity Normalized |
| Original Gray Level Co-occurrence Matrix Difference Entropy |
| Original Gray Level Co-occurrence Matrix Informal Measure of Correlation 1 |
| Original Gray Level Run Length Matrix Long Run Emphasis |
| Original Gray Level Run Length Matrix Long Run Low Gray Level Emphasis |
| Original First Order Minimum |
| Original Gray Level Run Length Matrix Low Gray Level Run Emphasis |
| Original Gray Level Size Zone Matrix Zone Percentage |
| Original Gray Level Co-occurrence Matrix Cluster Prominence |
| Original First Order Energy |
| Original Neighboring Gray Tone Difference Matrix Complexity |
| Original Gray Level Co-occurrence Matrix Correlation |
| Original Gray Level Co-occurrence Matrix Joint Energy |
| Original Gray Level Size Zone Matrix Gray Level Non Uniformity |
| Original Gray Level Size Zone Matrix Zone Variance |
| Original Gray Level Size Zone Matrix Small Area Emphasis |
| Original Gray Level Run Length Matrix High Gray Level Run Emphasis |
| Original Gray Level Run Length Matrix Gray Level Non Uniformity Normalized |
| Original Gray Level Co-occurrence Matrix Difference Average |
| Original First Order Median |
| Original First Order Uniformity |
| Original Gray Level Co-occurrence Matrix Joint Entropy |
| Original Gray Level Co-occurrence Matrix Joint Average |
| Original First Order Mean |
| Original First Order Interquartile Range |
| Original Gray Level Size Zone Matrix Large Area Low Gray Level Emphasis |
| Original Gray Level Size Zone Matrix Gray Level Variance |
| Original Neighboring Gray Tone Difference Matrix Contrast |
| Original Gray Level Run Length Matrix Short Run High Gray Level Emphasis |
| Original Gray Level Run Length Matrix Gray Level Variance |
| Original Gray Level Run Length Matrix Run Percentage |
| Original Gray Level Dependence Matrix Large Dependence High Gray Level Emphasis |
| Original Gray Level Co-occurrence Matrix Contrast |
| Radiomic Features (n = 33) |
|---|
| Original Gray Level Run Length Matrix Short Run High Gray Level Emphasis |
| Original First Order Mean Absolute Deviation |
| Original Gray Level Co-occurrence Matrix Correlation |
| Original Gray Level Size Zone Matrix Gray Level Variance |
| Original Gray Level Size Zone Matrix Low Gray Level Zone Emphasis |
| Original Gray Level Co-occurrence Matrix Informal Measure of Correlation 2 |
| Original Gray Level Co-occurrence Matrix Cluster Prominence |
| Original Gray Level Dependence Matrix Small Dependence High Gray Level Emphasis |
| Original Neighboring Gray Tone Difference Matrix Coarseness |
| Original First Order Range |
| Original Gray Level Size Zone Matrix Size Zone Non Uniformity |
| Original First Order Kurtosis |
| Original First Order Skewness |
| Original Gray Level Run Length Matrix Long Run High Gray Level Emphasis |
| Original First Order Interquartile Range |
| Original Gray Level Size Zone Matrix Gray Level Non Uniformity |
| Original Gray Level Run Length Matrix Gray Level Non Uniformity Normalized |
| Original Gray Level Co-occurrence Matrix Inverse Difference Moment Normalized |
| Original Gray Level Dependence Matrix Small Dependence Low Gray Level Emphasis |
| Original Gray Level Co-occurrence Matrix Cluster Shade |
| Original Gray Level Dependence Matrix Large Dependence Low Gray Level Emphasis |
| Original First Order Energy |
| Original Gray Level Co-occurrence Matrix Difference Entropy |
| Original Gray Level Run Length Matrix Run Entropy |
| Original Gray Level Run Length Matrix Low Gray Level Run Emphasis |
| Original Gray Level Size Zone Matrix Small Area High Gray Level Emphasis |
| Original Gray Level Run Length Matrix Run Percentage |
| Original Gray Level Co-occurrence Matrix Joint Average |
| Original Gray Level Run Length Matrix Long Run Emphasis |
| Original Gray Level Run Length Matrix Short Run Emphasis |
| Original First Order Robust Mean Absolute Deviation |
| Original Gray Level Run Length Matrix High Gray Level Run Emphasis |
| Original First Order Total Energy |
| Feature Class | Radiomic Features |
|---|---|
| First Order Statistics | Original First Order Energy |
| Original First Order Total Energy | |
| Original First Order Entropy | |
| Original First Order Minimum | |
| Original First Order 10th Percentile | |
| Original First Order 90th Percentile | |
| Original First Order Maximum | |
| Original First Order Mean | |
| Original First Order Median | |
| Original First Order Interquartile Range | |
| Original First Order Range | |
| Original First Order Mean Absolute Deviation | |
| Original First Order Robust Mean Absolute Deviation | |
| Original First Order Root Mean Squared | |
| Original First Order Standard Deviation | |
| Original First Order Skewness | |
| Original First Order Kurtosis | |
| Original First Order Variance | |
| Original First Order Uniformity | |
| Gray Level Co-occurrence Matrix | Original Gray Level Co-occurrence Matrix Autocorrelation |
| Original Gray Level Co-occurrence Matrix Joint Average | |
| Original Gray Level Co-occurrence Matrix Cluster Prominence | |
| Original Gray Level Co-occurrence Matrix Cluster Shade | |
| Original Gray Level Co-occurrence Matrix Cluster Tendency | |
| Original Gray Level Co-occurrence Matrix Contrast | |
| Original Gray Level Co-occurrence Matrix Correlation | |
| Original Gray Level Co-occurrence Matrix Difference Average | |
| Original Gray Level Co-occurrence Matrix Difference Entropy | |
| Original Gray Level Co-occurrence Matrix Difference Variance | |
| Original Gray Level Co-occurrence Matrix Joint Energy | |
| Original Gray Level Co-occurrence Matrix Joint Entropy | |
| Original Gray Level Co-occurrence Matrix Informal Measure of Correlation 1 | |
| Original Gray Level Co-occurrence Matrix Informal Measure of Correlation 2 | |
| Original Gray Level Co-occurrence Matrix Inverse Difference Moment | |
| Original Gray Level Co-occurrence Matrix Inverse Difference Moment Normalized | |
| Original Gray Level Co-occurrence Matrix Inverse Difference | |
| Original Gray Level Co-occurrence Matrix Inverse Difference Normalized | |
| Original Gray Level Co-occurrence Matrix Inverse Variance | |
| Original Gray Level Co-occurrence Matrix Maximum Probability | |
| Original Gray Level Co-occurrence Matrix Sum Average | |
| Original Gray Level Co-occurrence Matrix Sum Entropy | |
| Original Gray Level Co-occurrence Matrix Sum of Squares | |
| Gray Level Run Length Matrix | Original Gray Level Run Length Matrix Short Run Emphasis |
| Original Gray Level Run Length Matrix Long Run Emphasis | |
| Original Gray Level Run Length Matrix Gray Level Non Uniformity | |
| Original Gray Level Run Length Matrix Gray Level Non Uniformity Normalized | |
| Original Gray Level Run Length Matrix Run Length Non Uniformity | |
| Original Gray Level Run Length Matrix Run Length Non Uniformity Normalized | |
| Original Gray Level Run Length Matrix Run Percentage | |
| Original Gray Level Run Length Matrix Gray Level Variance | |
| Original Gray Level Run Length Matrix Run Variance | |
| Original Gray Level Run Length Matrix Run Entropy | |
| Original Gray Level Run Length Matrix Low Gray Level Run Emphasis | |
| Original Gray Level Run Length Matrix High Gray Level Run Emphasis | |
| Original Gray Level Run Length Matrix Short Run Low Gray Level Emphasis | |
| Original Gray Level Run Length Matrix Short Run High Gray Level Emphasis | |
| Original Gray Level Run Length Matrix Long Run Low Gray Level Emphasis | |
| Original Gray Level Run Length Matrix Long Run High Gray Level Emphasis | |
| Gray Level Size Zone Matrix | Original Gray Level Size Zone Matrix Small Area Emphasis |
| Original Gray Level Size Zone Matrix Large Area Emphasis | |
| Original Gray Level Size Zone Matrix Gray Level Non Uniformity | |
| Original Gray Level Size Zone Matrix Gray Level Non Uniformity Normalized | |
| Original Gray Level Size Zone Matrix Size Zone Non Uniformity | |
| Original Gray Level Size Zone Matrix Size Zone Non Uniformity Normalized | |
| Original Gray Level Size Zone Matrix Zone Percentage | |
| Original Gray Level Size Zone Matrix Gray Level Variance | |
| Original Gray Level Size Zone Matrix Zone Variance | |
| Original Gray Level Size Zone Matrix Zone Entropy | |
| Original Gray Level Size Zone Matrix Low Gray Level Zone Emphasis | |
| Original Gray Level Size Zone Matrix Small Area Low Gray Level Emphasis | |
| Original Gray Level Size Zone Matrix Small Area High Gray Level Emphasis | |
| Original Gray Level Size Zone Matrix Large Area Low Gray Level Emphasis | |
| Original Gray Level Size Zone Matrix Large Area High Gray Level Emphasis | |
| Neighboring Gray Tone Difference Matrix | Original Neighboring Gray Tone Difference Matrix Coarseness |
| Original Neighboring Gray Tone Difference Matrix Contrast | |
| Original Neighboring Gray Tone Difference Matrix Busyness | |
| Original Neighboring Gray Tone Difference Matrix Complexity | |
| Original Neighboring Gray Tone Difference Matrix Strength | |
| Gray Level Dependence Matrix | Original Gray Level Dependence Matrix Small Dependence Emphasis |
| Original Gray Level Dependence Matrix Large Dependence Emphasis | |
| Original Gray Level Dependence Matrix Gray Level Non Uniformity | |
| Original Gray Level Dependence Matrix Dependence Non Uniformity | |
| Original Gray Level Dependence Matrix Dependence Non Uniformity Normalized | |
| Original Gray Level Dependence Matrix Gray Level Variance | |
| Original Gray Level Dependence Matrix Dependence Variance | |
| Original Gray Level Dependence Matrix Dependence Entropy | |
| Original Gray Level Dependence Matrix Low Gray Level Emphasis | |
| Original Gray Level Dependence Matrix High Gray Level Emphasis | |
| Original Gray Level Dependence Matrix Small Dependence Low Gray Level Emphasis | |
| Original Gray Level Dependence Matrix Small Dependence High Gray Level Emphasis | |
| Original Gray Level Dependence Matrix Large Dependence Low Gray Level Emphasis | |
| Original Gray Level Dependence Matrix Large Dependence High Gray Level Emphasis |


References
- Weller, M.; Wick, W.; Aldape, K.; Brada, M.; Berger, M.; Pfister, S.M.; Nishikawa, R.; Rosenthal, M.; Wen, P.Y.; Stupp, R.; et al. Glioma. Nat. Rev. Dis. Primers 2015, 1, 15017. [Google Scholar] [CrossRef] [PubMed]
- Bralten, L.B.C.; Kloosterhof, N.K.; Balvers, R.; Sacchetti, A.; Lapre, L.; Lamfers, M.; Leenstra, S.; De Jonge, H.; Kros, J.M.; Jansen, E.E.W.; et al. IDH1 R132H decreases proliferation of glioma cell lines in vitro and in vivo. Ann. Neurol. 2011, 69, 455–463. [Google Scholar] [CrossRef]
- Wang, H.-Y.; Tang, K.; Liang, T.-Y.; Zhang, W.-Z.; Li, J.-Y.; Wang, W.; Hu, H.-M.; Li, M.-Y.; Wang, H.-Q.; He, X.-Z.; et al. The comparison of clinical and biological characteristics between IDH1 and IDH2 mutations in gliomas. J. Exp. Clin. Cancer Res. 2016, 35, 1–9. [Google Scholar] [CrossRef]
- Hartmann, C.; Meyer, J.; Balss, J.; Capper, D.; Mueller, W.; Christians, A.; Felsberg, J.; Wolter, M.; Mawrin, C.; Wick, W.; et al. Type and frequency of IDH1 and IDH2 mutations are related to astrocytic and oligodendroglial differentiation and age: A study of 1,010 diffuse gliomas. Acta Neuropathol. 2009, 118, 469–474. [Google Scholar] [CrossRef]
- Bent, M.J.V.D.; Dubbink, H.J.; Marie, Y.; Brandes, A.A.; Taphoorn, M.J.; Wesseling, P.; Frenay, M.; Tijssen, C.C.; Lacombe, D.; Idbaih, A.; et al. IDH1 and IDH2 Mutations Are Prognostic but not Predictive for Outcome in Anaplastic Oligodendroglial Tumors: A Report of the European Organization for Research and Treatment of Cancer Brain Tumor Group. Clin. Cancer Res. 2010, 16, 1597–1604. [Google Scholar] [CrossRef]
- Louis, D.N.; Perry, A.; Reifenberger, G.; Von Deimling, A.; Figarella-Branger, D.; Cavenee, W.K.; Ohgaki, H.; Wiestler, O.D.; Kleihues, P.; Ellison, D.W. The 2016 World Health Organization Classification of Tumors of the Central Nervous System: A summary. Acta Neuropathol. 2016, 131, 803–820. [Google Scholar] [CrossRef]
- Chaddad, A.; Kucharczyk, M.J.; Daniel, P.; Sabri, S.; Jean-Claude, B.J.; Niazi, T.; Abdulkarim, B. Radiomics in Glioblastoma: Current Status and Challenges Facing Clinical Implementation. Front. Oncol. 2019, 9, 374. [Google Scholar] [CrossRef] [PubMed]
- Zhou, M.; Scott, J.; Chaudhury, B.; Hall, L.; Goldgof, D.; Yeom, K.; Iv, M.; Ou, Y.; Kalpathy-Cramer, J.; Napel, S.; et al. Radiomics in Brain Tumor: Image Assessment, Quantitative Feature Descriptors, and Machine-Learning Approaches. Am. J. Neuroradiol. 2017, 39, 208–216. [Google Scholar] [CrossRef] [PubMed]
- Kinoshita, M.; Sakai, M.; Arita, H.; Shofuda, T.; Chiba, Y.; Kagawa, N.; Watanabe, Y.; Hashimoto, N.; Fujimoto, Y.; Yoshimine, T.; et al. Introduction of High Throughput Magnetic Resonance T2-Weighted Image Texture Analysis for WHO Grade 2 and 3 Gliomas. PLoS ONE 2016, 11, e0164268. [Google Scholar] [CrossRef] [PubMed]
- Li, Z.C.; Bai, H.; Sun, Q.; Zhao, Y.; Lv, Y.; Zhou, J.; Liang, C.; Chen, Y.; Liang, D.; Zheng, H. Multiregional radiomics profiling from multiparametric MRI: Identifying an imaging predictor of IDH1 mutation status in glioblastoma. Cancer Med. 2018, 7, 5999–6009. [Google Scholar] [CrossRef]
- Lotan, E.; Jain, R.; Razavian, N.; Fatterpekar, G.M.; Lui, Y.W. State of the Art: Machine Learning Applications in Glioma Imaging. Am. J. Roentgenol. 2019, 212, 26–37. [Google Scholar] [CrossRef] [PubMed]
- Sotoudeh, H.; Shafaat, O.; Bernstock, J.D.; Brooks, M.D.; Elsayed, G.A.; Chen, J.A.; Szerip, P.; Chagoya, G.; Gessler, F.; Sotoudeh, E.; et al. Artificial Intelligence in the Management of Glioma: Era of Personalized Medicine. Front. Oncol. 2019, 9, 768. [Google Scholar] [CrossRef]
- Chen, T.; Guestrin, C. XGBoost: A Scalable Tree Boosting System. arXiv e-Prints [Internet]. 1 March 2016. Available online: https://ui.adsabs.harvard.edu/abs/2016arXiv160302754C (accessed on 22 October 2020).
- Natekin, A.; Knoll, A. Gradient boosting machines, a tutorial. Front. Neurorobotics 2013, 7, 21. [Google Scholar] [CrossRef] [PubMed]
- Wick, W.; Roth, P.; Hartmann, C.; Hau, P.; Nakamura, M.; Stockhammer, F.; Sabel, M.C.; Wick, A.; Koeppen, S.; Ketter, R.; et al. Long-term analysis of the NOA-04 randomized phase III trial of sequential radiochemotherapy of anaplastic glioma with PCV or temozolomide. Neuro-Oncol. 2016, 18, 1529–1537. [Google Scholar] [CrossRef]
- Qi, S.; Yu, L.; Li, H.; Ou, Y.; Qiu, X.; Ding, Y.; Han, H.; Zhang, X. Isocitrate dehydrogenase mutation is associated with tumor location and magnetic resonance imaging characteristics in astrocytic neoplasms. Oncol. Lett. 2014, 7, 1895–1902. [Google Scholar] [CrossRef] [PubMed]
- Sonoda, Y.; Shibahara, I.; Kawaguchi, T.; Saito, R.; Kanamori, M.; Watanabe, M.; Suzuki, H.; Kumabe, T.; Tominaga, T. Association between molecular alterations and tumor location and MRI characteristics in anaplastic gliomas. Brain Tumor Pathol. 2014, 32, 99–104. [Google Scholar] [CrossRef] [PubMed]
- Yamashita, K.; Hiwatashi, A.; Togao, O.; Kikuchi, K.; Hatae, R.; Yoshimoto, K.; Mizoguchi, M.; Suzuki, S.; Yoshiura, T.; Honda, H. MR Imaging–Based Analysis of Glioblastoma Multiforme: Estimation ofIDH1Mutation Status. Am. J. Neuroradiol. 2015, 37, 58–65. [Google Scholar] [CrossRef]
- Patel, S.H.; Poisson, L.M.; Brat, D.J.; Zhou, Y.; Cooper, L.; Snuderl, M.; Thomas, C.; Franceschi, A.M.; Griffith, B.; Flanders, A.E.; et al. T2–FLAIR Mismatch, an Imaging Biomarker for IDH and 1p/19q Status in Lower-grade Gliomas: A TCGA/TCIA Project. Clin. Cancer Res. 2017, 23, 6078–6085. [Google Scholar] [CrossRef]
- Broen, M.P.; Smits, M.; Wijnenga, M.M.; Dubbink, H.J.; Anten, M.H.; Schijns, O.E.; Beckervordersandforth, J.; Postma, A.A.; van den Bent, M.J. The T2-FLAIR mismatch sign as an imaging marker for non-enhancing IDH-mutant, 1p/19q-intact lower-grade glioma: A validation study. Neuro-oncology 2018, 20, 1393–1399. [Google Scholar] [CrossRef]
- Bisdas, S.; Shen, H.; Thust, S.; Katsaros, V.; Stranjalis, G.; Boskos, C.; Brandner, S.; Zhang, J. Texture analysis- and support vector machine-assisted diffusional kurtosis imaging may allow in vivo gliomas grading and IDH-mutation status prediction: A preliminary study. Sci. Rep. 2018, 8, 6108. [Google Scholar] [CrossRef]
- Wu, S.; Meng, J.; Yu, Q.; Li, P.; Fu, S. Radiomics-based machine learning methods for isocitrate dehydrogenase genotype prediction of diffuse gliomas. J. Cancer Res. Clin. Oncol. 2019, 145, 543–550. [Google Scholar] [CrossRef] [PubMed]
- Shboul, Z.A.; Chen, J.; Iftekharuddin, K.M. Prediction of Molecular Mutations in Diffuse Low-Grade Gliomas using MR Imaging Features. Sci. Rep. 2020, 10, 3711. [Google Scholar] [CrossRef] [PubMed]
- Zhou, H.; Chang, K.; Bai, H.X.; Xiao, B.; Su, C.; Bi, W.L.; Zhang, P.J.; Senders, J.T.; Vallières, M.; Kavouridis, V.K.; et al. Machine learning reveals multimodal MRI patterns predictive of isocitrate dehydrogenase and 1p/19q status in diffuse low- and high-grade gliomas. J. Neuro-Oncol. 2019, 142, 299–307. [Google Scholar] [CrossRef]
- Macyszyn, L.; Akbari, H.; Pisapia, J.M.; Da, X.; Attiah, M.; Pigrish, V.; Bi, Y.; Pal, S.; Davuluri, R.V.; Roccograndi, L.; et al. Imaging patterns predict patient survival and molecular subtype in glioblastoma via machine learning techniques. Neuro-oncology 2015, 18, 417–425. [Google Scholar] [CrossRef]
- Lee, M.H.; Kim, J.; Kim, S.-T.; Shin, H.-M.; You, H.-J.; Choi, J.W.; Seol, H.J.; Nam, D.-H.; Lee, J.-I.; Kong, D.-S. Prediction of IDH1 Mutation Status in Glioblastoma Using Machine Learning Technique Based on Quantitative Radiomic Data. World Neurosurg. 2019, 125, e688–e696. [Google Scholar] [CrossRef] [PubMed]
- Alis, D.; Bagcilar, O.; Senli, Y.D.; Yergin, M.; Isler, C.; Kocer, N.; Islak, C.; Kizilkilic, O. Machine learning-based quantitative texture analysis of conventional MRI combined with ADC maps for assessment of IDH1 mutation in high-grade gliomas. Jpn. J. Radiol. 2019, 38, 135–143. [Google Scholar] [CrossRef]
- Zhang, B.; Chang, K.; Ramkissoon, S.; Tanguturi, S.; Bi, W.L.; Reardon, D.A.; Ligon, K.L.; Alexander, B.M.; Wen, P.Y.; Huang, R.Y. Multimodal MRI features predict isocitrate dehydrogenase genotype in high-grade gliomas. Neuro-oncology 2016, 19, 109–117. [Google Scholar] [CrossRef]
- Calabrese, E.; Villanueva-Meyer, J.E.; Cha, S. A fully automated artificial intelligence method for non-invasive, imaging-based identification of genetic alterations in glioblastomas. Sci. Rep. 2020, 10, 11852. [Google Scholar] [CrossRef]
- Zhang, X.; Tian, Q.; Wang, L.; Liu, Y.; Li, B.; Liang, Z.; Gao, P.; Zheng, K.; Zhao, B.; Lu, H. Radiomics Strategy for Molecular Subtype Stratification of Lower-Grade Glioma: Detecting IDH andTP53Mutations Based on Multimodal MRI. J. Magn. Reson. Imaging 2018, 48, 916–926. [Google Scholar] [CrossRef]
- Eichinger, P.; Alberts, E.; Delbridge, C.; Trebeschi, S.; Valentinitsch, A.; Bette, S.; Huber, T.; Gempt, J.; Meyer, B.; Schlegel, J.; et al. Diffusion tensor image features predict IDH genotype in newly diagnosed WHO grade II/III gliomas. Sci. Rep. 2017, 7, 13396. [Google Scholar] [CrossRef]
- Kickingereder, P.; Bonekamp, D.; Nowosielski, M.; Kratz, A.; Sill, M.; Burth, S.; Wick, A.; Eidel, O.; Schlemmer, H.-P.; Radbruch, A.; et al. Radiogenomics of Glioblastoma: Machine Learning–based Classification of Molecular Characteristics by Using Multiparametric and Multiregional MR Imaging Features. Radiology 2016, 281, 907–918. [Google Scholar] [CrossRef] [PubMed]
- Yu, J.; Shi, Z.; Lian, Y.; Li, Z.; Liu, T.; Gao, Y.; Wang, Y.; Chen, L.; Mao, Y. Noninvasive IDH1 mutation estimation based on a quantitative radiomics approach for grade II glioma. Eur. Radiol. 2016, 27, 3509–3522. [Google Scholar] [CrossRef]
- Wang, J.; Xu, J.; Zhao, C.-A.; Peng, Y.; Wang, H. An ensemble feature selection method for high-dimensional data based on sort aggregation. Syst. Sci. Control. Eng. 2019, 7, 32–39. [Google Scholar] [CrossRef]
- Calvar, J.A.; Meli, F.J.; Romero, C.; Yánez, M.L.C.P.; Martinez, A.R.; Lambre, H.; Taratuto, A.L.; Sevlever, G.E. Characterization of brain tumors by MRS, DWI and Ki-67 labeling index. J. Neuro-Oncol. 2005, 72, 273–280. [Google Scholar] [CrossRef] [PubMed]
- Nie, Q.-M.; Lin, Y.-Y.; Yang, X.; Shen, L.; Guo, L.-M.; Que, S.-L.; Li, X.-X.; Ge, J.-W.; Wang, G.-S.; Xiong, W.-H.; et al. IDH1R132H decreases the proliferation of U87 glioma cells through upregulation of microRNA-128a. Mol. Med. Rep. 2015, 12, 6695–6701. [Google Scholar] [CrossRef] [PubMed]
- Zhou, H.; Vallières, M.; Bai, H.X.; Su, C.; Tang, H.; Oldridge, D.; Zhang, Z.; Xiao, B.; Liao, W.; Tao, Y.; et al. MRI features predict survival and molecular markers in diffuse lower-grade gliomas. Neuro-oncology 2017, 19, 862–870. [Google Scholar] [CrossRef]
- Ostrom, Q.T.; Gittleman, H.; Farah, P.; Ondracek, A.; Chen, Y.; Wolinsky, Y.; Stroup, N.E.; Kruchko, C.; Barnholtz-Sloan, J.S. CBTRUS Statistical Report: Primary Brain and Central Nervous System Tumors Diagnosed in the United States in 2006–2010. Neuro-oncology 2013, 15, ii1–ii56. [Google Scholar] [CrossRef]
- Parsons, D.W.; Jones, S.; Zhang, X.; Lin, J.C.-H.; Leary, R.J.; Angenendt, P.; Mankoo, P.; Carter, H.; Siu, I.-M.; Gallia, G.L.; et al. An Integrated Genomic Analysis of Human Glioblastoma Multiforme. Science 2008, 321, 1807–1812. [Google Scholar] [CrossRef]
- Raosoft Sample Size Online Calculator. Available online: http://www.raosoft.com/samplesize.html (accessed on 22 October 2020).
- Haralick, R.M.; Shanmugam, K.; Dinstein, I. Textural Features for Image Classification. IEEE Trans. Syst. Man Cybern. 1973, SMC-3, 610–621. [Google Scholar] [CrossRef]
- Tang, X. Texture information in run-length matrices. IEEE Trans. Image Process. 1998, 7, 1602–1609. [Google Scholar] [CrossRef]
- Thibault, G.; Fertil, B.; Navarro, C.; Pereira, S.; Cau, P.; Lévy, N.; Sequeira, J.; Mari, J.-L. SHAPE AND TEXTURE INDEXES APPLICATION TO CELL NUCLEI CLASSIFICATION. Int. J. Pattern Recognit. Artif. Intell. 2013, 27. [Google Scholar] [CrossRef]
- Chen, S.; Harmon, S.; Perk, T.; Li, X.; Chen, M.; Li, Y.; Jeraj, R. Using neighborhood gray tone difference matrix texture features on dual time point PET/CT images to differentiate malignant from benign FDG-avid solitary pulmonary nodules. Cancer Imaging 2019, 19, 1–8. [Google Scholar] [CrossRef] [PubMed]
- Liao, X.; Cai, B.; Tian, B.; Luo, Y.; Song, W.; Li, Y. Machine-learning based radiogenomics analysis of MRI features and metagenes in glioblastoma multiforme patients with different survival time. J. Cell. Mol. Med. 2019, 23, 4375–4385. [Google Scholar] [CrossRef] [PubMed]
- Parekh, V.; Jacobs, M.A. Radiomics: A new application from established techniques. Expert Rev. Precis. Med. Drug Dev. 2016, 1, 207–226. [Google Scholar] [CrossRef] [PubMed]
- Chawla, N.; Bowyer, K.W.; Hall, L.O.; Kegelmeyer, W.P. SMOTE: Synthetic Minority Over-sampling Technique. J. Artif. Intell. Res. 2002, 16, 321–357. [Google Scholar] [CrossRef]
- Ling, J.; Wang, X.; Sun, Y. Research of Android Malware Detection based on ACO Optimized Xgboost Parameters Approach. In Proceedings of the 3rd International Conference on Mechatronics Engineering and Information Technology (ICMEIT 2019), Dalian, China, 29–30 March 2019. [Google Scholar]


| Patient Characteristics | n (%) |
|---|---|
| Total Patients | 100 |
| Female | 40 (40) |
| Male | 60 (60) |
| Age (in years) | |
| Mean | 55 ± 15 |
| Median | 57 |
| Range | 28–88 |
| Presence of enhancement on MRI | 82 (82) |
| IDH1 status by immunohistochemistry | |
| Wildtype | 78 (78) |
| Mutant | 22 (22) |
| WHO Grade | |
| Grade II | 11 (11) |
| Grade III | 8 (8) |
| Grade IV | 81 (81) |
| Subset | IDH1 Status | Total | Male | Female | Grade II | Grade III | Grade IV |
|---|---|---|---|---|---|---|---|
| Training (n = 60) | Wildtype | 46 | 25 | 21 | 1 | 0 | 45 |
| Mutant | 14 | 10 | 4 | 5 | 5 | 4 | |
| Validation (n = 20) | Wildtype | 16 | 10 | 6 | 0 | 0 | 16 |
| Mutant | 4 | 3 | 1 | 2 | 1 | 1 | |
| Test (n = 20) | Wildtype | 16 | 10 | 6 | 1 | 0 | 15 |
| Mutant | 4 | 2 | 2 | 2 | 2 | 0 |
| Model | ROC AUC [95% CI] | Accuracy | Precision | Recall | F1-score |
|---|---|---|---|---|---|
| DWI | 0.97 [0.898, 1.000] | 0.90 | Wildtype: 0.94 Mutant: 0.75 | Wildtype: 0.94 Mutant: 0.75 | Wildtype: 0.94 Mutant: 0.75 |
| FLAIR | 0.95 [0.864, 1.000] | 0.90 | Wildtype: 0.94 Mutant: 0.75 | Wildtype: 0.94 Mutant: 0.75 | Wildtype: 0.94 Mutant: 0.75 |
| DWI-FLAIR | [0.741, 1.000] | 0.90 | Wildtype: 0.94 Mutant: 0.75 | Wildtype: 0.94 Mutant: 0.75 | Wildtype: 0.94 Mutant: 0.75 |
| DWI-FLAIR | FLAIR | DWI |
|---|---|---|
| DWI_Original First Order Total Energy | Original Gray Level Run Length Matrix Short Run High Gray Level Emphasis | Original Gray Level Co-occurrence Matrix Autocorrelation |
| DWI_Original First Order Mean Absolute Deviation | Original First Order Mean Absolute Deviation | Original Gray Level Run Length Matrix Run Entropy |
| FLAIR_Original First Order 90th Percentile | Original Gray Level Co-occurrence Matrix Correlation | Original Gray Level Dependence Matrix Dependence Non Uniformity Normalized |
| FLAIR_Original Gray Level Dependence Matrix Small Dependence High Gray Level Emphasis | Original Gray Level Size Zone Matrix Gray Level Variance | Original Gray Level Dependence Matrix Gray Level Variance |
| FLAIR_Original Gray Level Run Length Matrix High Gray Level Run Emphasis | Original Gray Level Size Zone Matrix Low Gray Level Zone Emphasis | Original Gray Level Co-occurrence Matrix Maximum Probability |
| FLAIR_Original Gray Level Size Zone Matrix Gray Level Non Uniformity | Original Gray Level Co-occurrence Matrix Informal Measure of Correlation 2 | Original Gray Level Run Length Matrix Long Run High Gray Level Emphasis |
| DWI_Original First Order Maximum | Original Gray Level Co-occurrence Matrix Cluster Prominence | Original Gray Level Run Length Matrix Gray Level Non Uniformity |
| DWI_Original Gray Level Run Length Matrix Run Entropy | Original Gray Level Dependence Matrix Small Dependence High Gray Level Emphasis | Original Gray Level Size Zone Matrix Small Area High Gray Level Emphasis |
| DWI_Original First Order Skewness | Original Neighboring Gray Tone Difference Matrix Coarseness | Original First Order Total Energy |
| DWI_Original First Order 10th Percentile | Original First Order Range | Original Gray Level Co-occurrence Matrix Informal Measure of Correlation 2 |
Publisher’s Note: MDPI stays neutral with regard to jurisdictional claims in published maps and institutional affiliations. |
© 2020 by the authors. Licensee MDPI, Basel, Switzerland. This article is an open access article distributed under the terms and conditions of the Creative Commons Attribution (CC BY) license (http://creativecommons.org/licenses/by/4.0/).
Share and Cite
Sakai, Y.; Yang, C.; Kihira, S.; Tsankova, N.; Khan, F.; Hormigo, A.; Lai, A.; Cloughesy, T.; Nael, K. MRI Radiomic Features to Predict IDH1 Mutation Status in Gliomas: A Machine Learning Approach using Gradient Tree Boosting. Int. J. Mol. Sci. 2020, 21, 8004. https://doi.org/10.3390/ijms21218004
Sakai Y, Yang C, Kihira S, Tsankova N, Khan F, Hormigo A, Lai A, Cloughesy T, Nael K. MRI Radiomic Features to Predict IDH1 Mutation Status in Gliomas: A Machine Learning Approach using Gradient Tree Boosting. International Journal of Molecular Sciences. 2020; 21(21):8004. https://doi.org/10.3390/ijms21218004
Chicago/Turabian StyleSakai, Yu, Chen Yang, Shingo Kihira, Nadejda Tsankova, Fahad Khan, Adilia Hormigo, Albert Lai, Timothy Cloughesy, and Kambiz Nael. 2020. "MRI Radiomic Features to Predict IDH1 Mutation Status in Gliomas: A Machine Learning Approach using Gradient Tree Boosting" International Journal of Molecular Sciences 21, no. 21: 8004. https://doi.org/10.3390/ijms21218004
APA StyleSakai, Y., Yang, C., Kihira, S., Tsankova, N., Khan, F., Hormigo, A., Lai, A., Cloughesy, T., & Nael, K. (2020). MRI Radiomic Features to Predict IDH1 Mutation Status in Gliomas: A Machine Learning Approach using Gradient Tree Boosting. International Journal of Molecular Sciences, 21(21), 8004. https://doi.org/10.3390/ijms21218004