Author Contributions
A.P.-M. was involved in the investigation, the original draft preparation, in silico (docking and molecular dynamics) conceptualization, methodology, software, and formal analysis, Western blot assay methodology and formal analysis, visualization, and writing—review and editing. M.Á.O.-F. was involved in the investigation, original draft preparation, in silico (docking and molecular dynamics) conceptualization, methodology, software, formal analysis, and Western blot assay formal analysis. E.M. was involved in the conceptualization, and the review and editing of the manuscript. F.V. was involved in the conceptualization, and the review and editing of the manuscript. N.N. was involved in the β-arrestin recruitment assay conceptualization, methodology, and formal analysis, Western blot assay conceptualization, review and editing of the manuscript, as well as project administration, supervision, resources, and funding acquisition. G.C. was involved in β-arrestin recruitment assay conceptualization, Western blot assay conceptualization, visualization, review and editing of the manuscript, project administration, supervision, resources, and funding acquisition. All authors have read and agreed to the published version of the manuscript.
Figure 1.
Acute effects (30 min) of EC on upstream Akt activation and the inhibition of these effects with G15 (GPER antagonist), ML221 (APLNR antagonist), and the combination of both. Each Western blot is representative of three independent experiments. Data are expressed as mean ± SD (n = 3). * = p < 0.05, NS (nonsignificant).
Figure 2.
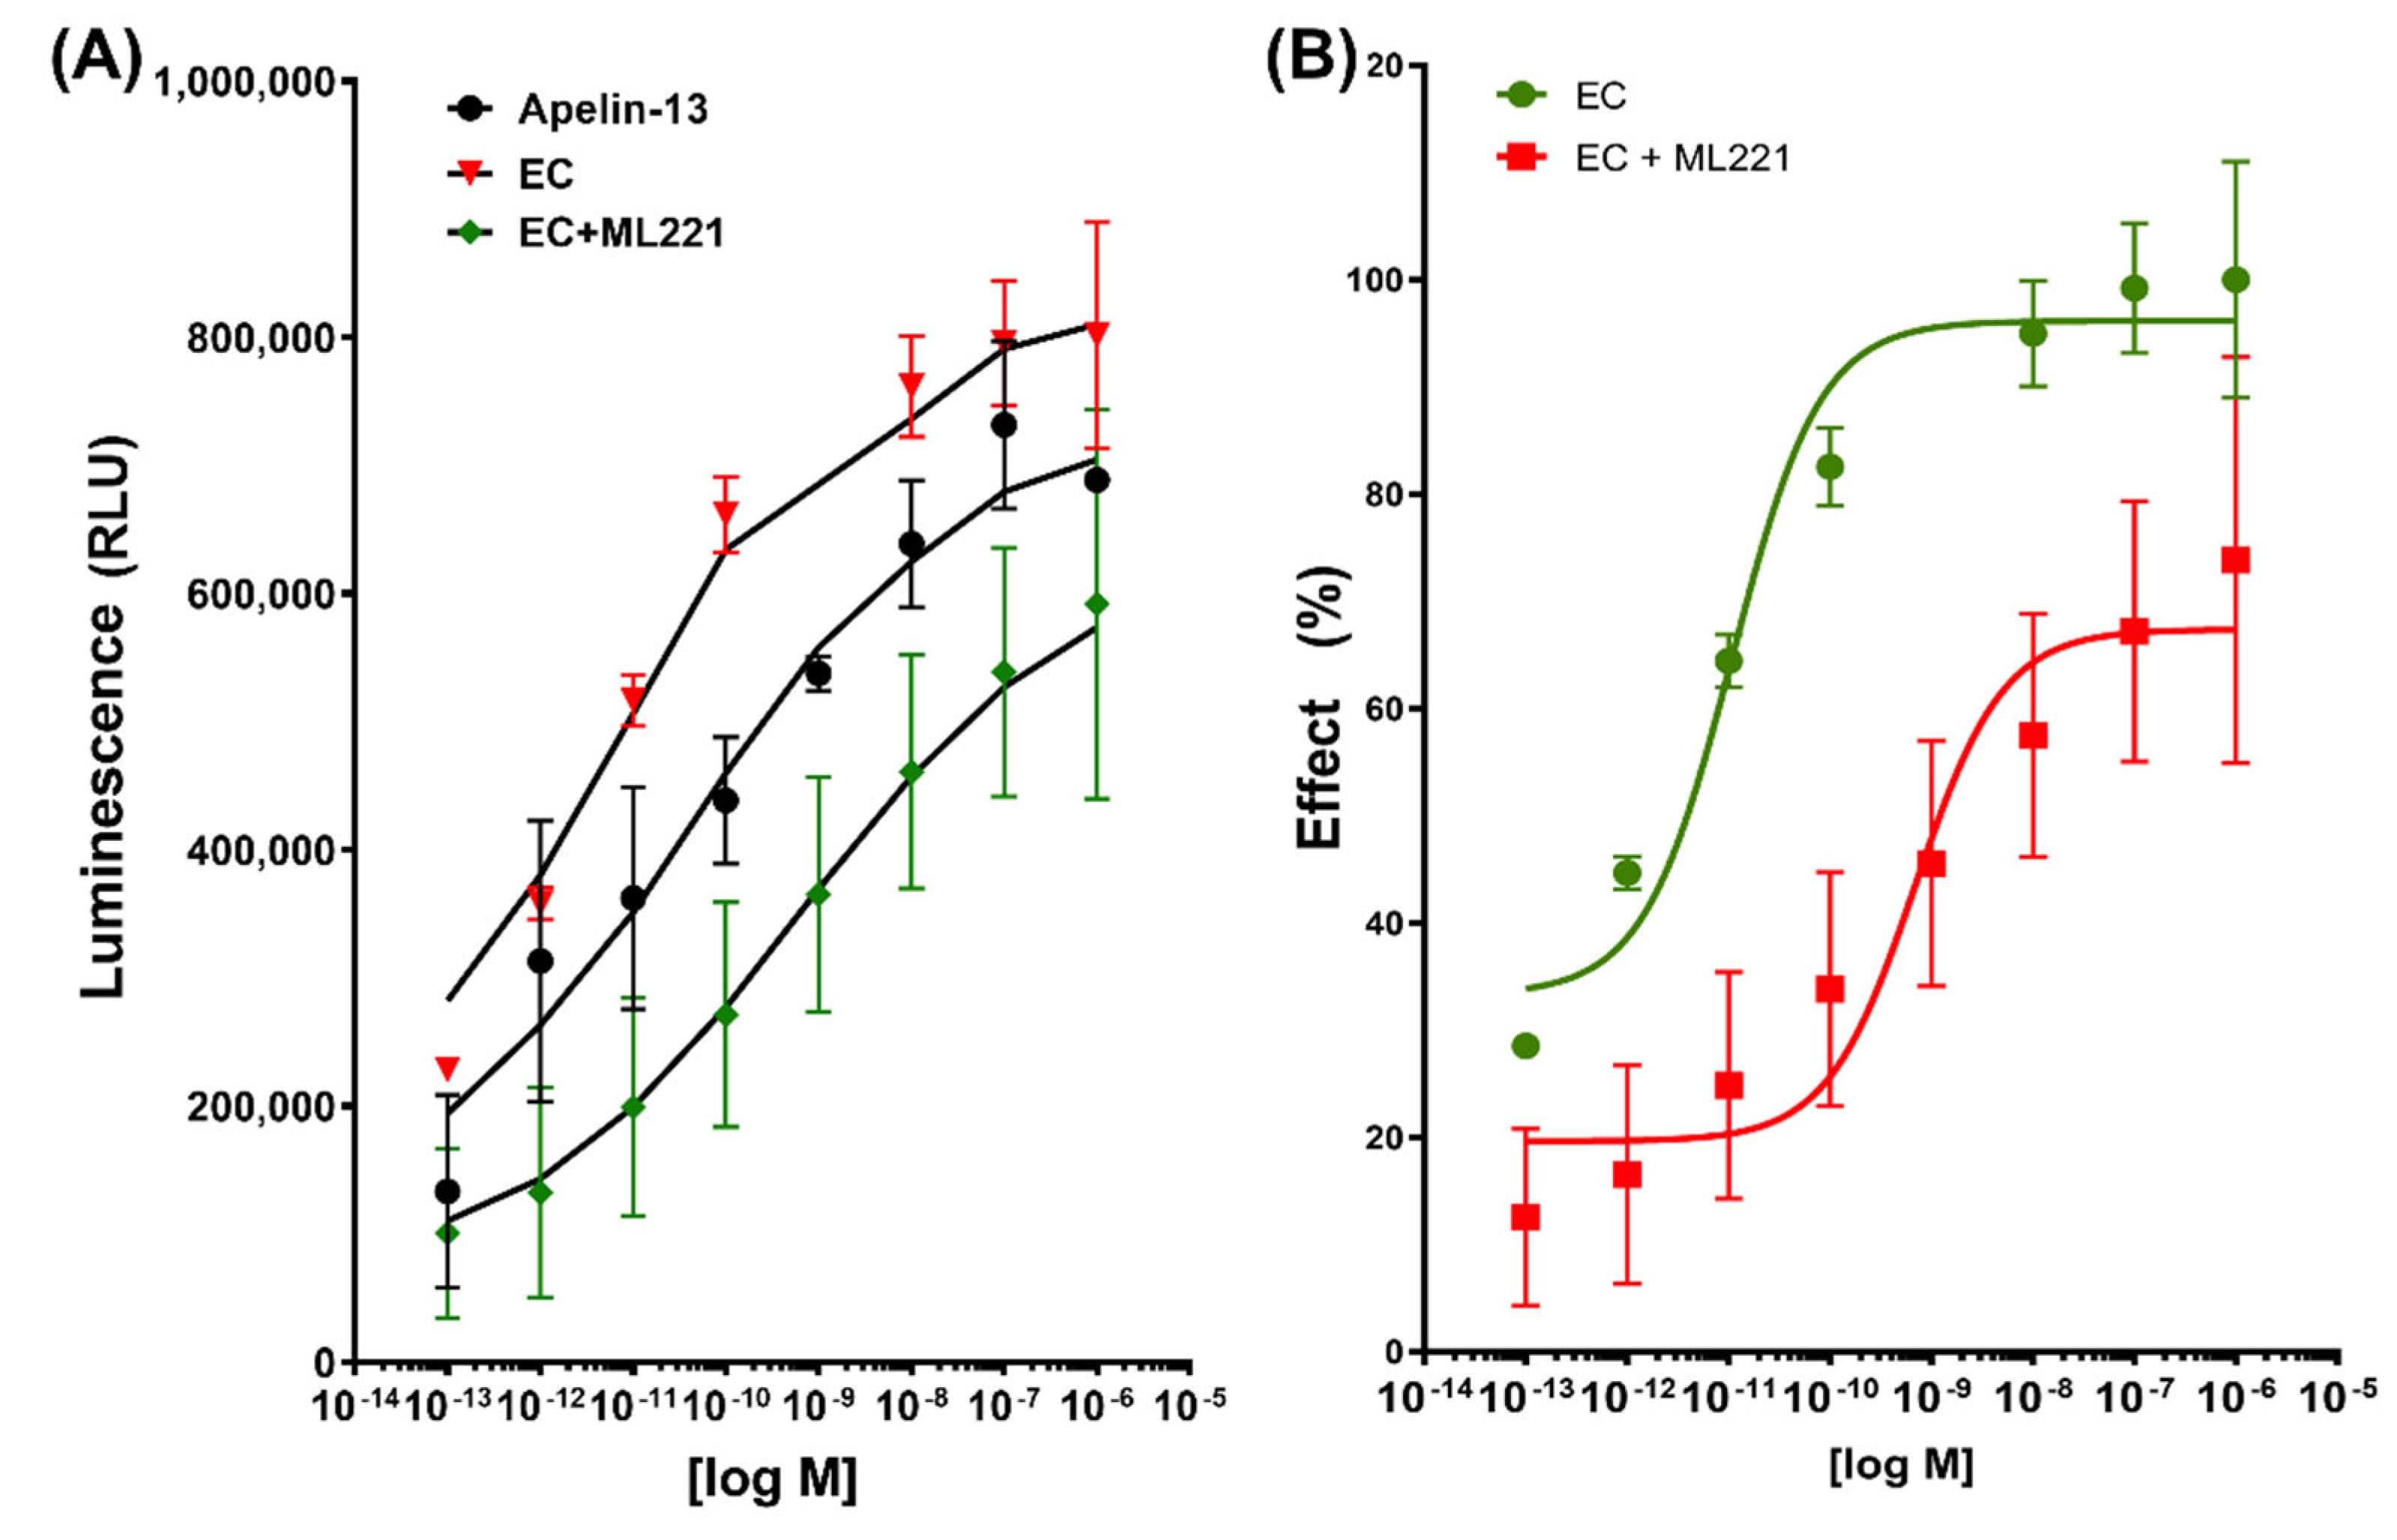
(A): Nonlinear regression with the specific binding with hillslope model for apelin-13, (-)-epicatechin (EC), and the mixture with its antagonist ML221. Relative luminescence units (RLU) are plotted on the y-axis, and data are expressed as mean S.E.; (B) dose–response curve of normalized data taking the EC effect as 10%.
Figure 2.
(A): Nonlinear regression with the specific binding with hillslope model for apelin-13, (-)-epicatechin (EC), and the mixture with its antagonist ML221. Relative luminescence units (RLU) are plotted on the y-axis, and data are expressed as mean S.E.; (B) dose–response curve of normalized data taking the EC effect as 10%.
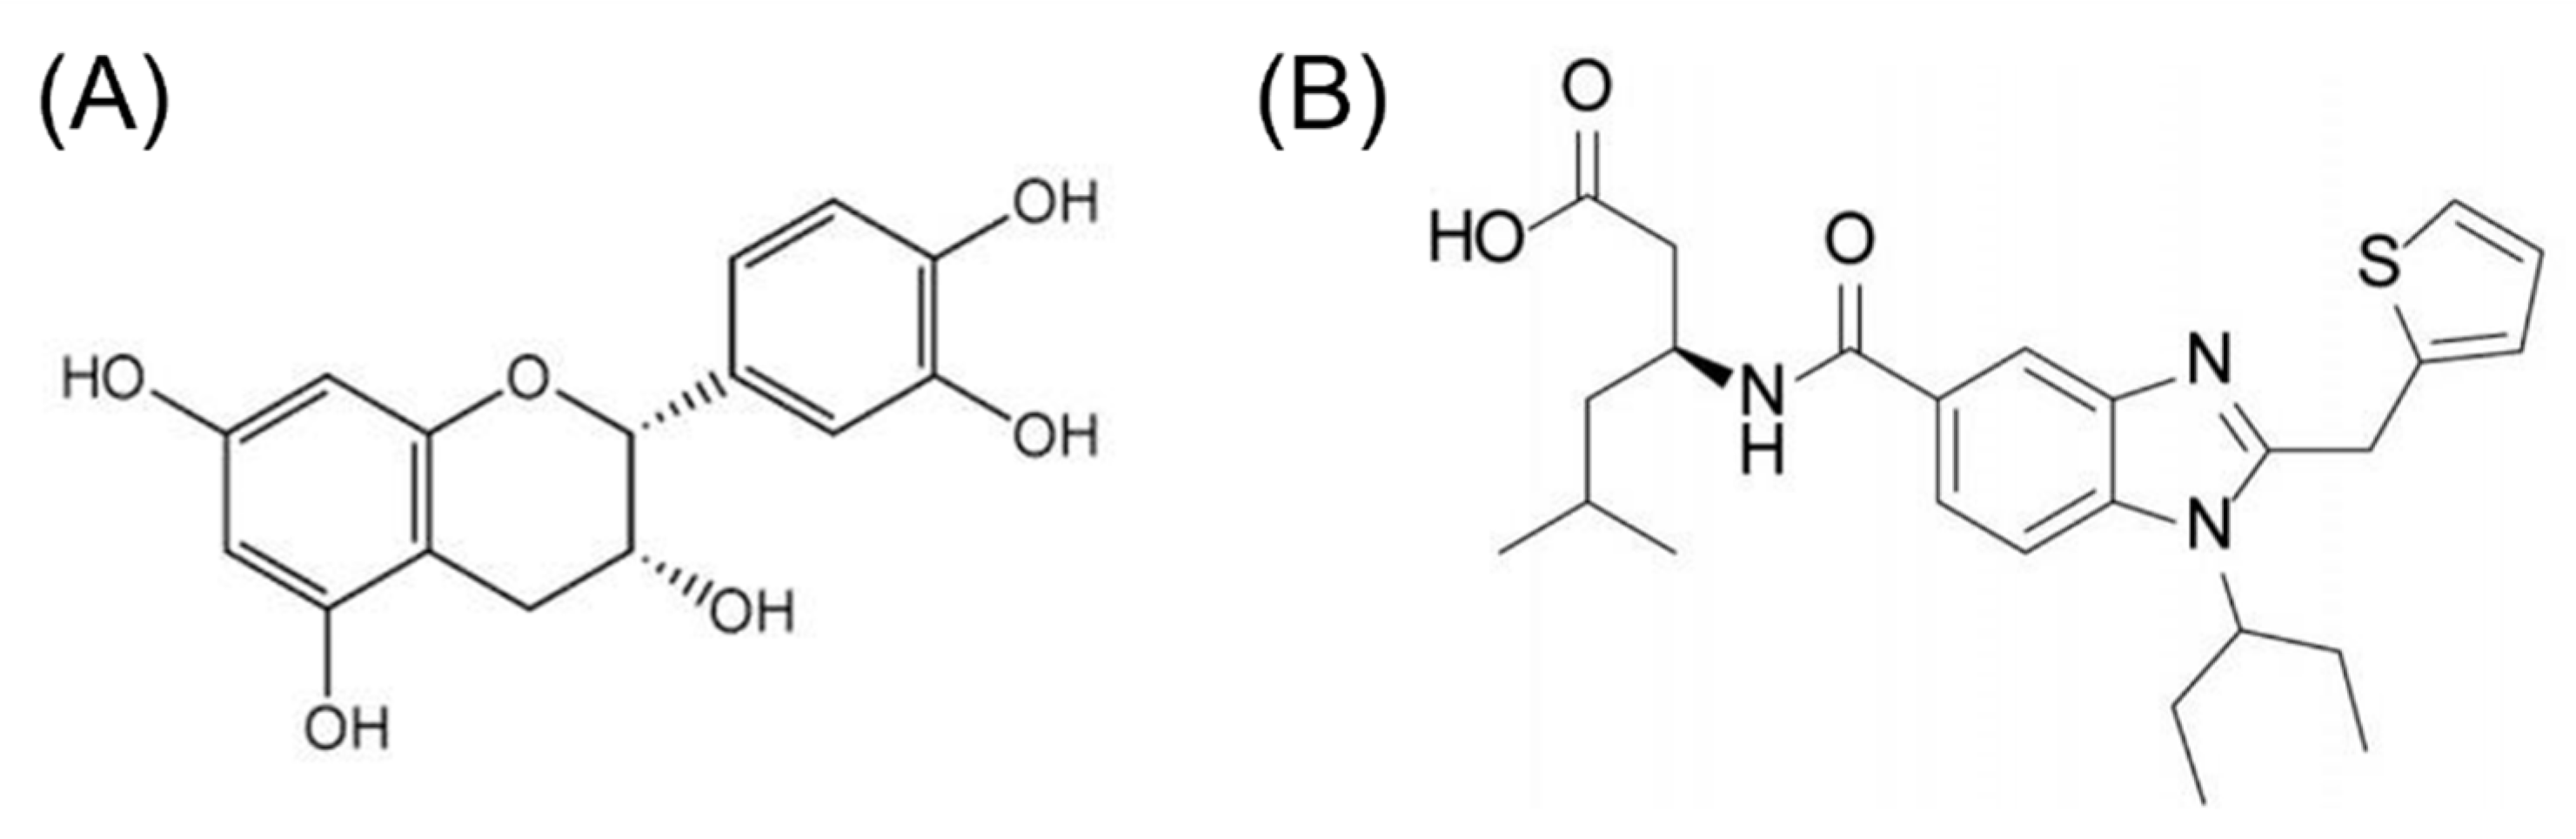
Figure 3.
(A) (-)-Epicatechin and (B) CMF-019 molecular structures.
Figure 3.
(A) (-)-Epicatechin and (B) CMF-019 molecular structures.
Figure 4.
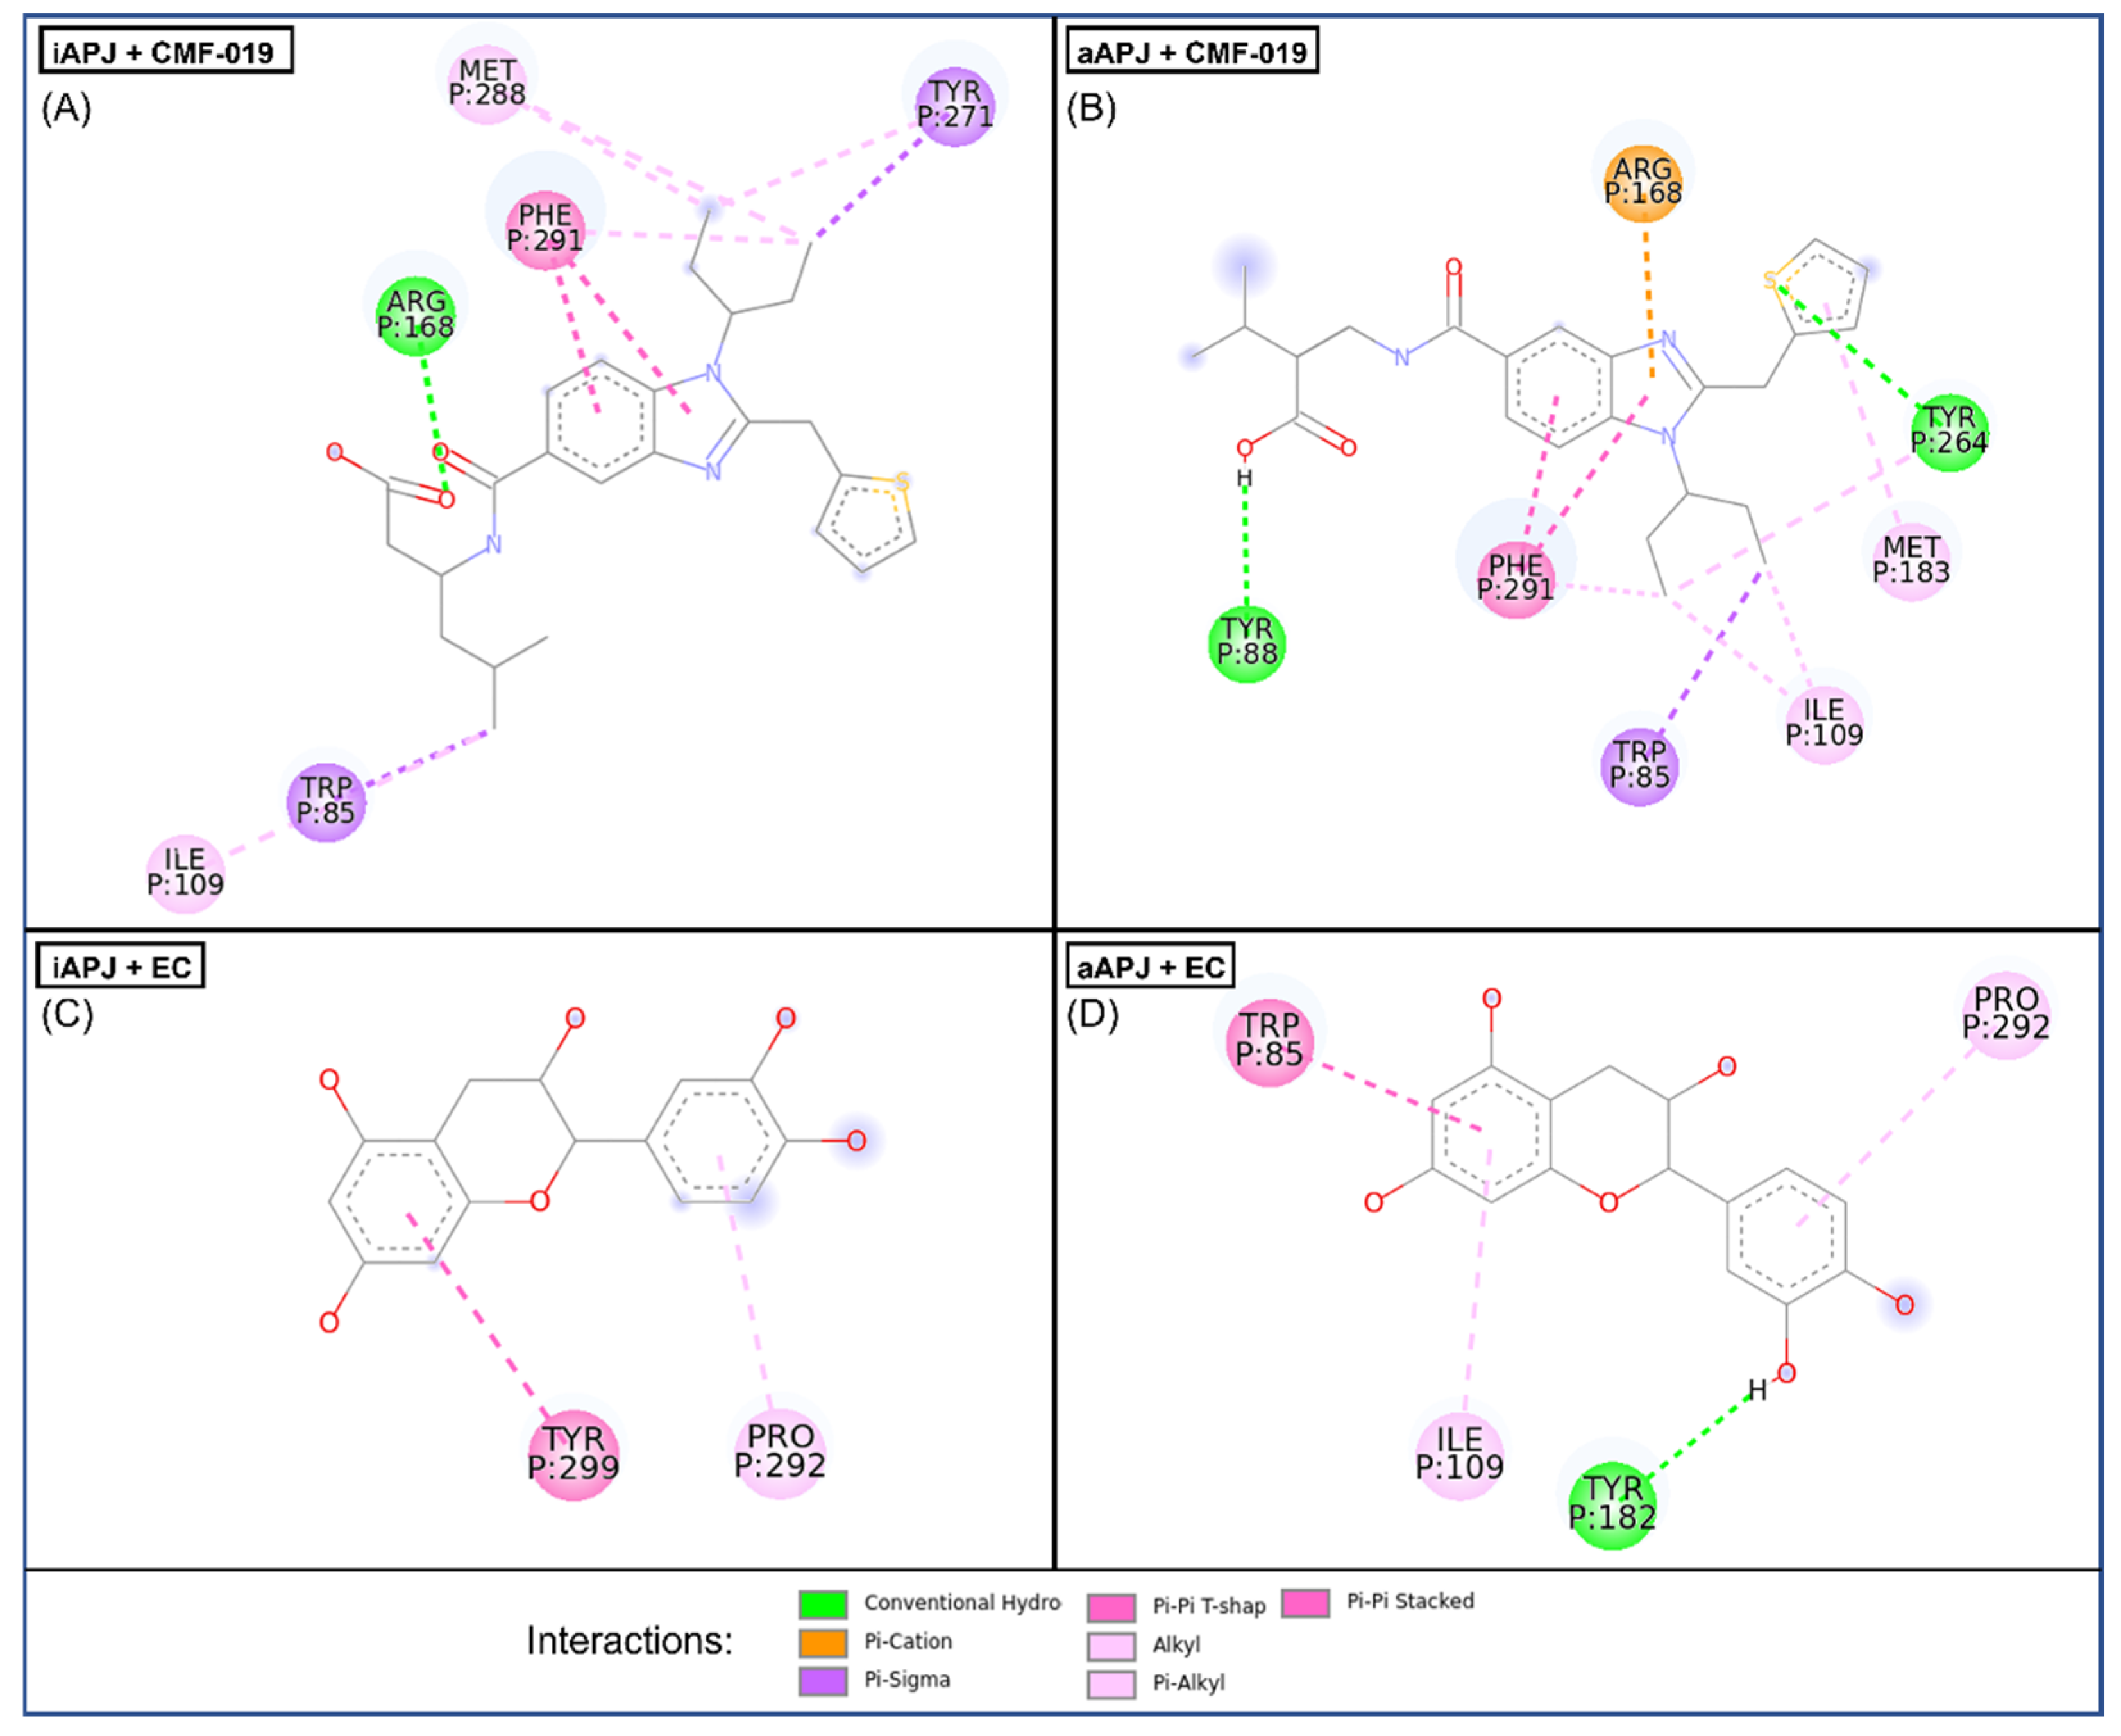
In the four images, we present the binding site and the interactions of the molecular docking results. (
A) CMF-019 binds to the iAPLNR receptor and shows eight hydrophobic interactions and one polar interaction, of which it is worth highlighting two π-π interactions with the Phe291 residue and the hydrogen bond with the Arg168 residue. (
B) The CMF-019 binds to the aAPLNR receptor and establishes eight hydrophobic interactions, two electrostatic interactions, and one ionic, of which we can highlight two π-π with the Phe291 residue; two hydrogen bonds, one with Tyr88 and one with Tyr264; and finally, the formation of a π-cation with residue Arg168. (
C) EC in the inactive conformation of the receptor (iAPLNR) establishes few interactions in contrast to the other three assays, counting only two interactions of a hydrophobic nature with residues Pro292 and Tyr299. (
D) On the other hand, the EC in the active conformation of the receptor (aAPLNR) establishes four interactions, three hydrophobic and one electrostatic, of which it is worth highlighting the hydrogen bond with Tyr182 and the π-π with Trp85.APJ = APLNR. Images were made with Discovery Studio [
39].
Figure 4.
In the four images, we present the binding site and the interactions of the molecular docking results. (
A) CMF-019 binds to the iAPLNR receptor and shows eight hydrophobic interactions and one polar interaction, of which it is worth highlighting two π-π interactions with the Phe291 residue and the hydrogen bond with the Arg168 residue. (
B) The CMF-019 binds to the aAPLNR receptor and establishes eight hydrophobic interactions, two electrostatic interactions, and one ionic, of which we can highlight two π-π with the Phe291 residue; two hydrogen bonds, one with Tyr88 and one with Tyr264; and finally, the formation of a π-cation with residue Arg168. (
C) EC in the inactive conformation of the receptor (iAPLNR) establishes few interactions in contrast to the other three assays, counting only two interactions of a hydrophobic nature with residues Pro292 and Tyr299. (
D) On the other hand, the EC in the active conformation of the receptor (aAPLNR) establishes four interactions, three hydrophobic and one electrostatic, of which it is worth highlighting the hydrogen bond with Tyr182 and the π-π with Trp85.APJ = APLNR. Images were made with Discovery Studio [
39].
![Ijms 23 08962 g004]()
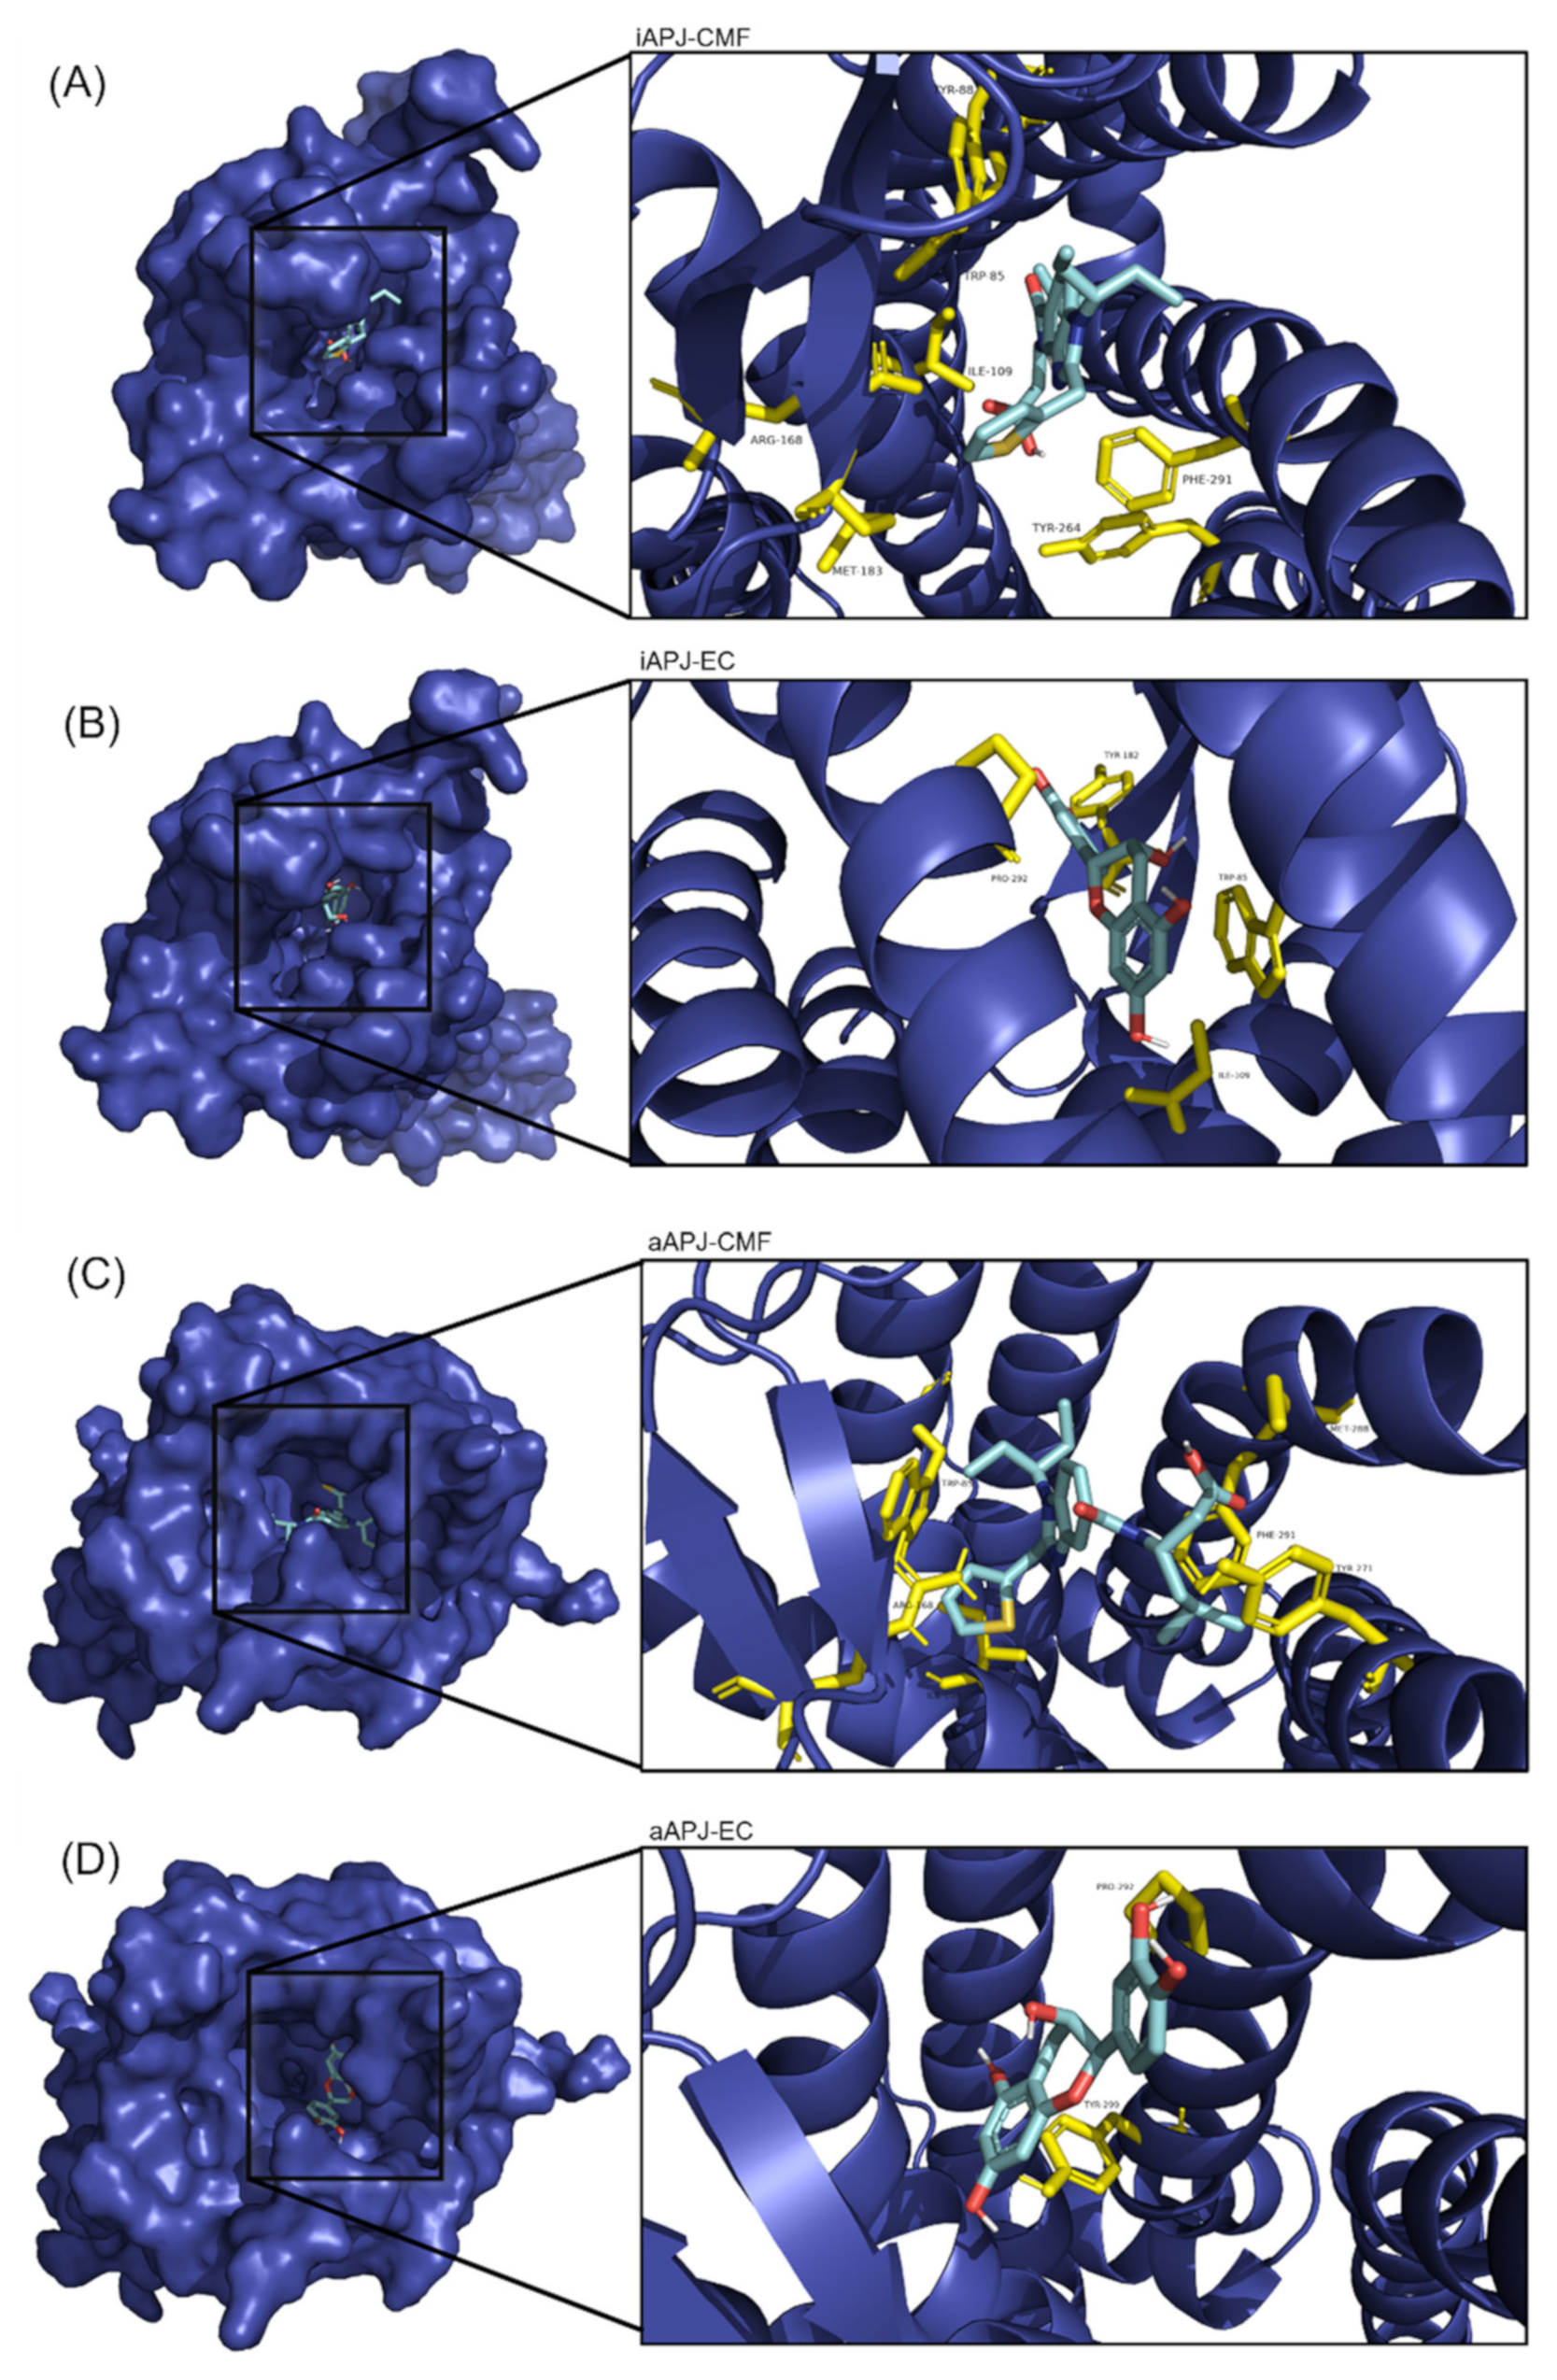
Figure 5.
On the left side of each image, the APLN receptor seen from above is shown in a surface representation, and within the cavity (binding site) is the corresponding ligand. A close-up of the binding site is shown to the right of each image, with the amino acid residues in yellow and the ligand in cyan blue. (A) The binding site of the CMF-019 in the inactive APLNR conformation. (B) The binding site of the (-)-epicatechin in the inactive APLN conformation. (C) The binding site of the CMF-019 in the active APLNR conformation. (D) The binding site of the (-)-epicatechin in the active APLNR conformation.
Figure 6.
On the left side of each model, the APJ receptor seen from the side is represented in 3D, and on the right, the same receptor, but seen from above. Yellow shows the surface of the residues with which the ligand is in contact, and the arrows indicate the transmembrane domain (TM) to which the residue corresponds. (A) The interaction of CMF-019 with the receptor in its inactive conformation: it is observed how the ligand has contact with TM2, 3, 4, 6, and 7. (B) The interaction of (-)-epicatechin with the receptor in its inactive conformation: it is observed how it only has contact with the TM7. (C) The interaction of CMF-019 with the receptor in its active conformation: it is observed how the ligand has contact with TM2, 3, 4, 6, and 7, and with the extracellular loop (ECL) 2. (D) The interaction of (-)-epicatechin with the receptor in its active conformation: it is observed how it has contact with the TM2, 3 and 7, and with the ECL2.
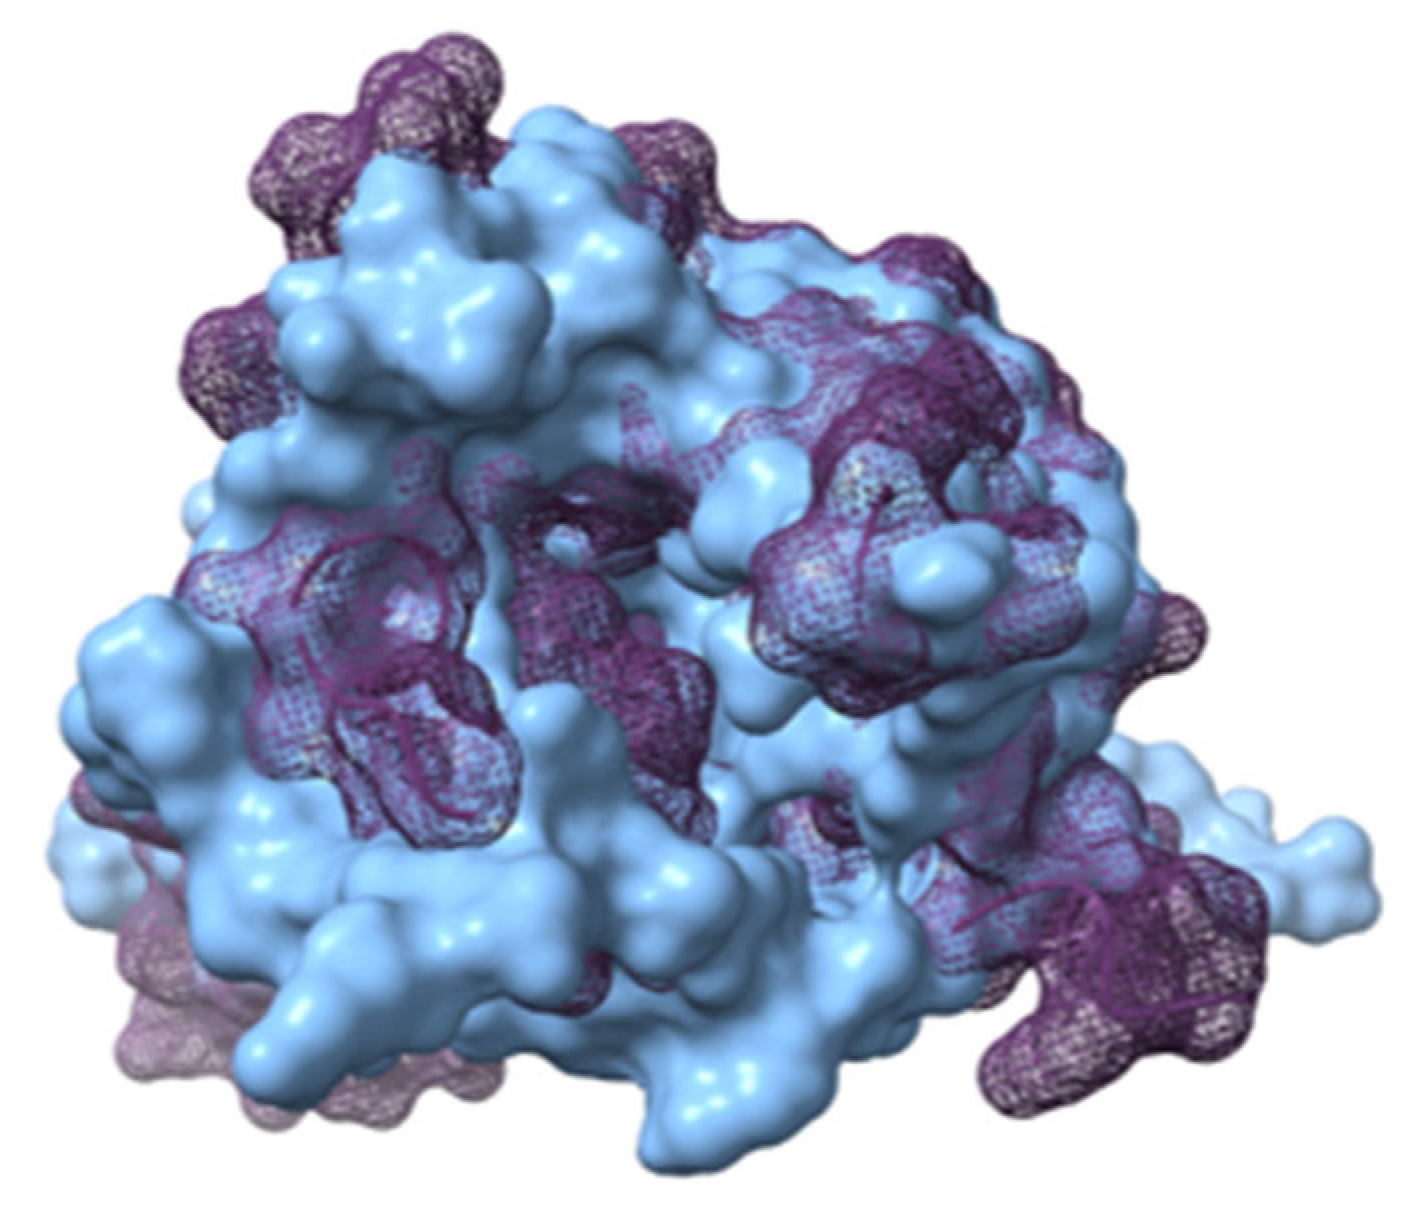
Figure 7.
APLNR in both conformations superimposed. Active on purple mesh and inactive on blue surface.
Figure 7.
APLNR in both conformations superimposed. Active on purple mesh and inactive on blue surface.
Figure 8.
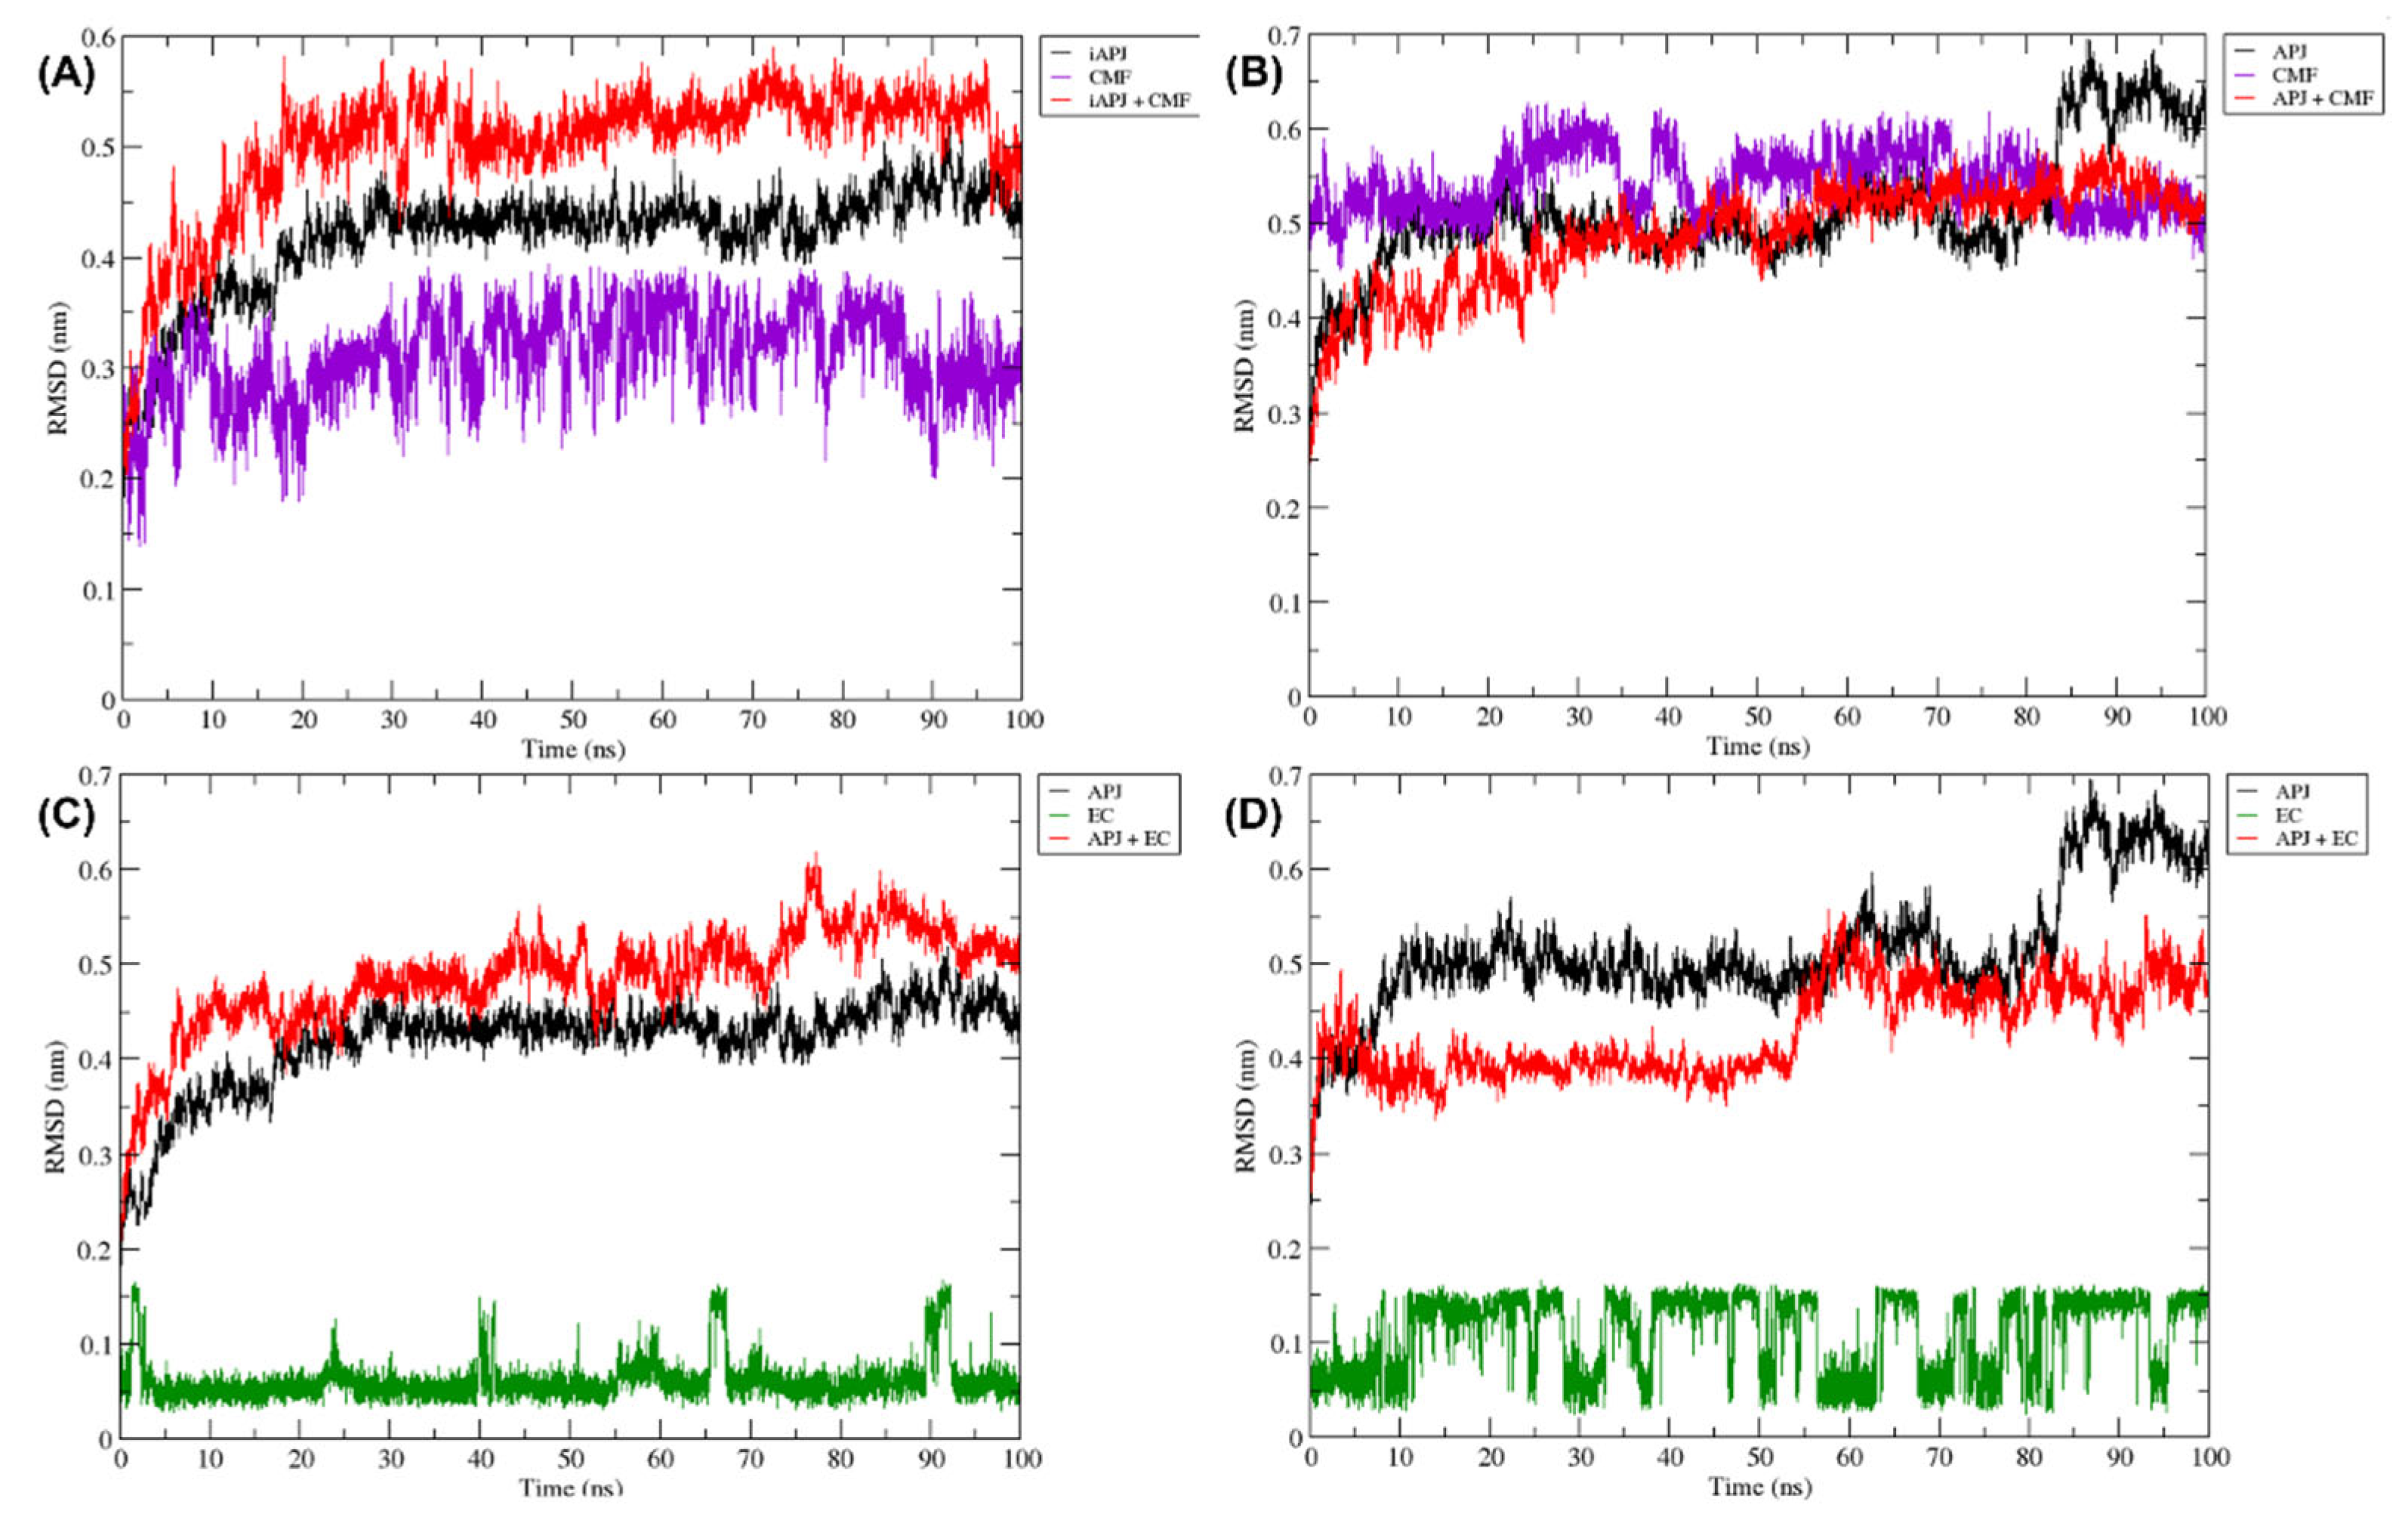
The RMSD plots were obtained from a 100 ns MD simulation. On the ordinate axis, the variation in distance is shown in nanometers and on the abscissa axis, the trajectory time is shown in nanoseconds. In all quadrants, we can see the movement of the APLN receptor alone (black line), the APLN receptor in complex with a ligand (red line), the CMF ligand only in (A,B) (purple line), and the EC ligand only in (C,D) (green line). iAPLNR = inactive APLNR; aAPLNR = active APLNR; EC = (-)-epicatechin; CMF = CMF-019; APJ = APLNR; black line = receptors MD simulation; red line = receptor in complex with a ligand; green = EC within the receptor; purple line = CMF-019 within the receptor; ns = nanoseconds; nm = nanometers.
Figure 8.
The RMSD plots were obtained from a 100 ns MD simulation. On the ordinate axis, the variation in distance is shown in nanometers and on the abscissa axis, the trajectory time is shown in nanoseconds. In all quadrants, we can see the movement of the APLN receptor alone (black line), the APLN receptor in complex with a ligand (red line), the CMF ligand only in (A,B) (purple line), and the EC ligand only in (C,D) (green line). iAPLNR = inactive APLNR; aAPLNR = active APLNR; EC = (-)-epicatechin; CMF = CMF-019; APJ = APLNR; black line = receptors MD simulation; red line = receptor in complex with a ligand; green = EC within the receptor; purple line = CMF-019 within the receptor; ns = nanoseconds; nm = nanometers.
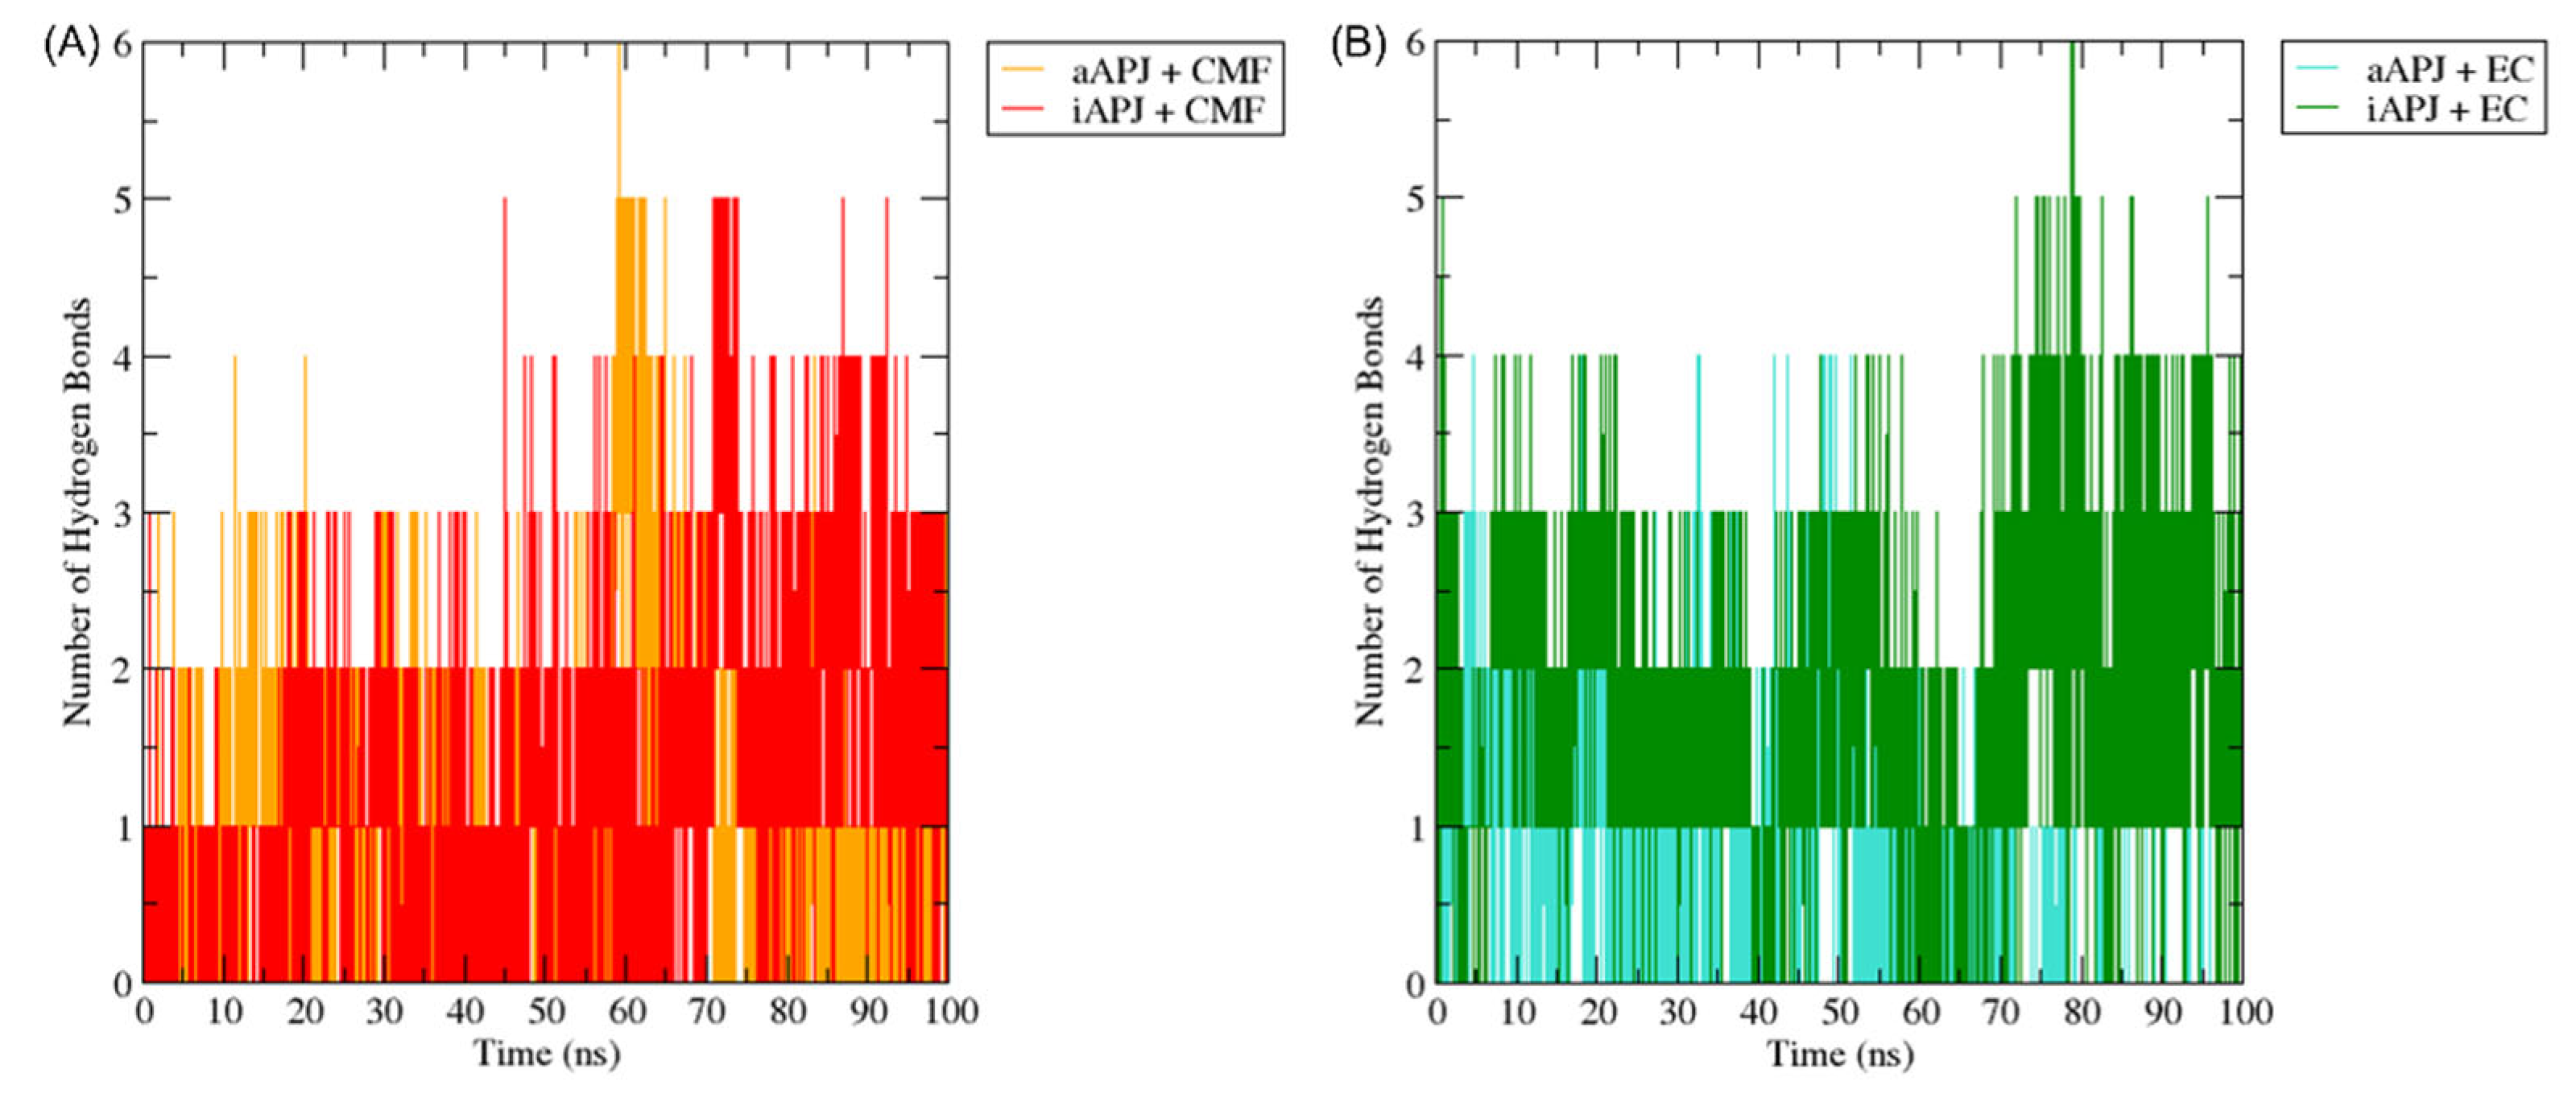
Figure 9.
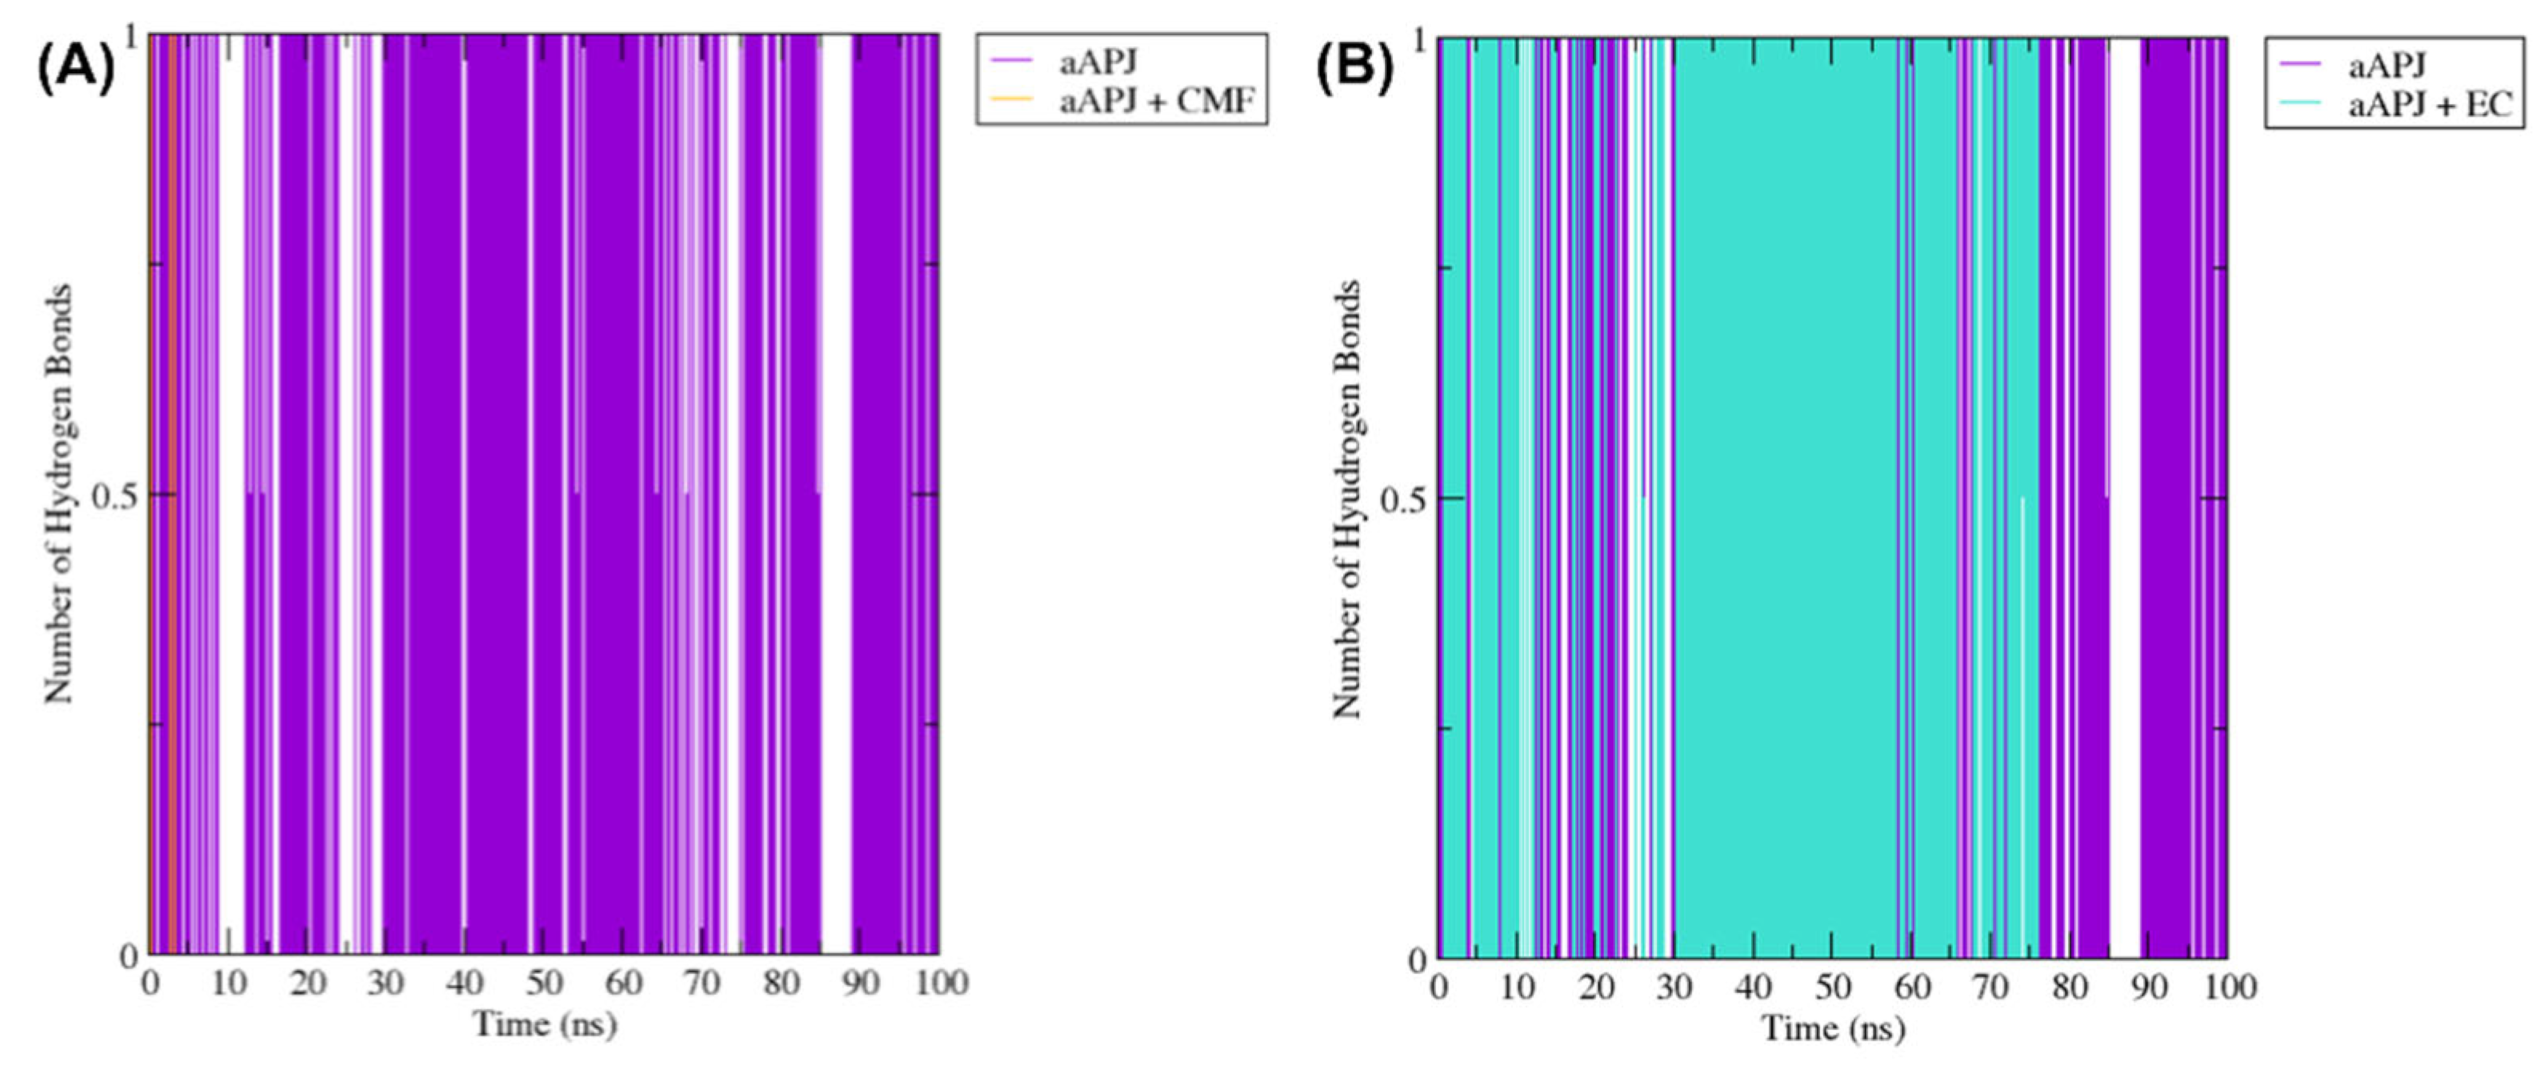
The H-bond plot shows the evolution of all hydrogen bonds formed by (-)-epicatechin (EC) and CMF-019 (CMF) in complex with the iAPLNR and aAPLNR, during a 100 ns MD simulation. For both graphs, on the ordinate axis, we see the number of hydrogen bonds, and on the abscissa axis, we have the simulation time expressed in nanoseconds. (A) The CMF can form up to six hydrogen bonds in the active conformation, and five in the inactive one of the APLN receptor during the entire trajectory, with an average of approximately three hydrogen bonds for both conformations. (B) EC manages to form up to five hydrogen bonds in the active conformations and up to six hydrogen bonds in the inactive conformation. For the active conformation of the receptor (aAPLNR), the hydrogen bonds begin to disappear in the last ~30 ns of the simulation, until only one is formed. This is because in the presence of EC, the APLNR modifies its conformation after a period of time—the same phenomenon that we observed with the RMSD of the EC + aAPLNR complex. ns = nanoseconds.
Figure 9.
The H-bond plot shows the evolution of all hydrogen bonds formed by (-)-epicatechin (EC) and CMF-019 (CMF) in complex with the iAPLNR and aAPLNR, during a 100 ns MD simulation. For both graphs, on the ordinate axis, we see the number of hydrogen bonds, and on the abscissa axis, we have the simulation time expressed in nanoseconds. (A) The CMF can form up to six hydrogen bonds in the active conformation, and five in the inactive one of the APLN receptor during the entire trajectory, with an average of approximately three hydrogen bonds for both conformations. (B) EC manages to form up to five hydrogen bonds in the active conformations and up to six hydrogen bonds in the inactive conformation. For the active conformation of the receptor (aAPLNR), the hydrogen bonds begin to disappear in the last ~30 ns of the simulation, until only one is formed. This is because in the presence of EC, the APLNR modifies its conformation after a period of time—the same phenomenon that we observed with the RMSD of the EC + aAPLNR complex. ns = nanoseconds.
![Ijms 23 08962 g009]()
Figure 10.
The H-bond plot shows the evolution of the hydrogen bonds formed by the TM5 Y221 residue and the TM7 Y309 residue. (A) When the receptor is alone (aAPLNR—purple lines), we see how these two residues form the hydrogen bond in practically the entire trajectory. However, when CMF-109 (CMF) binds, it induces a conformational change in the receptor that causes a gap between the TM5 and TM7, thus preventing the formation of the hydrogen bond. (B) On the other hand, when (-)-epicatechin (EC) is inside, it allows the receptor to maintain the spatial arrangement so that these two tyrosine residues are close enough to form the hydrogen bond at least until nanosecond ~75, which is when CE begins to induce a conformational change in the receptor, as we had observed in the RMSD and protein–ligand hydrogen bond formation analysis. APJ = APLNR; ns = nanoseconds.
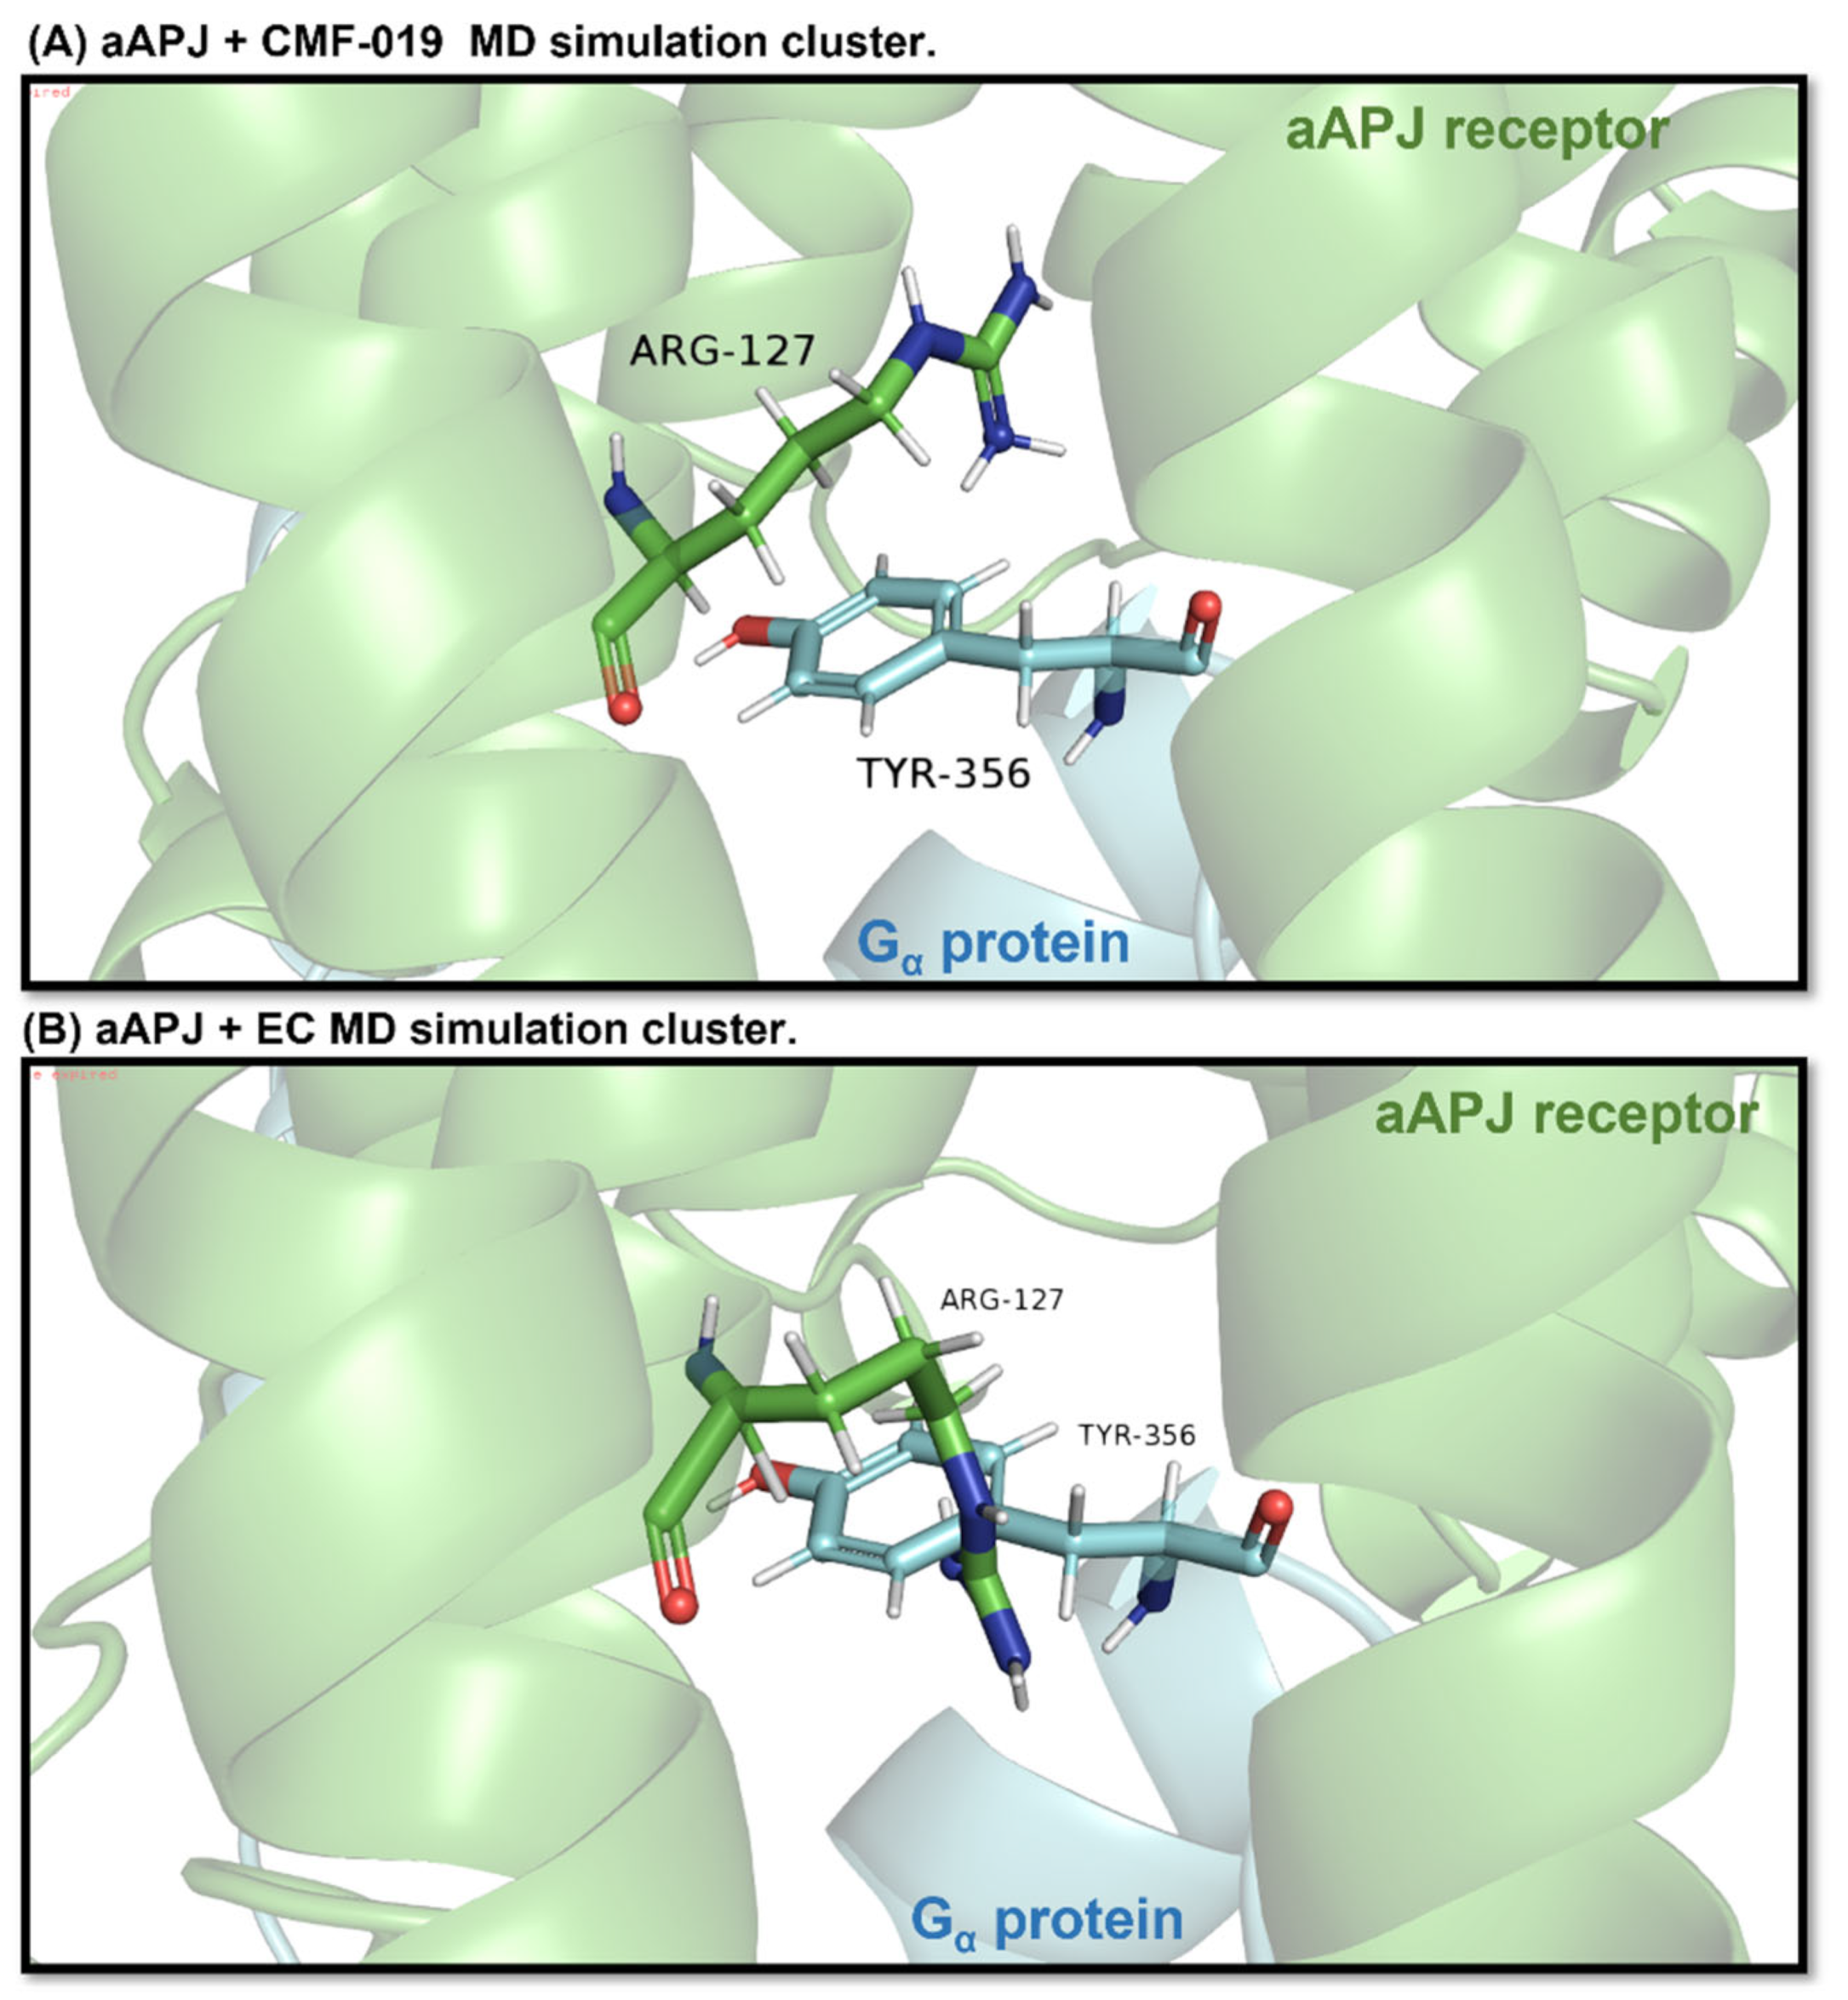
Figure 11.
In the images, the aAPLNR and the same receptor residue Arg127 are shown in green. Cyan blue shows the G protein and the same protein residue, Tyr356. (A) It can be seen how, in the simulation, the aAPLNR in complex with CMF-019 is at a sufficient distance to allow the G protein to enter the cavity. (B) On the other hand, the aAPLNR in complex with the EC is in such a conformation that when placing the G protein, the Tyr356 residue collides spatially with the Arg127 residue of the receptor, which would indicate that the G protein cannot be attached in the closed cavity.
Figure 12.
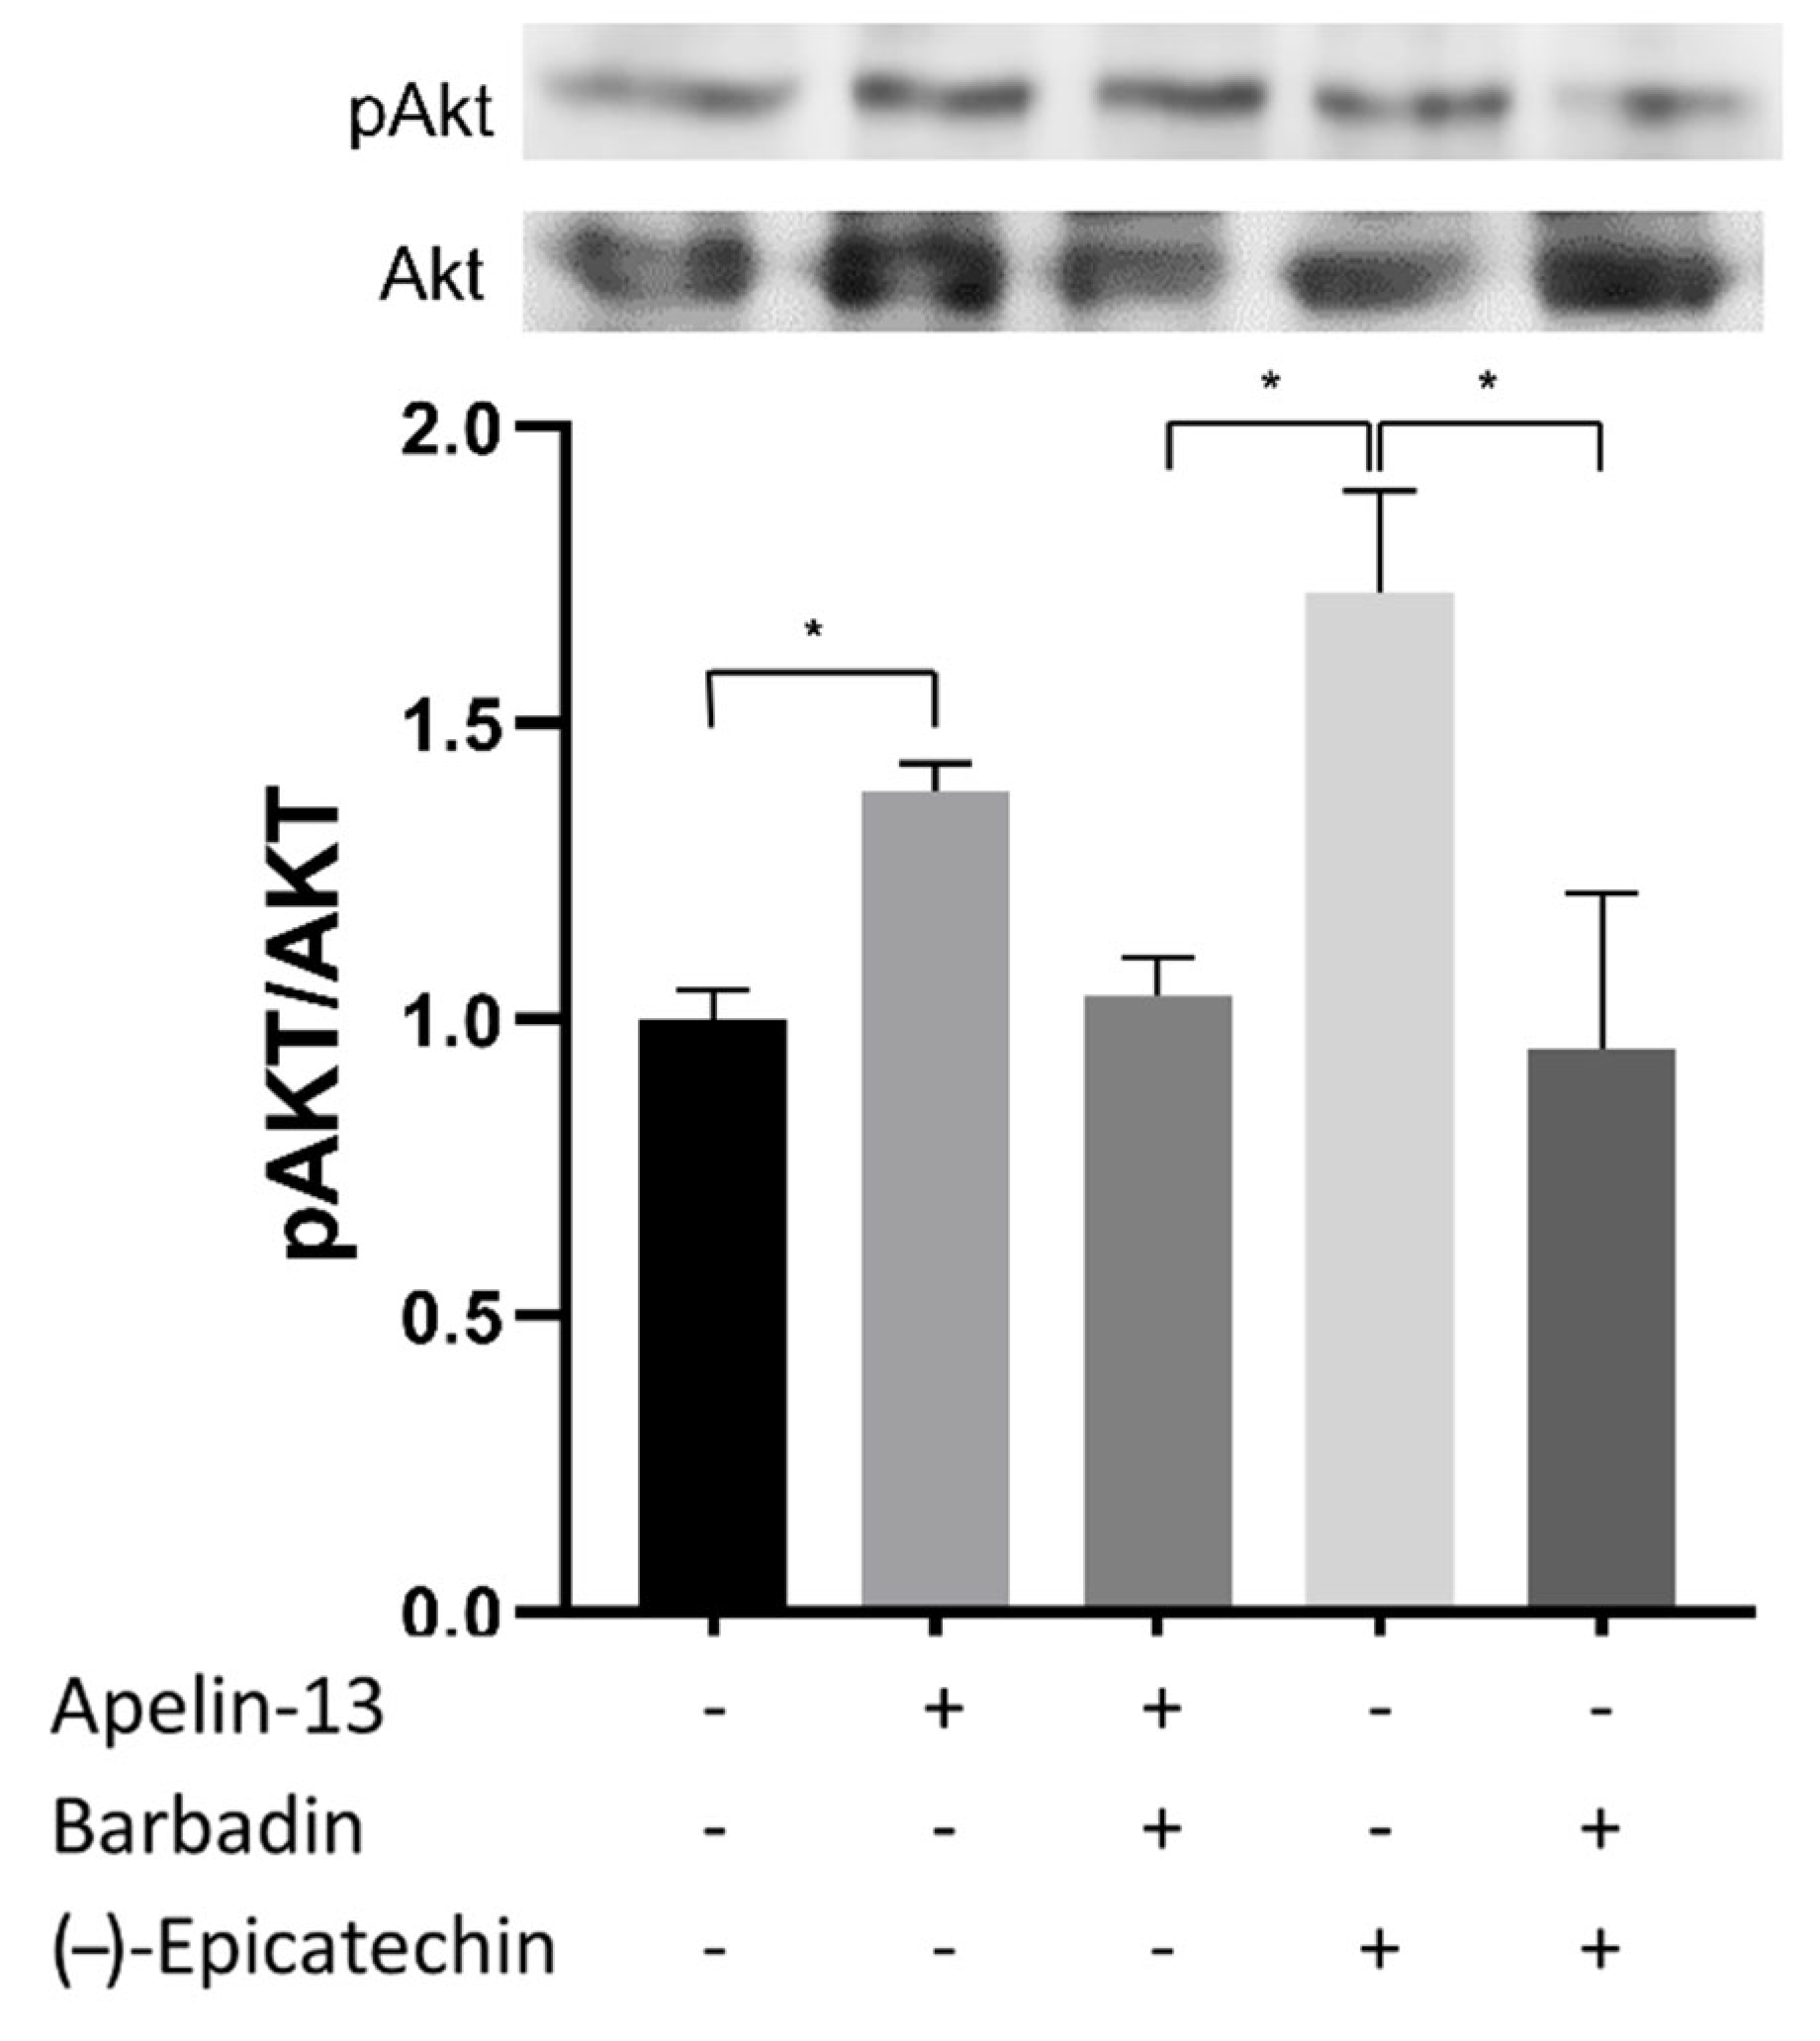
Acute effects (30 min) of apelin−13 and (-)-epicatechin (EC) on upstream Akt activation. These effects were blocked by the β-arrestin inhibitor, Barbadin, as shown in the representative blots (each Western blot is representative of three independent experiments). Data are expressed as mean ± SD (n = 3). * = p < 0.05.
Figure 12.
Acute effects (30 min) of apelin−13 and (-)-epicatechin (EC) on upstream Akt activation. These effects were blocked by the β-arrestin inhibitor, Barbadin, as shown in the representative blots (each Western blot is representative of three independent experiments). Data are expressed as mean ± SD (n = 3). * = p < 0.05.
Table 1.
Reported effects of EC-interacting isolated receptors on skeletal muscle.
Table 1.
Reported effects of EC-interacting isolated receptors on skeletal muscle.
| Protein | Function in Skeletal Muscle |
|---|
| Apelin receptor | Apelin signaling through APJ enhances muscle function by triggering mitochondriogenesis, autophagy, and anti-inflammatory pathways in myofibers as well as enhancing the regenerative capacity by targeting muscle stem cells. It mirrors the effects of maternal exercise on mitochondrial biogenesis and fetal muscle development. It also promotes non-shivering thermogenesis gene expression in fetal and offspring muscle impaired due to maternal obesity, which intergenerationally protects offspring from diet-induced obesity and metabolic disorders [17,18,19,20] |
| Cation-dependent mannose-6-phosphate receptor | Not reported |
| Gamma-aminobutyric acid receptor subunit beta-2 | GABAergic receptors contribute to the cardiovascular responses during the activation of group III/IV skeletal muscle afferent fibers [21].
Modulates sympathetic vasomotor outflow and the pressor responses to activation of metabolically sensitive skeletal muscle afferent fibers, and it also assists the development of motor circuit activity, motoneuron survival, and muscle innervation [12,22]. |
| Glutamate receptor ionotropic, NMDA 2A, and glutamate receptor ionotropic, NMDA 2D | NMDA receptor is found in muscle differentiation, promotes Ca2+ influx in myoblasts, thereby triggering myoblast fusion. It mediates the “nerve–muscle” system, due to the enhancement of NO synthesis under the influence of a glutamate. It promotes acceleration of motor neuron development and is directly involved in skeletal muscle maturation. Exercise triggers NMDA signaling in motor neurons. May accelerate the development of the motor units [13,14,15,23]. |
Table 2.
Comparative effects of APJR stimuli and reported (-)-epicatechin-induced effects on skeletal muscle. ↑= increased values.
Table 2.
Comparative effects of APJR stimuli and reported (-)-epicatechin-induced effects on skeletal muscle. ↑= increased values.
| Apelin | (-)-Epicatechin |
|---|
| Experiment Models | Pathway or Molecule | Experiment Models | Pathway or Molecule |
|---|
| Developing cardiovascular in mouse, xenopus, and zebrafish embryos | ↑MEF2 [24] | Hindlimb muscles from exercised C57BL/6 mice. | ↑MEF2 [25] |
| Chow-fed rat triceps | ↑PGC-1β, ↑activity of cytochrome C oxidase [24] | Old and trained C57BL/6N mice | ↑PGC-1β, ↑activity of cytochrome C oxidase [26] |
| In HFD mice | ↑PGC-1α, TFAM [27] | C57BL/6 mice quadriceps | ↑PGC-1α, TFAM [28] |
| Myocardial microvascular endothelial cells (MMVEC) | ↑eNOS [29] | Human coronary artery endothelial cells (HCAEC) | ↑eNOS [30] |
| In HFD mice | ↑PGC1α, AMPK [27] | Human quadriceps | ↑PGC1α, AMPK [31]. |
| C2C12 skeletal myotubes | ↑Akt phosphorylation [32] | C2C12 skeletal myotubes | ↑Akt phosphorylation [33] |
| Obese and insulin-resistant mice | ↑Mitochondrial biogenesis, PGC1α, NRF-1, TFAM [24] | Human muscle biopsies from quadriceps femoris | ↑Mitochondrial biogenesis, PGC1α, NRF-1, TFAM [34] |
| Muscle cells from young and aged human donors | ↑mTOR, and P70S6K, Akt phosphorylation [17] | Male CD-1 mice. | ↑mTOR, and P70S6K, Akt phosphorylation [35] |
| Male Wistar rats | ↑Activity of Citrate Synthase [19] | C2C12 skeletal myotubes | ↑Activity of Citrate Synthase [5] |
| Different rodent models | ↑UCP3 [24] | Male ICR mice | ↑UCP3 [36] |
Table 3.
Reported effects of EC-interacting isolated receptors on skeletal muscle.
Table 3.
Reported effects of EC-interacting isolated receptors on skeletal muscle.
| Ligand | IC50 | Tau (τ) | KA | Bmax | Kd | h |
|---|
| Apelin | - | - | - | 801,286 | 2.508 × 10⁻¹¹ M | 0.2202 |
| EC | - | 21.8 | 20.8 | 810,100 | 1.755 × 10⁻¹² M | 0.3432 |
| EC + ML221 | 6.93 × 10⁻¹¹ M | 1.53 | 0.53 | 733,981 | 1.012 × 10⁻⁹ M | 0.2134 |
Table 4.
Summary of the data obtained from the molecular docking assay of EC and CMF-019 against iAPLNR and aAPLNR. ∆G values are presented as mean ± standard deviation.
Table 4.
Summary of the data obtained from the molecular docking assay of EC and CMF-019 against iAPLNR and aAPLNR. ∆G values are presented as mean ± standard deviation.
| Protein | Ligand | ∆G | Residue Interaction |
|---|
| Active APLNR | EC | −8.2 ± 0.005 | Trp85, Ile109, Tyr182, Pro292 |
| CMF-019 | −9 ± 0.276 | Trp85, Tyr88, Ile109, Arg168, Met183, Tyr264, Phe291 |
| Inactive APLNR | EC | −7.3 ± 0.028 | Pro292, Tyr299 |
| CMF-019 | −8.1 ± 0.315 | Trp85, Ile109, Arg168, Tyr271, Met288, Phe291 |
Table 5.
Distances in Å (Armstrong) between the TM5 Y221 residue and the TM7 Y309 residue throughout all the aAPLNR complex MD simulations. ns = nanoseconds; O = oxygen acceptor; H = hydrogen donor.
Table 5.
Distances in Å (Armstrong) between the TM5 Y221 residue and the TM7 Y309 residue throughout all the aAPLNR complex MD simulations. ns = nanoseconds; O = oxygen acceptor; H = hydrogen donor.
| | EC | CMF |
|---|
| Trajectory | Tyr309O-HTyr221 | Tyr221O-HTyr309 | Tyr309O-HTyr221 | Tyr221O-HTyr309 |
|---|
| 10 ns | 3.04 | 2.22 | 4.15 | 3.96 |
| 20 ns | 3.41 | 2.31 | 3.85 | 3.57 |
| 30 ns | 3.08 | 2.11 | 3.42 | 3.38 |
| 40 ns | 4.25 | 3.41 | 4.66 | 3.99 |
| 50 ns | 2.7 | 2.94 | 4.85 | 4.06 |
| 60 ns | 2.18 | 2.8 | 5.52 | 4.68 |
| 70 ns | 2.15 | 3.07 | 10.31 | 11.13 |
| 80 ns | 3.49 | 4.34 | 6.42 | 5.72 |
| 90 ns | 3.3 | 3.29 | 9.31 | 9.95 |
| 100 ns | 2.12 | 2.92 | 8.67 | 9.82 |
Table 6.
Summarized data from the MM/GBSA method. vdW: van der Waals; elect: electrostatic; solv: solvent.
Table 6.
Summarized data from the MM/GBSA method. vdW: van der Waals; elect: electrostatic; solv: solvent.
| Protein | Ligand | Calculated Free Energy of Decomposition (kcal/mol) |
|---|
| ∆G Binding | ∆E vdW | ∆E Elect | ∆G Gas | ∆G Solv |
|---|
| Active APLNR | EC | −11.61 ± 0.71 | −19.41 ± 0.75 | −9.35 ± 1.59 | −28.76 ± 1.92 | 17.15 ± 1.50 |
| CMF | −32.25 ± 0.83 | −46.50 ± 0.85 | −27.89 ± 1.84 | −74.38 ± 2.24 | 42.14 ± 1.81 |
| Inactive APLNR | EC | −22.59 ± 0.76 | −31.47 ± 0.57 | −39.02 ± 2.55 | −70.49 ± 2.55 | 47.15 ± 2.06 |
| CMF | −31.50 ± 1.11 | −43.08 ± 0.64 | −13.69 ± 2.28 | −56.77 ± 244 | 25.27 ± 1.56 |
Table 7.
Ligand and residue energetical contribution to global free binding energy calculated by MM/GBSA decomposition.
Table 7.
Ligand and residue energetical contribution to global free binding energy calculated by MM/GBSA decomposition.
| Receptor | Ligand | Residue | ∆G Binding | Std. Err. |
|---|
| Active APLNR | EC | ILE 8 | −0.0746 | 0.0199 |
| TYR 12 | −0.0143 | 0.0091 |
| PHE 55 | −0.0029 | 0.0043 |
| LEU 59 | −0.0143 | 0.0050 |
| TRP 62 | −0.2029 | 0.0805 |
| TYR 65 | −0.3447 | 0.1151 |
| THE 66 | −0.2534 | 0.0692 |
| ASP 69 | −0.0297 | 0.0514 |
| TYR 70 | −0.3177 | 0.0821 |
| SER 83 | −0.0045 | 0.0053 |
| ILE 86 | −0.0318 | 0.0213 |
| PHE 87 | −0.0024 | 0.0034 |
| ARG 145 | −0.0685 | 0.0400 |
| CYS 158 | −0.3188 | 0.0918 |
| TYR 159 | −0.2368 | 0.0779 |
| MET 262 | −0.6250 | 0.1350 |
| PHE 265 | −0.2304 | 0.0678 |
| PRO 266 | −0.1681 | 0.0603 |
| THR 269 | −0.0327 | 0.0183 |
| TYR 273 | 0.0056 | 0.0020 |
| EC | −4.6858 | 0.3731 |
| CMF | ILE 8 | −0.0144 | 0.0037 |
| TYR 12 | 0.0815 | 0.0190 |
| LEU 59 | −0.0177 | 0.0148 |
| TRP 62 | −0.6329 | 0.1180 |
| TYR 65 | −0.2503 | 0.0843 |
| THR 66 | −0.0272 | 0.0273 |
| ASP 69 | 0.0094 | 0.0062 |
| TYR 70 | −0.2867 | 0.0614 |
| ILE 86 | −0.4727 | 0.0809 |
| PHE 87 | −0.2232 | 0.0742 |
| ARG 145 | −0.7602 | 0.1734 |
| CYS 158 | −0.3870 | 0.0974 |
| TYR 159 | −0.6344 | 0.1119 |
| MET 160 | −0.1602 | 0.0540 |
| TYR 240 | −0.3717 | 0.0971 |
| LYS 243 | −1.4040 | 0.1433 |
| TYR 246 | −1.7127 | 0.1099 |
| LEU 261 | −0.8716 | 0.0898 |
| MET 262 | −1.5429 | 0.0996 |
| ASN 263 | 0.0067 | 0.0056 |
| PHE 265 | −2.0900 | 0.1014 |
| PRO 266 | 0.0297 | 0.0364 |
| THR 269 | −0.1933 | 0.0418 |
| CMF | −17.9118 | 0.4758 |
| Inactive APLNR | EC | ILE 14 | −0.0112 | 0.0054 |
| TYR 18 | 0.0087 | 0.0078 |
| TRP 68 | −0.0609 | 0.0573 |
| TYR 71 | −0.0291 | 0.0292 |
| THR 72 | −0.0155 | 0.0151 |
| TYR 76 | −0.1145 | 0.0398 |
| SER 89 | −0.0038 | 0.0017 |
| ILE 92 | −0.0270 | 0.0132 |
| PHE 93 | −0.0593 | 0.0196 |
| ARG 151 | 0.0188 | 0.0218 |
| LEU 270 | −0.2012 | 0.0304 |
| MET 271 | −2.6193 | 0.1652 |
| ASN 272 | −0.0825 | 0.0170 |
| PHE 274 | −1.3984 | 0.0695 |
| PRO 275 | −0.3658 | 0.0470 |
| THR 278 | −0.0826 | 0.0428 |
| TYR 282 | −0.0362 | 0.0480 |
| EC 316 | −10.7886 | 0.4734 |
| CMF | ILE 14 | −0.0770 | 0.0092 |
| TYR 18 | 0.1837 | 0.1171 |
| TRP 68 | −2.1810 | 0.2573 |
| TYR 71 | −1.4010 | 0.3388 |
| THR 72 | −0.1017 | 0.0404 |
| TYR 76 | −1.1871 | 0.1812 |
| SER 88 | −0.1652 | 0.0353 |
| SER 89 | −0.4662 | 0.1090 |
| TYR 90 | −0.0075 | 0.0091 |
| ILE 92 | −0.9967 | 0.1781 |
| PHE 93 | −0.2054 | 0.0779 |
| VAL 147 | −0.0611 | 0.0122 |
| ARG 151 | −0.8365 | 0.4741 |
| CYS 164 | −0.6322 | 0.1208 |
| TYR 165 | −0.2165 | 0.0673 |
| MET 166 | −0.0406 | 0.0267 |
| TYR 168 | 0.0008 | 0.0158 |
| GLU 181 | 0.4742 | 0.0621 |
| GLY 185 | −0.0146 | 0.0146 |
| TYR 247 | −0.0855 | 0.0354 |
| VAL 250 | −0.0690 | 0.0356 |
| LYS 251 | 0.0795 | 0.1024 |
| TYR 254 | −0.3275 | 0.1917 |
| MET 255 | −0.0609 | 0.0648 |
| LEU 270 | −0.2245 | 0.1747 |
| MET 271 | −0.6861 | 0.1217 |
| ILE 273 | −0.0747 | 0.0065 |
| PHE 274 | −1.3556 | 0.2144 |
| PRO 275 | −1.2212 | 0.0936 |
| THR 278 | −0.9633 | 0.1438 |
| TYR 282 | −0.0507 | 0.1013 |
| CMF | −16.2988 | 0.8901 |


 ,
, 


